 Tabish A. Syed1,2
 Mohammed Youssef3,4Alexandra L. Schober1Yoshiyuki Kubota3,5,6
 Keith K. Murai1*
 Christopher K. Salmon1,2*
- 1Centre for Research in Neuroscience, Department of Neurology and Neurosurgery, Brain Repair and Integrative Neuroscience Program, The Research Institute of the McGill University Health Centre, Montreal General Hospital, Montreal, QC, Canada
- 2Centre for Intelligent Machines, School of Computer Science, McGill University, Montreal, QC, Canada
- 3Section of Electron Microscopy, Supportive Center for Brain Research, National Institute for Physiological Sciences (NIPS), Okazaki, Japan
- 4Department of Animal Physiology, Faculty of Veterinary Medicine, South Valley University, Qena, Egypt
- 5Support Unit for Electron Microscopy Techniques, Research Resources Division, RIKEN Center for Brain Science, Wako, Japan
- 6Department of Physiological Sciences, The Graduate University for Advanced Studies (SOKENDAI), Okazaki, Japan
The study of the geometric organization of biological tissues has a rich history in the literature. However, the geometry and architecture of individual cells within tissues has traditionally relied upon manual or indirect measures of shape. Such rudimentary measures are largely a result of challenges associated with acquiring high resolution images of cells and cellular components, as well as a lack of computational approaches to analyze large volumes of high-resolution data. This is especially true with brain tissue, which is composed of a complex array of cells. Here we review computational tools that have been applied to unravel the cellular nanoarchitecture of astrocytes, a type of brain cell that is increasingly being shown to be essential for brain function. Astrocytes are among the most structurally complex and functionally diverse cells in the mammalian body and are essential partner cells of neurons. Light microscopy does not allow adequate resolution of astrocyte morphology, however, large-scale serial electron microscopy data, which provides nanometer resolution 3D models, is enabling the visualization of the fine, convoluted structure of astrocytes. Application of computer vision methods to the resulting nanoscale 3D models is helping reveal the geometry and organizing principles of astrocytes, but a complete understanding of astrocyte structure and its functional implications will require further adaptation of existing computational tools, as well as development of new approaches.
1 Introduction
The study of the geometric organization of biological tissue has a rich history in the literature (Thompson, 1917; Blum, 1973; Neville, 1993). The organization of cells into tissues and organs has often been described qualitatively and with visual illustrations. However, advances in imaging technology coupled with modern computer vision (CV) techniques have progressively allowed speculation on structure-function relationships in biology and medicine to be formalized quantitatively. CV is pivotal in investigating biology and physiology over a wide range of spatial resolutions, from tracking eye and animal movements in behavioral studies (Naik et al., 2023), to modelling organ structure and function in CT and fMRI studies (de Belen et al., 2020), to analyzing the structure of cells and proteins at the microscopic (Dileep et al., 2023) and angstrom levels (Punjani et al., 2017). Integrating structural information across these levels of spatial resolution will continue to drive our understanding of biological structure and physiology. Importantly, quantitative tools for understanding tissue and cell morphology will ultimately allow for better understanding of disease. For example, in the heart, the cellular organization and overall shape of the organ changes in diseases such as dilated cardiomyopathy or myocardial infarction to different degrees (Chen et al., 2003; von Deuster et al., 2016). Similarly, the cellular structure of astrocytes, a specialized cell-type in the brain, which we focus on here, drastically changes in conditions such as Alzheimer’s disease and stroke (Acosta et al., 2017).
1.1 Applying computer vision methods to study astrocyte nanostructure
Neurons are the primary cells responsible for transmitting information in nervous systems, and they undergo the plastic processes thought to lead to memory formation and learning. As such, both inside and outside the neuroscience community, neurons are generally imagined to be solely responsible for brain function while other cell types in the brain are often ignored. This neurocentric view has also permeated computer science; artificial neural networks are based on neuronal form and function. However, neurons have essential partner cells, called astrocytes, which are necessary for normal brain function and health. While astrocytes were originally thought to be the “glue” that held neurons together, in the past three decades it has become clear that astrocytes are active participants in brain function. Astrocytes control energy supply to the brain, regulate the ions and neurotransmitters required for information flow, direct neural circuit development, and couple the circulatory system to the brain (Khakh and Deneen, 2019). Astrocytes thus play vital roles in behaviors including respiration, olfaction, food intake, vision and sleep (Petzold et al., 2008; Halassa et al., 2009; Kim et al., 2014; García-Cáceres et al., 2016; Brancaccio et al., 2017). Astrocytes are also intimately involved in learning and memory (Henneberger et al., 2010; Adamsky et al., 2018). Evidence from the mouse visual system also suggests that astrocytes play a direct role in information processing (Curreli et al., 2022). Incorporating astrocytes into models of neural computation may thus be a critical component missing in understanding biological intelligence (De Pittà and Berry, 2019; Murphy-Royal et al., 2023). A number of studies incorporating astrocytes into artificial neural networks have shown promise (Ivanov and Michmizos, 2021; Polykretis and Michmizos, 2022; Kozachkov et al., 2023), suggesting that “artificial astrocytes” may prove to be key in building networks capable of generalization.
Astrocytes are an interesting case study in CV for two reasons. Firstly, their structure-function relationships have yet to be fully elucidated, and thus analysis of their geometry, shape, and the principles by which their structure is organized will lead to new theories of how they participate in brain function. Secondly, due to their morphological complexity, astrocytes push the limits of microscopy and CV algorithms. Innovative CV approaches are therefore necessary to understand their shape and function.
1.2 The problem of astrocytic form
A common adage in neurobiology is that “function follows form” (Marín and Gleeson, 2011). The branching patterns of neuronal axons and dendrites, as well as the macroscopic connections between brain regions, must be precisely structured to allow for healthy brain function. The adage also applies to astrocytes, however, as mentioned, astrocytic form has yet to be fully elucidated. Astrocytes are essentially space-filling cells. They tile, or tessellate, virtually the entire brain without invading each other’s territories (Figures 1A,B). They can be approximated as occupying a roughly spherical polyhedral territory, with a diameter of ~60 micrometers (μm) in rodents, where they have predominantly been studied (Figures 1C,D) (Bushong et al., 2002; Grosche et al., 2013). Within that volume, astrocytes densely fill the space between neurons (Figure 1D), intimately contacting neural circuitry and the blood vessels that they regulate. Their space-filling form means that astrocytes have a convoluted and complex morphology. Their finest branches are extremely thin, on the order of tens of nanometers, falling well below the resolution limit of standard light microscopes (Kosaka and Hama, 1986; Ventura and Harris, 1999; Hama et al., 2004; Khakh and Deneen, 2019) Such fine 3D anatomy has hampered investigation of astrocytic form. However, several recent studies have used volume electron microscopy (vEM) to image and reconstruct astrocytes at the nanoscale (Mathiisen et al., 2010; Patrushev et al., 2013; Medvedev et al., 2014; Gavrilov et al., 2018; Calì et al., 2019a; Aten et al., 2022; Salmon et al., 2023; Villanueva et al., 2023). These studies bring to light a variety of challenges in mapping and understanding the structure and function of astrocytes which will require further development of CV tools. Here we highlight key gaps in our current ability to automatically segment, map, and ascribe functional significance to astrocytic form. Given the fledgling nature of the toolbox for parsing astrocyte nanoarchitecture, we keep an eye to the future, focussing on areas where CV methods can be applied and extended to help elucidate astrocytic nanoarchitecture and structure-function relationships. We aim to provide not just a review of the literature, but also a roadmap, for both computer scientists and biologists, as to where novel contributions from the CV community are most needed.
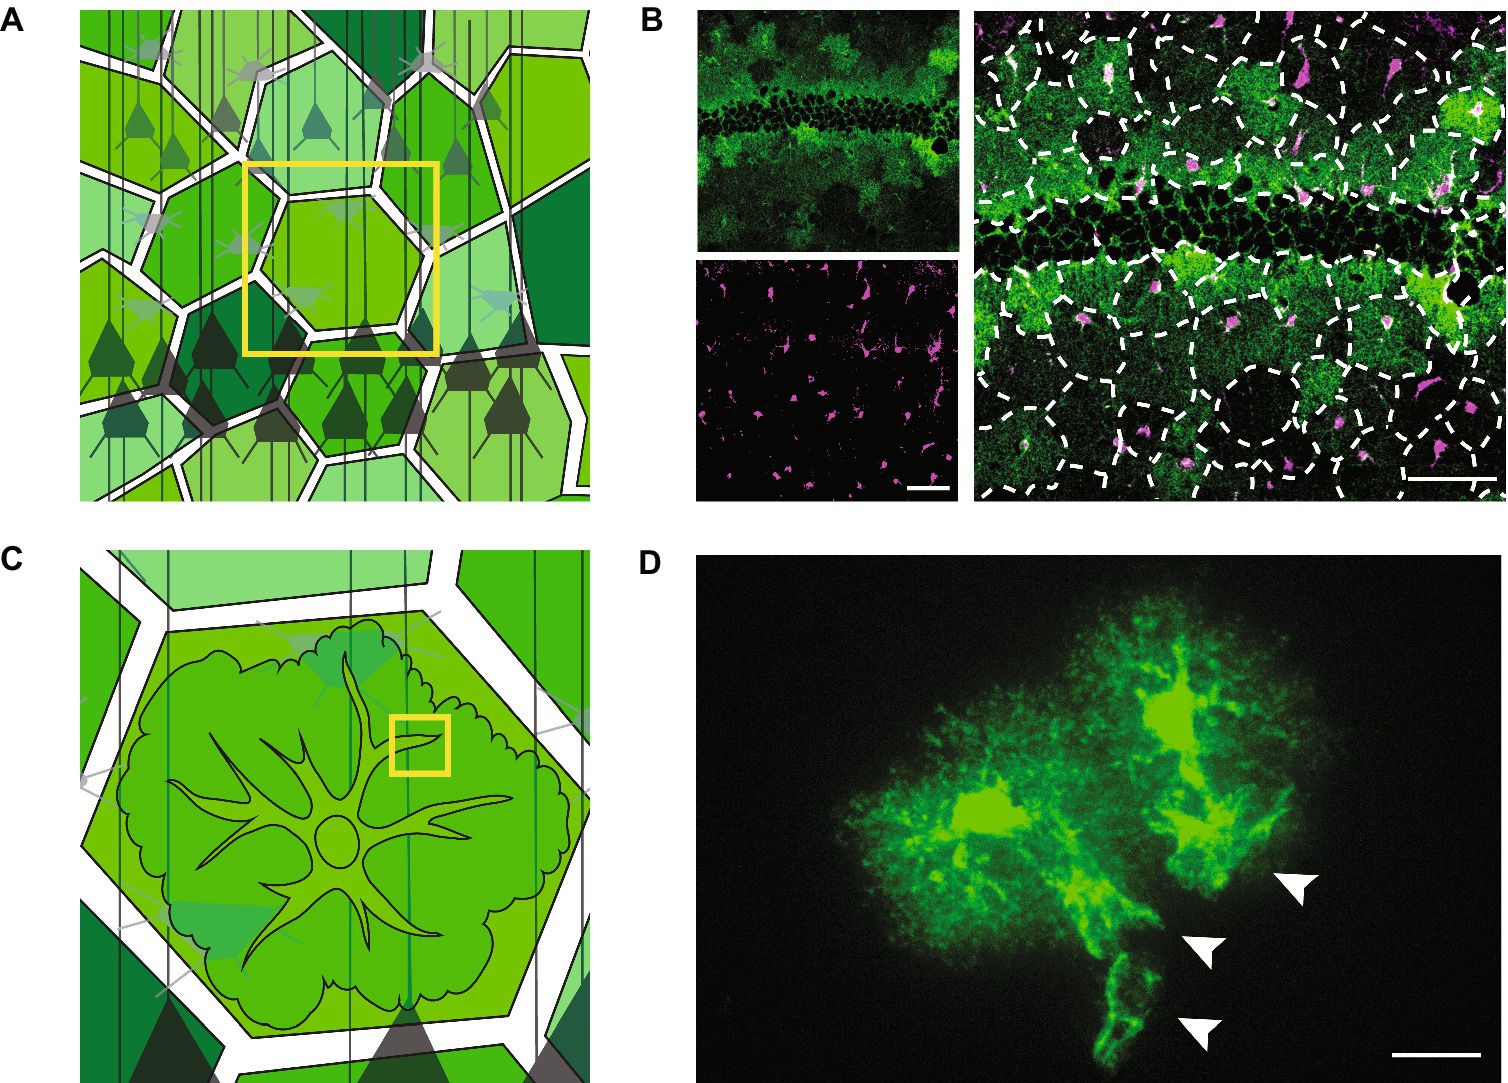
Figure 1. Tissue- and cellular-level structure of astrocytes. Schematics (left) and light microscopy images (right) showing astrocytes at the mesoscale (A,B) and the microscale (C,D). (A) Schematic showing astrocytes tiling across neural space (shades of green) and surrounding neurons (shades of gray). (B) Astrocytes in the mouse hippocampus. Astrocytes have the feature of expressing some molecular markers at different levels from their neighbors. These markers can thus be used to see rough contours of astrocytes in an otherwise uniform field. Here, the potassium channel, Kir4.1 (green), is expressed at variable levels (top left). Astrocyte cell bodies are shown in magenta (bottom left). The overlay of the green and magenta channels (enlarged, right) is superimposed with dotted lines showing the rough boundaries of individual astrocytes, demonstrating their tessellation of the brain. Neurons are left unstained in these images and are therefore not visible. Negative space at centre of green image is the outline of densely packed neuronal cell bodies in the stratum pyramidale of the mouse hippocampus. Scale bars, 50 μm. (C) Schematic of a zoom (from yellow box in A) on an individual astrocyte. Neurons in gray. (D) Two neighboring astrocytes in the mouse sensory cortex experimentally labelled with green fluorescent protein. Cell bodies and primary branches can be seen in solid green, while the ill-defined nanoscopic branches appear as a cloud more peripherally. White arrowheads indicate the sheet-like structures of astrocytic perivascular endfeet that wrap around unlabelled blood vessels. Scale bar, 20 μm.
2 Segmentation and reconstruction of astrocytic nanostructure
Understanding the structure of nervous systems requires investigation at the nanoscale. To capture 3D structure of brain cells at the nanoscale, serial section EM (ssEM), a form of vEM whereby individual slices (sections) are cut from a tissue sample and imaged in sequence, is generally required (Figures 2A–F). ssEM can be done in two modalities: (1) by cutting and collecting serial sections and then imaging them (Spacek, 1985; Hayworth et al., 2015), or (2) by repeatedly imaging the surface of a block of tissue (the blockface), as sections are removed and discarded (Figures 2E,F). This latter modality can be done using serial blockface EM (SBEM) (Denk and Horstmann, 2004) or focussed-ion beam scanning EM (FIB-SEM; Figure 2E) (Knott et al., 2008).
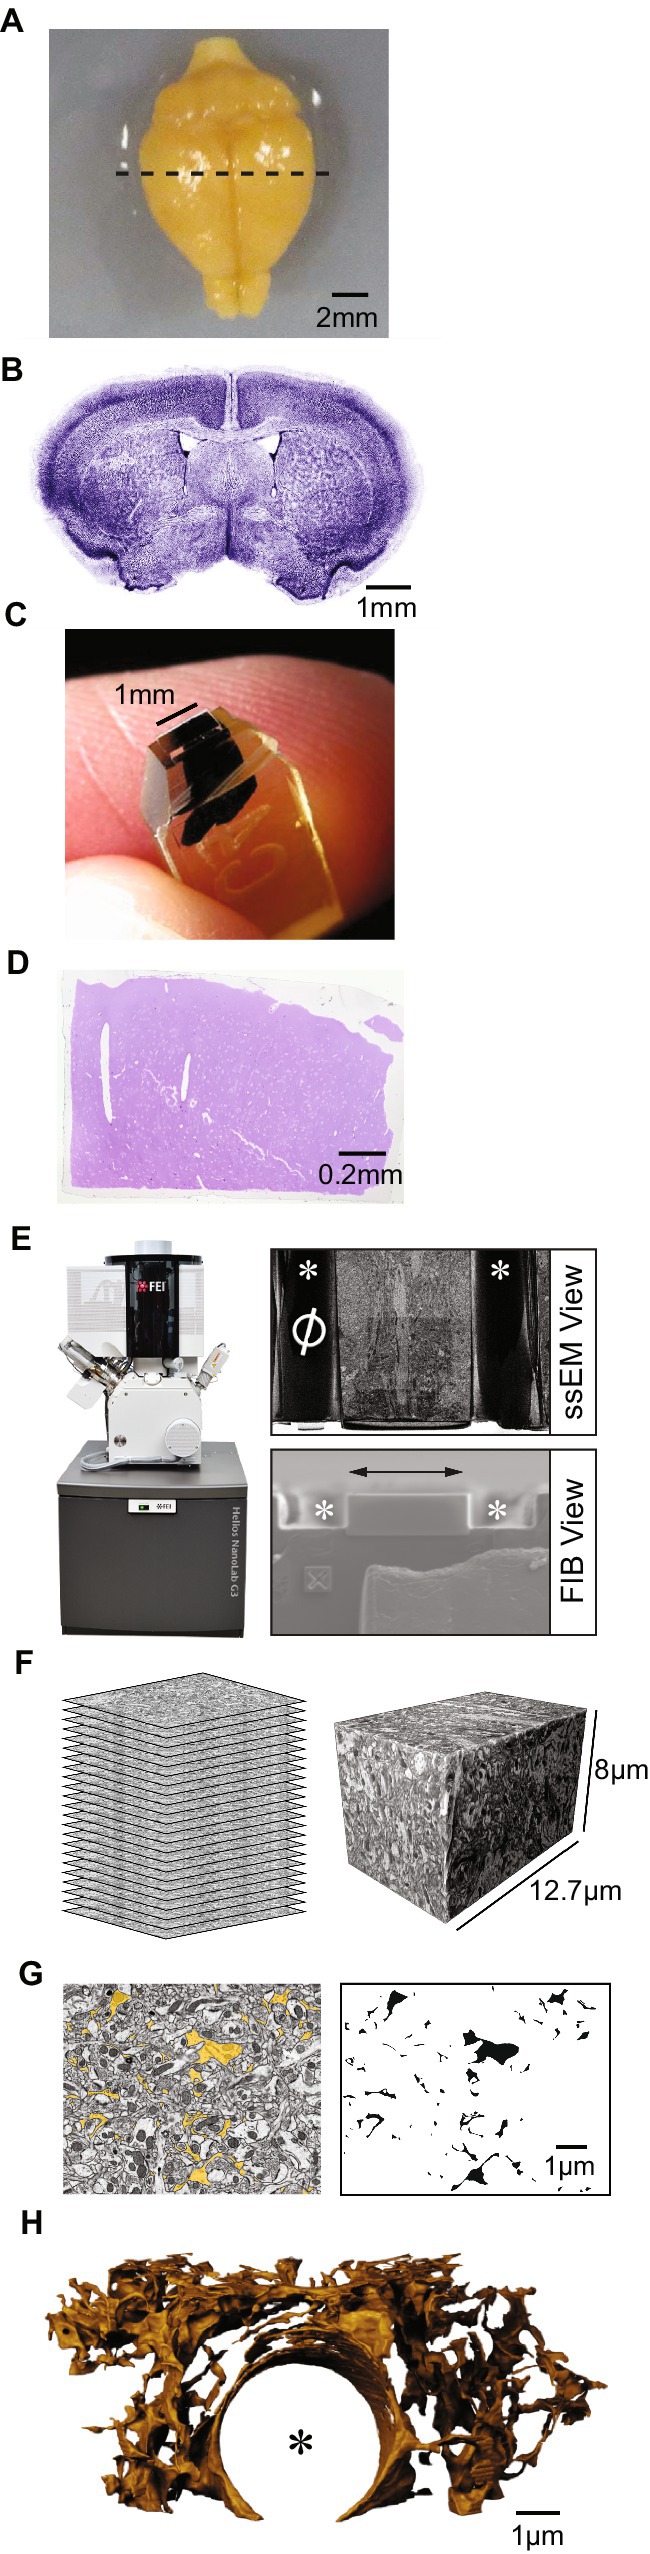
Figure 2. Workflow for producing nanoscale models of astrocytes from ssEM data. (A) A top down (dorsal) view of a mouse brain after chemical fixation and extraction from the cranium. The bottom of the frame corresponds to front or rostral aspect of the brain. Dotted line indicates approximately where the brain slice in B was taken. (B) A coronal section of mouse brain. The cutting plane to produce this slice is orthogonal to the plane of the image in A, with the cut made along the dotted line in A. Blue pseudocolor is a combined labeling of cell nucleii (TO-PRO-3) and Layer 5 pyramidal neurons. (C) A micro-dissected piece of a coronal mouse brain slice, prepared for ssEM imaging. The tissue is embedded in an epoxy resin and is stained black with heavy metal contrast agents. (D) A thin section of a piece of mouse cerebral cortex, in coronal orientation, taken from the blockface of epoxy-embedded tissue similar to that presented in C. Stained with Toluidine Blue dye for examination with a light microscope. (E) Left, Focussed Ion Beam Scanning Electron Microscope (Helios Nanolab C3, FEI, Oregon). Right, View of the blockface of a sample of mouse cerebral cortex seen by the electron beam (ssEM view, top) and focussed ion beam (FIB view, bottom), of a FIBSEM. Naught symbol (left, ssEM view) and “X” symbol (lower left, FIB view), are fiducial markers for alignment of serial imaging. White asterisks indicate trenches that are milled on either side of the blockface to collect debris from ion beam milling during imaging. Double-ended arrow indicates the path along which the ion beam sweeps to remove material from the blockface. The slightly darker region at the centre of the ssEM view is the image acquisition region. (F) Schematic representation of serial EM images (left), a reconstructed tissue volume obtained by aligning and interpolating between serial images (right). (G) Single plane of ssEM dataset with astrocyte segmented in yellow (left). At right, the same segmentation mask is presented in monochrome, omitting raw EM data. All black labels are from a single connected component representing a single piece of astrocyte. (H) A 3D blender model of a piece of astrocyte obtained after segmenting contiguous astrocytic compartments in a FIBSEM dataset measuring ~8 μm × 12.7 μm × 6 μm, with a pixel size of 4 nm × 4 nm × 8 nm. An asterisk marks where the centre of a blood vessel would lie, surrounded by astrocytic perivascular endfeet. (A,C) Adapted from Kasthuri et al. (2015). (E) Adapted from Salmon et al. (2023).
2.1 Automated segmentation in the brain
Following acquisition of image series, structural modelling of nanoscale cellular features from ssEM requires extensive image segmentation (Figure 2G), which has been and remains the central bottleneck in studying cellular nanostructure (Lee et al., 2019). As a result, early efforts in ssEM imaging, which involved collecting serial sections by hand after cutting with diamond blades, resulted in only small portions of brain cells, primarily neurons and astrocytes, being reconstructed. 3D modelling in these early studies was initially performed by hand (White and Rock, 1980), camera lucida techniques (DeFelipe et al., 1986), and with early film digitization and computer graphics approaches (Stevens and Trogadis, 1984). 3D models were sometimes constructed with wood (White and Rock, 1980) or molded plastic (Spacek and Lieberman, 1974). Subsequently, a number of proprietary and community-built software packages such as Reconstruct (Fiala, 2005), IMOD (Kremer et al., 1996), TrakEM2 (Cardona et al., 2012), VAST (Berger et al., 2018) and a variety of Blender tools (Jorstad et al., 2014) allowed for reconstruction of larger pieces of brain cells (Figure 2H). Such programs enable manual segmentation, storage of segments in hierarchies and families, and semi-automated segmentation with fast-marching tools (Kremer et al., 1996; Cardona et al., 2012). However, these early attempts at automation did not significantly speed the process of segmentation, which remained in large part manual (Kreshuk et al., 2011; Meijering et al., 2016). Now, despite advances in automated segmentation, significant manual corrections are still required, and so state of the art vEM software like CATMAID (Saalfeld, 2019), webKnossos (Boergens et al., 2017), and FlyWire (Dorkenwald et al., 2022) is still used for manual segmentation.
Modern automated ssEM (Denk and Horstmann, 2004; Knott et al., 2008; Hayworth et al., 2015) allowed for longer series of EM images to be collected, making it feasible to reconstruct models of whole cells (Briggman and Denk, 2006). This approach, applied to mapping wiring diagrams of neural circuits and whole brains, is often referred to as cellular “connectomics” (Helmstaedter, 2013), hereafter, simply connectomics. With the arrival of these large datasets, efforts began to automatically segment ssEM image stacks (Jain et al., 2007; Turaga et al., 2010). Major advances have been made, with convolutional neural networks (CNNs) forming the backbone methodology of the field. Several reviews detail the history and state of the art in segmentation of neurons for connectomic reconstructions (Lee et al., 2019; Motta et al., 2019; Urakubo et al., 2019; Aswath et al., 2022). Rather than replicate those, we focus specifically on challenges for segmenting astrocytes.
2.2 Unique challenges of astrocytic ultrastructure
At the micrometer scale, neurons are clearly dendritic in structure, with relatively sparse branches resembling those of a branch-system of a tree (Figure 1A, in gray). Astrocytes, on the other hand, when examined at the micrometer scale, are poorly defined, resembling a dense bramble, bush, or cloudy structure (Figures 1B,D). This difference in structure is likely explained in part by the fact that, during the development of an animal’s brain, neurons are born and take up residence before astrocytes, and astrocytes fill the spaces left by neurons, squeezing between pre-existing structures. As a result, astrocytes have significantly thinner branch diameter than neurons on average (Salmon et al., 2023). These extremely thin and irregular branches are difficult to trace through the dense visual space of raw ssEM data. This is further complicated by the resolution of large ssEM datasets. While typical EM provides nanometer resolution in the X and Y dimensions, acquiring the large datasets needed for whole-cell reconstructions requires compromise. Either z-resolution is set relatively low (30–70 nm) to capture more tissue (Calì et al., 2019a; Aten et al., 2022), or serial blockface EM techniques are used, which facilitate automated tissue collection and alignment of 3D stacks, but compromise on x-y resolution due to the imaging modality, which uses backscattered electrons for imaging (Briggman et al., 2011; Korogod et al., 2015). In either case, the thinnest regions of astrocytic branches (~30 nm) become difficult to discern (Salmon et al., 2023), creating challenges for manual and automated segmentation alike.
Plaza (2016) notes that, for neuronal connectomics, “perfect reconstruction is seemingly unnecessary and also generally untenable due to image ambiguity.” However, high quality reconstruction is more important for astrocytes. While the main question for neurons is the arrangement of their branches and connections into neural circuits, paying close attention to the shape, in particular local width and volume, of astrocyte sub-compartments is important for understanding their function (Covelo et al., 2022). To support and regulate brain function, astrocytes actively remove neurotransmitters from the synaptic space to end neurotransmission. Astrocytes also control the concentration of ions surrounding synapses and neurons, which changes how easily and how much neurotransmitter is released by neurons. Effectively, both of these functions rely on the capacity of astrocytes to handle ions, since neurotransmitter uptake relies at least in part on harnessing ionic concentration gradients (Verkhratsky et al., 2019). The volume of astrocytic compartments is therefore an essential consideration, as volume of water in a compartment affects capacity to store ions and neurotransmitters, and volume itself can influence cell surface channels mediating movement of these molecules into and out of astrocytes (Benarroch, 2016). Branch width is also important as very thin connecting parts (“constrictions”) that separate larger-capacity parts (“expansions”) (Figure 3A) likely form barriers to diffusion between compartments (Denizot et al., 2019; Arizono et al., 2020; Denizot et al., 2022; Salmon et al., 2023), potentially biasing astrocytic intracellular signalling toward producing more localized events and toward more local regulation of neural function. Analyzing the fine shape of these sub-compartments is therefore an important aspect of untangling structure-function relationships in astrocytes.
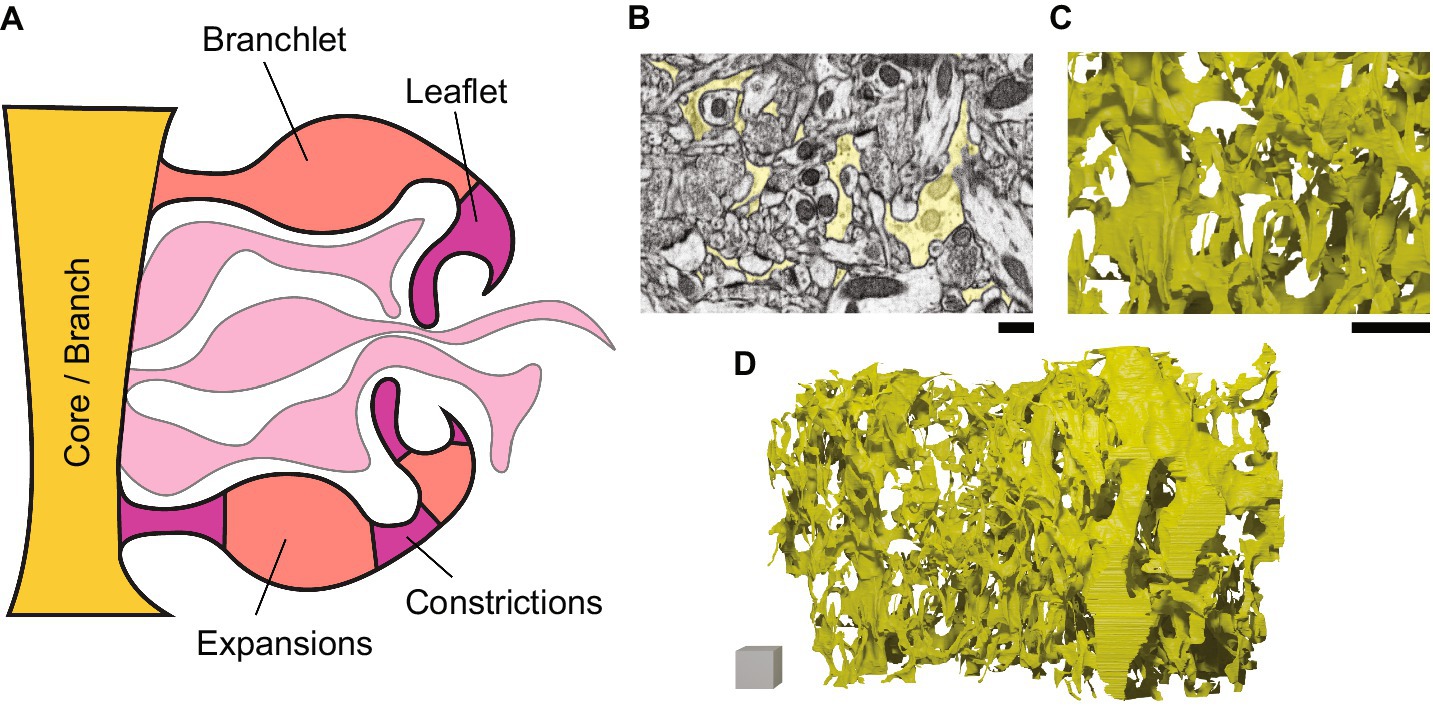
Figure 3. Nanoscale structure of astrocyte branches. Schematic (left) and ssEM-based images and models (right) showing astrocytes at the nanoscale. (A) A schematic of a zoom (from, for example, the yellow box in Figure 1C) on the fine branching structure of an astrocyte. The “branch-branchlet-leaflet” heuristic is shown at the top, while the “core-expansion-constriction” schema is shown at the bottom. (B) Astrocytic segmentation in a single ssEM frame, corresponding to the astrocytic model in C,D. Scale bar, 200 nm. (C) Zoom on a 3D model of the complex mesh of astrocytic branches. Scale bar, 1 μm. (D) A model of a section of astrocyte that accounts for ~1/30th of a whole astrocyte. Scale cube, 1 × 1 × 1μm.
2.3 Segmentation of astrocytes
All studies analyzing large reconstructions of astrocytes have relied almost completely on manual segmentation by teams of annotators (Figures 3B–D) (Mathiisen et al., 2010; Patrushev et al., 2013; Medvedev et al., 2014; Gavrilov et al., 2018; Calì et al., 2019a; Aten et al., 2022; Salmon et al., 2023). While automated segmentation methods for neural ssEM datasets have been used for neuronal reconstructions since at least 2007 (Jain et al., 2007), their utility for investigating astrocyte structure has not been assessed. Indeed, it has been noted that astrocytes are often a source of error in large ssEM reconstructions, and some algorithms for circuit tracing are designed to specifically deal with errors caused by astrocytes (Berger et al., 2018; Januszewski et al., 2018). These errors can be easily found in the large open-access MICrONS data sets (Figures 4A–D), which were automatically segmented with state of the art approaches and are being continuously updated with crowdsourced manual corrections (MICrONS Consortium, 2021; Turner et al., 2022). Interestingly, to our knowledge, no attempts have been made to actively ignore astrocytes in automated segmentation tasks. Therefore, if astrocytes could be specifically segmented, this would not only benefit astrocyte biologists, but could also be used as a preprocessing step to improve neuronal segmentation.
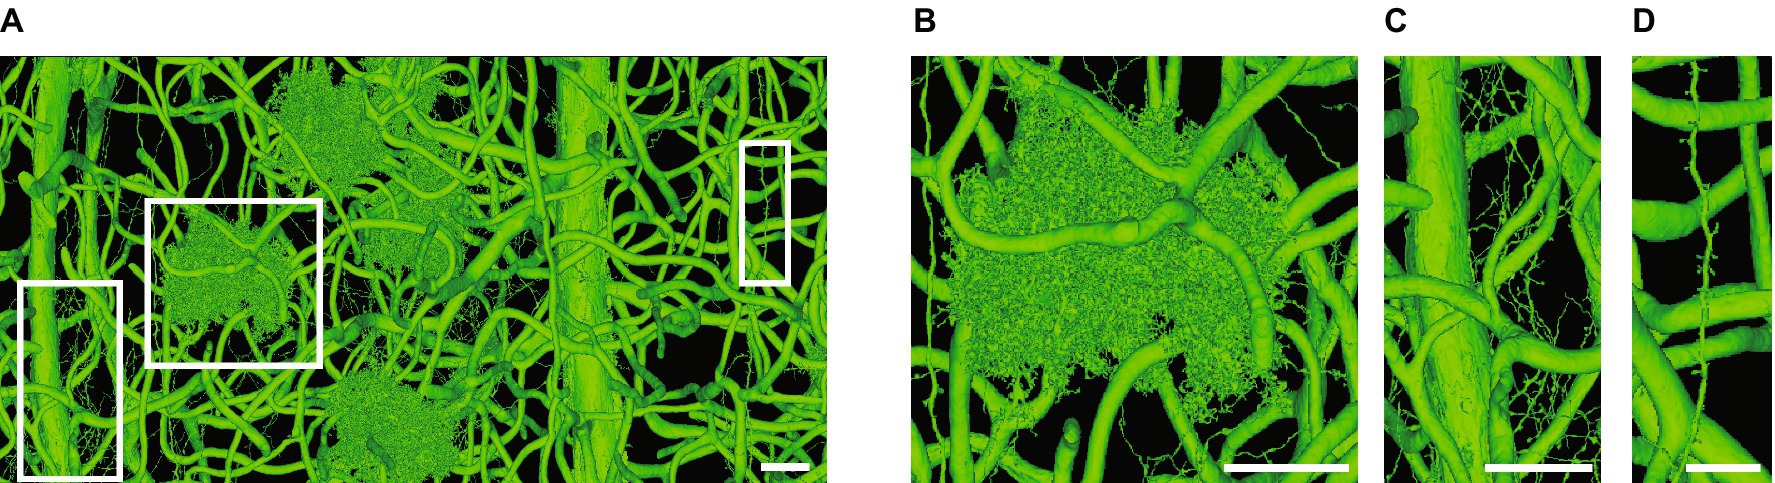
Figure 4. Challenges when automatically segmenting astrocytes. (A) A single automatically segmented mesh in the Cortical MM3, or minnie65_public (v661), MICrONS dataset (MICrONS Consortium, 2021). All objects, which include blood vessels (medium to thick tubes), astrocytes (B), fine axons (C) and a thin dendrite (D) are connected to each other somewhere in the volume, which expands far outside the image boundaries in A. (B–D) Are zooms of regions in white boxes in A. The axons and dendrite depicted in C,D merge with astrocytes outside the image boundaries. The minnie65 dataset can be accessed here, and the specific view presented in A can be accessed (here). Scale bars, 20 μm (A–C), 10 μm (D).
After only a small amount of training, humans can easily recognize astrocytes in the dense EM visual space (Figure 5A). Astrocytes have distinctive dark-staining glycogen granules, and in most EM preparations, astrocytes have clearer cytoplasm than neurons and lighter staining mitochondria (Figures 5B,C) (Spacek, 1985). Importantly, due to their thin branches, despite tiling across the entire brain, astrocytes occupy only a small fraction of total brain volume, on the order of 8% in ssEM data (Kasthuri et al., 2015). This, combined with their identifying features, may aid in targeted segmentation of astrocytes. While very thin branches are likely to present barriers to complete segmentation of astrocytes, probabilistic U-Nets (Kohl et al., 2018), originally developed to account for ambiguities in ground truth segmentation, may be useful to handle difficult-to-segment thin and constricted regions by generating several possible segmentations. The unique morphology and tiling nature of the cells can then be used to generate the most plausible segmentation. The stereotyped, restricted volume within which single astrocytes are contained without overlapping with each other may be useful: disconnected astrocytic segments within a certain distance of an astrocyte cell body are likely to connect with that astrocyte, and anything further away is more likely to connect with another. Taking these features of astrocytes into account may significantly ease agglomeration of oversegmented astrocytes once astrocytic compartments can be automatically recognized.
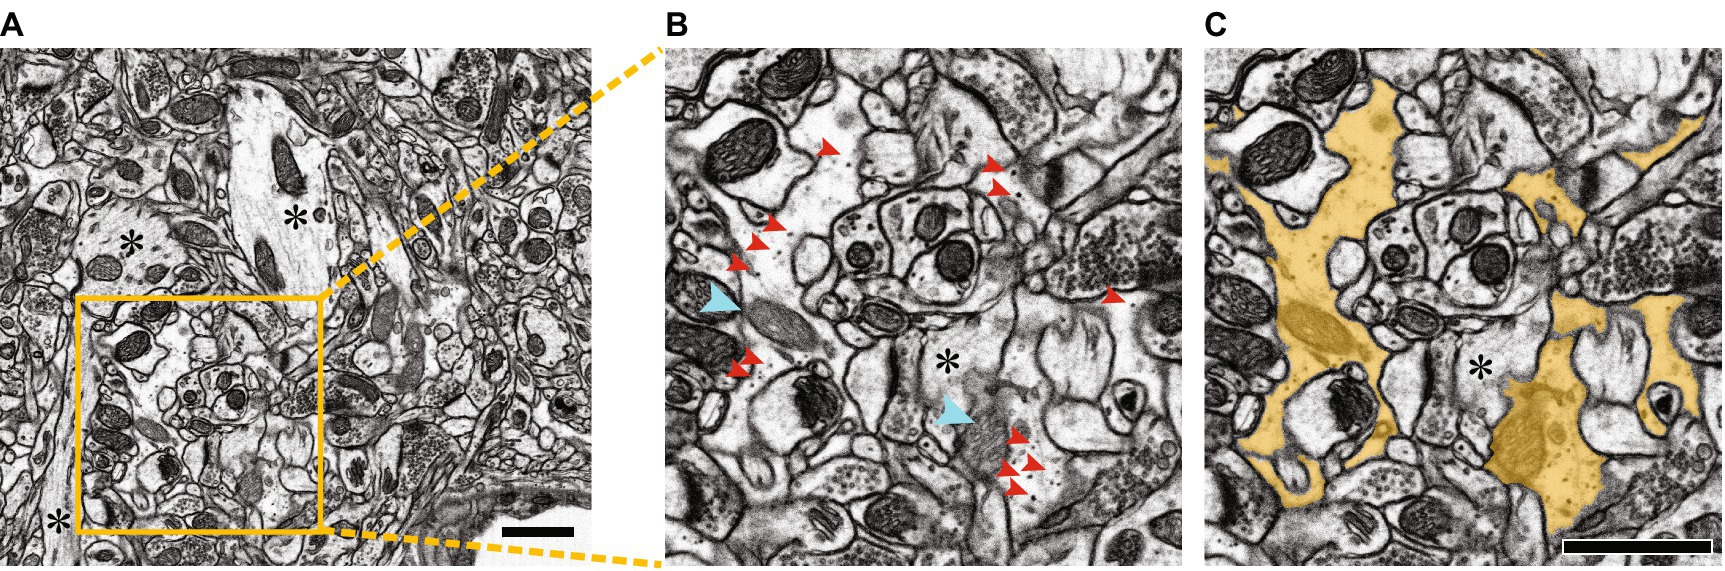
Figure 5. Segmentation of a portion of an astrocyte in dense EM visual space. (A) Raw electron micrograph containing multiple segments of an astrocyte. Scale bar, 1 μm. (B,C) Zoom of yellow box in A, without segmentation (B) and with astrocyte segmented in yellow (C). Dark staining glycogen granules are indicated with red arrowheads, lighter staining mitochondria (compared to neuronal mitochondria) are indicated with cyan arrowheads. Note that astrocytes have clearer cytoplasm, lacking the striations of neuronal components, obvious examples of which are indicated by asterisks in A–C. Scale bars, 1 μm. Figure adapted from Salmon et al. (2023).
2.4 Proofreading
While automated segmentation has progressed rapidly for mapping neural circuits, initial 3D segmentations are still error prone, and thus automated proofreading steps have been incorporated. For example, Zung et al. (2017) used supervised dense multiscale 3D CNNs for neural boundary detection and a separate dense network for error detection and correction. Gonda et al. (2021) exploit neural circuit connectivity for error correction. Rolnick et al. (2017) learn neuron morphology using unsupervised training to guide error detection. Nguyen et al. (2023) use reinforcement learning for merge and split error detection. Others focus on split errors across gaps in imaging of thinner axons using 3D steering (Berman et al., 2022; Schmidt et al., 2024). However, these methods are tailored to morphology of neurons, which is much simpler than that of astrocyte morphology (Figures 6A–C). Approaches focused on the particularities of astrocytic morphology may be required. In astrocytes, both split and merge errors are likely to occur at regions where astrocytic branches are very thin (Salmon et al., 2023). Thus, directing automated proofreading to thinned regions with nearby segments that might have been erroneously split from them, using for instance an error metric based on the thickness of the segmented objects, may be helpful. Merge errors are also likely to cause loops in the topology of astrocytic models, due to astrocytic branches doubling back on themselves and being restricted within a relatively small 3D space. We recently showed that loops and holes are very rare in astrocytic structure. Instead, astrocytic branches tend to loop back on themselves without fusing (Salmon et al., 2023). These so-called “reflexive loops” often correspond to flattened surfaces where two branches are apposed to one another (Aten et al., 2022; Salmon et al., 2023). Erroneous loops tend to occur here, where segmentation errors on individual serial images can fuse with otherwise unconnected, but apposed surfaces. Erroneous loops are also formed where very thin branches touch each other. Thus, directing proofreading to sites along loops that are in the vicinity of flat, apposed surfaces or thin regions would improve proofreading. Additionally, as mentioned above, the space tilling nature of astrocytes, which means that astrocytic branches are confined within an ~30 μm radius of the cell body, could provide an effective signal for both detecting and correcting split and merge errors on branches which, due to merge errors, are longer than expected.
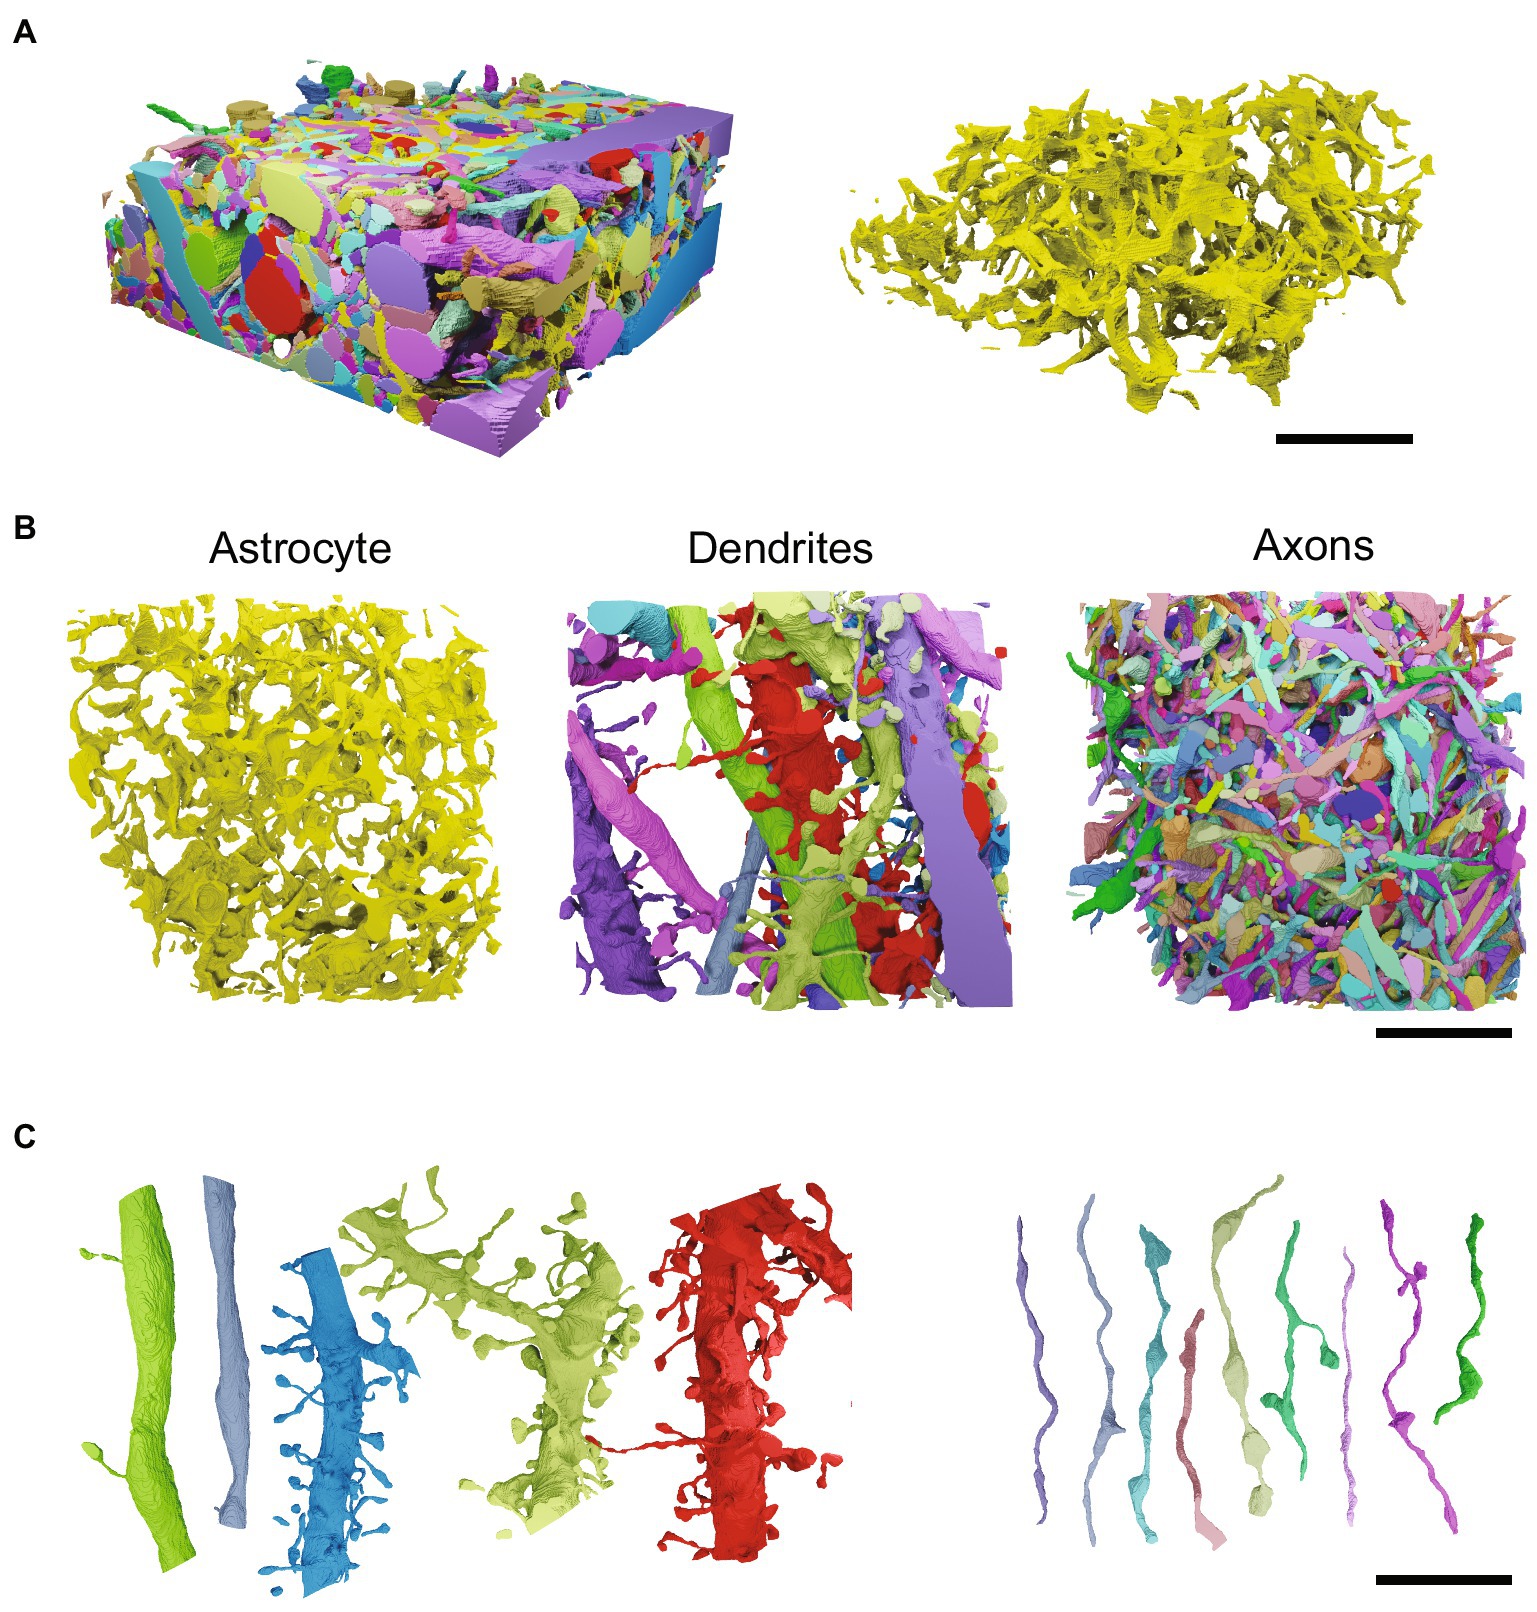
Figure 6. Astrocytic shape and topology are more complex than those of neuronal components. (A) Left, ssEM reconstructions of dendrites, axons and a subsection of a single astrocyte shown in their dense native spatial arrangement in the mouse cerebral cortex. Separate dendrites and axons are shown in different colors. The piece of astrocyte can be seen in yellow amongst the surrounding neuronal components. Right, the segment of astrocyte shown alone in yellow. Scale bar 5 μm. (B) Top-down view of astrocyte, dendrites and axons. Scale bar 5 μm. (C) A subset of the dendrites and axons shown in A,B, arranged to demonstrate their relative simplicity compared to the convoluted nature of astrocytes. Scale bar 5 μm. Segmented ssEM data and meshes were produced from publicly available datasets provided with VAST segmentation software (Berger et al., 2018).
Importantly, methods relying only on split and merge errors are agnostic to precision of segmentation. For example, missing some voxels along the surface of a cell, or labelling extracellular voxels as within a cell (i.e., tracing outside the lines), may not cause any splits or merges in the segmented cell. Split and merge errors can have significant impact in understanding neural circuit connections and topology of astrocytic branching patterns, however, astrocytes may additionally also require accurate membrane segmentation, especially of thin branches due to the functional importance of the width of those branches. Higher weight likely needs to be assigned to accuracy of segmentation, in addition to the split and merge errors, when dealing with astrocytes.
Since astrocytes have been all but ignored in automated segmentation for connectomics, high quality open-source training data for astrocytes is not yet available. Producing training data will require extensive manual proofreading of existing connectomics datasets containing erroneously segmented astrocytes. Guided manual proofreading will speed this effort and will be useful for manual quality control that is still required for all automated segmentation. While specific algorithms for “focused” and “guided” proofreading have been tested for neural segmentation (Plaza, 2016; Haehn et al., 2018; Bishop et al., 2021; Matelsky et al., 2022; Sanchez et al., 2022; Xenes et al., 2022; Celii et al., 2023; Joyce et al., 2023; Troidl et al., 2024), once again, the particularities of astrocyte morphology need to be taken into account. The sites of likely errors outlined above could be used to guide human proofreaders to errors. An additional consideration here is that the basic visual experience of following astrocytic branches through serial images is different from that of neurons. Dendrites and axons are more tubular and directed than the convoluted branches of astrocytes (Figures 6B,C). Capitalizing on this tubularity, some groups have generated interfaces for “flying” through neuronal branches and correcting merge and split errors along the way (Drawitsch et al., 2018; Dorkenwald et al., 2022). This will likely not be optimal for astrocytes, whose branches are much less tubular and more convoluted than those of neurons. Case by case guided proofreading is likely more useful.
As new tools are designed and deployed in formats that allow astrocyte biologists to use them, the resulting reconstructions will provide the raw material for understanding astrocyte structure-function relationships. Astrocyte structure and function are known to vary depending on the microcircuits and brain regions in which they are embedded (Halassa et al., 2007; Endo et al., 2022; Murphy-Royal et al., 2023). Acquiring high quality reconstructions of whole astrocytes from different brain regions, in multiple species, in differing states of health and disease, will help in understanding their functions. To support this endeavour, the community should prioritize sharing segmented astrocyte labels as well as the underlying ssEM image stacks, as is widely done with largescale connectomics datasets (Kasthuri et al., 2015; MICrONS Consortium, 2021; Shapson-Coe et al., 2021; Covelo et al., 2022; Dorkenwald et al., 2023). An astrocyte-tailored database with appropriate metadata would be beneficial for this purpose. Once reconstructions are acquired and made available, however, we must be able to parse their complex structure to probe the principles by which astrocytic structure is organized and how this influences astrocyte function.
3 Analysis of astrocytic shape and nanostructure
Understanding differences between shapes of organs and cells, and modeling the variability both within and across populations, in healthy and disease contexts, has many applications in biology and medicine (Thompson, 1917; Blum, 1973; Grenander and Miller, 1998). Investigations of Alzheimer’s disease (AD) provide a range of examples. At the macro-scale, CV analysis of MRI data has been extensively used for modelling the shape of the hippocampus, a curved brain region of approximately 0.4 cm3 involved in learning and memory (Bouix et al., 2005; McHugh et al., 2007; Brusini et al., 2020). The same approaches are also used to study changes in the size and shape of the hippocampus in conditions such as AD (Shen et al., 2012; Achterberg et al., 2014; Joshi et al., 2016; Sarasua et al., 2022). At the molecular scale, both classical CV (Fukatsu et al., 1988) and CNN-based approaches (Vizcarra et al., 2020) have been used to better understand and detect pathological markers of AD. While dramatic changes can also be observed qualitatively in the nano-scale shape of astrocytes in AD (Bouvier et al., 2016), we lack a full understanding of even healthy astrocyte nanostructure. Shape analysis is therefore needed to understand astrocytes in the context of health and diseases like AD.
3.1 Shape analysis for understanding astrocytic structure
Interpreting the structural complexity of astrocytes requires operating across a range of scales, and this has historically complicated interrogating astrocytic nanostructure. To simplify this complexity, a straightforward heuristic was adopted whereby the astrocytic structure was broken down into the cell body, main branches, thinner branchlets, and the thinnest, terminal leaflets (Figure 3A) (Khakh and Sofroniew, 2015). Interestingly, astrocytes have long been described as “spongiform” or “spongelike,” and so the tree analogy used in this heuristic neglected the notion that astrocytes contain loops and holes, which are features of sponges but not of simple tree-like branching diagrams. We have proposed a quantitative approach to decompose astrocytes into parts by detecting abrupt changes in branch thickness using local width measurements, calculated using radii of inscribed spheres (Salmon et al., 2023). This allowed sections of astrocyte to be broken down into central core regions giving rise to branches of alternating thin constrictions and thicker expansions (Figure 3A). Functionally, alternation of constrictions and expansions may form separate sub-compartments between which diffusion is limited, biasing signalling events in astrocytes toward remaining more local. Theoretical work on molecular dynamics in astrocytes shows that this is likely true for diffusion of calcium (Ca2+), a key intracellular signal that controls many astrocytic functions (Denizot et al., 2022). Quantitative CV-based approaches thus provide details that point to likely functional outcomes of structural specializations.
Importantly, neither the branch-branchlet-leaflet hierarchy, nor the core-expansion-constriction schema fully capture the morphology of astrocytes. A single astrocyte can have morphologically distinct parts such as highly branched regions interspersed by reflexive loops, as well as flat, sheet-like regions with more uniform curvature and a cylindrical geometry at endfeet (Maynard et al., 1957; Mathiisen et al., 2010) or around synapses (Grosche et al., 1999). Additionally, along with undulations in branch width forming constrictions and expansions, the amplitude of that undulation may decrease with distance from the cell body, resulting in progressively smaller constrictions and/or expansions. Further categorizing different parts of an astrocyte is therefore an interesting open problem which could benefit from the rich object part segmentation methods in CV. For example, spectral decomposition methods segment objects into parts using eigenfunctions of the Laplace–Beltrami operator over said objects to analyze their shape (Reuter et al., 2009a,b; Andreux et al., 2015). Essentially, these approaches model heat diffusion across a surface to describe shape, ultimately decomposing irregular objects into clearly recognizable parts. Alternatively, bottom-up hierarchical methods such as co-hierarchical clustering of part types (van Kaick et al., 2013) allow decomposition of complex objects into classes of parts that are similar in shape but dissimilar in size or in their spatial relationships to each other. This approach may allow recognition of constrictions, expansions and sheets that vary in size and location within the astrocyte structure. Adaptation of methods like these for astrocyte morphology would allow for a data driven division of complex astrocytes into constituent parts based solely on their structure without the need for setting thresholds that dictate decomposition as in Salmon et al. (2023).
3.2 Medial representations for parsing astrocytic shape and topology
As a result of the “spongiform” appearance of astrocytes in light microscopy images, it has been unclear for decades whether astrocytes have a tree-like architecture, or a Swiss cheese-like morphology with holes and looping structures (Rusakov, 2015). Medial representations are a group of shape descriptors that exploit local symmetries to simplify complex 3D objects. The resulting skeletal models are ideal for examining object topology.
The most prominent algorithm used for skeletonization of neurons segmented from ssEM data is TEASAR (Tree-structure Extraction Algorithm for Skeletons-Accurate and Robust) (Sato et al., 2000), which has varying implementations in toolboxes such as MeshParty (Dorkenwald, 2023), Skeletor (Schlegel and Kazimiers, 2021), NeuTu (Zhao et al., 2018), Skeletopyze (Funke, 2022), and Skeletonization (Bae, 2023). Although these approaches produce high quality centrelines, they can be slow, in part because they require segmentation masks to be converted to meshes. Silversmith et al. (2022) have recently reported the connectomics toolbox, Igneous, which incorporates a python-based TEASAR implementation (Kimimaro) that circumvents the meshing step, works on subdomains of segmentations to avoid memory issues, and is optimized for cluster computing. However, while TEASAR-based skeletonization works well on “wire-like,” hierarchically branching objects, it is not homotopic—i.e., it does not produce skeletons that accurately maintain the topology of more complex shapes (Figure 7A). The skeleton produced can also vary drastically with object rotation (Supplementary Video S1). Furthermore, the algorithm specifically ignores loops. This is not optimal for 3D models of astrocytes as they are not wire-like and do contain occasional bona fide loops (Figure 7B) and many error-generated looping structures that need to be detected (Salmon et al., 2023). Several other, less well-used, skeletonization approaches are homotopic (Figure 7A) and do not require a meshing step (Malandain et al., 1993; Siddiqi et al., 2002). Homotopic thinning (HT), which gradually thins objects down to a medial representation, was used in two recent studies of astrocyte morphology (Mohammed et al., 2018; Salmon et al., 2023). Average outward flux (AOF)-based methods, which detect medial surfaces by locating singularities in the signed distance function of an object, have also been used (Salmon et al., 2023). We refer to both HT and AOF approaches as “homotopic methods.” Homotopic methods can be implemented efficiently using heaps, with distance-to-boundary as the sorting key, significantly speeding skeletonization. While efficient implementations of both TEASAR and homotopic methods are O(NlogN), where N is the size of the object, TEASAR requires computing Euclidean distance fields multiple times. The homotopic methods use a single Euclidean distance field (Lee et al., 1994; Siddiqi et al., 2002). Further, Mohammed et al. (2018) have developed a parallel HT algorithm, likely providing even greater efficiency.
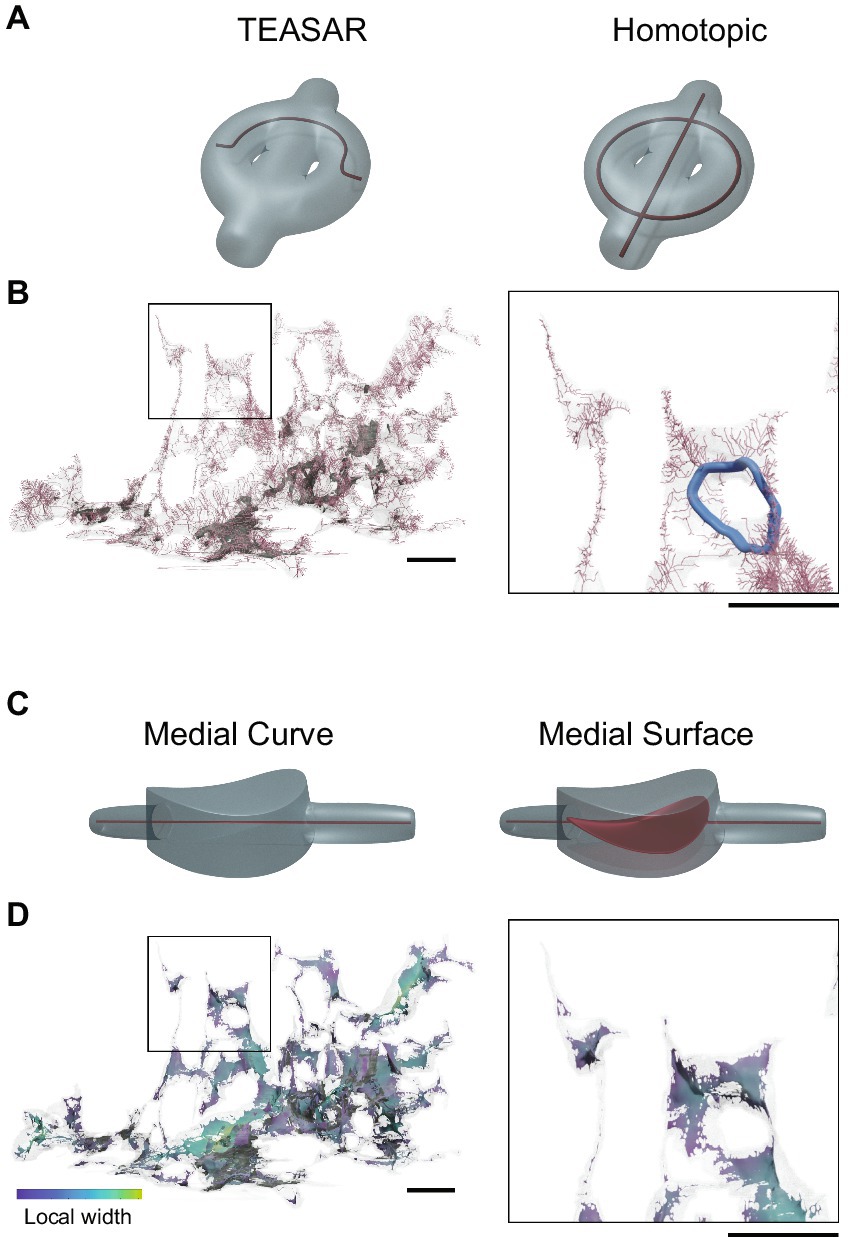
Figure 7. Medial representations of astrocytes. (A) A toy example of an object with multiple holes containing curved as well as rounded regions in translucent gray and corresponding curve skeletons shown using red curves. The left had side shows the skeleton generated using the TEASAR algorithm, whereas the right hand side show the medial curve generated using a homotopic thinning algorithm. Notice that homotopic thinning preserves the topology of the object. (B) A segment of an astrocyte presented as a transparent mesh with its medial curve shown in pink. A rare loop in astrocyte morphology is highlighted in the zoomed box on the right in blue. (C) A toy example of an object with tubular as well as a flat, curved region shown in translucent gray, with the corresponding medial curve (left) and medial surface (right) shown in red. The medial curve does not adequately represent the shape of an object in non-tubular regions. (D) The medial surface representation of the same segment of astrocyte depicted in (A) with colormap indicating the local width of the part. The zoom box at right depicts both tubular as well as non-tubular regions in an astrocyte. Scale bars 1 μm.
Importantly for studies of astrocytes, homotopic methods can generate both medial surfaces and medial curves (Figure 7C). Medial curves, which are classical single pixel-wide skeletons, are ill defined for non-tubular objects, but are nonetheless useful for understanding neuronal as well as astrocytic connectivity and branching. On the other hand, medial surfaces, which provide skeletal representations of general embedded objects in 3D, are useful specifically for astrocytes where morphological properties like branch width and sheet-like structures (see below) are of interest. As whole-cell astrocyte reconstructions become available, homotopic methods will speed analysis and provide accurate and richer skeletal representations.
Reducing astrocytes to homotopic medial representations allows for straightforward extraction of their topological nature (Mohammed et al., 2018; Salmon et al., 2023). Representing the medial curve of subregions of astrocytes as spatial graphs allows for a straightforward search for loops using the spanning tree of the graph (Figure 7B) (Salmon et al., 2023). This showed that astrocytes have a mostly hierarchical structure, in which true loops are rare, as mentioned in the previous section. Astrocytic structural organization with extensive looping structures would likely lead to easier and more extensive diffusion of chemical signals throughout the cell. Instead, again, astrocytic architecture appears to bias these cells toward operating more locally on a subcellular scale.
Some studies have observed that parts of astrocytic branches can be “sheet-like.” This appears to be particularly true for terminal branches of Bergmann glia, the specialized astrocytes of the cerebellum (Grosche et al., 1999). Others have noted that cortical astrocytes can have sheet-like regions wrapping synapses (Khakh and Sofroniew, 2015). And most conspicuously, astrocytic endfeet, which wrap around blood vessels, do so by forming roughly cylindrical sheets (Mathiisen et al., 2010; Salmon et al., 2023). Using medial surfaces and their curvature properties can help define a notion of sheet structure in astrocytic subregions (Figures 7C,D). Discerning where astrocytes are sheet-like vs. tubular will be important for understanding how astrocyte shape affects diffusion of intracellular ions and signalling molecules, as thin sheets have been shown to affect diffusion differently than thin tubules (Kinney et al., 2013; Tønnesen et al., 2023). The structure of medial surfaces is different in flat vs. tubular vs. branching regions (Figures 7C,D), which can be exploited as in Lin et al. (2022) to decompose complex objects into morphologically meaningful elements. Thus, using medial surfaces, one can identify different regions where astrocytes likely deploy sheet-like, tubular, or branching morphology for modulating diffusion, buffering ions/neurotransmitters, or signal transduction.
3.3 Spatial relationships between astrocytes and synapses
A primary function of astrocytes is the support and regulation of neuronal synapses. Astrocytes modulate synapse function by regulating the concentrations of ions and neurotransmitters in the vicinity of synapses, and are required for synaptic plasticity leading to memory formation (Henneberger et al., 2010; Papouin et al., 2012; Adamsky et al., 2018). These essential roles of astrocytes at the synapse have led to the notion that synapses are not bipartite, composed of the presynaptic and postsynaptic neuronal terminals, but tripartite, composed of the pre- and postsynaptic terminals as well as one or multiple perisynaptic astrocytic processes (PAP; “process” here is used in the sense of an appendage or branch) (Figure 8A) (Araque et al., 1999). PAP geometry varies depending on brain regions and the neurons that compose the target synapse. PAPs are also motile, shifting and remodelling depending on the activity of their synapse and the circuitry in which it is embedded (Haber et al., 2006; Bernardinelli et al., 2014; Henneberger et al., 2020). A key question pertaining to PAP geometry is whether and to what extent they encircle the synaptic cleft (i.e., the space between the pre- and post-synaptic terminals). Some studies suggest that, following synaptic strengthening, PAPs withdraw to allow neurotransmitters to spill over to other synapses (Medvedev et al., 2014; Henneberger et al., 2020), while others suggest that PAPs wrap strengthened synapses more thoroughly to limit neurotransmitter spillover (Genoud et al., 2006; Bernardinelli et al., 2014). PAP coverage of synapses is thus an important variable in understanding astrocytic function, and several computational approaches have been proposed to measure it. A naive approach is to directly measure Euclidean distance between nearest points on synapses and associated PAPs (Dmin) (Medvedev et al., 2014; Salmon et al., 2023) (Figure 8B), however this does not provide a direct measurement of coverage, and is mainly useful for identifying the general location of PAPs on the astrocyte surface. A more sophisticated alternative is to measure Dmin from all points on a synapse to any astrocytic surface point within a certain maximum distance (Medvedev et al., 2014). Distributions and averages of Dmin across all points on a synapse can then be used as measurements of coverage. This approach can be given further biological relevance by weighting individual Dmin values with a function describing the drop in neurotransmitter concentration as distance from the synapse increases (Medvedev et al., 2014). An alternative definition of coverage considers the volume, and/or surface area of astrocyte in the vicinity of a synapse. By measuring the volume and surface area of PAPs encompassed by concentric volumes centered on the synapse, one can estimate the capacity of the astrocyte to absorb ions and neurotransmitters to regulate that synapse’s function (Figure 8C) (Gavrilov et al., 2018; Stephensen et al., 2021; Villanueva et al., 2023).
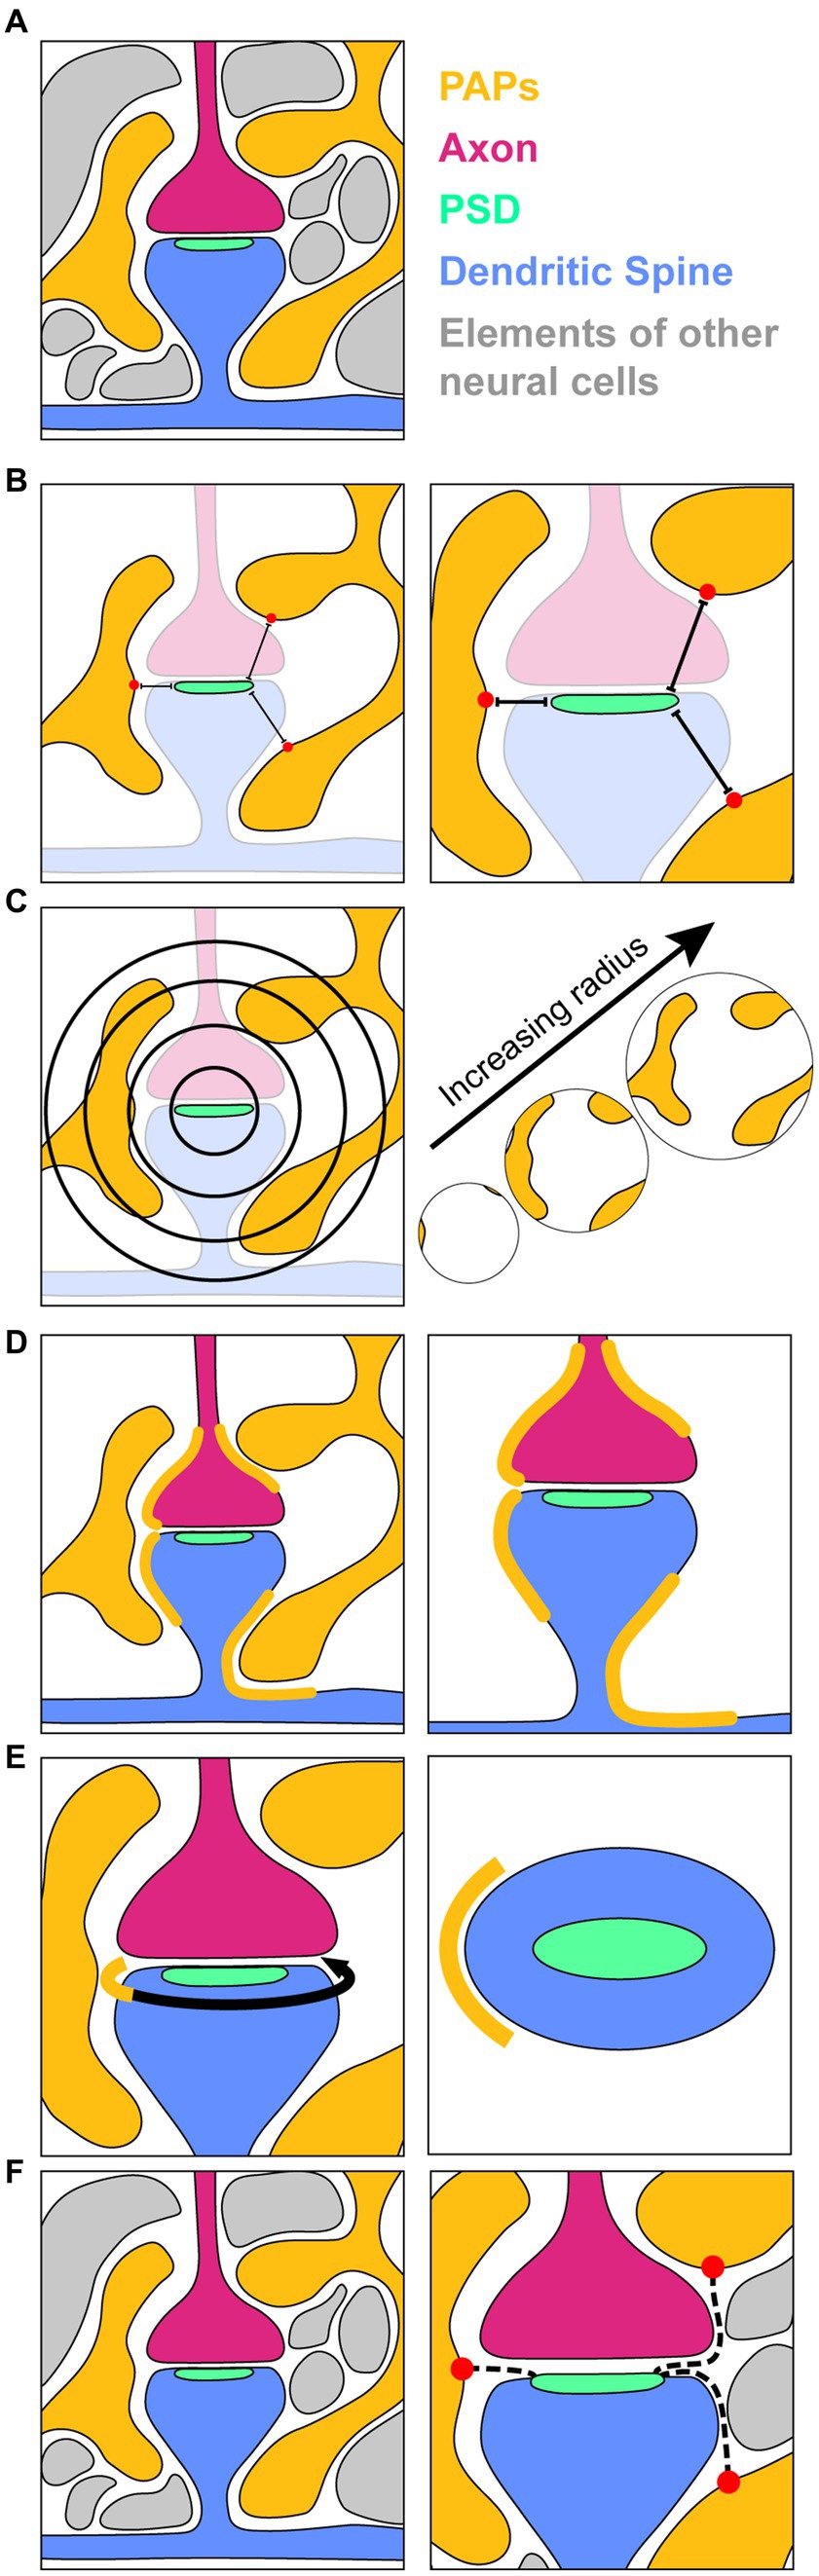
Figure 8. Methodology for measuring PAP coverage of synapses. (A) A schematic of an EM section containing perisynaptic astrocytic processes (PAPs, yellow); an incoming axon (magenta) forming a synapse with a dendritic spine (blue); a post synaptic density (PSD, seafoam), which is a dark-staining marker of synapses in EM images and is the location of neurotransmitter receptors that allow for synaptic transmission; and other cellular components surrounding the elements of interest (grey). (B) Measurement of shortest distances (Dmin) from the PSD to the nearest points (red dots) on surrounding PAPs. (C) A 2D depiction of concentric spheres of increasing radius used to map the volume and surface area of PAPs in the vicinity of a synapse. (D) Direct labelling of the surface of the synaptic unit that is directly opposed by PAPs. (E) Depiction of the axon-spine interface (ASI, curved arrow) with the portion of it contacted by the PAP indicated in yellow. Right, a top down view of the dendritic spine (blue) and PSD (seafoam) showing the extent (yellow) of the ASI circumference contacted by the PAP. (F) Shortest paths (dotted lines) from the PSD through the extracellular space to the nearest PAPs.
Surprisingly, the most direct measures of astrocytic coverage of synapses have thus far only been performed manually. Manual segmentation allows for labelling the synaptic membrane that is directly apposed by a PAP (Figure 8D) (Genoud et al., 2006; Thomas et al., 2023). Alternatively, one can consider only the axon-spine interface (ASI), the roughly disc-shaped interface between the pre- and postsynaptic terminal (Figure 8E) where neurotransmitter is released, and from where it is either absorbed by astrocytes or escapes into the wider extracellular space (ECS) (Genoud et al., 2006; Witcher et al., 2007, 2010; Ostroff et al., 2014; Thomas et al., 2023). Manually tracing the ASI perimeter and classifying the sections that are and are not contacted by the astrocyte gives a direct measure of the extent to which the functional interface of the synapse is encompassed (Figure 8E). These manual approaches are labour-intensive, and so automated measurement of synapse and ASI coverage by PAPs is a much-needed tool.
Astrocytes encompass tens of thousands of synapses, and so a future challenge with the above methods will be efficient implementation. Most of the automated methods mentioned use brute force measurement of all point-to-point Euclidean distances within a circumscribed region, or deformation of concentric spheres to generate “equidistant surfaces” from synapses for quantifying the volume of neighboring PAPs. An alternative efficient solution could be to directly compute the time of arrival at the astrocytic surface of the fast-marching front from the ASI or PSD. This approach can easily incorporate other cellular structures, if a saturated segmentation is available, thus considering the route(s) through the ECS by which the astrocyte interacts with the synapse (Figure 8F). The transmitters and ions through which astrocytes modulate synaptic function move primarily through the ECS, whether astrocytes directly contact the synapse or are blocked from doing so by other cellular components (Kinney et al., 2013; Arizono et al., 2021). Therefore, ECS is the most relevant space for measuring astrocytic access to synapses.
Ultimately, combining measures of synapse and ASI coverage with those of volume of astrocytes in the synaptic vicinity will give a clearer picture of astrocyte structure at synapses. However, these considerations may be trumped by the fact that the chemical fixation generally required for EM imaging may significantly alter fine astrocyte shape and ECS volume (Korogod et al., 2015). To fully understand astrocyte-synapse structure-function relationships, both EM and computational methodology must be further developed and tested.
3.4 Mapping distance and object distribution in convoluted intracellular space
Astrocytes contain many points of interest relevant to neuroscientists throughout their convoluted branching structure. Aside from the constrictions, expansions, cores, branches, branchlets, leaflets and PAPs mentioned above, astrocytes, like all cells, contain organelles (mitochondria, endoplasmic reticulum, etc.) distributed throughout their cytoplasm. All these components have interconnected roles in astrocyte and brain function. They also generally perform their functions locally, sometimes being actively transported to or sequestered in areas of higher need (Jackson et al., 2014; Jackson and Robinson, 2018). Thus, neuroscientists are interested in their distributions and spatial relationships. Accurately measuring the distances between these points of interest is therefore of great importance. However, the convoluted anatomy of astrocytes makes distance measurements within the cell difficult (Arizono et al., 2020; Salmon et al., 2023). Historically, in EM studies, such measures have predominantly been performed by manual tracing, often not in 3D. More recently, the Python Blender plugin, NeuroMorph, provides tools for making local Euclidean distance measurements between points, and an implementation of Dijkstra’s algorithm for measuring distances along meshes (Jorstad et al., 2014). This allows for relatively accurate distance measurements in neurons, as dendrites and axons are approximately tubular and easy to measure by clicking along a path or measuring between points on their surface. However, this is not the case for astrocytes. We therefore recently implemented a fast-marching-based distance measurement for defining geodesics within, outside, or along an astrocyte’s, or any cell’s surface. Using this approach, we showed that geodesic distances based on astrocytic geometry can reveal higher order organization of synapses and organelles in astrocytic space (Salmon et al., 2023).
Mapping simple distances between points of interest can be useful for biological questions, however, a major motivation for measuring distances between subcellular elements is to assess clustering of those elements at locations where they may perform a specific function. Such distance mapping has been used for identifying local clusters of energy-storing glycogen granules in small subregions of astrocytes (Agus et al., 2018; Mohammed et al., 2018; Calì et al., 2019b). Using fast marching distance mapping can extend cluster search to larger regions or whole cells. We recently used this approach to map spatial relationships between >1,500 synapses contacted by portions of astrocytes, however, computing all pairwise PAP-to-PAP distances required run times of over a week (Salmon et al., 2023). While it is possible to naively parallelize the distance computations from multiple sources, with larger datasets becoming available, analyzing the >100,000 synapses (Bushong et al., 2002) contacted by a whole astrocyte will require new computational strategies. Fast marching, which uses a heap to store the entire wavefront, is a serial algorithm not easily parallelizable on modern multicore processors or GPUs. Using parallel algorithms for eikonal equations (Hong and Jeong, 2016) could make such analyses feasible for peta-scale connectomic datasets.
3.5 Spatial clustering
Following mapping of object location and inter-object distances, clusters must be identified. The abovementioned spatial clustering of glycogen granules used DBSCAN (Ester et al., 1996; Mohammed et al., 2018; Calì et al., 2019b). This, combined with projections of artificial imprints of granules emitted onto nearby cellular structures, demonstrated that clusters of glycogen granules can be found near synapses (Agus et al., 2018). DBSCAN can, however, fail when clusters have variable object density, and generally requires tuning of 3 parameters to obtain expected grouping of objects (Malzer and Baum, 2020). Several successful alternatives have been proposed, based around construction of a hierarchical organization of the data to simplify the problem before cluster identification (Ankerst et al., 1999; Sander et al., 2003; Gupta et al., 2010; Hou et al., 2014; Dockhorn et al., 2015; McInnes and Healy, 2017; Khan et al., 2018; Malzer and Baum, 2020). Of these, the most popular appears to be HDBSCAN (Campello et al., 2013), which has a scikit-learn Python implementation (McInnes et al., 2017). These updated algorithms require less parameter tuning to obtain an expected clustering solution. Distribution of cellular components, particularly when constrained to a complex 3D shape like that of an astrocyte, do not necessarily provide an a priori notion of what clusters “should” look like. HDBSCAN and associated algorithms require only minimum cluster size (i.e., number of objects in a cluster) as parameter input. These algorithms should therefore be tested for clustering objects or points of interest in astrocytes and otherwise complex cellular space. Another alternative, Dominant sets clustering (D-Sets), originally designed for image segmentation, is a completely parameter-free approach (Pavan and Pelillo, 2003, 2006). This algorithm generalizes the notion of a maximal clique to weighted graphs and defines clusters based solely on a similarity matrix without the need to specify number or extent of clusters. Basing element similarity solely on inter-element distance defines dominant sets which are also spatial clusters (Rota Bulò and Pelillo, 2017). Each cluster thus extracted is defined by a notion of average local support which results in clusters with small intra-cluster distances compared to distances between elements of different clusters. We recently used D-Sets to identify clusters of synapses surrounding subregions of astrocytic branches, ultimately suggesting that subregions of astrocytes may regulate synapses in groups (Salmon et al., 2023). The utility of D-Sets for this clustering problem suggests that other clustering approaches in use (Hou et al., 2014), or in development, for more typical CV problems may warrant testing and extension for specific cell biology contexts.
4 Future directions: bridging structure and function
Thus far we have presented recent progress in our understanding of astrocyte structure, the CV tools that have made progress possible, and open questions that require further application and development of computational approaches. While understanding astrocyte structure at the nanoscale is interesting in itself, biological structure has many functional implications. Bridging the structure-function gap in astrocyte biology is a challenging problem in which CV tools are also essential.
Like neurons, astrocytes are excitable cells that alter their properties in response to stimulation or behavioral state of the animal and its nervous system (Verkhratsky et al., 2020). However, unlike neurons, which mainly transmit information through all-or-none electrochemical signals, astrocytes display complex and dynamic patterns of intracellular Ca2+ signalling events, which are essential for astrocytic function (Shigetomi et al., 2016). These Ca2+ signals can be visually monitored with fluorescent Ca2+ indicators (Figure 9), which change their fluorescence intensity in response to changing Ca2+ concentration (Figure 9B). Development of new Ca2+indicators over the past decade has allowed neurobiologists to image Ca2+ signals in unprecedented detail. Importantly, diffusion of Ca2+ and the shape and localization Ca2+ signals are likely intimately linked to astrocyte morphology (Denizot et al., 2019, 2022).
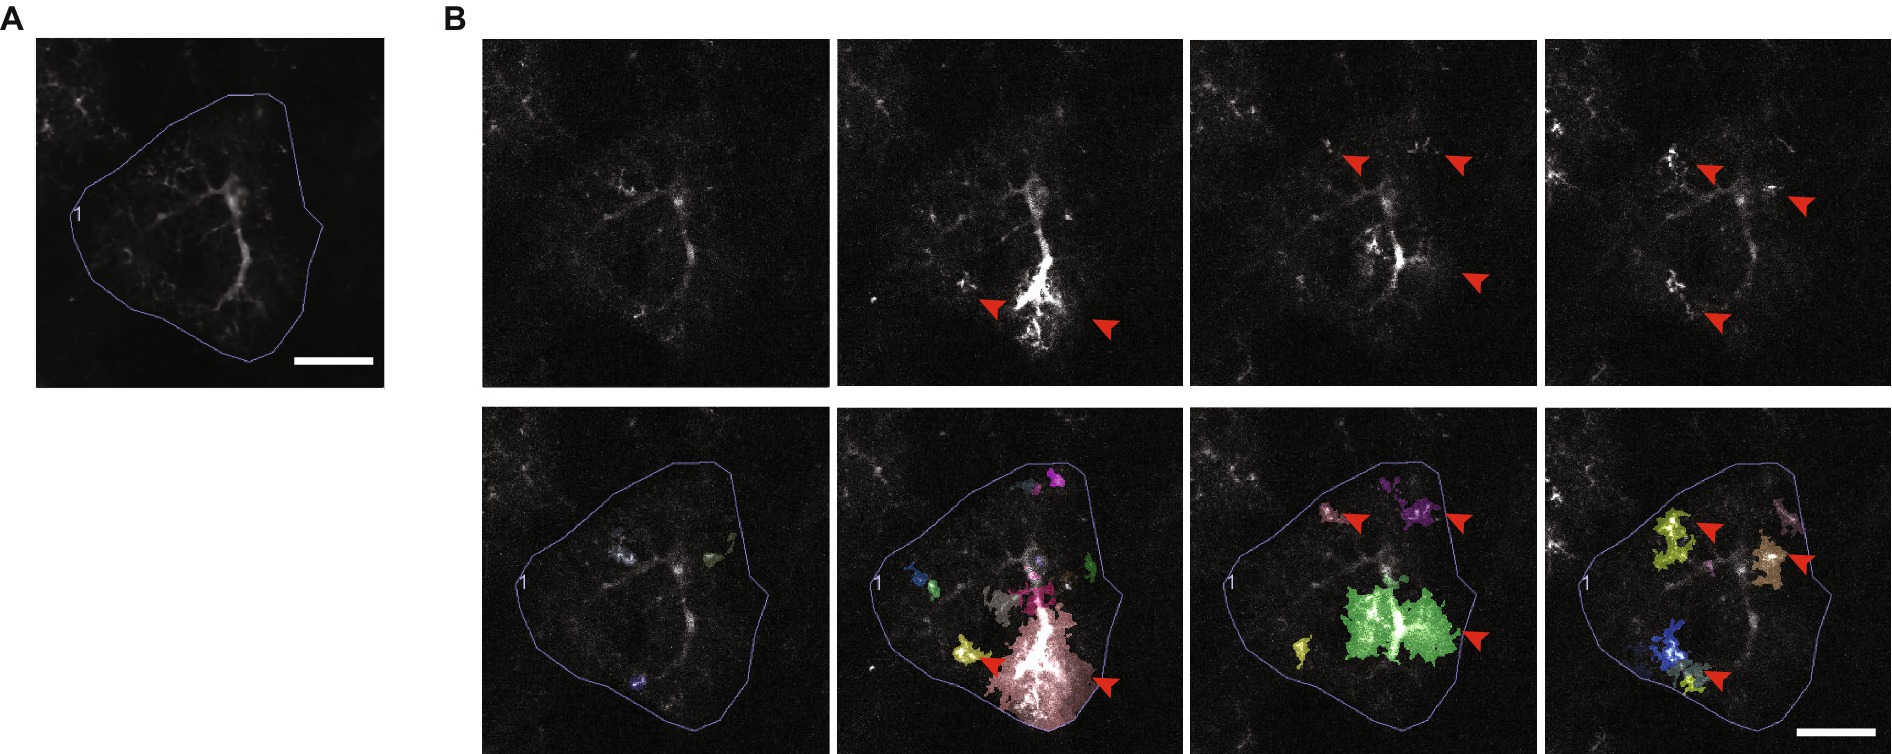
Figure 9. Astrocytic Ca2+ microdomains. (A) An average intensity projection over time of Ca2+ signals, recorded from an astrocyte expressing the genetically encoded Ca2+ indicator, GCaMP6f. Scale bar, 20 μm. (B) A series of frames extracted from a video of the astrocyte in A, each showing a variety of different Ca2+ microdomain events detected by AQuA event-based software (Wang et al., 2019). Ca2+ microdomain events are indicated by red arrowheads (top and bottom rows), and the events as segmented by AQuA are shown in multiple colors (bottom row). Scale bar, 20 μm. Ca2+ imaging video publicly available in the GitHub repository associated with Wang et al. (2019).
Ca2+ signals occur in different patterns and shapes, they can occur spontaneously or in direct response to neuronal or sensory stimulation, and they have been shown to be necessary for various astrocytic functions, including regulation of synapse function (Araque et al., 2014), energy supply, and blood circulation in the brain (Mishra, 2017). However, precisely how Ca2+ signals are involved in astrocytic functions in the brain is not understood (Semyanov et al., 2020), and so they are an extremely active area of investigation. Most (85%) astrocytic Ca2+ signals are small and confined to subregions of the astrocytic branch network (Figure 9B) (Bindocci et al., 2017; Wang et al., 2019). These types of signals are commonly referred to as Ca2+ microdomains (Shigetomi et al., 2010), which we refer to as “microdomain events” for clarity. The nanometer scale of thin astrocyte branches is believed to constrain the diffusion of Ca2+ and to help restrict the size of microdomain events (Rusakov, 2015; Denizot et al., 2022). However, clear evidence linking microdomain events to physical sub-compartments has yet to be shown (Lia et al., 2021). Furthermore, the exact definition of a microdomain event is not established. Microdomain events can recur locally but their center of mass, size, shape, and intensity can vary (Bazargani and Attwell, 2016). They also appear to be capable of propagating between compartments, fusing (Wang et al., 2019), and also pushing the cell past a threshold that results in a cell-wide “Ca2+ transient,” which in turn can propagate across a population of cells (Bazargani and Attwell, 2016). Accurately tracking and making sense of these ill-defined Ca2+ signals is a complex task. CV techniques thus play a critical role in analyzing Ca2+ signalling, and further development of robust algorithms for detecting, tracking and categorizing Ca2+ signals are needed.
In recent years, several algorithms and tools have been developed to quantify astrocyte Ca2+ signals. Initially, region of interest (ROI)-based signal analysis toolboxes were introduced for tracking astrocytic events. For example, GECIquant (Srinivasan et al., 2015) developed a semi-automatic ImageJ plugin to detect and analyze Ca2+ events. Agarwal et al. (2017) then introduced CaSCaDE (Ca2+ Signal Classification and Decoding) MATLAB scripts, which use support vector machines for classifying Ca2+ signals. Both methods restrict analysis to fixed ROIs and identify relevant ROIs using an intensity-threshold based criterion. However, due to the very dynamic nature of microdomain events, static ROIs cannot capture their dynamic nature in full. To address this, AQuA was introduced for “event-based” analysis (Wang et al., 2019). This MATLAB-based GUI tool involves a multi-step image processing pipeline for detection and tracking of Ca2+ events using a dynamic threshold based on running means and noise variance in the signal. The authors define different criteria for tracing astrocytic events in time and extract various features such as area, amplitude, and duration of events. Event detection and tracking are not based on a single ROI, but rather on measured intensity values across entire imaged regions. This allows AQuA to track changes in shape, size, and position of events over time, in addition to the intensity values to which ROI measurements are limited. One of the drawbacks of AQuA is the implicit assumption in the analysis pipeline of a spatio-temporal flow and propagation of Ca2+ events. This may be at odds with more recent evidence suggesting that astrocyte shape compartmentalizes calcium diffusion (Denizot et al., 2019, 2022; Arizono et al., 2020; Salmon et al., 2023). Two alternatives to AQuA, Begonia (Bjørnstad et al., 2021) and STARDUST (Wu et al., 2024), address this by tracking “Regions of Activity” independently of both event coherence and the assumption of event propagation made in AQuA. Lastly, Astral was designed for analyzing larger scale Ca2+ signals across networks of astrocytes, providing a visualization and processing pipeline accessible through a web browser (Dzyubenko et al., 2021). Critically, all these tools are developed for 2(space) + 1(time)D movies. However, Bindocci et al. (2017) show that 2D planes recover less that 12% of total Ca2+ activity in an astrocytic volume. There is a lack of tools for visualizing 3D events in time as well as detecting and tracking events in 3D. Adapting existing tools and techniques from 3D CV can be very beneficial. In addition, analyzing the heterogeneous spatio-temporal data will also require developing new tools which should be able to handle and analyze the data in its native dimensionality. Such analysis will be critical in answering basic questions about astrocytic Ca2+ events and also make the link between structure and function concrete. Recently, Sun et al. (2022) developed a pipeline for visualizing (3 + 1)D volumetric movies recorded from anesthetized and awake mice. A suite of three ImageJ plugins for pre-processing (3 + 1)D colored data, which is otherwise not straightforward in ImageJ, has also been released (Savtchouk et al., 2018). However, further development is required for easy and effective analysis of Ca2+ events in (3 + 1)D. For instance, tracking the origins, spread in space and time, and relationships between different astrocytic Ca2+ events in 3D are still open problems. It should, however, be noted that the main bottleneck in studying (3 + 1)D Ca2+ signals is the quality of the volumetric timelapse video data. Due to issues such as slow 3D scan time and low Ca2+ indicator fluorescence intensity, microscopes cannot yet acquire 3D data fast enough to image microdomain events efficiently in (3 + 1)D. Microscope design must therefore advance before computational tools can be used effectively (Sun et al., 2022). However, this also means that computational tools that consider low image quality, potentially through advanced deconvolution, noise reduction, or by modelling of stereotypical microdomain shape, should be pursued.
Imaging astrocytic Ca2+ dynamics has parallels to functional magnetic resonance imaging (fMRI). While relatively few tools exist for decoding the nature of Ca2+ signals, decades of work has been put into creating a rich set of tools to study (3 + 1)D fMRI signals from human brains (Smith et al., 2004; Cohen et al., 2017). It is therefore worth exploring whether fMRI computer vision tools can be repurposed. For instance, fMRI studies avoid using ROIs by using statistical parametric mapping (SPM), which models spatial statistical processes to identify groups of voxels that are active above background noise levels (Penny et al., 2011). SPM may allow for improvement over the dynamic thresholds approach used in AQuA and Begonia. In fMRI, SPM data can be used concurrently with dynamic causal modelling (DCM) approaches to determine correlation and causation between spatially separate areas of brain activity (Stephan et al., 2010). DCM may thus be useful for studying correlation and causation between microdomain events in different subregions of an astrocyte. A variety of toolboxes in Python, MATLAB and C are already available for SPM, DCM, and many more fMRI algorithms. Examples of toolboxes that could be mined for functions to be ported and built on for analyzing astrocyte Ca2+ include FMRIB Software Library, which provides a suite of methods for statistical modelling and inference and visualization for (3 + 1)D data amenable to be used on computation clusters (Jenkinson et al., 2012); and analysis of functional neuro imaging (AFNI) (Cox, 2012). While techniques developed for fMRI data analysis such as motion correction, slice time correction and spatio-temporal filtering have clear analogs in astrocytic Ca2+ data, the artifacts from temporal interpolation could be exacerbated in astrocytic data due to variability in speed, spread and duration of events. Additionally, the analysis of shape and spread of Ca2+ events and the nature of diffusion do not directly translate to computational problems dealt with in fMRI. Further, fMRI signals indirectly measure the average activity in entire brain regions containing hundreds of thousands of cells. The modelling assumptions that hold for fMRI signals may therefore not hold for diffusion of micromolar concentrations of Ca2+ in nanoscale regions. Further, measurement of Ca2+ dynamics using fluorescent Ca2+ indicators is, of course, fundamentally different from measurements of blood oxygenation level made by fMRI. This will also impact the modelling choices and therefore require fine tuning when trying to port relatively mature fMRI methods.
Finally, as microscopy of live cells cannot yet adequately resolve either Ca2+ signals or nanostructure, computational modelling of astrocytic Ca2+ dynamics will likely be essential to understanding their roles in health and disease. Recent reviews provide a comprehensive taxonomy of various models of Ca2+ signals in astrocytes and examine models of astrocyte function that have been used to date (Manninen et al., 2018; Denizot et al., 2020; Covelo et al., 2022). Importantly, Manninen et al. (2018) highlight that most models of astrocytic function are based on just a handful of neuronal models, suggesting new and updated models are needed. Modelling will provide key insights into the cellular and biochemical mechanisms of astrocyte physiology and help to better understand how astrocytes contribute to brain computation, but to do so, accurate models of astrocyte morphology must be incorporated (Covelo et al., 2022).
5 Conclusion
Computational approaches and CV methods are essential for detailed quantitative analysis of biological structure. This is particularly relevant in cellular neuroscience, where large, high-resolution nanoscale datasets from multiple species and brain areas are becoming available. Improving our ability to comprehensively and efficiently quantify cellular nanostructure will aid in defining brain cell and tissue function under various physiological conditions and in disease contexts. Moreover, it will allow for better integration of cellular, tissue, and systems level analysis across the full range of spatial resolution to provide a more unified understanding of brain function.
In Sections 2 and 3 of this review we dissected what is known of astrocytic form, and the tools used for analyzing it. We then considered the implications of form for astrocytic function as exemplified by the poorly understood array of astrocytic Ca2+ signals. We hope to have demonstrated that CV-based elucidation of the nanostructural details of astrocytes is expanding our understanding of highly complex astrocytic nanostructure, and also that there are many avenues for further application and development of astrocyte-tailored CV tools. Elucidating the nanoscale details of astrocyte structure and studying their implications in models of astrocyte function will allow for more accurate hypotheses to be generated with regards to the roles of astrocytes in vivo, and will ultimately provide a clearer understanding of how astrocytes are involved in healthy brain function and in disease.
Author contributions
TAS: Conception, Design, Acquisition, Analysis, Interpretation, Writing, Critical revision. MY: Conception, Design, Critical revision. YK: Conception, Design, KKM: Conception, Design, Writing, Critical revision. CKS: Conception, Design, Acquisition, Analysis, Interpretation, Writing, Critical revision. ALS: Acquisition, Analysis, Interpretation.
Funding
This work was supported by Funding CIHR (PJT148569, 156247, KKM); CIHR (PJT180573 KKM); NSERC (408044-2011 and 69404, KKM, RGPIN-2018-06323); an FRQS Dual Chair in AI and Brain Health (KKM); and a Joint Canada-Israel Research Program Award from IDRC/ISF/CIHR/Azrieli Foundation.
Acknowledgments
The authors would like to thank Dr. Kaleem Siddiqi for comments on numerous versions of the manuscript, as well as Jeannie Mui, Lee Ann Monaghan, Dr. Weawkamol Leelapornpisit, Dr. Kelly Sears, Dr. Hojatollah Vali, Dr. Joaquin Ortega, and Dr. Craig Mondato at the Facility for Electron Microscopy Research at McGill for their aid in tissue processing and FIBSEM imaging.
Conflict of interest
The authors declare that the research was conducted in the absence of any commercial or financial relationships that could be construed as a potential conflict of interest.
Publisher’s note
All claims expressed in this article are solely those of the authors and do not necessarily represent those of their affiliated organizations, or those of the publisher, the editors and the reviewers. Any product that may be evaluated in this article, or claim that may be made by its manufacturer, is not guaranteed or endorsed by the publisher.
Supplementary material
The Supplementary material for this article can be found online at: https://www.frontiersin.org/articles/10.3389/fcomp.2024.1156204/full#supplementary-material
References
Achterberg, H. C., van der Lijn, F., den Heijer, T., Vernooij, M. W., Ikram, M. A., Niessen, W. J., et al. (2014). Hippocampal shape is predictive for the development of dementia in a normal, elderly population. Hum. Brain Mapp. 35, 2359–2371. doi: 10.1002/hbm.22333
Acosta, C., Anderson, H. D., and Anderson, C. M. (2017). Astrocyte dysfunction in Alzheimer disease. J. Neurosci. Res. 95, 2430–2447. doi: 10.1002/jnr.24075
Adamsky, A., Kol, A., Kreisel, T., Doron, A., Ozeri-Engelhard, N., Melcer, T., et al. (2018). Astrocytic activation generates de novo neuronal potentiation and memory enhancement. Cell 174, 59–71.e14. doi: 10.1016/j.cell.2018.05.002
Agus, M., Boges, D., Gagnon, N., Magistretti, P. J., Hadwiger, M., and Calí, C. (2018). GLAM: glycogen-derived lactate absorption map for visual analysis of dense and sparse surface reconstructions of rodent brain structures on desktop systems and virtual environments. Comput. Graph. 74, 85–98. doi: 10.1016/j.cag.2018.04.007
Agarwal, A., Wu, P.-H., Hughes, E. G., Fukaya, M., Tischfield, M. A., Langseth, A. J., et al. (2017). Transient Opening of the Mitochondrial Permeability Transition Pore Induces Microdomain Calcium Transients in Astrocyte Processes. Neuron. 93, 587–605. doi: 10.1016/j.neuron.2016.12.034
Andreux, M., Rodolà, E., Aubry, M., and Cremers, D. (2015). Anisotropic Laplace–Beltrami operators for shape analysis. L. Agapito, M. M. Bronstein, and C. Rother. Computer Vision—ECCV 2014 Workshops. Cham. Springer International Publishing. 299–312.
Ankerst, M., Breunig, M. M., Kriegel, H. P., and Sander, J. (1999). OPTICS: ordering points to identify the clustering structure. ACM SIGMOD Rec. 28, 49–60. doi: 10.1145/304181.304187
Araque, A., Carmignoto, G., Haydon, P. G., Oliet, S. H. R., Robitaille, R., and Volterra, A. (2014). Gliotransmitters travel in time and space. Neuron 81, 728–739. doi: 10.1016/j.neuron.2014.02.007
Araque, A., Parpura, V., Sanzgiri, R. P., and Haydon, P. G. (1999). Tripartite synapses: glia, the unacknowledged partner. Trends Neurosci. 22, 208–215. doi: 10.1016/S0166-2236(98)01349-6
Arizono, M., Inavalli, V. V. G. K., Bancelin, S., Fernández-Monreal, M., and Nägerl, U. V. (2021). Super-resolution shadow imaging reveals local remodeling of astrocytic microstructures and brain extracellular space after osmotic challenge. Glia 69, 1605–1613. doi: 10.1002/glia.23995
Arizono, M., Inavalli, V. V. G. K., Panatier, A., Pfeiffer, T., Angibaud, J., Levet, F., et al. (2020). Structural basis of astrocytic Ca2+ signals at tripartite synapses. Nat. Commun. 11, 1906–1915. doi: 10.1038/s41467-020-15648-4
Aswath, A., Alsahaf, A., Giepmans, B., and Azzopardi, G. (2022). Automated image analysis in large-scale cellular electron microscopy: a literature survey. arXiv. Available at: http://arxiv.org/abs/2206.07171 (Accessed January 26, 2023).
Aten, S., Kiyoshi, C. M., Arzola, E. P., Patterson, J. A., Taylor, A. T., Du, Y., et al. (2022). Ultrastructural view of astrocyte arborization, astrocyte-astrocyte and astrocyte-synapse contacts, intracellular vesicle-like structures, and mitochondrial network. Prog. Neurobiol. 213:102264. doi: 10.1016/j.pneurobio.2022.102264
Bae, A. (2023). skeletonization. seung-lab. Available at: https://github.com/seung-lab/skeletonization. (Accessed September 25, 2023).
Bazargani, N., and Attwell, D. (2016). Astrocyte calcium signaling: the third wave. Nat. Neurosci. 19, 182–189. doi: 10.1038/nn.4201
Benarroch, E. E. (2016). Astrocyte signaling and synaptic homeostasis: I: membrane channels, transporters, and receptors in astrocytes. Neurology 87, 324–330. doi: 10.1212/WNL.0000000000002875
Berger, D. R., Seung, H. S., and Lichtman, J. W. (2018). VAST (Volume Annotation and Segmentation Tool): efficient manual and semi-automatic labeling of large 3D image stacks. Front. Neural Circuits 12:88. doi: 10.3389/fncir.2018.00088
Berman, J., Chklovskii, D. B., and Wu, J. (2022). Bridging the gap: point clouds for merging neurons in connectomics. Proceedings of the 5th International Conference on Medical Imaging with Deep Learning: International Conference on Medical Imaging with Deep Learning (PMLR). 150–159. Available at: https://proceedings.mlr.press/v172/berman22a.html (Accessed September 21, 2023).
Bernardinelli, Y., Randall, J., Janett, E., Nikonenko, I., König, S., Jones, E. V., et al. (2014). Activity-dependent structural plasticity of perisynaptic astrocytic domains promotes excitatory synapse stability. Curr. Biol. 24, 1679–1688. doi: 10.1016/j.cub.2014.06.025
Bindocci, E., Savtchouk, I., Liaudet, N., Becker, D., Carriero, G., and Volterra, A. (2017). Three-dimensional Ca2+ imaging advances understanding of astrocyte biology. Science 356:eaai8185. doi: 10.1126/science.aai8185
Bishop, C., Matelsky, J., Wilt, M., Downs, J., Rivlin, P., Plaza, S., et al. (2021). CONFIRMS: a toolkit for scalable, black box connectome assessment and investigation. 2021 43rd Annual International Conference of the IEEE Engineering in Medicine & Biology Society (EMBC). Mexico: IEEE. 2444–2450.
Bjørnstad, D. M., Åbjørsbråten, K. S., Hennestad, E., Cunen, C., Hermansen, G. H., Bojarskaite, L., et al. (2021). Begonia—a two-photon imaging analysis pipeline for astrocytic Ca2+ signals. Front. Cell. Neurosci. 15:681066. doi: 10.3389/fncel.2021.681066
Blum, H. (1973). Biological shape and visual science (part I). J. Theor. Biol. 38, 205–287. doi: 10.1016/0022-5193(73)90175-6
Boergens, K. M., Berning, M., Bocklisch, T., Bräunlein, D., Drawitsch, F., Frohnhofen, J., et al. (2017). webKnossos: efficient online 3D data annotation for connectomics. Nat. Methods 14, 691–694. doi: 10.1038/nmeth.4331
Bouix, S., Pruessner, J. C., Louis Collins, D., and Siddiqi, K. (2005). Hippocampal shape analysis using medial surfaces. NeuroImage 25, 1077–1089. doi: 10.1016/j.neuroimage.2004.12.051
Bouvier, D. S., Jones, E. V., Quesseveur, G., Davoli, M. A., Ferreira, T., Quirion, R., et al. (2016). High resolution dissection of reactive glial nets in Alzheimer’s disease. Sci. Rep. 6:24544. doi: 10.1038/srep24544
Brancaccio, M., Patton, A. P., Chesham, J. E., Maywood, E. S., and Hastings, M. H. (2017). Astrocytes control circadian timekeeping in the suprachiasmatic nucleus via glutamatergic signaling. Neuron 93, 1420–1435.e5. doi: 10.1016/j.neuron.2017.02.030
Briggman, K. L., and Denk, W. (2006). Towards neural circuit reconstruction with volume electron microscopy techniques. Curr. Opin. Neurobiol. 16, 562–570. doi: 10.1016/j.conb.2006.08.010
Briggman, K. L., Helmstaedter, M., and Denk, W. (2011). Wiring specificity in the direction-selectivity circuit of the retina. Nature 471, 183–188. doi: 10.1038/nature09818
Brusini, I., Lindberg, O., Muehlboeck, J. S., Smedby, Ö., Westman, E., and Wang, C. (2020). Shape information improves the cross-cohort performance of deep learning-based segmentation of the hippocampus. Front. Neurosci. 14:15. doi: 10.3389/fnins.2020.00015
Bushong, E. A., Martone, M. E., Jones, Y. Z., and Ellisman, M. H. (2002). Protoplasmic astrocytes in CA1 stratum radiatum occupy separate anatomical domains. J. Neurosci. 22, 183–192. doi: 10.1523/JNEUROSCI.22-01-00183.2002
Calì, C., Agus, M., Kare, K., Boges, D. J., Lehväslaiho, H., Hadwiger, M., et al. (2019a). 3D cellular reconstruction of cortical glia and parenchymal morphometric analysis from serial block-face electron microscopy of juvenile rat. Prog. Neurobiol. 183:101696. doi: 10.1016/j.pneurobio.2019.101696
Calì, C., Tauffenberger, A., and Magistretti, P. (2019b). The strategic location of glycogen and lactate: from body energy reserve to brain plasticity. Front. Cell. Neurosci. 13:82. doi: 10.3389/fncel.2019.00082
Campello, R. J. G. B., Moulavi, D., and Sander, J. (2013). “Density-based clustering based on hierarchical density estimates” in Advances in knowledge discovery and data mining: lecture notes in computer science. eds. J. Pei, V. S. Tseng, L. Cao, H. Motoda, and G. Xu (Berlin: Springer), 160–172.
Cardona, A., Saalfeld, S., Schindelin, J., Arganda-Carreras, I., Preibisch, S., Longair, M., et al. (2012). TrakEM2 software for neural circuit reconstruction. PLoS One 7:e38011. doi: 10.1371/journal.pone.0038011
Celii, B., Papadopoulos, S., Ding, Z., Fahey, P. G., Wang, E., Papadopoulos, C., et al. (2023). NEURD: automated proofreading and feature extraction for connectomics. bioRxiv. doi: 10.1101/2023.03.14.532674 [Epub ahead of preprint].
Chen, J., Song, S. K., Liu, W., McLean, M., Allen, J. S., Tan, J., et al. (2003). Remodeling of cardiac fiber structure after infarction in rats quantified with diffusion tensor MRI. Am. J. Phys. Heart Circ. Phys. 285, H946–H954. doi: 10.1152/ajpheart.00889.2002
Cohen, J. D., Daw, N., Engelhardt, B., Hasson, U., Li, K., Niv, Y., et al. (2017). Computational approaches to fMRI analysis. Nat. Neurosci. 20, 304–313. doi: 10.1038/nn.4499
Covelo, A., Badoual, A., and Denizot, A. (2022). Reinforcing interdisciplinary collaborations to unravel the astrocyte “calcium code”. J. Mol. Neurosci. 72, 1443–1455. doi: 10.1007/s12031-022-02006-w
Cox, R. W. (2012). AFNI: what a long strange trip it’s been. NeuroImage 62, 743–747. doi: 10.1016/j.neuroimage.2011.08.056
Curreli, S., Bonato, J., Romanzi, S., Panzeri, S., and Fellin, T. (2022). Complementary encoding of spatial information in hippocampal astrocytes. PLoS Biol. 20:e3001530. doi: 10.1371/journal.pbio.3001530
de Belen, R. A. J., Bednarz, T., Sowmya, A., and del Favero, D. (2020). Computer vision in autism spectrum disorder research: a systematic review of published studies from 2009 to 2019. Transl. Psychiatry 10, 333–320. doi: 10.1038/s41398-020-01015-w
DeFelipe, J., Hendry, S. H. C., and Jones, E. G. (1986). A correlative electron microscopic study of basket cells and large gabaergic neurons in the monkey sensory-motor cortex. Neuroscience 17, 991–1009. doi: 10.1016/0306-4522(86)90075-8
Denizot, A., Arizono, M., Nägerl, U. V., Berry, H., and de Schutter, E. (2022). Control of Ca2+ signals by astrocyte nanoscale morphology at tripartite synapses. Glia 70, 2378–2391. doi: 10.1002/glia.24258
Denizot, A., Arizono, M., Nägerl, U. V., Soula, H., and Berry, H. (2019). Simulation of calcium signaling in fine astrocytic processes: effect of spatial properties on spontaneous activity. PLoS Comput. Biol. 15:e1006795. doi: 10.1371/journal.pcbi.1006795
Denizot, A., Berry, H., and Venugopal, S. (2020). “Computational modelling of intracellular calcium signals in astrocytes” in Encyclopedia of computational neuroscience. eds. D. Jaeger and R. Jung (New York, NY: Springer), 1–12.
Denk, W., and Horstmann, H. (2004). Serial block-face scanning electron microscopy to reconstruct three-dimensional tissue nanostructure. PLoS Biol. 2:e329. doi: 10.1371/journal.pbio.0020329
Dileep, D., Syed, T. A., Sloan, T. F., Dhandapany, P. S., Siddiqi, K., and Sirajuddin, M. (2023). Cardiomyocyte orientation recovery at micrometer scale reveals long-axis fiber continuum in heart walls. EMBO J. 42:e113288. doi: 10.15252/embj.2022113288
Dockhorn, A., Braune, C., and Kruse, R. (2015). An alternating optimization approach based on hierarchical adaptations of DBSCAN. 2015 IEEE Symposium Series on Computational Intelligence. 749–755
Dorkenwald, S. (2023). sdorkenw/MeshParty. Available at: https://github.com/sdorkenw/MeshParty. (Accessed September 25, 2023)
Dorkenwald, S., Matsliah, A., Sterling, A. R., Schlege, P., Yu, S.-c., McKellar, C. E., et al. (2023). Neuronal wiring diagram of an adult brain. bioRxiv. doi: 10.1101/2023.06.27.546656 [Epub ahead of preprint].
Dorkenwald, S., McKellar, C. E., Macrina, T., Kemnitz, N., Lee, K., Lu, R., et al. (2022). FlyWire: online community for whole-brain connectomics. Nat. Methods 19, 119–128. doi: 10.1038/s41592-021-01330-0
Drawitsch, F., Karimi, A., Boergens, K. M., and Helmstaedter, M. (2018). FluoEM, virtual labeling of axons in three-dimensional electron microscopy data for long-range connectomics. eLife 7:e38976. doi: 10.7554/eLife.38976
Dzyubenko, E., Prazuch, W., Pillath-Eilers, M., Polanska, J., and Hermann, D. M. (2021). Analysing intercellular communication in astrocytic networks using “Astral”. Front. Cell. Neurosci. 15:689268. doi: 10.3389/fncel.2021.689268
Endo, F., Kasai, A., Soto, J. S., Yu, X., Qu, Z., Hashimoto, H., et al. (2022). Molecular basis of astrocyte diversity and morphology across the CNS in health and disease. Science 378:eadc9020. doi: 10.1126/science.adc9020
Ester, M., Kriegel, H.-P., Sander, J., and Xu, X. (1996). A density-based algorithm for discovering clusters in large spatial databases with noise. KDD’96: Proceedings of the Second International Conference on Knowledge Discovery and Data Mining
Fiala, J. C. (2005). Reconstruct: a free editor for serial section microscopy. J. Microsc. 218, 52–61. doi: 10.1111/j.1365-2818.2005.01466.x
Fukatsu, R., Obara, T., Baba, N., Kanaya, K., Garruto, R., Hayashishita, T., et al. (1988). Ultrastructural analysis of neurofibrillary tangles of Alzheimer’s disease using computerized digital processing. Acta Neuropathol. 75, 519–522. doi: 10.1007/BF00687141
Funke, J. (2022). skeletopyze. Available at: https://github.com/funkey/skeletopyze (Accessed September 25, 2023)
García-Cáceres, C., Quarta, C., Varela, L., Gao, Y., Gruber, T., Legutko, B., et al. (2016). Astrocytic insulin signaling couples brain glucose uptake with nutrient availability. Cell 166, 867–880. doi: 10.1016/j.cell.2016.07.028
Gavrilov, N., Golyagina, I., Brazhe, A., Scimemi, A., Turlapov, V., and Semyanov, A. (2018). Astrocytic coverage of dendritic spines, dendritic shafts, and axonal boutons in hippocampal neuropil. Front. Cell. Neurosci. 12:248. doi: 10.3389/fncel.2018.00248
Genoud, C., Quairiaux, C., Steiner, P., Hirling, H., Welker, E., and Knott, G. W. (2006). Plasticity of astrocytic coverage and glutamate transporter expression in adult mouse cortex. PLoS Biol. 4, e343–e2064. doi: 10.1371/journal.pbio.0040343
Gonda, F., Wang, X., Beyer, J., Hadwiger, M., Lichtman, J. W., and Pfister, H. (2021). VICE: visual identification and correction of neural circuit errors. Comput. Graph. Forum 40, 447–458. doi: 10.1111/cgf.14320
Grenander, U., and Miller, M. I. (1998). Computational anatomy: an emerging discipline. Q. Appl. Math. 56, 617–694. doi: 10.1090/qam/1668732
Grosche, A., Grosche, J., Tackenberg, M., Scheller, D., Gerstner, G., Gumprecht, A., et al. (2013). Versatile and simple approach to determine astrocyte territories in mouse neocortex and hippocampus. PLoS One 8:e69143. doi: 10.1371/journal.pone.0069143
Grosche, J., Matyash, V., Möller, T., Verkhratsky, A., Reichenbach, A., and Kettenmann, H. (1999). Microdomains for neuron-glia interaction: parallel fiber signaling to Bergmann glial cells. Nat. Neurosci. 2, 139–143. doi: 10.1038/5692
Gupta, G., Liu, A., and Ghosh, J. (2010). Automated hierarchical density shaving: a robust automated clustering and visualization framework for large biological data sets. IEEE/ACM Trans. Comput. Biol. Bioinform. 7, 223–237. doi: 10.1109/TCBB.2008.32
Haber, M., Zhou, L., and Murai, K. K. (2006). Cooperative astrocyte and dendritic spine dynamics at hippocampal excitatory synapses. J. Neurosci. 26, 8881–8891. doi: 10.1523/JNEUROSCI.1302-06.2006
Haehn, D., Kaynig, V., Tompkin, J., Lichtman, J. W., and Pfister, H. (2018). Guided proofreading of automatic segmentations for connectomics. Proceedings of the IEEE Conference on Computer Vision and Pattern Recognition (CVPR). 9319–9328. Available at: https://openaccess.thecvf.com/content_cvpr_2018/html/Haehn_Guided_Proofreading_of_CVPR_2018_paper.html. (Accessed January 25, 2023)
Halassa, M. M., Fellin, T., Takano, H., Dong, J. H., and Haydon, P. G. (2007). Synaptic islands defined by the territory of a single astrocyte. J. Neurosci. 27, 6473–6477. doi: 10.1523/JNEUROSCI.1419-07.2007
Halassa, M. M., Florian, C., Fellin, T., Munoz, J. R., Lee, S. Y., Abel, T., et al. (2009). Astrocytic modulation of sleep homeostasis and cognitive consequences of sleep loss. Neuron 61, 213–219. doi: 10.1016/j.neuron.2008.11.024
Hama, K., Arii, T., Katayama, E., Marton, M., and Ellisman, M. H. (2004). Tri-dimensional morphometric analysis of astrocytic processes with high voltage electron microscopy of thick Golgi preparations. J. Neurocytol. 33, 277–285. doi: 10.1023/B:NEUR.0000044189.08240.a2
Hayworth, K. J., Xu, C. S., Lu, Z., Knott, G. W., Fetter, R. D., Tapia, J. C., et al. (2015). Ultrastructurally smooth thick partitioning and volume stitching for large-scale connectomics. Nat. Methods 12, 319–322. doi: 10.1038/nmeth.3292
Helmstaedter, M. (2013). Cellular-resolution connectomics: challenges of dense neural circuit reconstruction. Nat. Methods 10, 501–507. doi: 10.1038/nmeth.2476
Henneberger, C., Bard, L., Panatier, A., Reynolds, J. P., Kopach, O., Medvedev, N. I., et al. (2020). LTP induction boosts glutamate spillover by driving withdrawal of perisynaptic astroglia. Neuron 108, 919–936.e11. doi: 10.1016/j.neuron.2020.08.030
Henneberger, C., Papouin, T., Oliet, S. H. R., and Rusakov, D. A. (2010). Long-term potentiation depends on release of d-serine from astrocytes. Nature 463, 232–236. doi: 10.1038/nature08673
Hong, S., and Jeong, W.-K. (2016). A multi-GPU fast iterative method for Eikonal equations using on-the-fly adaptive domain decomposition. Procedia Comput. Sci. 80, 190–200. doi: 10.1016/j.procs.2016.05.309
Hou, J., Sha, C., Chi, L., Xia, Q., and Qi, N.-M. (2014). Merging dominant sets and DBSCAN for robust clustering and image segmentation. 2014 IEEE International Conference on Image Processing (ICIP). 4422–4426.
Ivanov, V., and Michmizos, K. (2021). Increasing liquid state machine performance with edge-of-chaos dynamics organized by astrocyte-modulated plasticity. M. Ranzato. Advances in Neural Information Processing Systems. Curran Associates, Inc. 25703–25719. Available at: https://proceedings.neurips.cc/paper_files/paper/2021/file/d79c8788088c2193f0244d8f1f36d2db-Paper.pdf
Jackson, J. G., O’Donnell, J. C., Takano, H., Coulter, D. A., and Robinson, M. B. (2014). Neuronal activity and glutamate uptake decrease mitochondrial mobility in astrocytes and position mitochondria near glutamate transporters. J. Neurosci. 34, 1613–1624. doi: 10.1523/JNEUROSCI.3510-13.2014
Jackson, J. G., and Robinson, M. B. (2018). Regulation of mitochondrial dynamics in astrocytes: mechanisms, consequences, and unknowns. Glia 66, 1213–1234. doi: 10.1002/glia.23252
Jain, V., Murray, J. F., Roth, F., Turaga, S., Zhigulin, V., Briggman, K. L., et al. (2007). Supervised learning of image restoration with convolutional networks. 2007 IEEE 11th International Conference on Computer Vision. 1–8
Januszewski, M., Kornfeld, J., Li, P. H., Pope, A., Blakely, T., Lindsey, L., et al. (2018). High-precision automated reconstructions of neurons with flood-filling networks. Nat. Methods 15, 605–610. doi: 10.1038/s41592-018-0049-4
Jenkinson, M., Beckmann, C. F., Behrens, T. E. J., Woolrich, M. W., and Smith, S. M. (2012). FSL. NeuroImage 62, 782–790. doi: 10.1016/j.neuroimage.2011.09.015
Jorstad, A., Nigro, B., Cali, C., Wawrzyniak, M., Fua, P., and Knott, G. (2014). NeuroMorph: a toolset for the morphometric analysis and visualization of 3D models derived from electron microscopy image stacks. Neuroinformatics 13, 83–92. doi: 10.1007/s12021-014-9242-5
Joshi, S. H., Espinoza, R. T., Pirnia, T., Shi, J., Wang, Y., Ayers, B., et al. (2016). Structural plasticity of the hippocampus and amygdala induced by electroconvulsive therapy in major depression. Biol. Psychiatry 79, 282–292. doi: 10.1016/j.biopsych.2015.02.029
Joyce, J., Chalavadi, R., Chan, J., Tanna, S., Xenes, D., Kuo, N., et al. (2023). A novel semi-automated proofreading and mesh error detection pipeline for neuron extension. bioRxiv. doi: 10.1101/2023.10.20.563359. [Epub ahead of preprint].
Kasthuri, N., Hayworth, K. J., Berger, D. R., Schalek, R. L., Conchello, J. A., Knowles-Barley, S., et al. (2015). Saturated reconstruction of a volume of neocortex. Cell 162, 648–661. doi: 10.1016/j.cell.2015.06.054
Khakh, B. S., and Deneen, B. (2019). The emerging nature of astrocyte diversity. Annu. Rev. Neurosci. 42, 187–207. doi: 10.1146/annurev-neuro-070918-050443
Khakh, B. S., and Sofroniew, M. V. (2015). Diversity of astrocyte functions and phenotypes in neural circuits. Nat. Neurosci. 18, 942–952. doi: 10.1038/nn.4043
Khan, M. M. R., Siddique, M. A. B., Arif, R. B., and Oishe, M. R. (2018). ADBSCAN: adaptive density-based spatial clustering of applications with noise for identifying clusters with varying densities. 2018 4th International Conference on Electrical Engineering and Information & Communication Technology (iCEEiCT). Dhaka, Bangladesh: IEEE, pp. 107–111
Kim, J. G., Suyama, S., Koch, M., Jin, S., Argente-Arizon, P., Argente, J., et al. (2014). Leptin signaling in astrocytes regulates hypothalamic neuronal circuits and feeding. Nat. Neurosci. 17, 908–910. doi: 10.1038/nn.3725
Kinney, J. P., Spacek, J., Bartol, T. M., Bajaj, C. L., Harris, K. M., and Sejnowski, T. J. (2013). Extracellular sheets and tunnels modulate glutamate diffusion in hippocampal neuropil. J. Comp. Neurol. 521, 448–464. doi: 10.1002/cne.23181
Knott, G., Marchman, H., Wall, D., and Lich, B. (2008). Serial section scanning electron microscopy of adult brain tissue using focused ion beam milling. J. Neurosci. 28, 2959–2964. doi: 10.1523/JNEUROSCI.3189-07.2008
Kohl, S. A. A., Romera-Paredes, B., Meyer, C., De Fauw, J., Ledsam, J. R., Maier-Hein, K. H., et al. (2018). A probabilistic U-Net for segmentation of ambiguous images. Advances in Neural Information Processing Systems Curran Associates, Inc. Available at: https://proceedings.neurips.cc/paper/2018/hash/473447ac58e1cd7e96172575f48dca3b-Abstract.html. (Accessed February 1, 2023).
Korogod, N., Petersen, C. C. H., and Knott, G. W. (2015). Ultrastructural analysis of adult mouse neocortex comparing aldehyde perfusion with cryo fixation. eLife 4:e05793. doi: 10.7554/eLife.05793
Kosaka, T., and Hama, K. (1986). Three-dimensional structure of astrocytes in the rat dentate gyrus. J. Comp. Neurol. 249, 242–260. doi: 10.1002/cne.902490209
Kozachkov, L., Kastanenka, K. V., and Krotov, D. (2023). Building transformers from neurons and astrocytes. Proc. Natl. Acad. Sci. U.S.A. 120:e2219150120. doi: 10.1073/pnas.2219150120
Kremer, J. R., Mastronarde, D. N., and McIntosh, J. R. (1996). Computer visualization of three-dimensional image data using IMOD. J. Struct. Biol. 116, 71–76. doi: 10.1006/jsbi.1996.0013
Kreshuk, A., Straehle, C. N., Sommer, C., Koethe, U., Cantoni, M., Knott, G., et al. (2011). Automated detection and segmentation of synaptic contacts in nearly isotropic serial electron microscopy images. PLoS One 6, 1–8. doi: 10.1371/journal.pone.0024899
Lee, T. C., Kashyap, R. L., and Chu, C. N. (1994). Building skeleton models via 3-D medial surface axis thinning algorithms. CVGIP Graph. Models Image Process. 56, 462–478. doi: 10.1006/cgip.1994.1042
Lee, K., Turner, N., Macrina, T., Wu, J., Lu, R., and Seung, H. S. (2019). Convolutional nets for reconstructing neural circuits from brain images acquired by serial section electron microscopy. Curr. Opin. Neurobiol. 55, 188–198. doi: 10.1016/j.conb.2019.04.001
Lia, A., Henriques, V. J., Zonta, M., Chiavegato, A., Carmignoto, G., Gómez-Gonzalo, M., et al. (2021). Calcium signals in astrocyte microdomains, a decade of great advances. Front. Cell. Neurosci. 15, 1–7. doi: 10.3389/fncel.2021.673433
Lin, C., Liu, L., Li, C., Kobbelt, L., Wang, B., Xin, S., et al. (2022). SEG-MAT: 3D shape segmentation using medial axis transform. IEEE Trans. Vis. Comput. Graph. 28, 1–2444. doi: 10.1109/TVCG.2020.3032566
Malandain, G., Bertrand, G., and Ayache, N. (1993). Topological segmentation of discrete surfaces. Int. J. Comput. Vis. 10, 183–197. doi: 10.1007/BF01420736
Malzer, C., and Baum, M. (2020). A hybrid approach to hierarchical density-based cluster selection. 2020 IEEE International Conference on Multisensor Fusion and Integration for Intelligent Systems (MFI). 223–228
Manninen, T., Havela, R., and Linne, M. L. (2018). Computational models for calcium-mediated astrocyte functions. Front. Comput. Neurosci. 12:14. doi: 10.3389/fncom.2018.00014
Marín, O., and Gleeson, J. G. (2011). Function follows form: understanding brain function from a genetic perspective. Curr. Opin. Genet. Dev. 21, 237–239. doi: 10.1016/j.gde.2011.04.007
Matelsky, J. K., Johnson, E. C., Wester, B., and Gray-Roncal, W. (2022). Scalable graph analysis tools for the connectomics community. bioRxiv. doi: 10.1101/2022.06.01.494307. [Epub ahead of preprint].
Mathiisen, T. M., Lehre, K. P., Danbolt, N. C., and Ottersen, O. P. (2010). The perivascular astroglial sheath provides a complete covering of the brain microvessels: an electron microscopic 3D reconstruction. Glia 58, 1094–1103. doi: 10.1002/glia.20990
Maynard, E. A., Schultz, R. L., and Pease, D. C. (1957). Electron microscopy of the vascular bed of rat cerebral cortex. Am. J. Anat. 100, 409–433. doi: 10.1002/aja.1001000306
McHugh, T. L., Saykin, A. J., Wishart, H. A., Flashman, L. A., Cleavinger, H. B., Rabin, L. A., et al. (2007). Hippocampal volume and shape analysis in an older adult population. Clin. Neuropsychol. 21, 130–145. doi: 10.1080/13854040601064534
McInnes, L., and Healy, J. (2017). Accelerated hierarchical density based clustering. 2017 IEEE International Conference on Data Mining Workshops (ICDMW). 33–42.
McInnes, L., Healy, J., and Astels, S. (2017). Hdbscan: hierarchical density based clustering. J. Open Source Softw. 2:205. doi: 10.21105/joss.00205
Medvedev, N., Popov, V., Henneberger, C., Kraev, I., Rusakov, D. A., and Stewart, M. G. (2014). Glia selectively approach synapses on thin dendritic spines. Phil. Trans. R. Soc. B 369, 20140047–20140046. doi: 10.1098/rstb.2014.0047
Meijering, E., Carpenter, A. E., Peng, H., Hamprecht, F. A., and Olivo-Marin, J. C. (2016). Imagining the future of bioimage analysis. Nat. Biotechnol. 34, 1250–1255. doi: 10.1038/nbt.3722
MICrONS Consortium Bae, J. A., Baptiste, M., Bodor, A. L., Brittain, D., Buchanan, J., Bumbarger, D. J., et al. (2021). Functional connectomics spanning multiple areas of mouse visual cortex. bioRxiv. doi: 10.1101/2021.07.28.454025. [Epub ahead of preprint].
Mishra, A. (2017). Binaural blood flow control by astrocytes: listening to synapses and the vasculature. J. Physiol. 595, 1885–1902. doi: 10.1113/JP270979
Mohammed, H., Al-Awami, A. K., Beyer, J., Cali, C., Magistretti, P., Pfister, H., et al. (2018). Abstractocyte: a visual tool for exploring nanoscale astroglial cells. IEEE Trans. Vis. Comput. Graph. 24, 853–861. doi: 10.1109/TVCG.2017.2744278
Motta, A., Berning, M., Boergens, K. M., Staffler, B., Beining, M., Loomba, S., et al. (2019). Dense connectomic reconstruction in layer 4 of the somatosensory cortex. Science 366:eaay3134. doi: 10.1126/science.aay3134
Murphy-Royal, C., Ching, S., and Papouin, T. (2023). A conceptual framework for astrocyte function. Nat. Neurosci. 26, 1848–1856. doi: 10.1038/s41593-023-01448-8
Naik, H., Chan, A. H. H., Yang, J., Delacoux, M., Couzin, I., Kano, F., et al. (2023). 3D-POP—an automated annotation approach to facilitate markerless 2D–3D tracking of freely moving birds with marker-based motion capture. 2023 IEEE/CVF Conference on Computer Vision and Pattern Recognition (CVPR). IEEE. 21274–21284.
Neville, A. C. (1993). Biology of fibrous composites: development beyond the cell membrane. Cambridge, UK: Cambridge University Press.
Nguyen, T. M., Thomas, L. A., Rhoades, J. L., Ricchi, I., Yuan, X. C., Sheridan, A., et al. (2023). Structured cerebellar connectivity supports resilient pattern separation. Nature 613, 543–549. doi: 10.1038/s41586-022-05471-w
Ostroff, L. E., Manzur, M. K., Cain, C. K., and Ledoux, J. E. (2014). Synapses lacking astrocyte appear in the amygdala during consolidation of Pavlovian threat conditioning. J. Comp. Neurol. 522, 2152–2163. doi: 10.1002/cne.23523
Papouin, T., Ladépêche, L., Ruel, J., Sacchi, S., Labasque, M., Hanini, M., et al. (2012). Synaptic and extrasynaptic NMDA receptors are gated by different endogenous coagonists. Cell 150, 633–646. doi: 10.1016/j.cell.2012.06.029
Patrushev, I., Gavrilov, N., Turlapov, V., and Semyanov, A. (2013). Subcellular location of astrocytic calcium stores favors extrasynaptic neuron-astrocyte communication. Cell Calcium 54, 343–349. doi: 10.1016/j.ceca.2013.08.003
Pavan, M., and Pelillo, M. (2003). Dominant sets and hierarchical clustering. Proceedings 9th IEEE International Conference on Computer Vision (ICCV). 362–369.
Pavan, M., and Pelillo, M. (2006). Dominant sets and pairwise clustering. IEEE Trans. Pattern Anal. Mach. Intell. 29, 167–172. doi: 10.1109/TPAMI.2007.250608
Penny, W. D., Friston, K. J., Ashburner, J. T., Kiebel, S. J., and Nichols, T. E. (Eds.) (2011). Statistical parametric mapping: the analysis of functional brain images. London, Burlington MA, San Diego: Elsevier.
Petzold, G. C., Albeanu, D. F., Sato, T. F., and Murthy, V. N. (2008). Coupling of neural activity to blood flow in olfactory glomeruli is mediated by astrocytic pathways. Neuron 58, 897–910. doi: 10.1016/j.neuron.2008.04.029
Plaza, S. M. (2016). “Focused proofreading to reconstruct neural connectomes from EM images at scale” in Deep learning and data labeling for medical applications. ed. G. Carneiro (Cham: Springer International Publishing), 249–258.
Polykretis, I., and Michmizos, K. P. (2022). The role of astrocytes in place cell formation: a computational modeling study. J. Comput. Neurosci. 50, 505–518. doi: 10.1007/s10827-022-00828-6
Punjani, A., Rubinstein, J. L., Fleet, D. J., and Brubaker, M. A. (2017). cryoSPARC: algorithms for rapid unsupervised cryo-EM structure determination. Nat. Methods 14, 290–296. doi: 10.1038/nmeth.4169
Reuter, M., Biasotti, S., Giorgi, D., Patanè, G., and Spagnuolo, M. (2009a). Discrete Laplace–Beltrami operators for shape analysis and segmentation. Comput. Graph. 33, 381–390. doi: 10.1016/j.cag.2009.03.005
Reuter, M., Wolter, F.-E., Shenton, M., and Niethammer, M. (2009b). Laplace–Beltrami eigenvalues and topological features of eigenfunctions for statistical shape analysis. Comput. Aided Des. 41, 739–755. doi: 10.1016/j.cad.2009.02.007
Rolnick, D., Meirovitch, Y., Parag, T., Pfister, H., Jain, V., Lichtman, J. W., et al. (2017). Morphological error detection in 3D segmentations. arXiv. doi: 10.48550/arXiv.1705.10882. [Epub ahead of preprint].
Rota Bulò, S., and Pelillo, M. (2017). Dominant-set clustering: a review. Eur. J. Oper. Res. 262, 1–13. doi: 10.1016/j.ejor.2017.03.056
Rusakov, D. A. (2015). Disentangling calcium-driven astrocyte physiology. Nat. Rev. Neurosci. 16, 226–233. doi: 10.1038/nrn3878
Saalfeld, S. (2019). Computational methods for stitching, alignment, and artifact correction of serial section data. Methods Cell Biol. 152, 261–276. doi: 10.1016/bs.mcb.2019.04.007
Salmon, C. K., Syed, T. A., Kacerovsky, J. B., Alivodej, N., Schober, A. L., Sloan, T. F. W., et al. (2023). Organizing principles of astrocytic nanoarchitecture in the mouse cerebral cortex. Curr. Biol. 33, 957–972.e5. doi: 10.1016/j.cub.2023.01.043
Sanchez, M., Moore, D., Johnson, E. C., Wester, B., Lichtman, J. W., and Gray-Roncal, W. (2022). Connectomics annotation metadata standardization for increased accessibility and queryability. Front. Neuroinform. 16, 1–7. doi: 10.3389/fninf.2022.828458
Sander, J., Qin, X., Lu, Z., Niu, N., and Kovarsky, A. (2003). Automatic extraction of clusters from hierarchical clustering representations. K.-Y. Whang, J. Jeon, K. Shim, and J. Srivastava Advances in Knowledge Discovery and Data Mining. Berlin: Springer. 75–87.
Sarasua, I., Pölsterl, S., and Wachinger, C. (2022). Hippocampal representations for deep learning on Alzheimer’s disease. Sci. Rep. 12:8619. doi: 10.1038/s41598-022-12533-6
Sato, M., Bitter, I., Bender, M. A., Kaufman, A., and Nakajima, M. (2000). TEASAR: tree-structure extraction algorithm for accurate and robust skeletons. Proceedings the 8th Pacific Conference on Computer Graphics and Applications. 281–449.
Savtchouk, I., Carriero, G., and Volterra, A. (2018). Studying axon-astrocyte functional interactions by 3D two-photon Ca2+ imaging: A practical guide to experiments and “big data” analysis. Front. Cell. Neurosci. 12:98. doi: 10.3389/fncel.2018.00098
Schlegel, P., and Kazimiers, T. (2021). “schlegelp/skeletor: version 1.1.0” in Zenodo. Available at: https://zenodo.org/records/5138552
Schmidt, M., Motta, A., Sievers, M., and Helmstaedter, M. (2024). RoboEM: automated 3D flight tracing for synaptic-resolution connectomics. Nat. Methods 21, 908–913. doi: 10.1038/s41592-024-02226-5
Semyanov, A., Henneberger, C., and Agarwal, A. (2020). Making sense of astrocytic calcium signals—from acquisition to interpretation. Nat. Rev. Neurosci. 21, 551–564. doi: 10.1038/s41583-020-0361-8
Shapson-Coe, A., Januszewski, M., Berger, D. R., Pope, A., Wu, Y., Blakely, T., et al. (2021). A connectomic study of a petascale fragment of human cerebral cortex. bioRxiv. doi: 10.1101/2021.05.29.446289. [Epub ahead of preprint].
Shen, K., Fripp, J., Mériaudeau, F., Chételat, G., Salvado, O., Bourgeat, P., et al. (2012). Detecting global and local hippocampal shape changes in Alzheimer’s disease using statistical shape models. NeuroImage 59, 2155–2166. doi: 10.1016/j.neuroimage.2011.10.014
Shigetomi, E., Kracun, S., and Khakh, B. S. (2010). Monitoring astrocyte calcium microdomains with improved membrane targeted GCaMP reporters. Neuron Glia Biol. 6, 183–191. doi: 10.1017/S1740925X10000219
Shigetomi, E., Patel, S., and Khakh, B. S. (2016). Probing the complexities of astrocyte calcium signaling. Trends Cell Biol. 26, 300–312. doi: 10.1016/j.tcb.2016.01.003
Siddiqi, K., Bouix, S., Tannenbaum, A., and Zucker, S. W. (2002). Hamilton–Jacobi skeletons. Int. J. Comput. Vis. 48, 215–231. doi: 10.1023/A:1016376116653
Silversmith, W., Zlateski, A., Bae, J. A., Tartavull, I., Kemnitz, N., and Wu, J. (2022). Igneous: Distributed dense 3D segmentation meshing, neuron skeletonization, and hierarchical downsampling. Front. Neural Circuits, 16, 977700. doi: 10.3389/fncir.2022.977700
Smith, S. M., Jenkinson, M., Woolrich, M. W., Beckmann, C. F., Behrens, T. E. J., Johansen-Berg, H., et al. (2004). Advances in functional and structural MR image analysis and implementation as FSL. NeuroImage 23, S208–S219. doi: 10.1016/j.neuroimage.2004.07.051
Spacek, J. (1985). Three-dimensional analysis of dendritic spines III. Glial sheath. Anat. Embryol. 171, 245–252. doi: 10.1007/BF00341419
Spacek, J., and Lieberman, A. R. (1974). Ultrastructure and three-dimensional organization of synaptic glomeruli in rat somatosensory thalamus. J. Anat. 117, 487–516
Srinivasan, R., Huang, B. S., Venugopal, S., Johnston, A. D., Chai, H., Zeng, H., et al. (2015). Ca2+ signaling in astrocytes from Ip3r2−/− mice in brain slices and during startle responses in vivo. Nat. Neurosci. 18, 708–717. doi: 10.1038/nn.4001
Stephan, K. E., Penny, W. D., Moran, R. J., den Ouden, H. E. M., Daunizeau, J., and Friston, K. J. (2010). Ten simple rules for dynamic causal modeling. NeuroImage 49, 3099–3109. doi: 10.1016/j.neuroimage.2009.11.015
Stephensen, H. J. T., Svane, A. M., Villanueva, C. B., Goldman, S. A., and Sporring, J. (2021). Measuring shape relations using r-parallel sets. J. Math. Imaging Vis. 63, 1069–1083. doi: 10.1007/s10851-021-01041-3
Stevens, J. K., and Trogadis, J. (1984). “Computer-assisted reconstruction from serial electron micrographs: a tool for the systematic study of neuronal form and function” in Advances in cellular neurobiology. ed. S. Fedoroff (Amsterdam, Netherlands: Elsevier), 341–369.
Sun, Q., Hu, Y., Deng, S., Xiong, Y., and Huang, Z. (2022). A visualization pipeline for in vivo two-photon volumetric astrocytic calcium imaging. J. Biomed. Res. 36, 358–367. doi: 10.7555/JBR.36.20220099
Thomas, C. I., Ryan, M. A., McNabb, M. C., Kamasawa, N., and Scholl, B. (2023). Astrocyte coverage of excitatory synapses correlates to measures of synapse structure and function in primary visual cortex. bioRxiv. doi: 10.1101/2023.12.01.569664. [Epub ahead of preprint].
Tønnesen, J., Hrabĕtová, S., and Soria, F. N. (2023). Local diffusion in the extracellular space of the brain. Neurobiol. Dis. 177:105981. doi: 10.1016/j.nbd.2022.105981
Troidl, J., Warchol, S., Choi, J., Matelsky, J., Dhanyasi, N., Wang, X., et al. (2024). ViMO—visual analysis of neuronal connectivity motifs. IEEE Trans. Vis. Comput. Graph. 30, 748–758. doi: 10.1109/TVCG.2023.3327388
Turaga, S. C., Murray, J. F., Jain, V., Roth, F., Helmstaedter, M., Briggman, K., et al. (2010). Convolutional networks can learn to generate affinity graphs for image segmentation. Neural Comput. 22, 511–538. doi: 10.1162/neco.2009.10-08-881
Turner, N. L., Macrina, T., Bae, J. A., Yang, R., Wilson, A. M., Schneider-Mizell, C., et al. (2022). Reconstruction of neocortex: organelles, compartments, cells, circuits, and activity. Cell 185, 1082–1100.e24. doi: 10.1016/j.cell.2022.01.023
Urakubo, H., Bullmann, T., Kubota, Y., Oba, S., and Ishii, S. (2019). UNI-EM: an environment for deep neural network-based automated segmentation of neuronal electron microscopic images. Sci. Rep. 9:19413. doi: 10.1038/s41598-019-55431-0
van Kaick, O., Xu, K., Zhang, H., Wang, Y., Sun, S., Shamir, A., et al. (2013). Co-hierarchical analysis of shape structures. ACM Trans. Graph. 32, 1–10. doi: 10.1145/2461912.2461924
Ventura, R., and Harris, K. M. (1999). Three-dimensional relationships between hippocampal synapses and astrocytes. J. Neurosci. 19, 6897–6906. doi: 10.1523/JNEUROSCI.19-16-06897.1999
Verkhratsky, A., Parpura, V., Vardjan, N., and Zorec, R. (2019). “Physiology of astroglia” in Neuroglia in neurodegenerative diseases. eds. A. Verkhratsky, M. Ho, R. Zorec, and V. Parpura (Singapore: Springer), 45–91.
Verkhratsky, A., Semyanov, A., and Zorec, R. (2020). Physiology of astroglial excitability. Function 1:zqaa016. doi: 10.1093/function/zqaa016
Villanueva, C. B., Stephensen, H. J. T., Mokso, R., Benraiss, A., Sporring, J., and Goldman, S. A. (2023). Astrocytic engagement of the corticostriatal synaptic cleft is disrupted in a mouse model of Huntington’s disease. Proc. Natl. Acad. Sci. U.S.A. 120:e2210719120. doi: 10.1073/pnas.2210719120
Vizcarra, J. C., Gearing, M., Keiser, M. J., Glass, J. D., Dugger, B. N., and Gutman, D. A. (2020). Validation of machine learning models to detect amyloid pathologies across institutions. Acta Neuropathol. Commun. 8:59. doi: 10.1186/s40478-020-00927-4
von Deuster, C., Sammut, E., Asner, L., Nordsletten, D., Lamata, P., Stoeck, C. T., et al. (2016). Studying dynamic myofiber aggregate reorientation in dilated cardiomyopathy using in vivo magnetic resonance diffusion tensor imaging. Circ. Cardiovasc. Imaging 9:e005018. doi: 10.1161/CIRCIMAGING.116.005018
Wang, Y., DelRosso, N. V., Vaidyanathan, T. V., Cahill, M. K., Reitman, M. E., Pittolo, S., et al. (2019). Accurate quantification of astrocyte and neurotransmitter fluorescence dynamics for single-cell and population-level physiology. Nat. Neurosci. 22, 1936–1944. doi: 10.1038/s41593-019-0492-2
White, E. L., and Rock, M. P. (1980). Three-dimensional aspects and synaptic relationships of a Golgi-impregnated spiny stellate cell reconstructed from serial thin sections. J. Neurocytol. 9, 615–636. doi: 10.1007/BF01205029
Witcher, M. R., Kirov, S. A., and Harris, K. M. (2007). Plasticity of perisynaptic astroglia during synaptogenesis in the mature rat hippocampus. Glia 55, 13–23. doi: 10.1002/glia.20415
Witcher, M. R., Park, Y. D., Lee, M. R., Sharma, S., Harris, K. M., and Kirov, S. A. (2010). Three-dimensional relationships between perisynaptic astroglia and human hippocampal synapses. Glia 58, 572–587. doi: 10.1002/glia.20946
Wu, Y., Dai, Y., Lefton, K. B., Holy, T. E., and Papouin, T. (2024). STARDUST: a pipeline for the unbiased analysis of astrocyte regional calcium dynamics. bioRxiv. doi: 10.1101/2024.04.04.588196
Xenes, D., Kitchell, L. M., Rivlin, P. K., Brodsky, R., Gooden, H., Joyce, J., et al. (2022). NeuVue: a framework and workflows for high-throughput electron microscopy connectomics proofreading. bioRxiv. doi: 10.1101/2022.07.18.500521
Zhao, T., Olbris, D. J., Yu, Y., and Plaza, S. M. (2018). NeuTu: software for collaborative, large-scale, segmentation-based connectome reconstruction. Front. Neural Circuits 12:101. doi: 10.3389/fncir.2018.00101
Zung, J., Tartavull, I., Lee, K., and Seung, H. S. (2017). An error detection and correction framework for connectomics. I. Guyon. Advances in Neural Information Processing Systems. Curran Associates, Inc. Available at: https://proceedings.neurips.cc/paper_files/paper/2017/file/4500e4037738e13c0c18db508e18d483-Paper.pdf
Keywords: astrocyte, volume electron microscopy, connectomics, brain, computer vision, shape, topology, medial representations
Citation: Syed TA, Youssef M, Schober AL, Kubota Y, Murai KK and Salmon CK (2024) Beyond neurons: computer vision methods for analysis of morphologically complex astrocytes. Front. Comput. Sci. 6:1156204. doi: 10.3389/fcomp.2024.1156204
Edited by:
Jon Sporring, University of Copenhagen, DenmarkReviewed by:
Julius Kirkegaard, University of Copenhagen, DenmarkThomas J. Papouin, Washington University in St. Louis, United States
Copyright © 2024 Syed, Youssef, Schober, Kubota, Murai and Salmon. This is an open-access article distributed under the terms of the Creative Commons Attribution License (CC BY). The use, distribution or reproduction in other forums is permitted, provided the original author(s) and the copyright owner(s) are credited and that the original publication in this journal is cited, in accordance with accepted academic practice. No use, distribution or reproduction is permitted which does not comply with these terms.
*Correspondence: Christopher K. Salmon, Y2hyaXN0b3BoZXIuc2FsbW9uQG1jZ2lsbC5jYQ==; Keith K. Murai, a2VpdGgubXVyYWlAbWNnaWxsLmNh