- Electromagnetic and Electrochemical Technologies Department, National Physical Laboratory, Teddington, United Kingdom
It is expected that 6G communication technology will achieve a peak data rate capability of 1 Tbit/s. One way of reaching this goal is to employ THz frequencies for carrying wireless signals. THz frequencies have large continuous bandwidths which allow for high data rate signals. In order to support the development of THz communications and accompanying technologies, a 6G THz Communications Testbed has been set-up at the National Physical Laboratory. In this paper, the best signal performance for a variety of different baud rates and modulation schemes is explored for both a direct connection between the waveform generator and measuring oscilloscope and for several different Over-The-Air (OTA) path lengths up to 4 m specular Non-Line-of-Sight. For the direct connection, signals of up to 210 Gbit/s were achieved and data rates of up to 150 Gbit/s were achieved for OTA transmission.
Introduction
Sixth Generation (6G) mobile communication technology (Alraih et al., 2022; Monserrat et al., 2020; Chowdhury et al., 2020) is expected to support applications and use cases such as virtual reality (Fantacci and Picano, 2021), holographic calling (Shi et al., 2023) and autonomous vehicles [(He et al., 2021), (Azari et al., 2022)], all of which require the use of high data rate signals not supported by 5G. In fact, peak data rate is anticipated to increase from the 5G maximum of approximately 10 Gbit/s to 1 Tbit/s in 6G (Banafaa et al., 2023). One way of realizing this data rate increase, particularly for short range applications, is to use THz frequencies for communication signaling (Jiang et al., 2024). THz frequencies have the advantage of having large continuous bandwidths which allow for high data rate transmission (Elayan et al., 2020) and, for frequencies between 0.1–0.5 THz, atmospheric absorption is relatively low making THz wireless communication possible (Taleb et al., 2023).
Though THz frequencies are capable of supporting very high data rate signals, communication technologies at these frequencies have several important challenges to overcome in order to be commercially viable. These include the low-power of available sources (Rikkinen et al., 2020), low energy-efficiency (Halbauer and Wild, 2021) and price point of commercially available technology. Furthermore, as THz radiation can be blocked by obstacles such as buildings and people, beamforming and beam-steering solutions (Xue et al., 2024) are also required to support most THz communication use cases.
To support the continued development of THz communication technologies, a 6G THz Communication Testbed functioning within the 220–330 GHz band has been developed at the National Physical Laboratory (NPL). The purpose of this testbed is to provide a flexible, high-specification environment on which to test THz communication devices and accessories. The testbed has the advantage of a specular Non-Line-of-Sight (NLoS) wireless path which allows for greater flexibility in positioning test artifacts that reflect the beam. In this paper, the testbed set-up is presented, and its performance is characterized.
Materials and methods
The testbed
The 6G THz Communication Testbed is shown in Figure 1. The THz wireless signal is generated in the up-converter (Virginia Diodes, Model: CCU) by mixing a carrier frequency between 220–330 GHz and a modulated waveform created by the Arbitrary Waveform Generator (Keysight, Model: M9502A) with a bandwidth of up to 30 GBd. The carrier frequency is produced by multiplying by 12 a local oscillator signal produced by an Analog Signal Generator (Keysight, Model: E8257D) fed to the up-converter. The modulated waveform is formulated using the IQ tools software. For the characterization measurements presented in this paper, a carrier frequency of 300 GHz has been used. This was produced using a 6 dBm, 25 GHz local oscillator signal from the Analog Signal Generator.
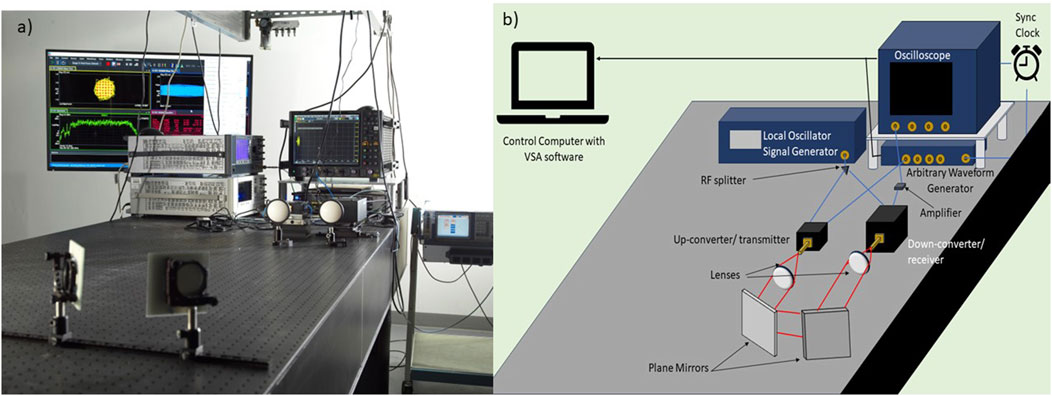
Figure 1. (A) The 6G THz Communication Testbed, (B) Schematic of the testbed with all constituent parts and connections labelled.
Once mixed, the THz signal is sent out Over-The-Air (OTA) via a diagonal horn antenna. The divergent OTA signal is collimated using a PTFE lens (Thorlabs) and then reflected off two plane mirrors before being focused by a second lens onto a down-converter (Virginia Diodes, Model: SAX) that acts as a receiver. The down-converter removes the carrier frequency using the same local oscillator signal sent to the up-converter as a reference, keeping synchronization between the two. The remaining modulated signal is sent on to the oscilloscope (Keysight, Model: UXR0704A), passing through a 25 dB amplifier (SHF Communication Technologies, Model: SHF S824 A). From the oscilloscope, the waveform data is sent to the Keysight VSA software (Keysight Technologies, 2000-2024) which demodulates the signal to retrieve the data and provide signal performance metrics such as Error Vector Magnitude (EVM) and Signal-to-Noise Ratio (SNR). The oscilloscope and Arbitrary Waveform Generator (AWG) are locked using an RF synthesizer which receives a 10 MHz reference signal from the oscilloscope and produces a 285 MHz clock signal for the AWG.
Waveform correction
As the THz signal travels through cables, equipment and OTA, it can undergo distortion due to non-ideal channel responses. This causes additional degradation in the demodulated signal that can lead to higher EVM values and lower SNR. Using the VSA software, it is possible to create a pre-distortion for the modulated waveform to correct for these non-ideal channel responses.
The correction process can be triggered using the so-called “calibration” function in the IQ tools software. First, an undistorted version of the desired THz signal is sent around the beam path. The signal is then demodulated by the VSA software which uses an adaptive Finite Impulse Response (FIR), feed-forward equalization filter compensating linear distortion from the signal. The equalization filter runs until the user confirms that the best possible convergence has been reached. In practice, this is determined through closely monitoring the EVM value produced by the VSA software for its optimum value. This can take from around 20 s to several minutes depending on the signal bandwidth and beam path length. At this stage IQ Tools reads the filter coefficients carrying channel and hardware impairments from VSA software, then applies a corresponding correction to the original waveform.
An example of this correction process, performed on a 5GBd QPSK signal over a 3 m OTA beam path, is shown in Figure 2. The EVM of the uncorrected constellation diagram (Figure 2A) was 13.5%, after running the calibration procedure and applying the generated correction files (Figures 2B, C) the EVM of the resulting signal was reduced to 4.4%.
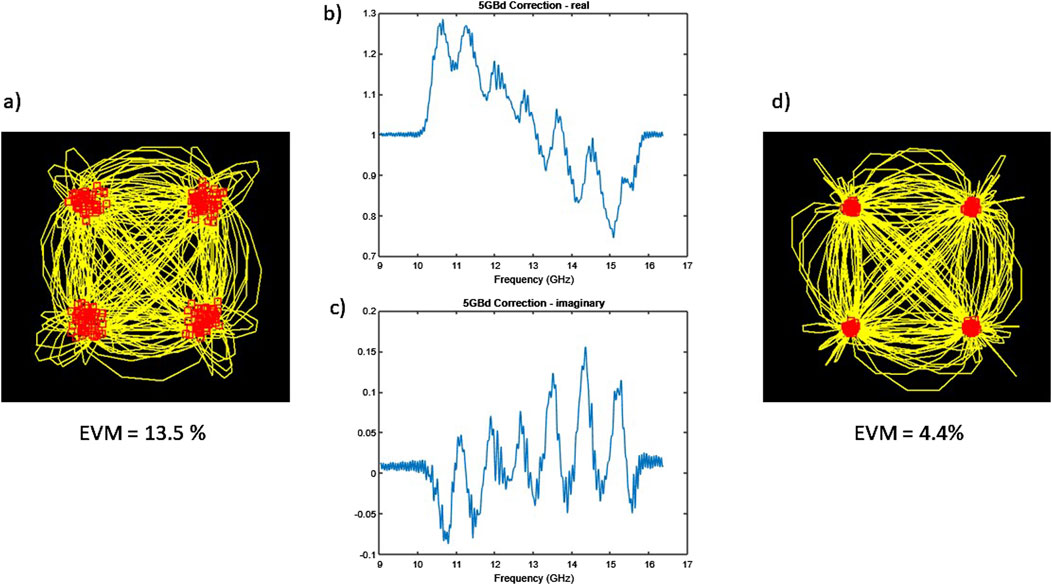
Figure 2. (A) Shows the constellation plot for a 5GBd QPSK signal over a 3 m beam path before any correction is applied. A calibration has been performed and the (B) real and (C) imaginary parts of the generated correction file are shown. (D) Shows the constellation diagram for the 5GBd signal after the correction file has been applied.
When aiming to produce a signal with a higher-spectrally efficient modulation scheme such as QAM-64, a QPSK signal of the same baud rate is used to create the initial correction file. This allows for higher-spectrally efficient signals to be demodulated when a recognizable constellation diagram would otherwise not be achieved. In high baud rate instances where a QPSK constellation diagram is not retrievable before calibration, the correction file from a lower baud rate signal may be applied first and the calibration function can then be used to adjust the correction file to improve the higher baud rate signal.
The correction files generated during this calibration process may be stored for reuse. However, at these frequencies and bandwidths even minor changes to the set-up or environment can significantly alter linear distortions, typically requiring re-calibration.
Results and discussion
In order to understand how the various elements of the testbed affect the signal performance, the EVM values of a variety of modulation scheme and baud rate signals have been measured for different testbed configurations. First, the simplest variation of the testbed is studied by directly connecting the AWG, which produces the modulated waveform, to the oscilloscope, which measures it. This represents the best possible performance of the testbed before OTA elements are introduced, adding additional noise and distortion to the signal. Following this, the best EVM performance is shown for a very short OTA path where the transmitter and receiver have been positioned just a few cm’s away from each other. This performance shows the best achievable OTA performance before any optics, atmospheric absorption or diffuse reflections can result in path loss and a subsequent degradation to the signal. Finally, specular NLoS beam paths of 3 m and 4 m length are investigated. These longer beam paths contain lenses and plane mirrors to reflect the signal which can cause power loss via Fresnel reflections, diffuse reflections and misalignment. Furthermore, comparing the 3 m and 4 m paths, which differ only in the distance between the plane mirrors and lenses, gives insight into the realistic effect of atmospheric absorption and misalignment/propagation losses over realistic distances for many short range THz communication applications.
Arbitrary Waveform Generator to oscilloscope
As mentioned in the previous section on waveform correction, cables, equipment and the OTA beam path can all introduce distortions to the waveform that result in a worsening of the EVM/SNR performance of the signal. This ultimately leads to a limitation in the signal baud rate and modulation scheme that can be successfully demodulated. In order to understand the maximum performance capability of the testbed, the AWG was directly connected to the oscilloscope. In this case, only one cable and the intrinsic performance of the AWG and oscilloscope themselves can affect the signal performance. Figure 3 below shows the EVM and SNR performance for various baud rate signals utilizing six different modulation schemes: QPSK, QAM-16, QAM-32, QAM-64, QAM-128 and QAM-256. The figure shows the EVM performance with waveform correction applied.
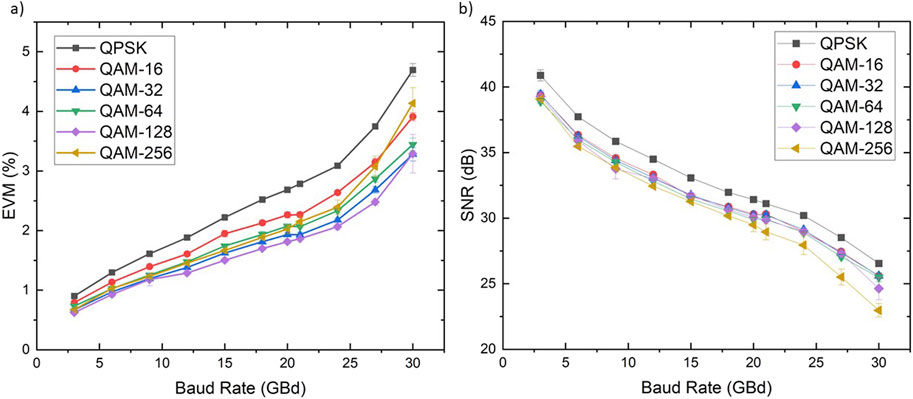
Figure 3. Shows (A) the EVM and (B) the SNR performance of various baud rate signals sent directly from the AWG to the oscilloscope for various modulation schemes. The EVM and SNR values shown are an average of 5 recorded values and the associated error bars indicate the standard deviation of the values.
Figure 3A shows the EVM performance for the different modulation schemes. Each modulation scheme shows an increase in EVM and a decrease in SNR for increasing baud rate. This is due to increased noise produced by the testbed hardware as it is required to cope with a larger frequency range for higher baud rate symbols. As these results were produced via a direct connection between the AWG and the oscilloscope this additional distortion only has three possible sources: the AWG, the cable to the oscilloscope and the oscilloscope.
For the square modulation schemes (modulation scheme shapes can be seen in Figure 4) QPSK, QAM-16, QAM-32 and QAM-64, the EVM value of the signals reduces with increasing spectral-efficiency until a baud rate of 20 GBd is reached. This is as expected as the space between the symbols within the constellation diagrams becomes smaller with increasing spectral-efficiency, and therefore require better EVM performance to resolve the individual symbols. At 20 GBd, the QAM-256 signal crosses the QAM-64 and then crosses the QAM-16 performance just after 27 GBd. This is due to the demodulated QAM-256 signal becoming unstable, with the live constellation diagram occasionally collapsing. This is also evidenced by the larger errors in the EVM values for QAM-256 after 20 GBd. The non-square modulation schemes, QAM-32 and QAM-128, had better EVM performance than the square ones. As with the other modulation formats, the more spectrally-efficient modulation scheme, QAM-128, has a better EVM performance until the 30 GBd signal where QAM-128 also begins to suffer from instability within the constellation diagram.
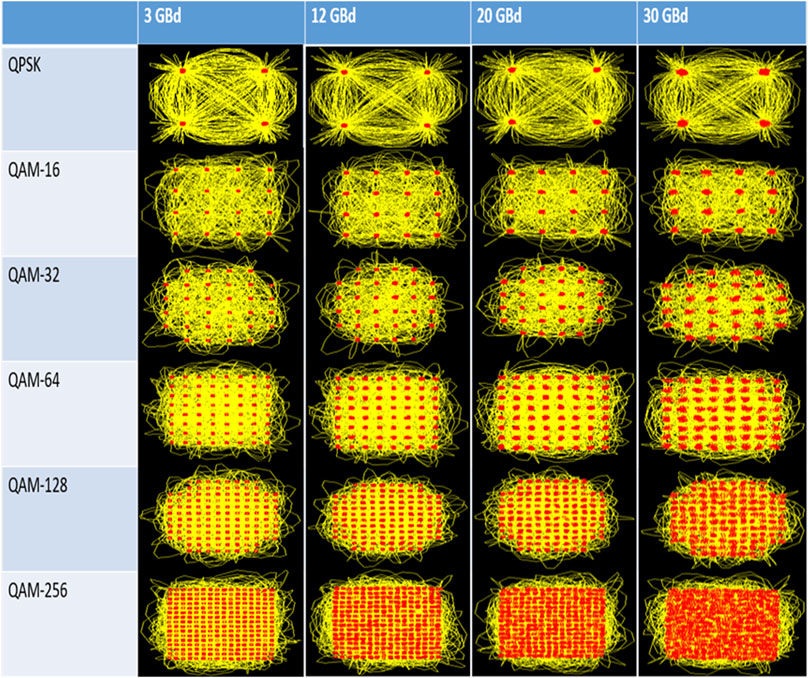
Figure 4. Constellation diagrams for various baud rates and modulation schemes signals after waveform correction has been applied and sent directly from the AWG to the oscilloscope.
The SNR performance shown in Figure 3B shows similar values for all modulation schemes, apart from QPSK, until 20 GBd when the QAM-256 modulation scheme begins to degrade at a faster rate compared to the others. QAM-128 also shows a worse performance at 30 GBd compared to the others. This is consistent with the onset of the observed instability in the demodulated constellation diagram. That no other modulation scheme shows evidence of this instability indicates that successfully demodulated signals at even higher baud rates should be possible with all other schemes. No higher baud rate signals have been investigated here as the testbed up- and down-converters have a 30 GHz bandwidth.
For all modulation schemes the signal performance begins to degrade at a faster rate after 25 GBd. This is due to hardware limitations in the set-up. The oscilloscope has a per-channel bandwidth of 70 GHz and so is not expected to have a degradation in performance at 25 GHz so this is likely due to the performance of the cable or connectors.
The constellation diagrams for several of the baud rates in Figure 3 are shown in Figure 4. It can be seen from Figure 4 that the symbols within all constellation diagrams are separated from one another with the exception of the 30 GBd QAM-128 and 20 GBd and 30 GBd QAM-256 diagrams. This is consistent with the increase in EVM/decrease in SNR seen for these signals in Figure 3. As the baud rates increase, the symbol spot size increases and undergoes distortion from the original square shape shown in the 3GBd constellation diagrams.
Over-the-air signal performance
It is expected that the addition of cables, up- and down-converters, OTA beam path elements and amplifier to the path between the AWG-generated waveform and the oscilloscope will increase the distortion and noise present in the received signal. As a result the EVM performance of the same signals will degrade significantly. To explore the effect of these additional sources of noise and distortion, the EVM of the demodulated signal has also been measured for a variety of data rates and modulation schemes over different beam path lengths. The best performance for an Over-The-Air signal has been measured for the QAM-64 modulation scheme when the signal and receiver are face-to-face approximately 3.5 cm apart. The results of these measurements are shown in Figure 5.
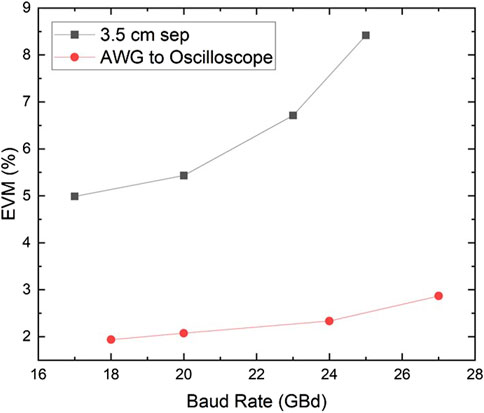
Figure 5. Shows the EVM values for various data rates with the transmitter and receiver ∼3.5 cm apart (black line) and for the AWG connected directly to the oscilloscope (red line) using QAM-64 modulation. The EVM values shown are an average of 5 recorded values.
The maximum data rate achieved with these OTA measurements was 150 Gbit/s using a baud rate of 25 GBd. The EVM achieved for a data rate of 120 Gbit/s, the data rate required to run a 100 Gbit/s signal with error correction, was approximately 5.5%. This is a significant increase from the 2.1% EVM value for a QAM-64, 120 Gbit/s signal sent directly from the AWG to the oscilloscope. Due to the number of potential noises sources that have been added to the system for this measurement compared to the direct AWG to oscilloscope connection, a large increase in EVM is to be expected. In particular, the cabling used within the set up may be contributing a lot of distortion–particularly at these very high baud rates. As we have no reflections in the beam path and it is not sufficiently long enough for much power to have been lost to atmospheric absorption or free space propagation, this represents the best OTA signal performance currently achievable with the testbed. It is therefore expected that increasing the beam path and adding specular NLoS elements such as plane mirrors will result in further increasing the EVM of the signal.
The best achievable signals were also measured for a 3 m beam path with signals using QPSK, QAM-16, QAM-32 and QAM-64 modulation schemes. The results of these measurements are shown in Figure 6.
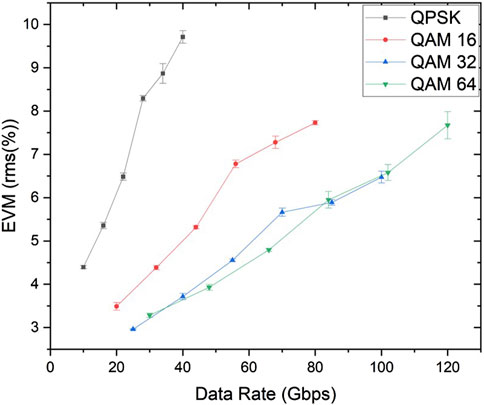
Figure 6. Shows the average EVM values for different data rates and modulation schemes over a 3 m beam path. Error bars show the standard deviation of the 5 measured EVM values.
The EVM values shown in Figure 6 are an average of 5 recorded values, error bars are shown on the graph to indicate the standard deviation of these measurements. The graph shows that, in general, the higher the modulation scheme used, the lower the EVM value observed for any given data rate. However, the QAM-32 and QAM-64 measurements cross and overlap at both the highest and lowest data rates. It should be noted that at the high data rates, the standard deviation of the EVM measurements is larger for QAM-64 than for QAM-32, whereas at the lowest board rates the QAM-32 EVM becomes lower. The crossing at the highest baud rates can be explained by the constellation diagram of QAM-64 beginning to become unstable as was observed for the QAM-128 and QAM-256 signals in the AWG-to-oscilloscope direct connection measurements. It is interesting to note that in the direct connection measurements the QAM-32 EVM was consistently lower than that of the QAM-64 signal however this doesn’t seem to hold true of the OTA measurements. As with the direct connection measurements, the difference in the performance between the QAM-32 and QAM-64 signals with similar EVM values becomes obvious when looking at the constellation diagrams produced by the VSA software. A selection of which are shown in Figure 7 for three different baud rates and QAM-32 and -64 modulation schemes.
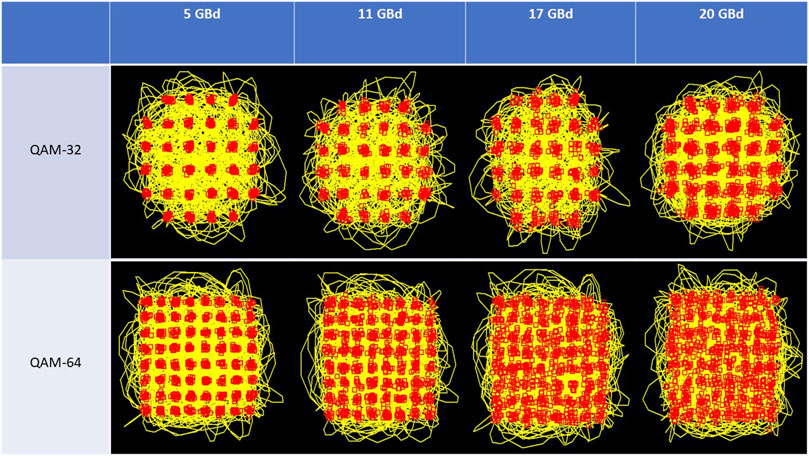
Figure 7. Shows constellation diagrams for 4 different baud rates: 5 GBd, 11 GBd, 17 GBd and 20 GBd, for QAM-32 and QAM-64 modulation schemes for signals transmitted around a 3 m OTA beam path.
From Figure 6, it can be seen that the EVM values for 102 Gbit/s using QAM-64 and 100 Gbit/s using QAM-32 are similar, 6.6% and 6.5%, respectively. Figure 7 shows the constellation diagrams for these two signals, 20 GBd for QAM-32 and 17 GBd for QAM-64. Whilst the points within the QAM-32 constellation plot are largely separated from one another, the QAM-64 plot shows many areas of overlap and distortion. This shows that the EVM value alone is not a sufficient indicator of signal performance to distinguish between data rates achieved using different combinations of baud rate and modulation scheme. However, crossings of the EVM vs. baud rate graph can be indicative of the constellation diagram for one modulation scheme beginning to become unstable.
All signals measured in Figures 6, 7 have been corrected by performing a calibration using the VSA software on the QPSK signal for every baud rate used. These correction files generated from these calibrations which were then applied to the waveform being transmitted. The real and imaginary parts of those correction files are shown in Figures 8A, B.
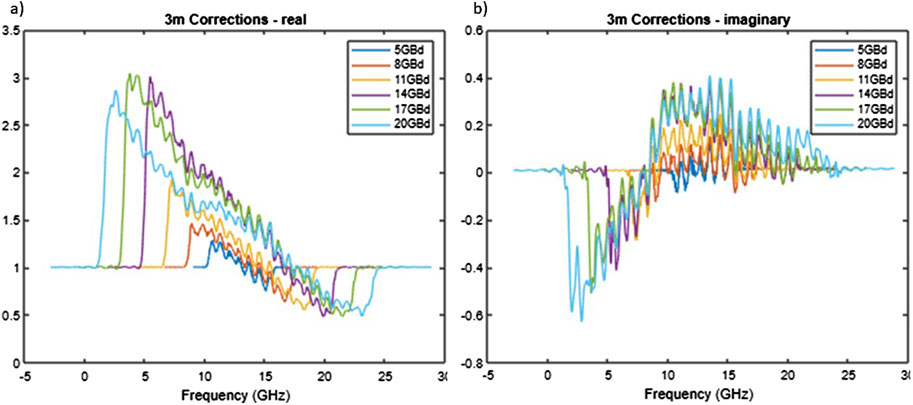
Figure 8. Shows the (A) real and (B) imaginary parts of the correction files applied to the different baud rate signals transmitted around a 3 m OTA beam path.
The correction is applied across the frequencies used within the signal with the 20 GBd signal having the largest range, between 3–23 GHz, with a central frequency of 13 GHz. In general, the correction becomes more significant the higher the baud rate used. The correction shows large changes at the edge of the spectrum as baud rate increases where frequencies that were not previously included in the signal bandwidth must now be included in the correction. Furthermore, whilst the shape of the correction for the central frequencies remains relatively constant for the different baud rate files, the magnitude of this correction increases for increasing baud rates. This indicates that more pre-distortion of the waveform must be applied to create a flat spectrum response in the received signal.
QAM-64 signals have also been compared for 3 m and 4 m beam paths. The results of this are shown in Figure 9. The EVM values for the 4 m beam path are consistently higher than those for 3 m for the same data rate. This is to be expected as signal power is likely reduced over the longer beam path so the signal-to-noise on the received signal will be reduced. The degradation in signal performance is particularly noticeable at higher data rates. It should be noted that the 3 m QAM-64 performance shown here has been studied in further detail in a previous work (Fatadin et al., 2024) and, at the time of publication, constitutes the highest data rate performance over this length of beam path for this type of electronics-based THz generation (Rodriguez-Vazquez et al., 2019; Lai et al., 2021; Abdo et al., 2021; Hamada et al., 2020).
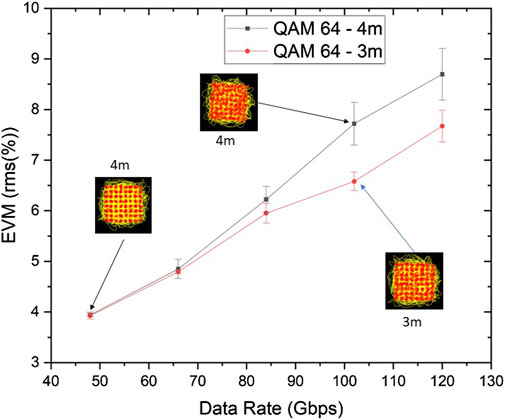
Figure 9. Shows the average EVM value for different data rate QAM 64 signals over a 3 m and 4 m beam path. The standard deviations of the recorded EVM values are shown as error bars for each point.
The standard deviations of the EVM values shown in Figure 9 are also greater for the 4 m beam path data at higher data rates. This is indicative of an unstable constellation diagram and the constellation diagram inserts shown in Figure 9 support this.
Power measurements
A significant factor in the signal performance degradation as the beam path becomes longer is likely to be loss of signal around the beam path. Measurements of both the power emitted from the up-converter and received by the down-converter have been taken. These measurements have been performed for both corrected and un-corrected signals around the 3 m OTA beam path to demonstrate the effect of the pre-correction files on the signal power.
The power of the signal emitted from the up-converter has been measured and is shown in Figure 10A. A calibrated SLT (Sensor-und Laser Technik 10 HS) THz pyroelectric detector was used to measure the power, and this was positioned a few mm’s directly in front of the up-converter antenna aperture. A chopper was placed between the antenna and detector to apply a 25 Hz modulation to the signal in order for the detector to function. The power was measured using a lock-in amplifier (Signal Recovery, Model: 7265).
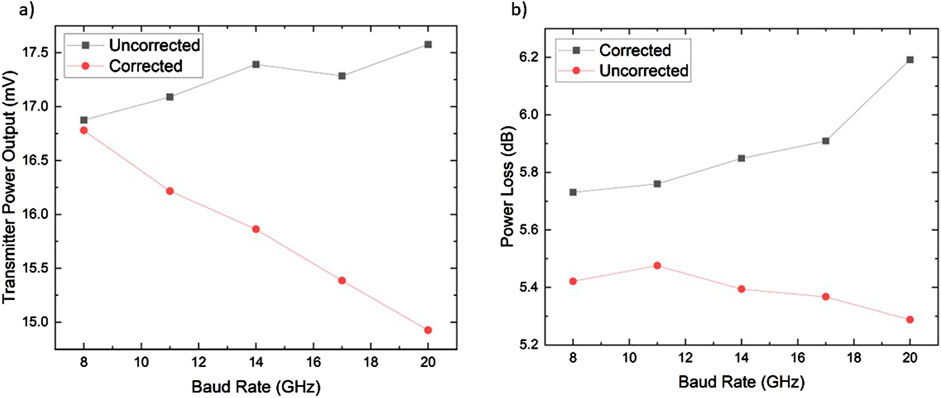
Figure 10. (A) Shows the measured power output from the transmitter in mV for the different Baud rates used with and without the correction file applied. (B) Shows the power loss in dB over the 3 m beam path measured at the receiver for the different Baud rates used with and without correction.
As can be seen from Figure 10A, the signal power when no correction file is applied remains somewhat constant for all baud rates ranging from around 17–17.5 mV. When the correction file is applied the signal power drops approximately linearly with the baud rate. This is likely due to the corrections required by the higher baud rates being more extreme than those required by the lower baud rates.
The power at the receiver position was also measured by moving the receiver back and placing the pyroelectric detector in the receiver position, in the focus of the beam after the PTFE lens. The power lost over the beam path for the different baud rates is shown in Figure 10B. As with the measurements in Figure 10A, the power loss when no correction is applied remains relatively constant at around 5.4 dB. Contributing factors to this power loss may include misalignment of the optics within the beam path, imperfect collimation of the beam by the PTFE lenses, diffuse reflections at the plane mirrors caused by dust or small scratches and the size of the focus spot compared to the receiver antenna opening. In order to understand the significance of these losses, an ideal version of the testbed can be considered where all transmitted power is collimated by the first lens, perfectly reflected by the plane mirrors and focused by the second lens into the receiver antenna. There would still be power loss due to atmospheric absorption (0.015 dB for 300 GHz at 3 m), Fresnel reflections from the PTFE lenses (approximately 0.14 dB per lens) and a small loss from the skin depth of the plane mirrors (less than 0.04 dB per mirror). In total, these contributions lead to a 0.375 dB loss of power around the 3 m ideal beam path, meaning that the imperfections to the beam path discussed above account for around 5 dB of the 5.4 dB loss.
When the correction file is applied, less of the transmitted power is received at higher baud rates, although in this case, the trend is non-linear. It is expected that most of the power lost along the beam path is lost when reflecting the beam off the flat mirrors.
Summary
In this paper, a 6G THz Communication Testbed has been presented and characterized. The best signal performance for different modulation schemes has been explored for both a direct connection between the AWG and oscilloscope and for an OTA signal travelling over several different path lengths. For the direct connection measurements, stable constellation diagrams at a baud rate of 30 GBd were achieved for QPSK, QAM-16, QAM-32 and QAM-64 modulation schemes with a maximum data rate of 180 Gbit/s for the QAM-64 signal. An unstable but recognizable constellation diagram was also achieved for QAM-128 at 30 GBd producing a 210 Gbit/s signal. For the OTA measurements, the highest data rate signals achieved at each path length were 150 Gbit/s, 120 Gbit/s and 102 Gbit/s for 3.5 cm, 3 m and 4 m beam paths, respectively In each of these cases QAM-64 was used as the signal modulation scheme. Investigating the signal quality of beam paths longer than 4 m was not possible as the path length of the testbed is currently limited to the length of the optical table. Increasing the maximum length of the beam path would greatly benefit the testbed as most THz communication applications would require a distance of >10 m. Future development of the testbed will include multiple reflections to increase the effective beam path length the signal travels.
During these investigations, the power loss over the 3 m beam path was investigated and found to be approximately 5.4 dB for uncorrected waveforms. For waveforms where a pre-correction file has been applied, the power loss was greater and increased with increasing baud rate. A significant contributor to this power loss is the use of the plane mirrors for reflecting the light. Lower power loss could be achieved through the use of parabolic mirrors in the plane mirror position to collect the light from the transmission arm and ensure it is well collimated before being sent to the receiver lens. Plans are in place to position permanent parabolic mirrors at the end of the optical table to provide a consistent, ‘best performance’ beam path whilst the plane mirrors will continue to be used for rapid path length variation. Another way of reducing power loss and improving the flexibility of the testbed would be to enable point-to-point links by increase the distance that the transmitter and receiver can operate when in the face-to-face position. This is currently limited by the lengths of the cables which do not allow for the transmitter and receiver to move far away from one another.
At the time of this paper, the testbed is set up for producing THz signals through electronic generation techniques like those used for RF and microwave frequencies. Many THz communication devices currently being developed with both industry and academia produce THz signals through “photonic generation”[(Nellen et al., 2022), (Ding et al., 2023), (Deumer et al., 2024)]. In these cases, a gain medium is pumped by two laser beams slightly offset in frequency by the THz frequency to be generated. Creating a THz signal using this kind of device requires tunable lasers, an optical modulator and various laser/optical fibre components such as optical amplifiers, optical attenuators and polarization controllers. A second arm to the testbed has been planned to produce photonically generated THz signals in order to cater for the testing of these devices.
Data availability statement
The raw data supporting the conclusions of this article will be made available by the authors, without undue reservation.
Author contributions
JS: Data curation, Formal Analysis, Investigation, Methodology, Visualization, Writing - original draft, Writing - review and editing. YG: Methodology, Writing - review and editing. IF: Conceptualization, Funding acquisition, Methodology, Supervision, Writing - review and editing.
Funding
The author(s) declare that financial support was received for the research, authorship, and/or publication of this article. This work was supported by the U.K. Government’s Department for Science, Innovation and Technology (DSIT), National Physical Laboratory (NPL).
Acknowledgments
The authors of this work would like to thank Keysight for their support on the use of the VSA software.
Conflict of interest
The authors declare that the research was conducted in the absence of any commercial or financial relationships that could be construed as a potential conflict of interest.
Publisher’s note
All claims expressed in this article are solely those of the authors and do not necessarily represent those of their affiliated organizations, or those of the publisher, the editors and the reviewers. Any product that may be evaluated in this article, or claim that may be made by its manufacturer, is not guaranteed or endorsed by the publisher.
References
Abdo, I., Hamada, H., Nosaka, H., Shirane, A., and Okada, K. (2021). 64 QAM wireless link with 300 GHz InP-CMOS hybrid transceiver. IEICE Electron. Express 18 (17), 20210314–4. doi:10.1587/elex.18.20210314
Alraih, S., Shayea, I., Behjati, M., Nordin, R., Abdullah, N. F., Abu-Samah, A., et al. (2022). Revolution or evolution? Technical requirements and considerations towards 6G mobile communications. Sensors 22 (3), 762. doi:10.3390/s22030762
Azari, M., Solanki, S., Chatzinotas, S., and Bennis, M. (2022). THz-empowered UAVs in 6G: opportunities, challenges, and trade-offs. IEEE Commun. Mag. 60 (5), 24–30. doi:10.1109/mcom.001.2100889
Banafaa, M., Shayea, I., Din, J., Hadri Azmi, M., Alashbi, A., Ibrahim Daradkeh, Y., et al. (2023). 6G mobile communication technology: requirements, targets, applications, challenges, advantages and opportunities. Alexandria Eng. J. 64, 245–274. doi:10.1016/j.aej.2022.08.017
Chowdhury, M. Z., Shahjalal, Md, Ahmed, S., and Jang, Y. M. (2020). 6G wireless communication systems: applications, requirements, technologies, challenges, and research directions. IEEE Open J. Commun. Soc. 1, 957–975. doi:10.1109/ojcoms.2020.3010270
Deumer, M., Nellen, S., Lauck, S., et al. (2024). Ultra-wideband PIN-pd THz emitter with > 5.5 THz bandwidth. J. Infrared, Millim. Terahertz Waves., 2024. doi:10.1007/s10762-024-01001-z
Ding, J., Yu, J., Li, W., Wang, K., Zhou, W., Zhang, J., et al. (2023). High-speed and long-distance photonics-aided Terahertz wireless communication. J. Light. Technol. 41 (11), 3417–3423. doi:10.1109/jlt.2023.3251976
Elayan, H., Amin, O., Shihada, B., Shubair, R. M., and Alouini, M.-S. (2020). Terahertz band: the last piece of RF spectrum puzzle for communication systems. IEEE Open J. Commun. Soc. 1, 1–32. doi:10.1109/ojcoms.2019.2953633
Fantacci, R., and Picano, B. (2021). Edge-based virtual reality over 6G Terahertz channels. IEEE Netw. 35 (5), 28–33. doi:10.1109/mnet.101.2100023
Fatadin, I., Smith, J., Gui, Y., Nickeleit, I., Park, J., and Hesler, J. L. (2024). Demonstration of 120 Gbit/s 64-QAM wireless link operating in the 300 GHz band. IEEE Access 12, 31159–31167. doi:10.1109/access.2024.3368884
Halbauer, H., and Wild, T. (2021). “Towards power efficient 6G sub-THz transmission,” in 2021 joint European conference on networks and communications and 6G summit (EuCNC/6G summit), 8-11 june 2021, Porto, Portugal, 08-11 June 2021 (IEEE), 25–30.
Hamada, H., Tsutsumi, T., Matsuzaki, H., Fujimura, T., Abdo, I., Shirane, A., et al. (2020). 300-GHz-Band 120-Gb/s wireless front-end based on InP-HEMT PAs and mixers. IEEE J. Solid-State Circuits 55 (9), 2316–2335. doi:10.1109/jssc.2020.3005818
He, J., Yang, K., and Chen, H.-H. (2021). 6G cellular networks and connected autonomous vehicles. IEEE Netw. 35 (4), 255–261. doi:10.1109/mnet.011.2000541
Jiang, W., Zhou, Q., He, J., Habibi, M. A., Melnyk, S., El-Absi, M., et al. (2024). Terahertz communications and sensing for 6G and beyond: a comprehensive review. IEEE Commun. Surv. and Tutorials, 1–56. doi:10.1109/comst.2024.3385908
Keysight Technologies (2000-2024). PathWave vector signal Analysis (89600 VSA). Keysight Technol. Available at: https://www.keysight.com/us/en/products/software/pathwave-test-software/89600-vsa-software.html (Accessed July 25, 2024).
Lai, Z., Li, C., Li, Y., et al. (2021). “A high-order modulation (64-QAM) broadband THz communication system over 100 Gbps,” in 2021 IEEE 4th international conference on electronic information and communication technology (ICEICT), Xi’an, China, 18-20 August 2021 (IEEE), 553–556.
Monserrat, J. F., Martin-Sacristan, D., Bouchmal, F., et al. (2020). “Key technologies for the advent of the 6G,” in 2020 IEEE wireless communications and networking conference workshops (WCNCW), 06-09 april 2020, Seoul, Korea (South), 06-09 April 2020 (IEEE), 1–6.
Nellen, S., Lauck, S., Peytavit, E., Szriftgiser, P., Schell, M., Ducournau, G., et al. (2022). Coherent wireless link at 300 GHz with 160 Gbit/s enabled by a photonic transmitter. J. Light. Technol. 40 (13), 4178–4185. doi:10.1109/jlt.2022.3160096
Rikkinen, K., Kyosti, P., Leinonen, M. E., Berg, M., and Parssinen, A. (2020). THz radio communication: link budget Analysis toward 6G. IEEE Commun. Mag. 58 (11), 22–27. doi:10.1109/mcom.001.2000310
Rodriguez-Vazquez, P., Grzyb, J., Heineman, B., and Pfeiffer, U. R. Optimization and performance limits of a 64-QAM wireless communication link at 220-260 GHz in SiGe HBT technology. In: 2019 IEEE radio and wireless symposium (RWS), Orlando, USA, 20–23 January 2019 (IEEE), 2019. p. 1–3.
Shi, A., Sun, F., and Li, M. An exploration of holographic scenarios in 6G networks. (2023). In: 2022 10th international conference on information systems and computing technology (ISCTech), Guilin, China, 28–30 December 2022 (IEEE). p. 450–456.
Taleb, F., Alfaro-Gomez, M., Al-Dabbagh, M. D., Ornik, J., Viana, J., Jäckel, A., et al. (2023). Propagation of THz radiation in air over a broad range of atmospheric temperature and humidity conditions. Sci. Rep. 13, 20782. doi:10.1038/s41598-023-47586-8
Keywords: Terahertz, 6G, wireless communication, THz communication, THz testbed
Citation: Smith JF, Gui Y and Fatadin I (2024) Measuring the peak performance of a 6G THz communication testbed. Front. Antennas Propag. 2:1471091. doi: 10.3389/fanpr.2024.1471091
Received: 26 July 2024; Accepted: 07 October 2024;
Published: 17 October 2024.
Edited by:
Ghanshyam Singh, University of Johannesburg, South AfricaReviewed by:
Hasan Tahir Abbas, University of Glasgow, United KingdomAhmad Bazzi, New York University Abu Dhabi, United Arab Emirates
Copyright © 2024 Smith, Gui and Fatadin. This is an open-access article distributed under the terms of the Creative Commons Attribution License (CC BY). The use, distribution or reproduction in other forums is permitted, provided the original author(s) and the copyright owner(s) are credited and that the original publication in this journal is cited, in accordance with accepted academic practice. No use, distribution or reproduction is permitted which does not comply with these terms.
*Correspondence: J. F. Smith, amVzcy5zbWl0aEBucGwuY28udWs=
 J. F. Smith
 Y. Gui
 I. Fatadin