- 1Faculty of Science and Engineering, Iwate University, Morioka, Japan
- 2Graduate School of Arts and Sciences, Iwate University, Morioka, Japan
- 3Faculty of Agriculture, Iwate University, Morioka, Japan
- 4Agri-Innovation Center, Iwate University, Morioka, Japan
This study investigates the potential of using visual features to predict key material attributes in wakame, focusing on thickness, strength, and chlorophyll content (SPAD values). We compared frozen and salted wakame samples to understand how different processing methods affect these predictions. Using a combination of RGB, L*a*b*, and HSV color features, we developed and evaluated various regression models, including simple linear regression, quadratic regression, and random forests. Our results indicate that color features can effectively predict SPAD values, particularly in frozen samples, with the best models achieving an R2 of 0.900. However, predicting thickness and strength proved more challenging, with models showing limited predictive power. Interestingly, strength predictions were more accurate for salted samples, suggesting that salt curing may enhance the relationship between visual features and physical strength. We found that processing methods significantly impact the effectiveness of prediction models. Freezing appears to better preserve the original optical properties of wakame, while salt curing introduces greater complexity, necessitating more sophisticated modeling approaches. This study contributes to the development of rapid, non-destructive methods for assessing wakame quality, which is crucial for the growing wakame industry. Our findings highlight the potential of visual analysis in wakame quality assessment while also emphasizing the need for tailored approaches based on processing methods. Future work should focus on refining these models and exploring additional factors that influence wakame properties.
1 Introduction
Wakame [Undaria pinnatifida (Alaria pinnatifida Harvey)], a highly versatile marine resource, is receiving growing global attention as an edible seaweed due to its substantial economic and ecological value. Current challenges in the industry include the need for rapid, non-destructive, and reliable quality assessment methods, especially as traditional methods are labor-intensive and often inconsistent. This research highlights the need for innovative approaches to overcome these limitations and meet the quality demands of large-scale production. As Japan's primary wakame production region, the Sanriku area plays a crucial role in meeting these demands; the area's favorable geographical conditions significantly enhance wakame growth and quality.
The Sanriku region is one of the world's top three fishing grounds. Here, the cold Oyashio Current flows from the north and meets the warm Kuroshio Current from the south, creating a convergence zone that results in an abundance of plankton. These plankton attract small fish, which in turn draw in larger fish such as Pacific saury, bonito, and mackerel, making this area a crucial hub for Japan's seafood catch. From autumn to winter, which is the key growing season for wakame, the cold current brings abundant nutrients and maintains ideal water temperatures for growth. This results in thick, elastic, and flavorful wakame. The Sanriku area produces about 70% of Japan's wakame (as of 2022). Of this, Miyagi Prefecture leads with a production of 22,052 tons, accounting for 47.0% of the national share, while Iwate Prefecture follows with 14,253 tons, representing 30.4%. To ensure high quality, Sanriku (including Iwate and Miyagi Prefectures) is the only region in Japan that conducts grade-based inspections and strict quality management.
The applications of wakame span various industries, including food, pharmaceuticals, and cosmetics, making it a key component in these sectors (Torres et al., 2020). With the rapid expansion of the global wakame industry, there is a rising demand for rapid, accurate, and non-destructive methods to assess the quality of wakame. Traditionally, seaweed quality assessment has been primarily reliant on subjective evaluations based on visual inspection of appearance, thickness, and strength, which are often time-consuming and labor-intensive (Calmes et al., 2020). These conventional methods are insufficient for large-scale, real-time assessments, as they depend heavily on laboratory analysis, which lacks efficiency and environmental sustainability (Richardson et al., 2002). Consequently, developing non-invasive, high-throughput techniques for wakame quality assessment, particularly emphasizing color, thickness, and strength, has become a significant priority in the field.
Recent advancements in optical sensing technologies offer promising solutions for non-destructive seaweed analysis. Techniques such as Fourier-transform infrared (FT-IR) and Raman spectroscopy have successfully measured key components, including fucoidan in brown seaweeds (Zhao et al., 2021; Beratto-Ramos et al., 2020). These methods not only provide quantitative analysis but also yield insights into the molecular structure of seaweed, which enhances the overall quality assessment process. Additionally, multispectral and hyperspectral imaging techniques have broadened the scope of research by allowing detailed spatial mapping of seaweed properties, facilitating the identification and quantification of internal quality variations (Selvaraj, 2021; van Ginneken and de Vries, 2017). These optical methods offer new perspectives on the growth and metabolic processes of seaweed, making them invaluable tools in modern research.
Chlorophyll content is another critical parameterx in assessing seaweed quality. SPAD-502, a portable chlorophyll meter, is widely applied across various plant studies to measure chlorophyll content indirectly. SPAD stands for Soil Plant Analysis Development, and it functions by measuring the light transmission through leaves, correlating this with chlorophyll concentration. Netto et al. (2005) demonstrated the effectiveness of SPAD-502 in assessing chlorophyll content in coffee leaves, laying the groundwork for non-destructive chlorophyll measurement. Research on other species, such as Arabidopsis, wheat, and deciduous shrubs, by Ling et al. (2011), Shah et al. (2017), and Donnelly et al. (2020), respectively, highlights the potential for applying SPAD-502 in wakame through appropriate calibration. Studies like Aryee et al. (2018) further demonstrate the relevance of seaweed pigments in food processing, providing practical applications for SPAD-based chlorophyll measurements. In addition to chlorophyll content, color has emerged as a crucial parameter for evaluating wakame quality. Manninen et al. (2015) developed a digital image analysis method to assess the green color in vegetables, a technique that could be adapted for wakame. This method utilizes advanced image processing algorithms to quantify color, providing a non-invasive approach to quality assessment. Studies by Charles et al. (2020), Indrawati et al. (2015), and Sung et al. (2023) specifically examined the impact of different processing methods on seaweed color and related quality parameters. These studies established correlations between color, texture, and nutritional components, forming a scientific foundation for optimizing seaweed processing techniques.
Emerging technologies like remote sensing have opened new frontiers for large-scale seaweed monitoring and quality assessment. Wang et al. (2018) and Selvaraj (2021) successfully applied remote sensing technologies, including satellite and drone platforms, for assessing seaweed resources. These tools provide a macroscopic view of seaweed distribution, offering critical insights into growth dynamics and ecosystem changes over time. While Galieni et al. (2021) focused on stress detection in terrestrial plants, the principles of remote sensing and multi-source data fusion from this study offer valuable lessons for monitoring wakame health and environmental stress responses. Moreover, emerging technologies such as non-invasive imaging techniques have shown potential in assessing dynamic changes in biological systems, as explored in the work of Drenthen et al. (2020), which could inspire new applications in wakame research.
Building on recent advancements, this study aims to explore the potential of using visual features, including color, thickness, and strength, to predict key material attributes of wakame. By employing machine learning techniques such as linear regression, quadratic regression, and random forests, the study addresses the limitations of traditional methods related to non-linearity and complex data interactions. RGB, Lab*, and HSV color data are integrated with regression models to assess the effects of different processing methods (e.g., freezing and salting) on wakame quality attributes. Through detailed analysis and comparison, the study's ultimate goal is to develop a rapid, non-destructive method for assessing wakame quality, focusing on chlorophyll content (SPAD values), thickness, and strength. This approach offers the wakame industry a reliable, high-throughput quality assessment solution, with potential to enhance quality control and production efficiency, laying the groundwork for broader applications.
2 Materials and methods
2.1 Data collection and sample preparation
To ensure the dataset's diversity and representativeness, we collected wakame samples measuring 1–2 m in length and ~1 year old from January to March 2022, when the seawater temperature was ~1°C. Both frozen and salted samples were included from various locations across Iwate Prefecture, including Fudai, Yoshihama, Kamaishi, and Ofunato, as well as from Omotehama in Miyagi Prefecture. In total, 480 wakame samples were collected, with 180 frozen samples and 300 salted samples. These samples were obtained from five locations: Fudai, Yoshihama (Yshi), Kamaishi (Kmai), Ofunato (Ofun), and Omotehama (Omote). The samples were further categorized by sections: stem (upper, middle, and lower) and leaf (upper, middle, and lower). From each section and location, we collected 10 samples from the left side of the sample batch, resulting in a comprehensive dataset that supports robust analysis.
To establish a comprehensive dataset for analysis, we utilized a visible light camera to capture images of wakame leaves and stems subjected to different processing methods, including blanching and salt curing, as well as various storage conditions such as temperature and duration. For blanching of frozen wakame, the stems were cut into sections and blanched in boiling water for 20 s, followed by a quick blanching of the remaining parts. The wakame was immediately cooled under running water, then immersed in cold water. For rehydration of salted wakame, samples were rehydrated in distilled water adjusted to ~17°C, using 10 times the amount of water relative to the sample, for 3 min.
The wakame samples were divided into upper, middle, and lower sections for both leaves and stems. From each section, 20 pieces were initially cut into uniform sizes of 10 x 30 mm. However, only the left 10 pieces from each section were selected for further analysis. These selected samples were then photographed under a range of seven color temperatures, from 3,300 to 5,600 K. Figures 2, 3 and display the photographic results of frozen and salted wakame samples from Fudai under these different color temperatures. This approach enabled us to create a detailed image database, categorizing the data based on processing method, storage conditions, shooting location, and color temperature.
To ensure that the model accurately represents wakame under varying lighting conditions, we chose to average the RGB values across different color temperatures, rather than controlling for a single experimental color temperature. This approach, inspired by the goal of simulating real-world lighting conditions, enhances the model's applicability in diverse environments. Although controlling a single color temperature might yield higher prediction accuracy in specific cases, it does not adequately reflect the variability in illumination that would occur in practical applications. By integrating data from multiple color temperatures, we aim to improve the robustness and accuracy of the model in real-world settings, allowing for better adaptability across various application scenarios.
2.2 Image capture and color feature extraction
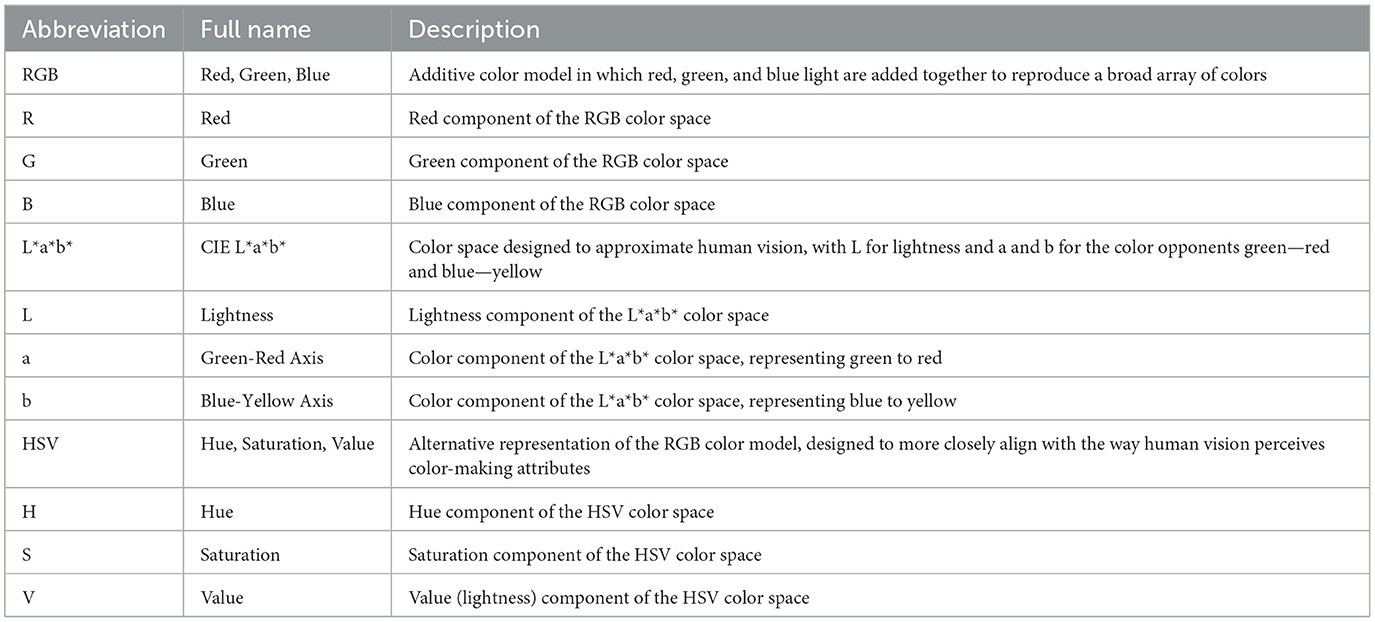
To thoroughly analyze the optical properties of wakame, we extracted color features from images captured in RGB, Lab*, and HSV color spaces. These color spaces provide a comprehensive framework for examining the color characteristics of wakame and their potential correlations with physical and biochemical properties. The RGB (Red, Green, Blue), Lab* (CIE Lab*), and HSV (Hue, Saturation, Value) color features extracted from the wakame images were subsequently used in predictive modeling. The abbreviations and descriptions for these color spaces are summarized in Table 1.
The process for extracting the RGB, L*a*b*, and HSV color features from the wakame images is as follows:
1. Preprocessing: Initially, images are preprocessed to emphasize features that distinguish wakame from other elements. This may include adjusting lightness and contrast or applying filters to highlight the texture and color of wakame.
2. Color Space Transformation: Images are usually in the RGB color space, but for the task of segmentation, converting the image to the HSV color space makes to separate wakame based on color characteristics.
3. Color Data Extraction: Once converted to the HSV color space, specific color ranges corresponding to wakame are identified. This involves analyzing the image to find the range of hues, saturations, and values that best represent wakame.
4. Thresholding: After color data is extracted, thresholding is performed. This process sets pixels within the color range of wakame to white, and all other pixels to black, creating a binary image.
5. Morphological Operations: Following thresholding, morphological operations such as erosion and dilation are used to remove noise and small objects not part of wakame and to close gaps within the segmented wakame areas.
6. Segmentation: The segmented wakame is visualized to assess the accuracy of the segmentation. In addition, the color distribution and average values within each segmented area are analyzed. The average RGB values are converted to HSV and L*a*b* color spaces, providing a detailed color profile of the wakame that will be utilized in subsequent steps.
7. Visualization: The segmented wakame can be visualized to verify the accuracy of the segmentation. Additionally, the color distribution and average values within each segmented area can be analyzed. To ensure consistency and accuracy, the average RGB values are first calculated for each segmented area under various color temperatures. These RGB values are then averaged across all color temperatures to obtain the final, composite RGB values. Subsequently, these final composite RGB values are transformed into the HSV color space and L*a*b* color space. These transformed values will be used in the subsequent analysis steps.
2.3 Physical and biochemical measurements
In addition to optical analysis, we conducted physical and biochemical measurements to obtain a comprehensive understanding of wakame characteristics. The experimental setup, illustrated in Figure 1, included a digital thickness gauge to measure the thickness of the wakame, a rheometer to assess mechanical strength, and a chlorophyll meter to evaluate chlorophyll content (SPAD values). These measurements allowed us to develop a prediction model that integrates image analysis with physical and biochemical data, offering a robust approach to understanding wakame quality characteristics.
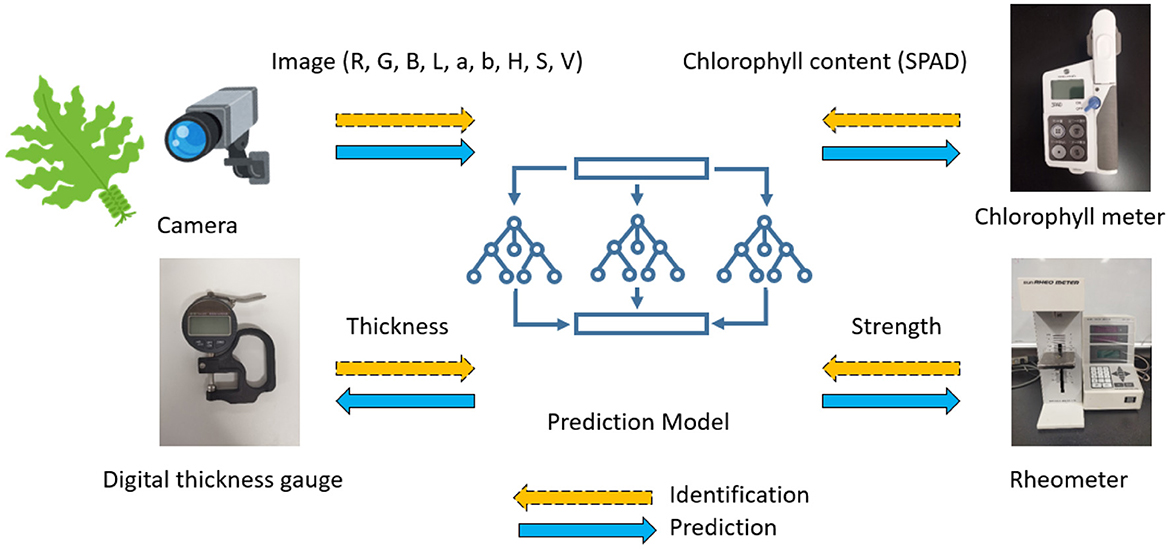
Figure 1. The diagram illustrates the experimental setup used to measure the physical and biochemical properties of the wakame samples. The setup includes a digital thickness gauge for measuring the thickness of the wakame, a rheometer for determining the mechanical strength, and a chlorophyll meter for assessing the chlorophyll content (SPAD values). The RGB, L*a*b*, and HSV color features extracted from the wakame images were used to predict these properties, forming a comprehensive prediction model that combines image analysis with physical and biochemical measurements.
For specific physical properties, a rheometer CR-100 (manufactured by Sun Science Corporation, Tokyo, Japan) was used to record the tensile strength (in grams) of each individual wakame frond piece (10 x 30 mm) when pulled at a speed of 300 mm per minute. Measurements were taken for the upper, middle, and lower sections of both wakame leaves and stems. Regarding leaf thickness, a digital thickness gauge (manufactured by Neoteck, Hong Kong) was used to measure the thickness of the specified areas. Similarly, measurements were taken for the upper, middle, and lower sections of wakame leaves and stems. The results of the strength and thickness measurements revealed significant variations in these characteristics based on the origin, suggesting their potential as effective indicators for distinguishing the origin and grade. For biochemical properties, the amount of chlorophyll was measured using a chlorophyll meter SPAD-502Plus (manufactured by Konica Minolta, Tokyo, Japan).
2.4 Regression models for property prediction
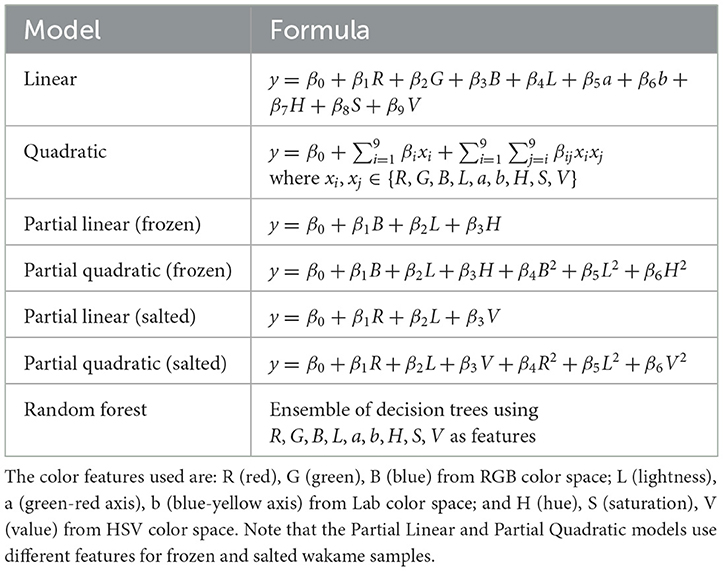
To further analyze the relationships between color features and wakame properties, we developed and evaluated various regression models. These models included linear, quadratic, partial linear, partial quadratic, and random forest models, each of which was designed to capture the potential relationships between color features and wakame properties. We used color features from RGB, Lab, and HSV color spaces, such as R (red), G (green), B (blue), L (lightness), a (green-red axis), b (blue-yellow axis), H (hue), S (saturation), and V (value), as the predictor variables in these models.
The mathematical formulas for each model type are summarized in Table 2. The partial linear and partial quadratic models were tailored to account for different feature sets between frozen and salted wakame samples, optimizing the model to better reflect differences due to processing methods.
2.5 Analysis of variance for properties
The Analysis of Variance (ANOVA) is a statistical method used to determine whether there are statistically significant differences between the means of two or more groups. It works by partitioning the total variation in a dataset into components attributable to group differences and random error. The key output of ANOVA is the F-statistic, which compares the variance between groups to the variance within groups. A larger F-statistic indicates that the group means are more likely to be significantly different. The method is widely used in experimental and observational studies to assess the effects of different treatments or conditions.
For example, in the context of food science, ANOVA could be used to compare the chlorophyll content (SPAD values) of frozen and salted samples of wakame to evaluate how processing methods influence this property. Similarly, it could be applied to examine whether there are significant differences in physical attributes such as thickness or strength between processing groups. By testing these hypotheses, ANOVA provides a statistical foundation for determining whether observed differences are due to the effects of processing methods rather than random variation.
This method is particularly valuable in food quality studies where multiple factors influence the properties of interest. Its application helps researchers validate observed trends and ensure that the results are statistically robust before proceeding to predictive modeling or further analysis.
3 Results
3.1 Color temperature effects analysis
Figure 2 demonstrated the visual appearance of segmented frozen wakame samples across a spectrum of color temperatures, from warm (3,300 K) to cool (5,600 K). The samples showed the subtle changes in color perception as the color temperature increased. The frozen samples generally maintained a consistent appearance, with slight shifts from a warmer, reddish tone at lower color temperatures to a cooler, slightly bluish tint at higher temperatures. This consistency in appearance across different color temperatures suggested that the freezing process helped preserve the original pigments of the wakame. The minimal color variation observed might have been primarily due to the changing light conditions rather than significant alterations in the wakame's intrinsic color properties. This stability in appearance could have been advantageous for color-based quality assessments of frozen wakame products.
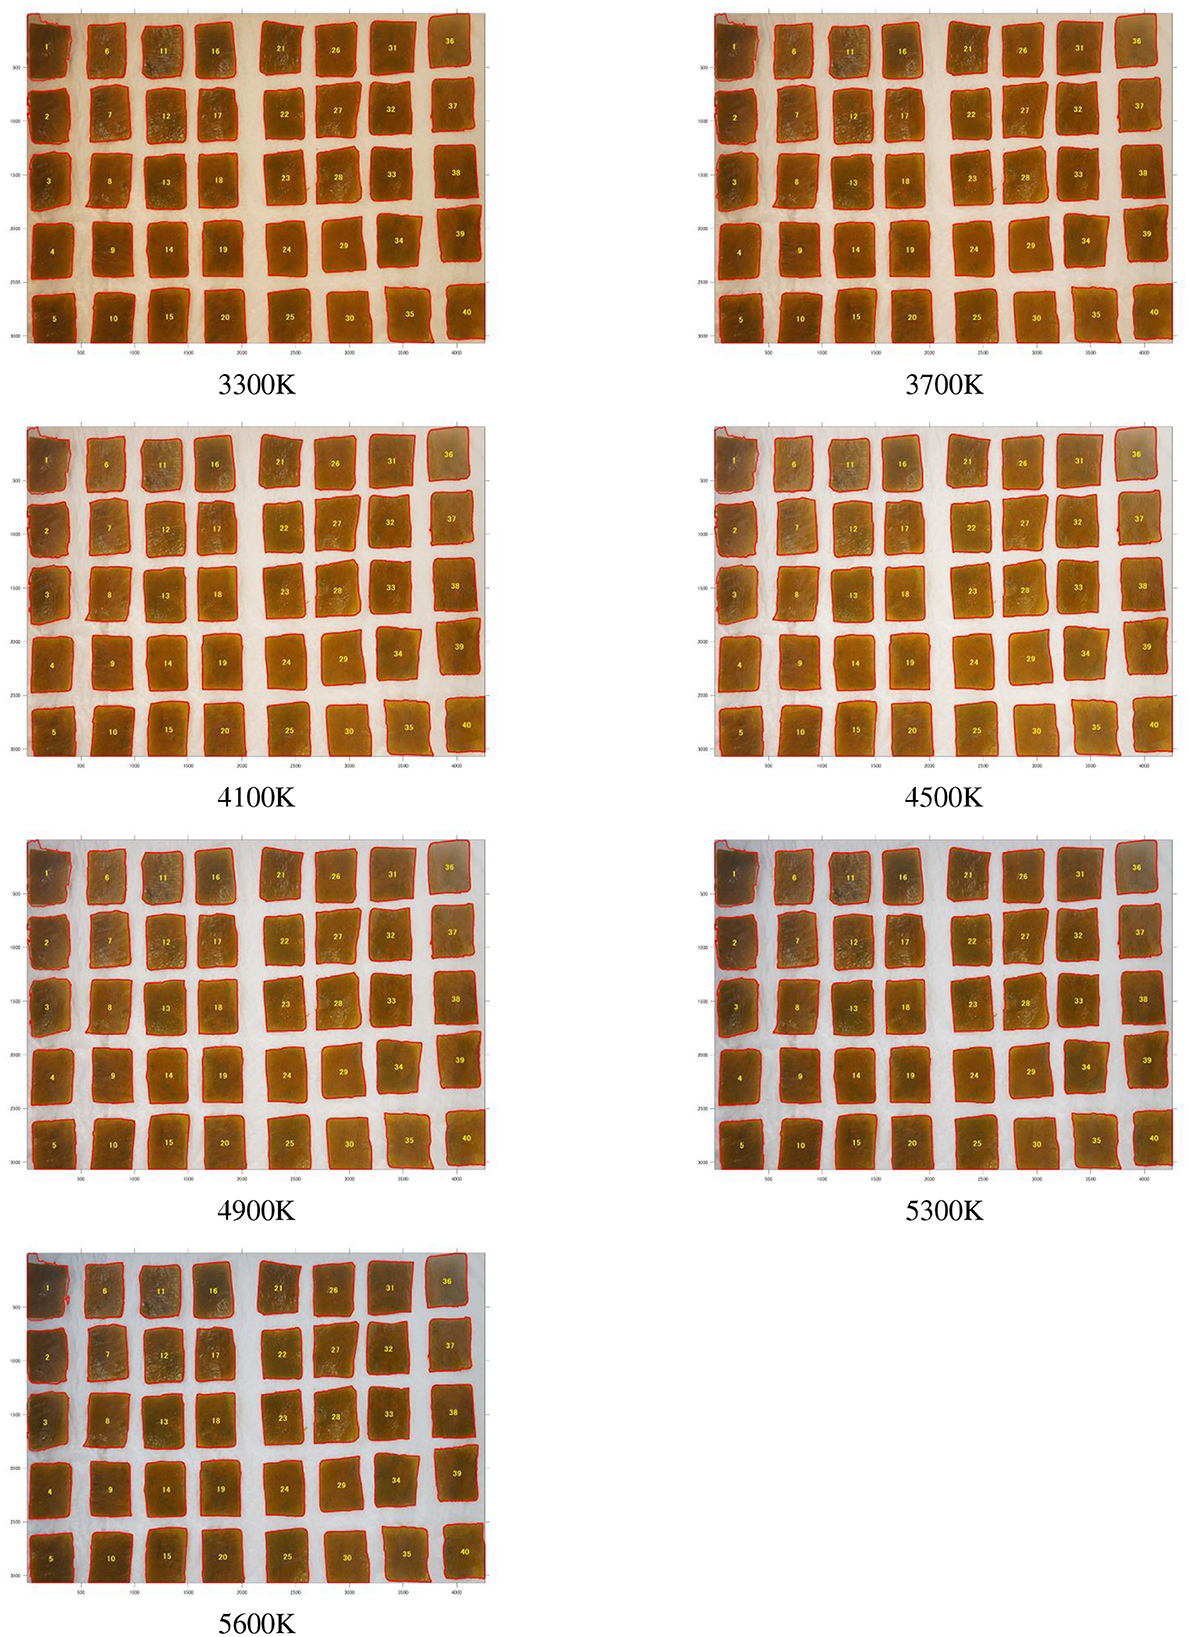
Figure 2. Frozen wakame samples from Fudai region photographed under different color temperatures (3,300, 3,700, 4,100, 4,500, 4,900, 5,300, and 5,600 K). The left side shows the stems, and the right side shows the leaves.
Figure 3 illustrated the visual appearance of segmented salted wakame samples across a spectrum of color temperatures, from warm (3,300 K) to cool (5,600 K). The samples showed the pronounced changes in color perception as the color temperature increased. The salted samples exhibited more noticeable color shifts compared to their frozen counterparts, transitioning from a warmer, brownish tone at lower color temperatures to a cooler, distinctly greenish hue at higher temperatures. This variability in appearance across different color temperatures suggested that the salt-curing process might have altered the wakame's pigments, making them more susceptible to perceived color changes under different lighting conditions. The more significant color variation observed in salted samples could be attributed to both the changing light conditions and alterations in the wakame's intrinsic color properties due to the curing process. This increased sensitivity to color temperature changes presented challenges for color-based quality assessments of salted wakame products and highlighted the importance of standardized lighting conditions in visual inspections.
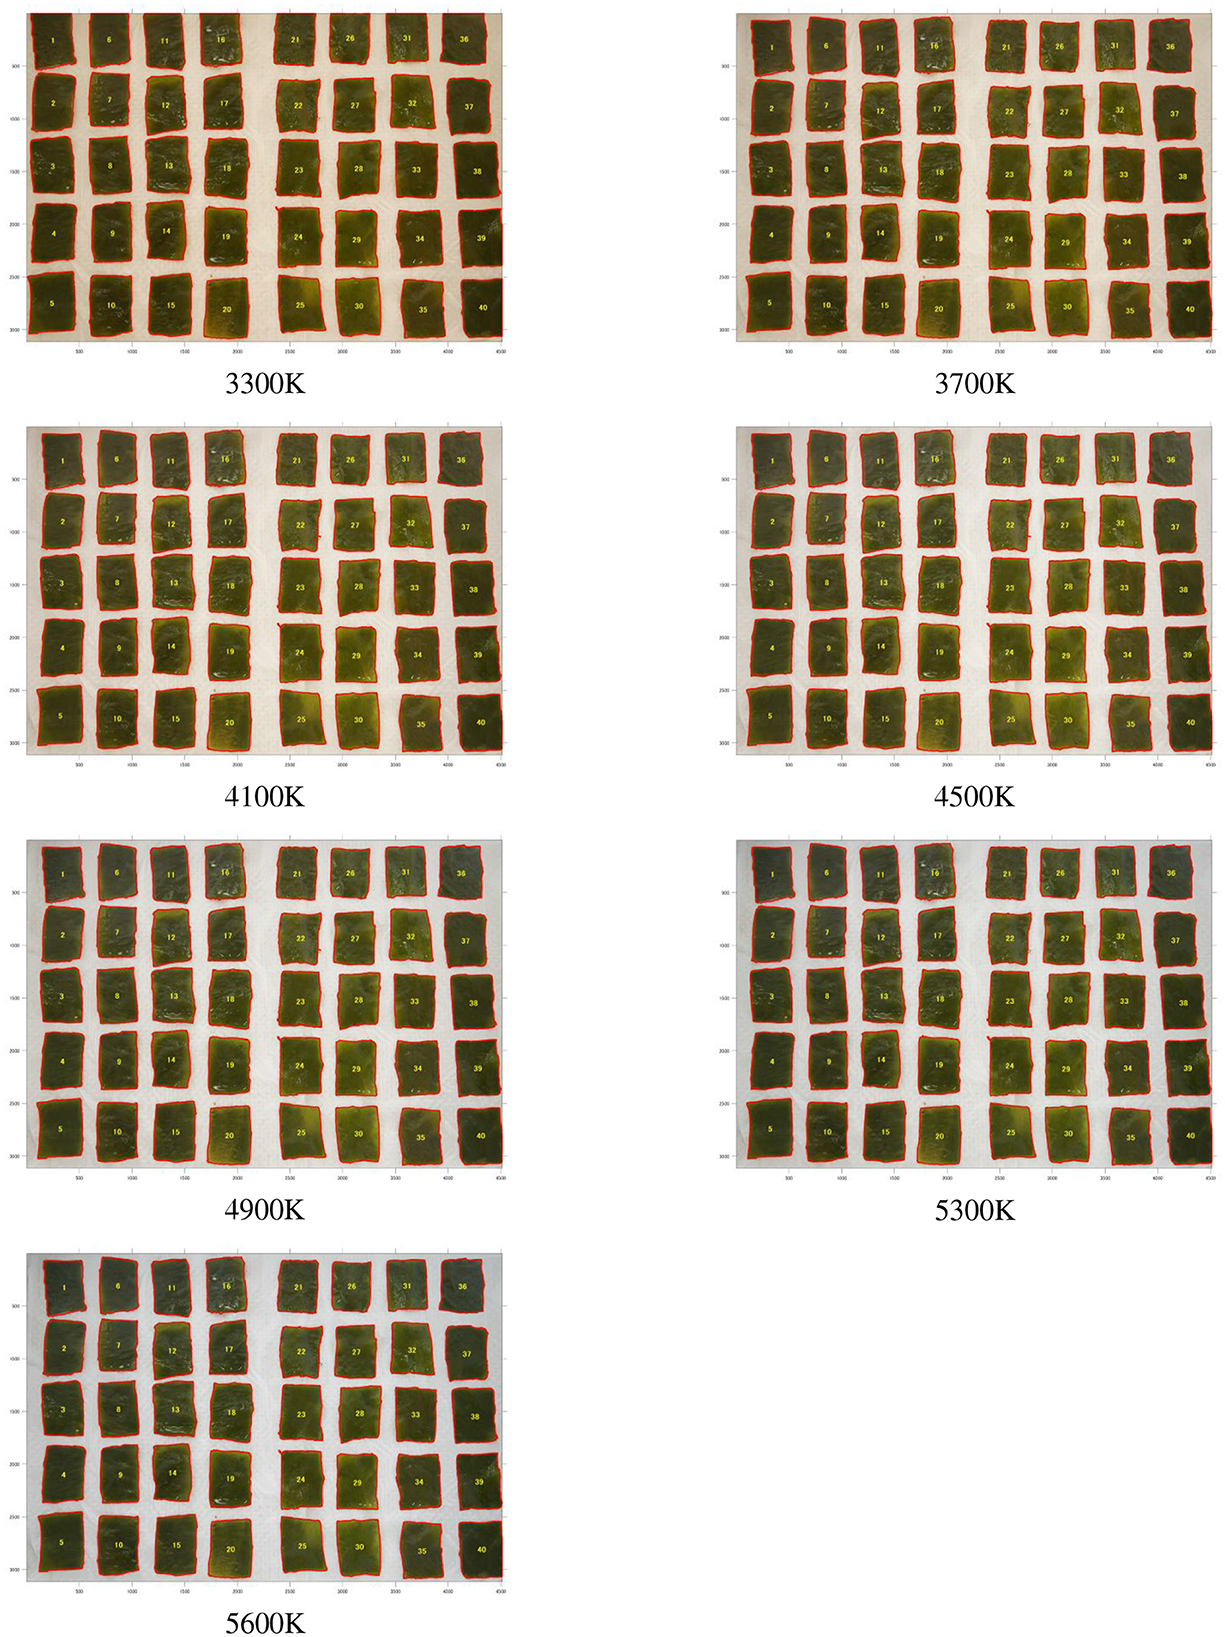
Figure 3. Salted wakame samples from Fudai region photographed under different color temperatures (3,300, 3,700, 4,100, 4,500, 4,900, 5,300, and 5,600 K). The left side shows the stems, and the right side shows the leaves.
3.2 Property distributions analysis
The ANOVA analysis revealed significant differences in color and physical properties between frozen and salted wakame samples, indicating distinct effects of the two preservation methods. These p-values provide a quantitative measure of these differences, supporting a more rigorous interpretation of the data.
For the RGB color components, the p-values obtained for R (p = 5.6745e-52) and B (p = 1.1597e-06) suggest statistically significant differences between the two sample groups, with frozen samples showing higher mean values, particularly in the R component (mean 131.36 vs. 88.15), indicating that freezing better preserves the original red color. The G component (p = 0.1456) showed no significant difference, while in Lab* color space, both L (p = 5.9175e-10) and a (p = 1.1151e-196) values were significantly different, with higher L values (mean 41.07 vs. 35.39) in frozen samples, indicating increased brightness. The green-red axis (a) shifts notably from positive in frozen samples (mean 11.91) to negative in salted samples (mean –7.26), suggesting that salting shifts color toward green.
In the HSV color space, the H (p = 6.4135e-192) and S (p = 5.8472e-06) values were statistically different between frozen and salted samples, with salted samples having a higher H-value (mean 0.16 vs. 0.10), consistent with a green shift, and a lower V-value (p = 4.4399e-48; mean 0.35 vs. 0.52), which aligns with the decreased lightness in salted wakame.
For physical properties, the thickness (p = 1.8470e-05) and strength (p = 6.0608e-05) of wakame were also significantly affected by the preservation method. Frozen samples retained higher thickness (mean 0.56 vs. 0.50 mm) and strength (mean 2.97 vs. 2.61 N), suggesting that freezing better preserves the structural integrity of wakame, while salting may lead to dehydration and slight reduction in structure.
The ANOVA results underscore the conclusion that freezing better preserves wakame's original color and structure, resulting in brighter, redder, and slightly stronger and thicker samples. In contrast, salting shifted the color toward green, decreased lightness, and reduced thickness and strength, impacting both visual and functional qualities for food and industrial applications.
3.3 Correlation analysis
The correlation matrix analysis provided in Figures 4, 5 revealed the relationships between various parameters in wakame samples. These parameters include RGB components, L*a*b* components, HSV components, SPAD (chlorophyll content), thickness, and strength. These data not only provided a quantitative basis for understanding the physiological and physical properties of wakame but also offered valuable insights for further research into the relationships between these characteristics.
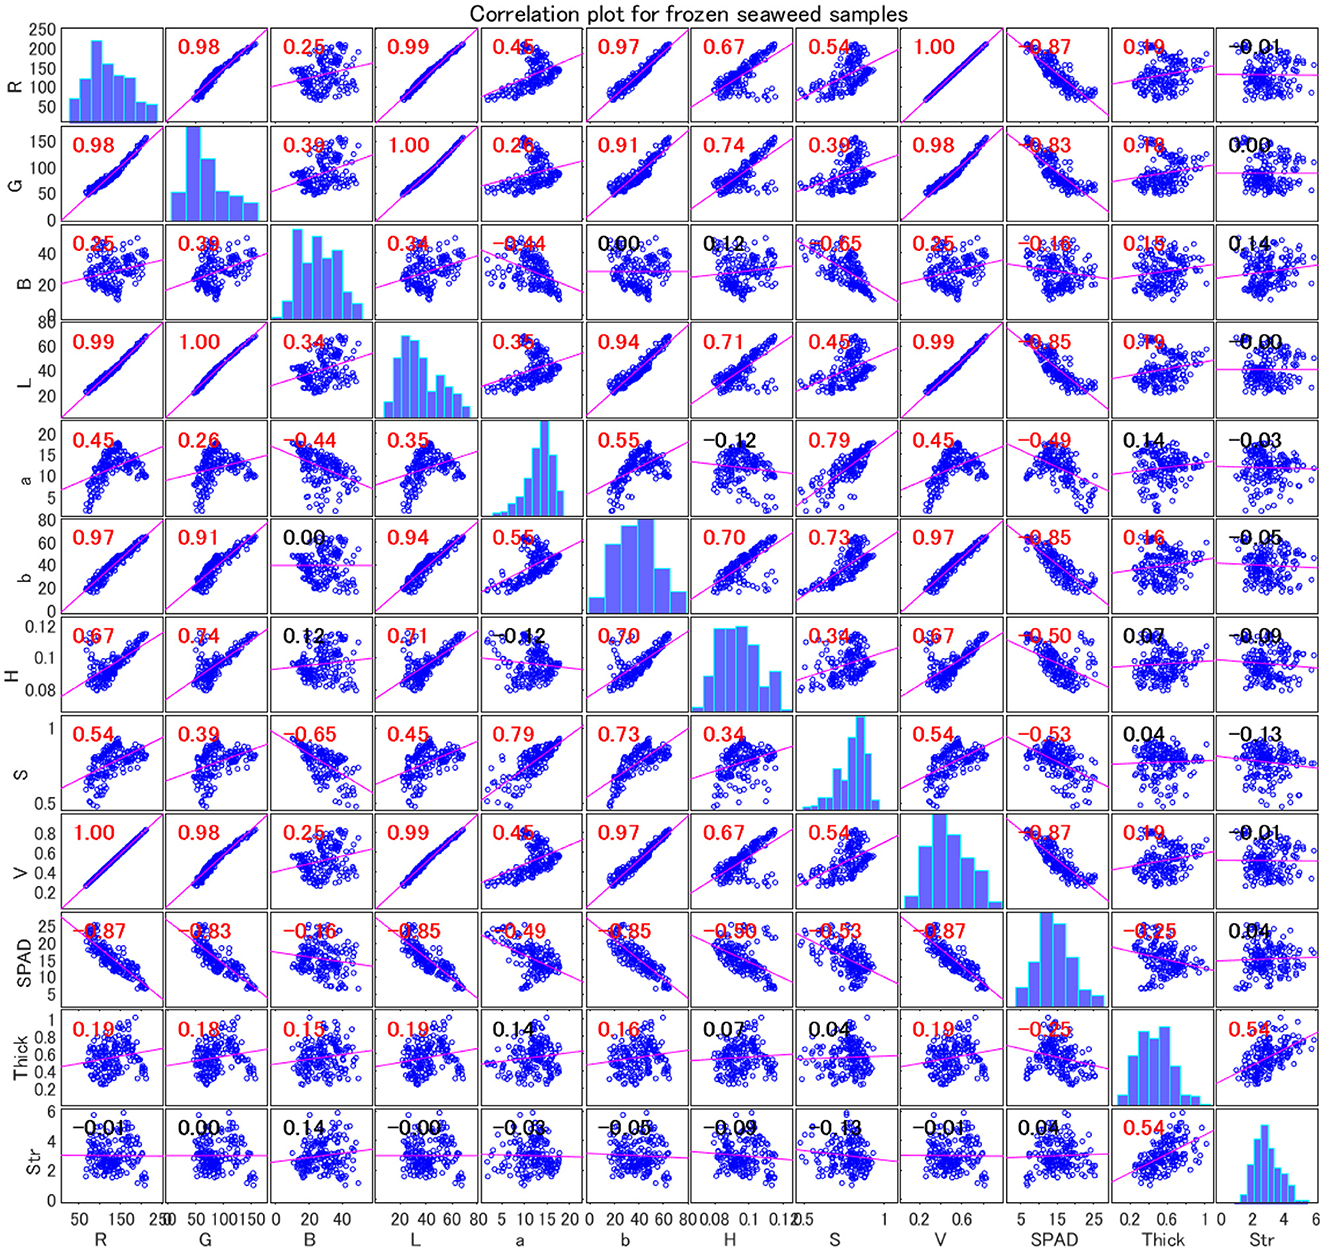
Figure 4. Correlation plot for frozen wakame samples. The color and size of the circles represent the strength and direction of the correlations. Blue indicates positive correlation, red indicates negative correlation, and white indicates no correlation. The variables are: R (red), G (green), B (blue), L (lightness), a (green-red axis), b (blue-yellow axis), H (hue), S (saturation), and V (value), SPAD (chlorophyll content), Thick (thickness), and Str (strength).
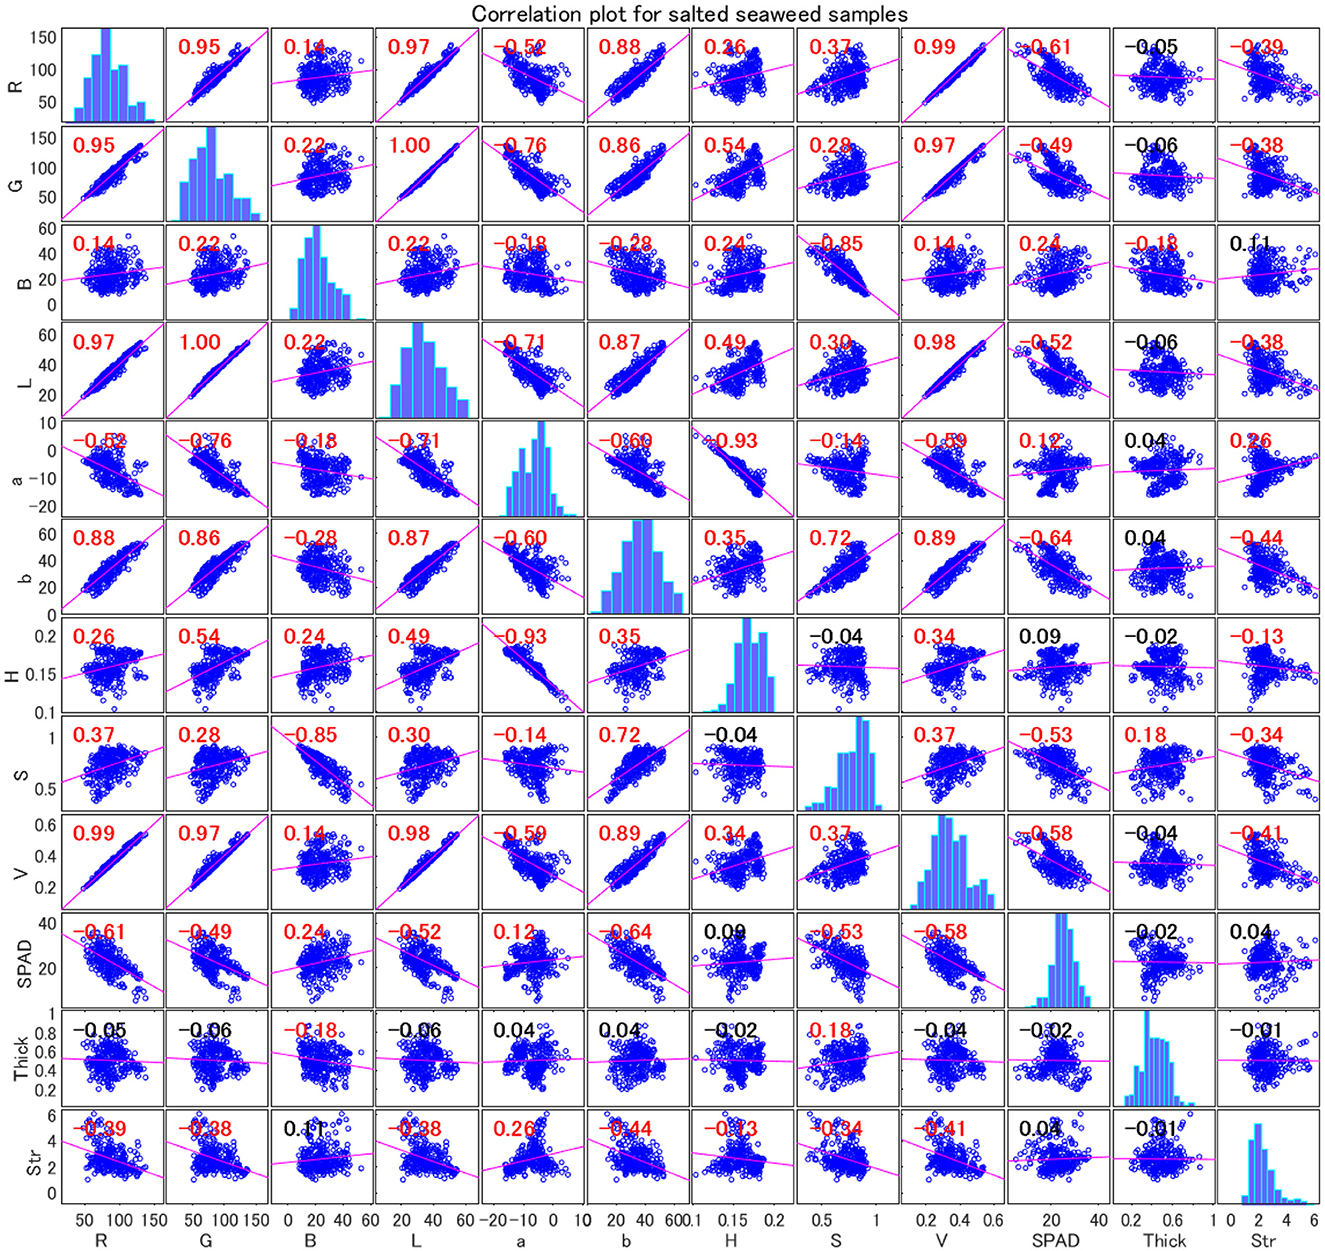
Figure 5. Correlation plot for salted wakame samples. The color and size of the circles represent the strength and direction of the correlations. Blue indicates positive correlation, red indicates negative correlation, and white indicates no correlation. The variables are: R (red), G (green), B (blue), L (lightness), a (green-red axis), b (blue-yellow axis), H (hue), S (saturation), and V (value), Thick (thickness), and Str (strength).
3.3.1 Correlation analysis of frozen wakame
Figure 4 revealed several strong correlations in the frozen wakame samples. Firstly, the strong positive correlation between R and L (0.993) indicated that the red intensity was closely related to the lightness of the wakame samples. This suggested that as the sample exhibited higher red intensity, its lightness also increased, which might have been related to the surface reflection characteristics of the sample. Similarly, the correlation between G and L was also very high (0.995), further reinforcing this observation. These strong correlations revealed a significant linear relationship between the RGB components and L, a relationship that was likely determined by the combined effects of lighting conditions and the uniformity of the sample color in visual detection.
Moreover, there was a significant positive correlation (0.914) between G and the red-green axis (a), implying that an increase in green intensity was closely related to changes in the red-green axis. This correlation reflected changes in the chlorophyll content of wakame under different growth conditions, as chlorophyll concentration was typically represented by green intensity. A high concentration of chlorophyll likely indicated that the sample was healthy and growing well, which manifested as a higher green component and a shift in the red-green axis in color measurements.
There was a moderate negative correlation (−0.444) between B and the red-green axis (a), suggesting that an increase in blue intensity might have caused the color to shift toward the green direction on the red-green axis. This phenomenon could have been related to the interaction of chlorophyll and other photosynthetic pigments, especially in frozen samples under different environmental conditions. In wakame, an increase in the blue component might have been associated with chlorophyll degradation or other factors related to the physiological state, leading to a color shift from red to green.
Notably, there was a negative correlation between the RGB components and SPAD values (indicating chlorophyll content). This negative correlation suggested that as color intensity increased, SPAD values might decrease, which could mean that darker or more vibrant wakame samples tended to have lower chlorophyll content. This finding was significant for understanding the physiological state and growth conditions of wakame, as chlorophyll content is a crucial indicator of plant health and nutritional status.
This negative correlation in frozen wakame samples might have indicated that during the freezing process, chlorophyll underwent some degree of degradation, or changes in pigment concentration led to darker colors and lower SPAD values. This had important implications for further research on how to maintain the quality of wakame during the freezing process.
3.3.2 Correlation analysis of salted wakame
In contrast, Figure 5 shows that the correlation matrix of salted wakame samples exhibited similar trends to the frozen wakame but also presented some notable differences. Firstly, the correlation between R and L remained high (0.968), similar to the frozen samples, indicating that the relationship between red intensity and lightness remained consistent across different preservation methods. The correlation between G and L was even stronger (0.997), further indicating a very strong linear relationship between green intensity and lightness. This suggested that regardless of whether the wakame was frozen or salted, the relationship between color intensity and lightness in the samples was consistent, likely related to the surface structure and optical properties of the sample.
However, in the salted wakame samples, the correlation between SPAD values and other color parameters was generally weaker or negative, suggesting that the preservation method significantly affected the relationship between chlorophyll content and color properties. Specifically, the salting process might have led to chlorophyll degradation, thereby altering the correlation between SPAD values and color components. The salt used in the salting process might have accelerated chlorophyll degradation, resulting in lower SPAD values, while changes in other color components did not fully offset this effect.
For example, the correlation between G and SPAD values was significantly reduced in salted samples, indicating that during chlorophyll degradation, the green component was no longer directly related to chlorophyll content. Additionally, the negative correlation between SPAD values and the red-green axis (a) suggested that changes in the red-green axis might have been related to the degree of chlorophyll degradation. Overall, these findings revealed the critical role of preservation methods in influencing the relationship between the physiological properties and color attributes of wakame, especially when selecting preservation methods for quality assessment using non-invasive techniques.
In summary, the correlation matrix analysis of frozen and salted wakame samples illustrated the complex relationships between color and physical properties and revealed the significant impact of preservation methods on these relationships. These results provided new perspectives on understanding the physiological state of wakame and offered empirical evidence for developing more effective wakame quality assessment techniques.
3.4 Regression analysis
3.4.1 Regression analysis of frozen wakame
3.4.1.1 SPAD value prediction models
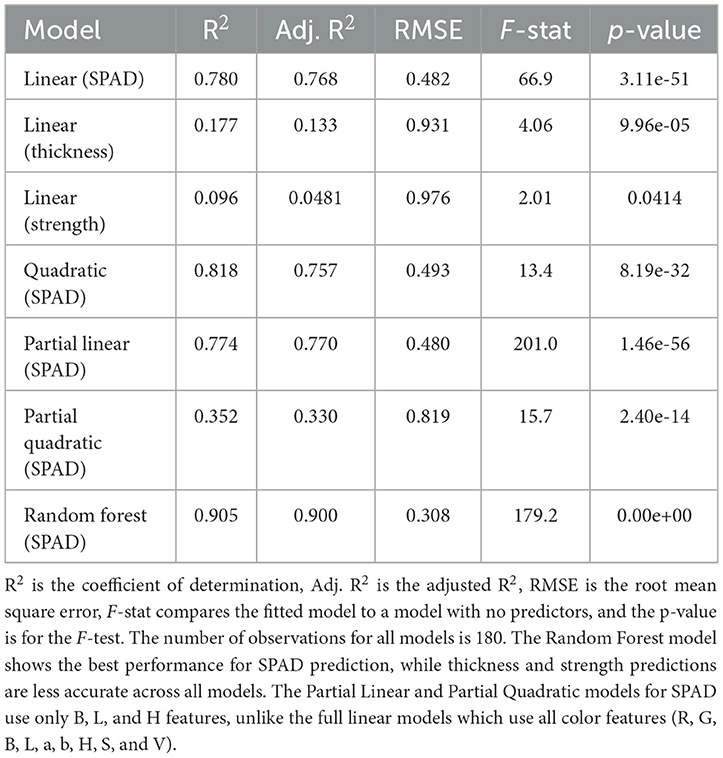
For frozen wakame samples, Table 3 presents the parameter estimates, standard errors, t-statistics, and p-values for various regression models. The performance metrics for these models are summarized in Table 4.
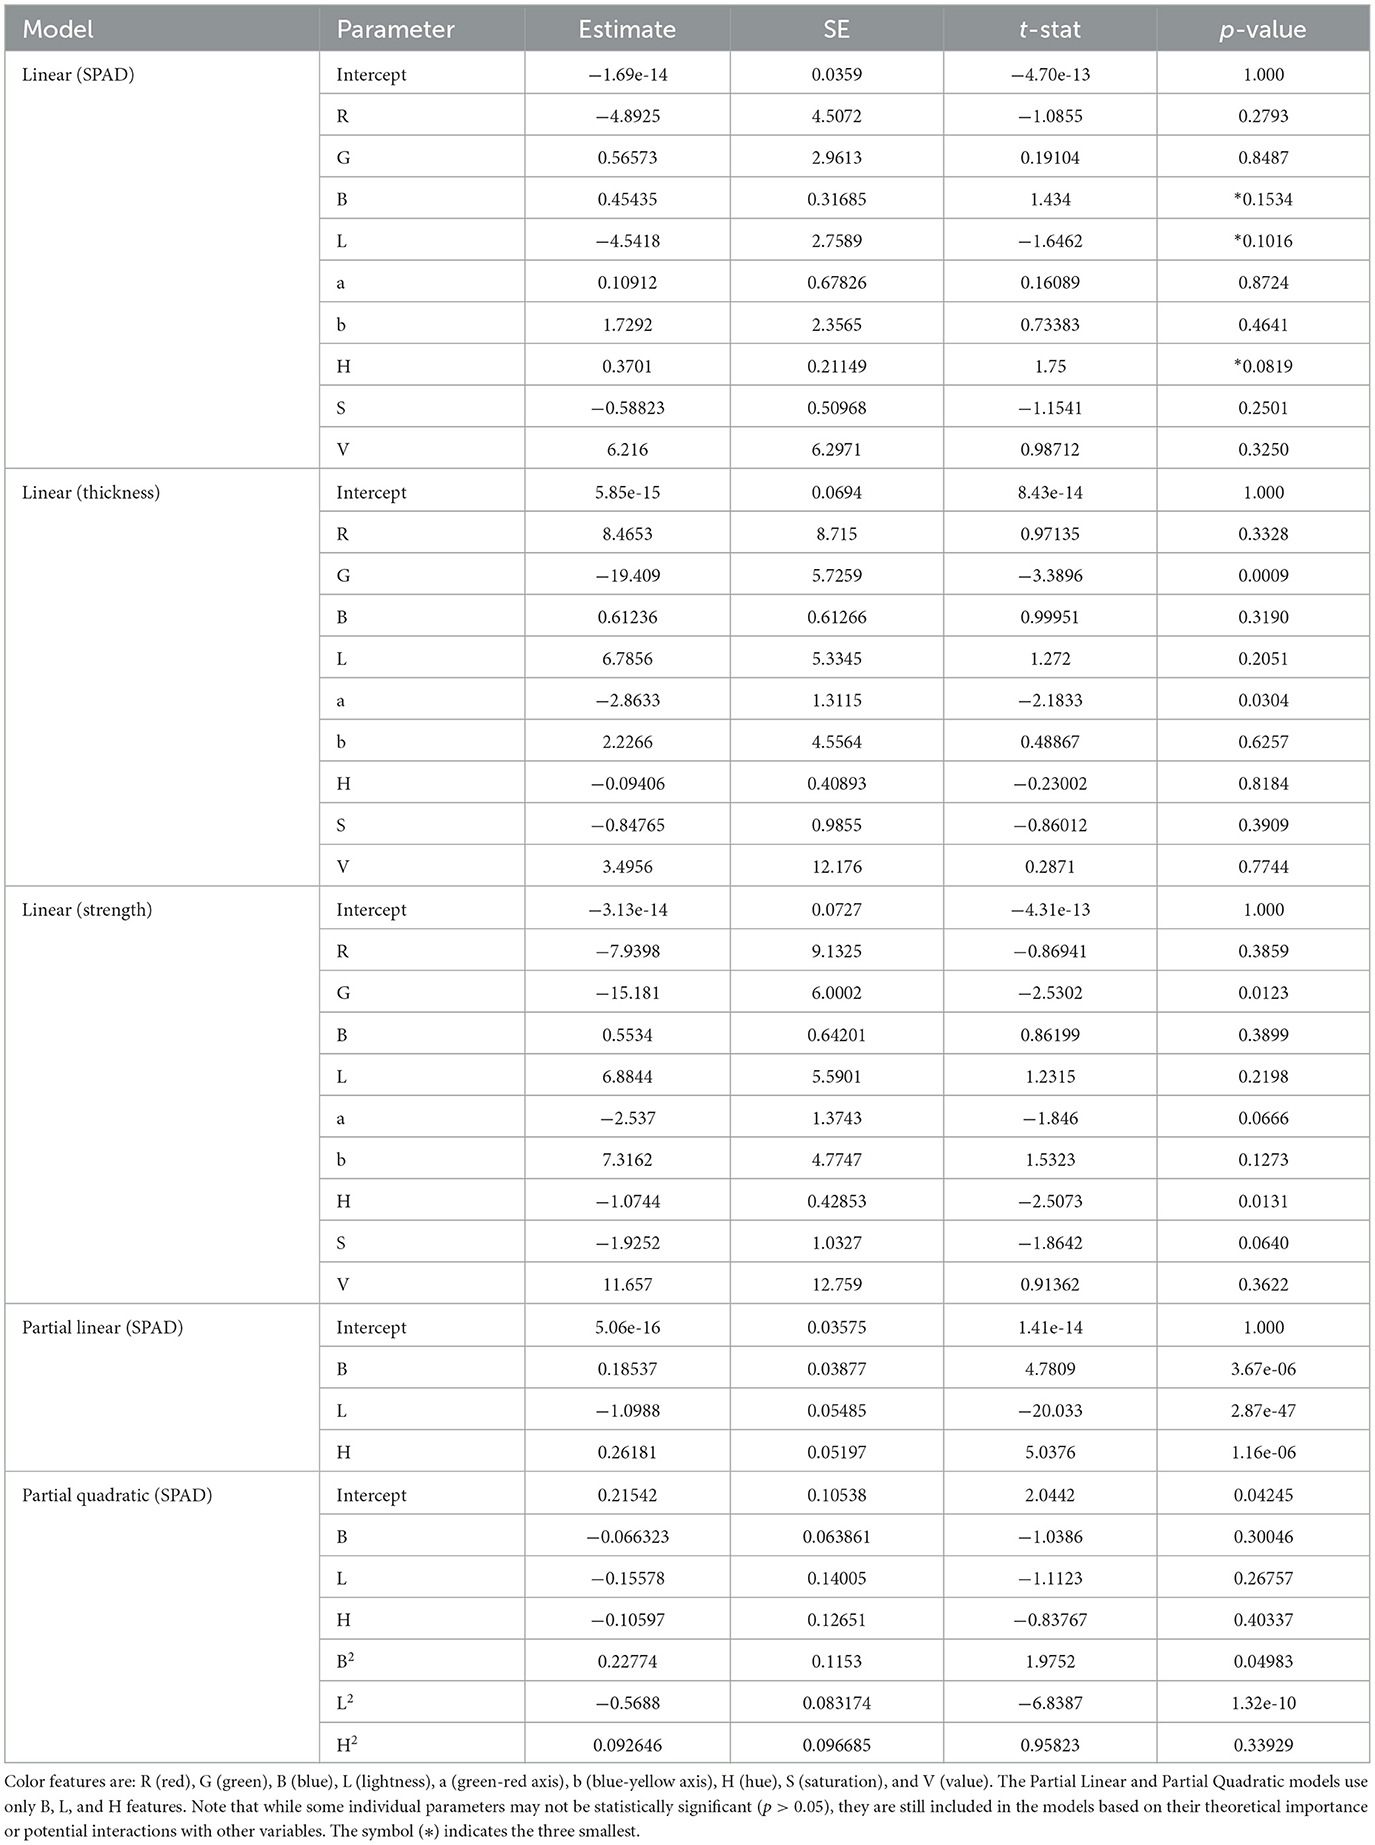
Table 3. Model parameters and statistics for frozen wakame samples, including parameter estimates, standard errors (SE), t-statistics, and p-values for various regression models, excluding the quadratic (SPAD) model due to its complexity.
Linear regression model: The simple linear regression model for frozen wakame samples demonstrated excellent performance. This model used nine color features (R, G, B, L, a, b, H, S, V) to predict SPAD values. The adjusted R2 reached 0.768, indicating that the model could explain about 76.8% of the variation in SPAD values. This was a considerably high explanatory power, suggesting a strong linear relationship between color features and SPAD values. The model's F-statistic was 66.9, with an extremely small p-value (3.11e-51), indicating that the model was highly significant overall, far superior to the baseline model containing only the intercept. However, it was worth noting that despite the model's overall excellent performance, the p-values of individual predictor variables were generally high, with none reaching the traditional 0.05 significance level. This situation might have suggested the presence of multicollinearity, i.e., strong correlations between predictor variables. The model's Root Mean Square Error (RMSE) was 0.482, which was acceptable considering the range of SPAD values. This indicated that the model's average error in predicting individual samples was relatively small.
Quadratic regression model: To capture potential non-linear relationships, we introduced an extended model including quadratic terms and interaction terms. This model contained 45 predictor variables and 46 terms. The results showed that the adjusted R2 slightly increased to 0.757. Considering the significant increase in model complexity, this minor improvement might not have been worthwhile. In this extended model, some quadratic terms and interaction terms showed statistical significance. Notably, x18 (the quadratic term of B, p = 0.00018682) and x26 (the interaction term of L and a, p = 0.0052781) reached highly significant levels. This indicated that some non-linear relationships existed, but these relationships might not have been sufficient to significantly improve overall predictive performance. The model's F-statistic decreased to 13.4 (p = 8.19e-32), which, although still highly significant, was lower compared to the simple linear model. This might have been due to the increased degrees of freedom. The RMSE slightly increased to 0.493, and this minor increase might have been due to model overfitting.
Simplified quadratic regression model: To further explore potential non-linear relationships in the simplified model, we added quadratic terms to the simplified linear model. This model contained six predictor variables, including the linear terms of B, L, H, as well as their quadratic terms and interaction terms. The results showed that the performance of this simplified quadratic model decreased, with the adjusted R2 dropping to 0.33. This result was unexpected, as we would typically expect the addition of non-linear terms to improve model performance. This might have suggested that in the simplified feature set, linear relationships had already captured most of the meaningful variation, while the added non-linear terms might have introduced noise. In this model, only the quadratic term of L (p = 0.049834) showed statistical significance. This indicated that there might have been a curvilinear relationship between lightness and SPAD values, but this relationship was relatively weak. The model's F-statistic was 15.7 (p = 2.4e-14), which, although still highly significant, was far lower than the simplified linear model. The RMSE increased to 0.819, further confirming the performance decline of this model.
Simplified quadratic regression model: To further explore potential non-linear relationships in the simplified model, we added quadratic terms to the simplified linear model. This model contains six predictor variables, including the linear terms of B, L, H, as well as their quadratic terms and interaction terms. The results show that the performance of this simplified quadratic model decreased, with the adjusted R2 dropping to 0.33. This result is unexpected, as we would typically expect the addition of non-linear terms to improve model performance. This may suggest that in the simplified feature set, linear relationships have already captured most of the meaningful variation, while the added non-linear terms may have introduced noise. In this model, only the quadratic term of L (p = 0.049834) shows statistical significance. This indicates that there may be a curvilinear relationship between lightness and SPAD values, but this relationship is relatively weak. The model's F-statistic is 15.7 (p = 2.4e-14), which, although still highly significant, is far lower than the simplified linear model. The RMSE increased to 0.819, further confirming the performance decline of this model.
Random forest model: The random forest model demonstrated the best predictive performance, with an adjusted R2 reaching an impressive 0.900. This indicated that by considering non-linear relationships and feature interactions, we could explain 90% of the variation in SPAD values. This model's RMSE decreased to 0.308, the lowest among all models, indicating that its prediction error was significantly reduced. The F-statistic was as high as 179.2 (p-value close to 0), further confirming the model's strong predictive power. However, it should have been noted that the interpretability of the random forest model was less intuitive than linear models, which might have been a drawback in some application scenarios. Figure 6 illustrated the non-linear relationships captured by this model for frozen wakame samples.
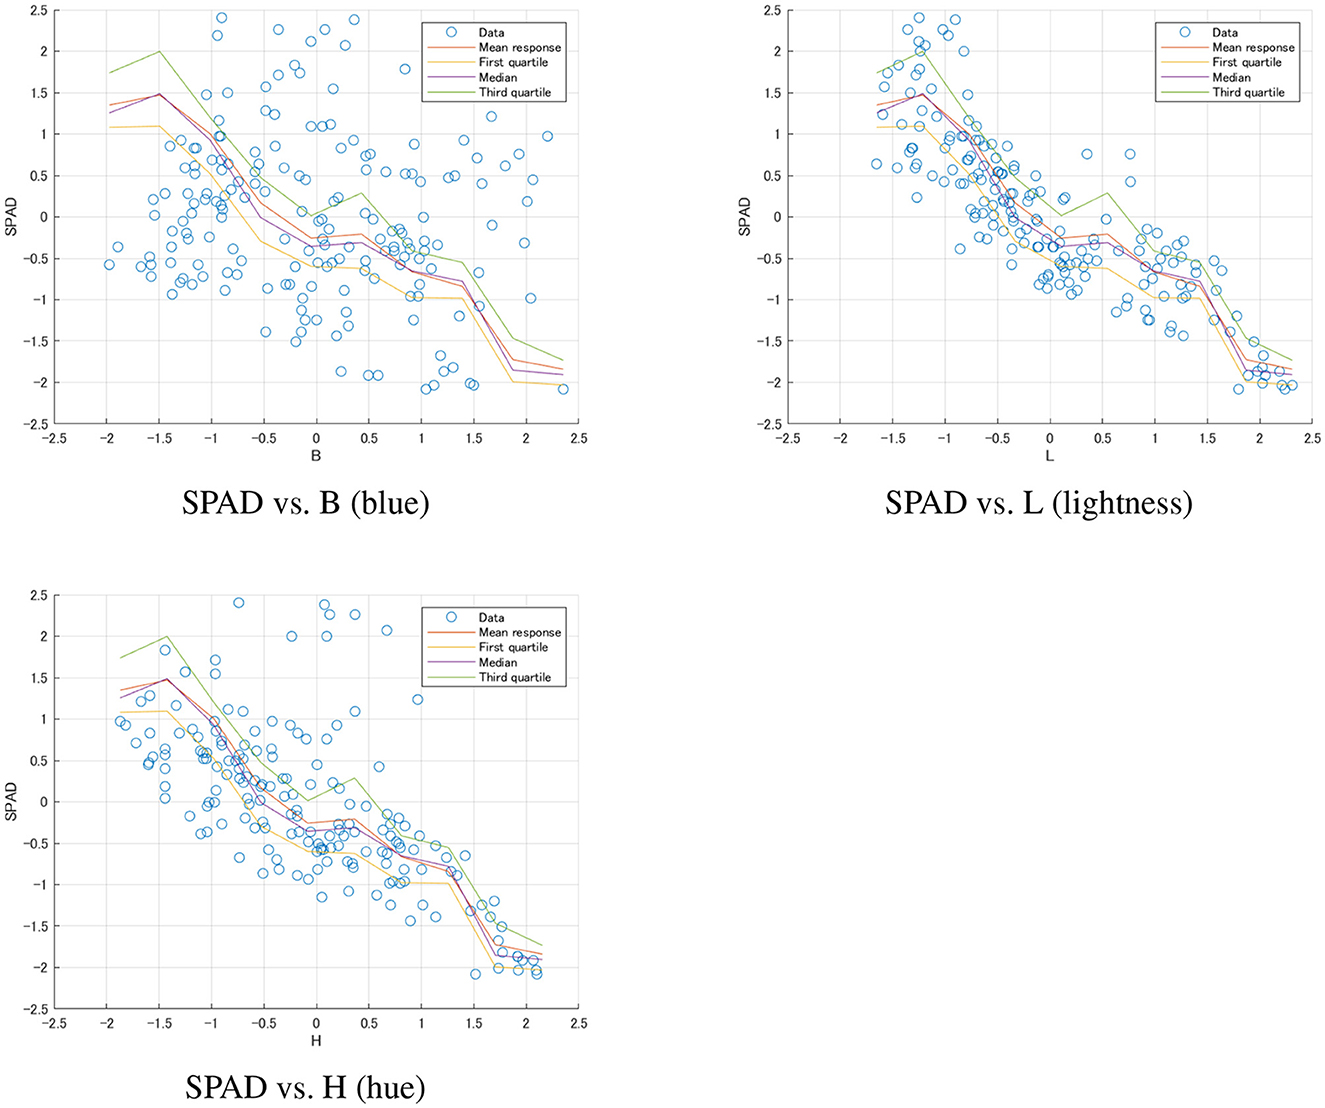
Figure 6. Random Forest model predictions for frozen wakame samples. Each plot shows the relationship between SPAD values and a specific color feature (B, L, H). The scatter points represent the actual data, while the lines show the mean response and quartiles predicted by the model. These plots demonstrate the non-linear relationships captured by the Random Forest model and the varying levels of uncertainty in predictions across the range of each feature.
3.4.1.2 Thickness prediction model
Linear regression model: The performance of the thickness prediction model was significantly inferior to the SPAD value prediction model. The linear regression model's adjusted R2 was only 0.133, indicating that color features could only explain 13.3% of the thickness variation. This result suggested that wakame thickness might have been primarily influenced by other factors, rather than directly reflected in its color features. The model's F-statistic was 4.06 (p = 9.96e-05), which, although reaching statistical significance, had limited predictive power. Among the predictor variables, only G (green channel, p = 0.00087014) and a (green-red axis, p = 0.030385) showed statistical significance. This might have suggested that the degree of green in wakame had some association with its thickness, but this association was relatively weak. The RMSE was 0.931, which might have been relatively large considering the possible range of thickness. This further confirmed the limitations of using only color features to predict thickness.
3.4.1.3 Strength prediction model
Linear regression model: The strength prediction model performed the worst, with an adjusted R2 of only 0.0481, indicating that color features could hardly explain the variation in wakame strength. This result was not surprising, as strength was a physical property that might not have had a direct relationship with color. The model's F-statistic was 2.01 (p = 0.0414), barely reaching the 0.05 significance level. Among the predictor variables, only G (green channel, p = 0.01231) and H (hue, p = 0.013105) showed some degree of statistical significance. The RMSE was 0.976, which might have been quite large considering the possible range of strength. This result strongly suggested that we needed to seek other features or methods to predict wakame strength.
3.4.2 Regression analysis of salted wakame
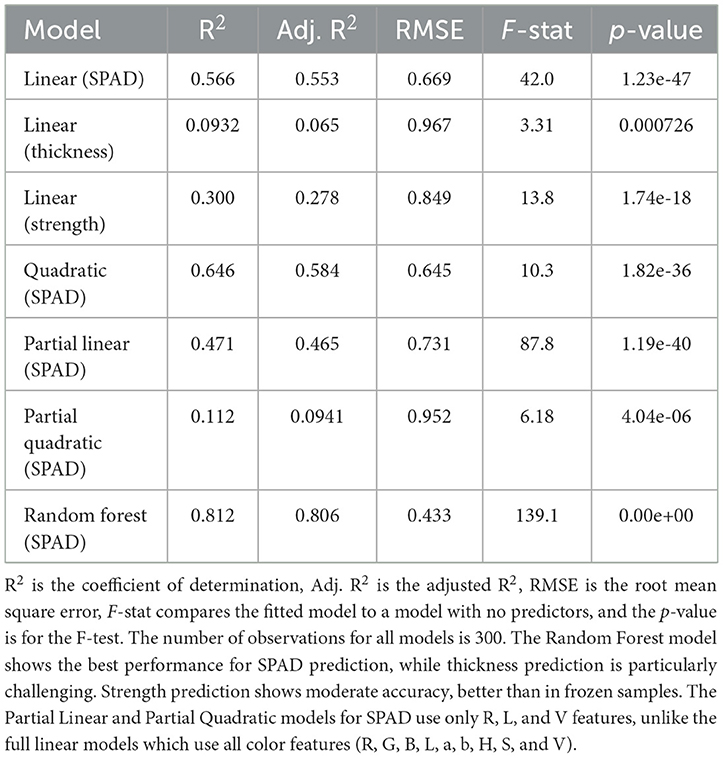
For salted wakame samples, Table 5 shows the parameter estimates and related statistics for various regression models. The performance metrics for these models are summarized in Table 6.
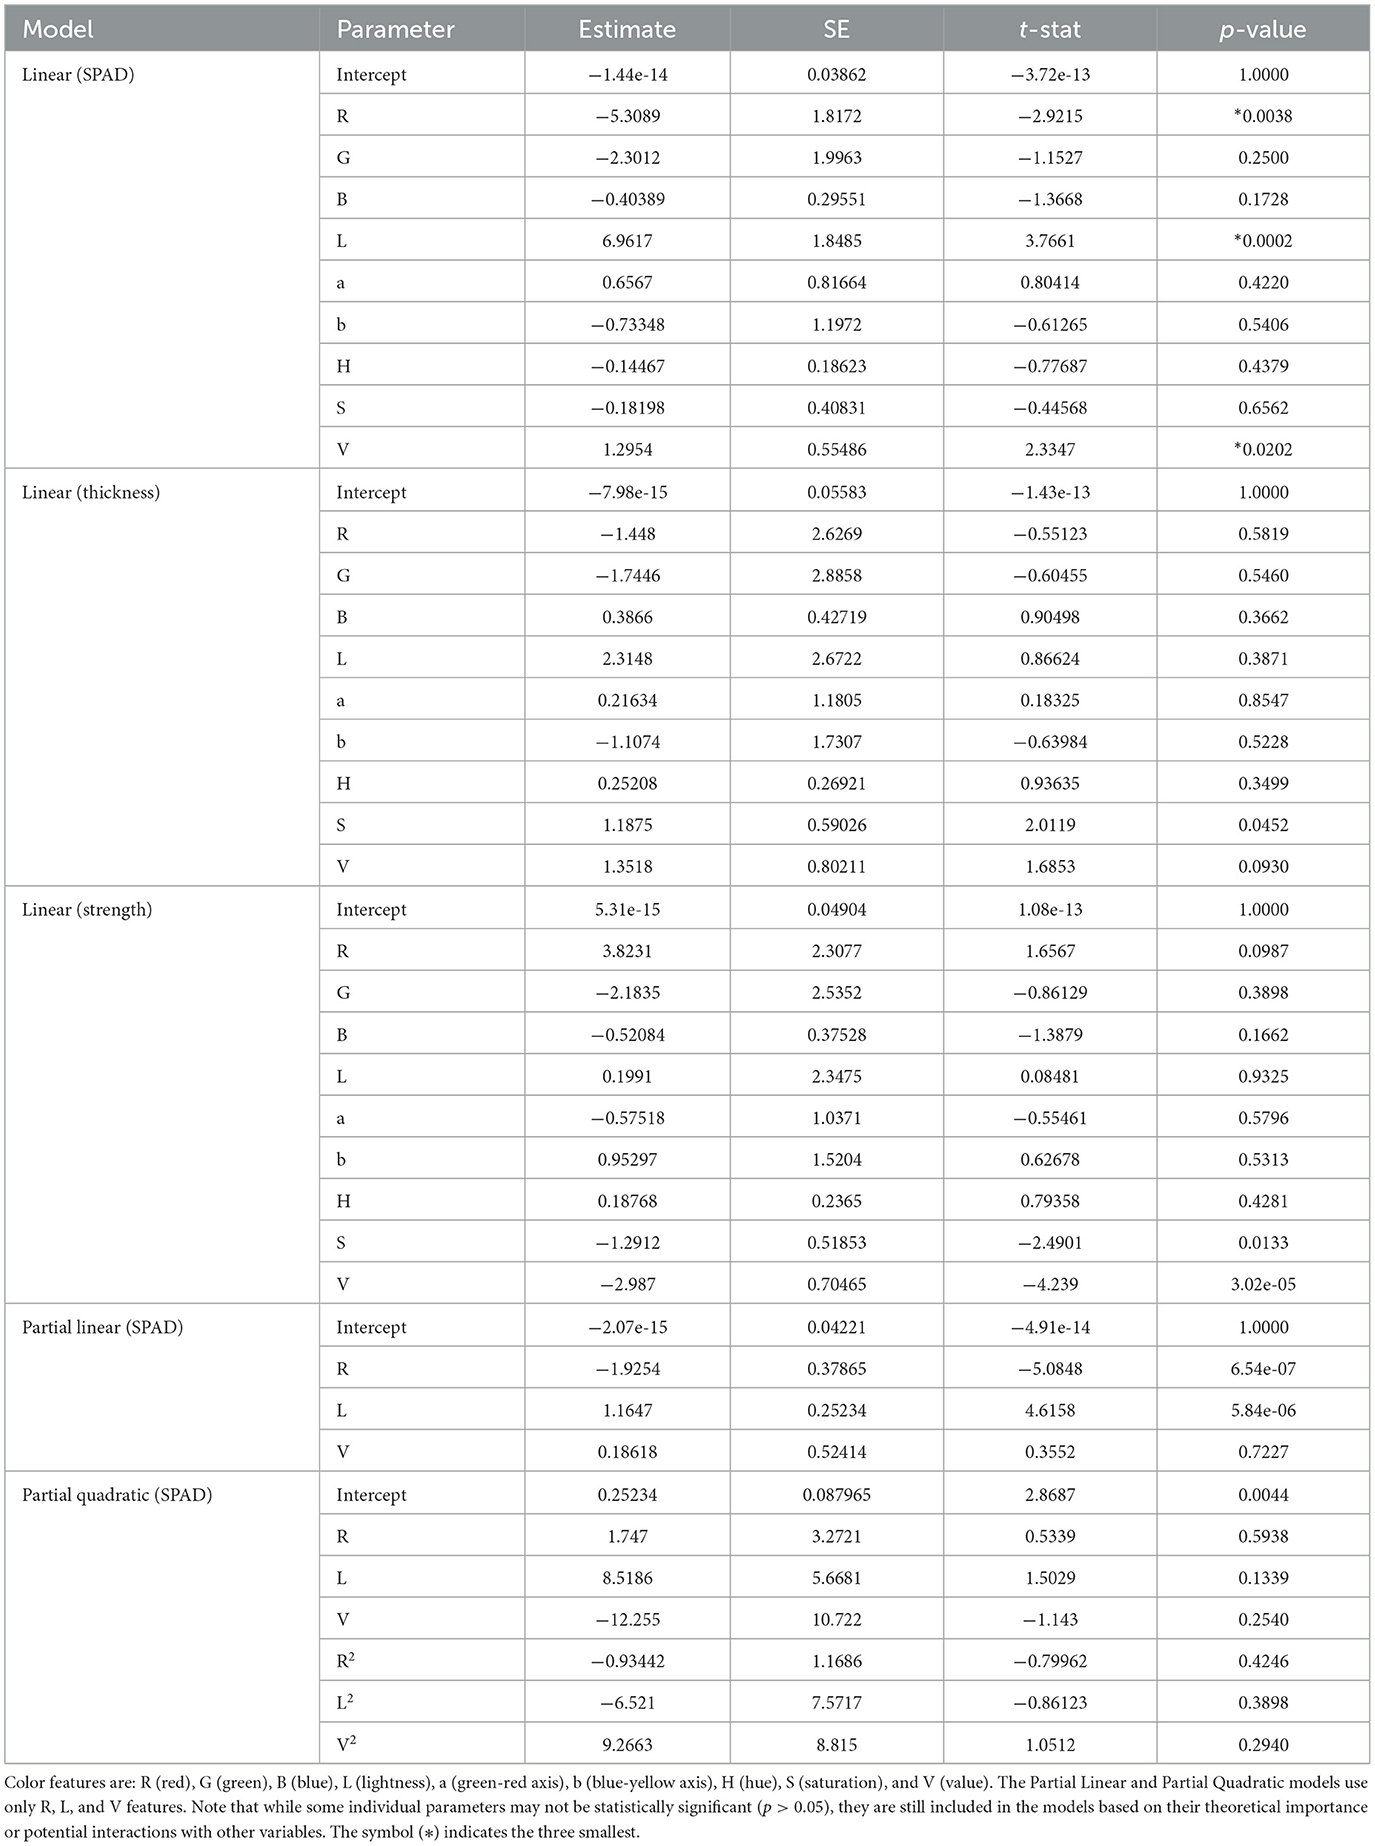
Table 5. Model parameters and statistics for salted wakame samples, including parameter estimates, standard errors (SE), t-statistics, and p-values for various regression models, excluding the quadratic (SPAD) model due to its complexity.
3.4.2.1 SPAD value prediction models
Linear regression model: The simple linear regression model for salted wakame samples performed less well than the frozen samples. The adjusted R2 of the model was 0.553, indicating that the model could explain 55.3% of the variation in SPAD values. Although this explanatory power was less than that of the frozen samples, it still indicated a moderate linear relationship between color features and SPAD values. The model's F-statistic was 42 (p = 1.23e-47), indicating that the model was highly significant overall. Unlike the frozen samples, several variables in the salted samples showed significance, particularly R (red channel, p = 0.0037571), L (lightness, p = 0.00020077), and V (value, p = 0.020241). This suggested that after salt curing, these specific color features formed a more direct relationship with SPAD values. The model's RMSE was 0.669, lower than the frozen samples. This might have reflected that the variation in SPAD values after salt curing was smaller, or that the predictions for salted samples were relatively more accurate.
Quadratic regression model: After introducing quadratic terms and interaction terms, the model performance improved, with the adjusted R2 increasing to 0.584. This improvement was more noticeable than in the frozen samples, suggesting that in salted samples, there might have been more complex non-linear relationships between SPAD values and color features. In this extended model, multiple quadratic terms and interaction terms showed statistical significance (p < 0.05). This further confirmed the existence of complex non-linear relationships between SPAD values and color features. The model's F-statistic was 10.3 (p = 1.82e-36), which, although decreased, was still highly significant. The RMSE decreased to 0.645, indicating that considering non-linear relationships improved prediction accuracy. However, this error value was still relatively high, suggesting that even more complex models struggled to fully capture the variation in SPAD values of salted wakame.
Simplified linear regression model: The simplified model for salted samples used three variables: R, L, and V, and its performance significantly decreased, with an adjusted R2 of only 0.465. This indicated that, unlike frozen samples, SPAD value prediction for salted wakame might have required more color features. In this model, R (red channel, p = 6.5397e-07) and L (lightness, p = 5.8431e-06) showed high significance. Interestingly, V (value) was not significant in this model (p = 0.72269), contrasting with the full variable model. The model's F-statistic was 87.8 (p = 1.19e-40), which, although still highly significant, was far lower than the full variable model. The RMSE increased to 0.731, further confirming the limitations of the simplified model in salted samples.
Simplified quadratic regression model: The simplified quadratic model for salted samples also used three basic variables R, L, and V, and added their quadratic terms and interaction terms. This model's performance decreased, with an adjusted R2 of only 0.0941, worse than the simplified linear model. In this model, only the intercept term (p = 0.0044211) showed statistical significance. Other variables and interaction terms were not significant, which might have indicated that in salted samples, a simplified non-linear model was not suitable for predicting SPAD values. The model's F-statistic was 6.18 (p = 4.04e-06), which, although still significant, was far lower than the simplified linear model. The RMSE increased to 0.952, further confirming the performance decline of this model.
Random forest model: The random forest model performed best in salted samples as well, with an adjusted R2 reaching 0.806. Although this result was lower than the frozen samples, it still indicated that random forests could effectively capture complex non-linear relationships. The model's RMSE decreased to 0.433, the lowest among all salted sample models. The F-statistic was 139.1 (p-value close to 0), further confirming the model's strong predictive power. Although this result was lower than the frozen samples, it still indicated that random forests could effectively capture complex non-linear relationships. Figure 7 illustrated these complex, non-linear relationships captured by the Random Forest model for salted wakame samples.
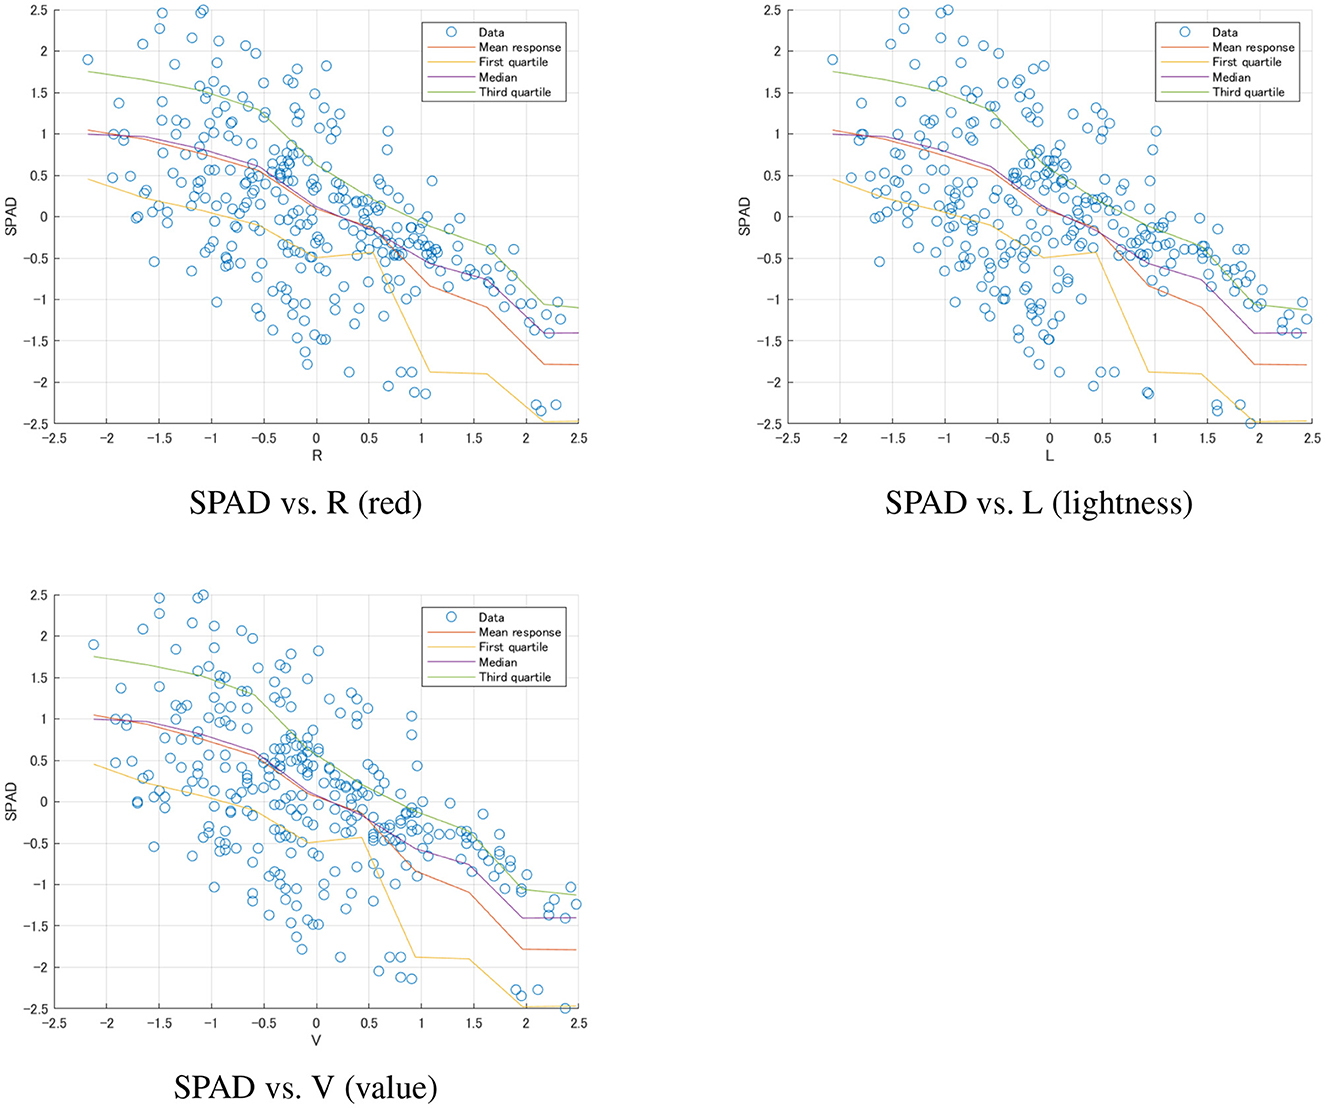
Figure 7. Random Forest model predictions for salted wakame samples. Each plot shows the relationship between SPAD values and a specific color feature (R, L, V). The scatter points represent the actual data, while the lines show the mean response and quartiles predicted by the model. These plots illustrate the complex, non-linear relationships captured by the Random Forest model and the varying degrees of prediction uncertainty across different color features.
3.4.2.2 Thickness prediction model
Linear regression model: The thickness prediction model for salted wakame samples performed very poorly, with an adjusted R2 of only 0.065, even lower than the frozen samples. This indicated that color features could barely explain the variation in salted wakame thickness. The model's F-statistic was 3.31 (p = 0.000726), which, although reaching statistical significance, had extremely limited predictive power. Among all predictor variables, only S (saturation, p = 0.045158) barely reached the significance level. This contrasted with the frozen samples where G and a were significant, possibly reflecting the profound impact of salt curing on wakame structure, fundamentally changing the relationship between thickness and color features. The model's RMSE was 0.967, comparable to the frozen samples. However, considering the model's low explanatory power, this might have more reflected that the variation in thickness data itself was small rather than high model accuracy. This result emphasized that predicting thickness using only color features was even more challenging in salted wakame.
3.4.2.3 Strength prediction model
Linear regression model: Surprisingly, the strength prediction model for salted wakame samples performed significantly better than the frozen samples. The model's adjusted R2 reached 0.278, which, although still not high, was a significant improvement over the 0.0481 of the frozen samples. This interesting finding might have suggested that salt curing altered the wakame's structure, making the relationship between color features and strength more apparent. The model's F-statistic was 13.8 (p = 1.74e-18), far higher than the frozen samples, indicating that the model had stronger overall significance. Among the predictor variables, S (saturation, p = 0.013332) and V (value, p = 3.0207e-05) showed high significance, both negatively correlated with strength. This finding had important practical implications and might have reflected changes in wakame structure and optical properties during the salt curing process. The RMSE was 0.774, lower than the 0.976 of the frozen samples, further confirming the relative superiority of the salted sample model. This result emphasized the profound impact of processing methods on the relationship between wakame physical properties and color features.
3.4.3 Comparative analysis of frozen and salted wakame samples
3.4.3.1 Comparison of SPAD value prediction models
Linear regression model: Comparing Tables 4, 6, we could see that the linear regression model for frozen samples (R2 = 0.768, RMSE = 0.482) clearly outperformed the salted sample model (R2 = 0.553, RMSE = 0.669). This suggested that salt curing might have increased the complexity of the relationship between SPAD values and color features.
Quadratic regression model: Both sample types showed improvement, but to different degrees. The improvement in frozen samples was small (R2 from 0.768 to 0.757), while the improvement in salted samples was more noticeable (R2 from 0.553 to 0.584). This suggested that more complex non-linear relationships might have existed in salted samples.
Simplified linear regression model: The simplified model for frozen samples (R2 = 0.770) almost maintained the performance of the full variable model, while the simplified model for salted samples (R2 = 0.465) showed a significant performance decline. This indicated that after salt curing, more color features might have been needed to accurately predict SPAD values.
Simplified quadratic regression model: Interestingly, this model performed poorly in frozen samples (R2 = 0.330) but showed improvement in salted samples (R2 = 0.0941). This again emphasized that salt curing might have introduced more complex non-linear relationships that simple quadratic models might not have been able to capture.
Random forest model: In both sample types, the random forest model performed best, but frozen samples (R2 = 0.900, RMSE = 0.308) outperformed salted samples (R2 = 0.806, RMSE = 0.433). This indicated that even when considering complex non-linear relationships, SPAD values in frozen samples were still easier to predict. Figures 6, 7 illustrate these differences visually.
Overall, SPAD value prediction models for frozen samples generally outperformed those for salted samples, possibly because freezing better preserved the original optical properties of wakame. Salt curing might have altered the structure and pigment distribution of wakame, increasing the difficulty of prediction.
3.4.3.2 Comparison of thickness prediction models
Linear regression model: Comparing the thickness prediction models, we observed that the model for frozen samples (R2 = 0.133, RMSE = 0.931), although performing poorly, still significantly outperformed the salted sample model (R2 = 0.065, RMSE = 0.967), as shown in Tables 4, 6. Both models demonstrated that color features struggled to accurately predict wakame thickness, but the situation was more severe for salted samples. Notably, G and a variables were significant in frozen samples, while only the S variable was barely significant in salted samples. This difference might have reflected the profound impact of salt curing on wakame structure, fundamentally altering the relationship between thickness and color features. The vast difference in RMSE (0.931 vs. 0.121) might have suggested different effects of the two processing methods on wakame thickness distribution, which required further research to explain.
3.4.3.3 Comparison of strength prediction models
Linear regression model: The strength prediction models presented the most interesting contrast. As evident from Tables 4, 6, the salted sample model (R2 = 0.278, RMSE = 0.849) significantly outperformed the frozen sample model (R2 = 0.0481, RMSE = 0.976). This finding challenged our intuition, suggesting that salt curing might have somehow enhanced the connection between wakame strength and its visual features. In frozen samples, only G and H variables showed weak significance. In contrast, S and V variables in salted samples were highly significant and negatively correlated with strength. This difference might have reflected how the salt curing process altered wakame structure, possibly making certain visual features more indicative of its physical strength.
4 Discussion
4.1 Impact of processing methods on wakame properties
The impact of processing methods on wakame properties was significant, with freezing and salt curing producing markedly different effects on both optical and physical characteristics. Freezing appeared to be more effective in preserving original property relationships, particularly in terms of SPAD value prediction. In contrast, salt curing introduced greater complexity to the prediction process, likely due to salt-induced changes in wakame tissue structure and pigment distribution, which aligns with previous findings on pigment alterations in processed seaweed products (Torres et al., 2020). The novelty of this study lay in systematically combining image analysis with physical and biochemical measurements to assess the distinct effects of freezing and salting on wakame's color, thickness, and strength. Results indicated that freezing better preserved the original color and structural integrity of wakame, while salting led to a green shift in color and slight structural reductions, providing scientific insights into processing choices for food production, further complementing research on seaweed quality assessment using biochemical and structural measurements (Zhao et al., 2021).
4.2 Model performance and non-linear relationships
Non-linear relationships played a crucial role in both sample types, with their consideration through quadratic models or random forests improving predictive performance to varying degrees. Salted samples exhibited stronger non-linear characteristics, possibly resulting from the complex changes introduced by the curing process. The applicability of simplified models varied between processing methods. For frozen samples, simplified linear models excelled in SPAD value prediction, offering valuable practical applications. However, these models showed significant performance decline for salted samples, suggesting the need for more complex models to accurately capture post-processing property relationships. This finding supports prior work emphasizing the necessity of advanced modeling techniques in agricultural and food science contexts (Guo et al., 2022).
4.3 Prediction challenges across attributes
Prediction difficulty generally increased for salted samples across various attributes such as SPAD value, thickness, and strength, with strength prediction being a notable exception. This underscored the profound impact of processing methods on wakame properties and highlighted the complexity involved in developing universal prediction models. The unexpected superior performance of strength prediction models for salted samples compared to frozen samples warranted further investigation. This finding might have provided insights into how salt curing altered wakame structure, potentially enhancing the correlation between certain visual features and physical strength.
4.4 Model selection and practical applications
Model selection considerations revealed that while random forest models performed best for SPAD value prediction in both sample types, they might have introduced issues of interpretability and computational complexity. Practical applications might have required a balance between prediction accuracy and model simplicity. Simple linear models might have sufficed for frozen wakame, especially in SPAD value prediction. However, salted wakame might have required more complex models like random forests to achieve acceptable prediction accuracy. The development of universal wakame quality assessment methods had to consider the impact of processing methods on prediction models. These findings align with Guo et al. (2022), which highlights the importance of model selection in addressing non-linear and complex interactions in agricultural datasets, emphasizing the adaptability of random forest models to scenarios requiring nuanced analyzes of highly variable data.
4.5 Comparison with other studies
In this study, we used RGB, Lab*, and HSV color spaces for predictive analysis, providing a refined perspective on the impact of processing methods on wakame quality. This approach highlights the unique capability of color features to predict SPAD values, especially in frozen wakame samples.
To illustrate the effectiveness of the Random Forest model in our study, we provide a brief comparison with other food-related studies that also utilize SPAD value prediction models, though focused on different subjects. For example, a broader study on UAV-based SPAD estimation across crops (Wang et al., 2021) reported that the RF-SVR sigmoid model achieved an R2 of 0.754 and an RMSE of 1.716. This model effectively supports large-scale SPAD measurements, demonstrating Random Forest's capacity in crop monitoring and management. Additionally, in a maize study (Guo et al., 2022), a Support Vector Machine (SVM) model outperformed the Random Forest model, achieving an R2 of 0.81 and an RMSE of 0.14. This comparison highlights how different models may perform better depending on the sample's unique characteristics. In a smartphone-based SPAD estimation study using a 1-D Convolutional Neural Network (CNN; Barman and Saikia, 2024), an R2 of 0.82 and an RMSE of 3.92 were reported, suggesting CNN as a viable, low-cost alternative for crops like tea leaves.
In contrast, our study achieved notably higher performance with the Random Forest model for SPAD prediction in frozen wakame, with an R2 of 0.905, an adjusted R2 of 0.900, and an RMSE of 0.308, highlighting its particular suitability for wakame. For salted samples, the Random Forest model also performed best, with an R2 of 0.812, an adjusted R2 of 0.806, and an RMSE of 0.433. While performance was slightly lower than in frozen samples, it remains competitive, underscoring the complexity introduced by salt curing and the need for higher-order models in such cases.
These findings underscore the importance of selecting models suited to specific characteristics of processed wakame. The Random Forest model performed well in both frozen and salted wakame, whereas simpler models were insufficient, particularly in handling the complexity of salted samples. This demonstrates that higher-order, nonlinear models are essential to accurately capture property relationships under different processing conditions, suggesting areas for further refinement in predictive modeling for wakame quality assessment.
4.6 Future research directions and study limitations
Future research directions should explore additional factors influencing SPAD values, thickness, and strength, such as growth conditions and age. Studies on how salt curing alters wakame microstructure and optical properties could enhance our understanding of prediction model differences. Additionally, incorporating image texture features alongside color features could provide a more comprehensive understanding of wakame properties, as texture analysis might capture subtle changes in tissue structure that color alone cannot. Combining image analysis with other non-invasive measurement techniques and developing hybrid or adaptive models capable of accommodating different processing methods are also promising avenues for investigation.
Limitations of the study included the relatively small sample size (180 frozen samples, 300 salted samples), which might have affected model generalization, the exclusion of potentially influential factors such as specific wakame species and environmental conditions, and the primary reliance on color features, which might have overlooked other important visual or non-visual characteristics.
5 Conclusion
This study investigated the effects of freezing and salt curing on wakame property prediction, highlighting the significance of processing methods in non-invasive quality assessments. Color features were effective in predicting SPAD values, especially for frozen samples, while properties like thickness and strength require further exploration. Salt curing introduced complexities that non-linear models, such as random forests, effectively addressed, particularly in strength prediction. These findings underscore the need for adaptive models to improve prediction accuracy. Future research should focus on refining models to account for different processing methods and enhance assessment accuracy, ultimately contributing to reliable, rapid quality control methods for the wakame industry and advancing wakame science in production and processing.
Data availability statement
The original contributions presented in the study are included in the article/supplementary material. Further inquiries can be directed to the corresponding authors.
Author contributions
XL: Conceptualization, Data curation, Formal analysis, Investigation, Methodology, Resources, Software, Supervision, Validation, Visualization, Writing – original draft, Writing – review & editing. TS: Data curation, Formal analysis, Investigation, Methodology, Validation, Visualization, Writing – review & editing. NS: Data curation, Formal analysis, Investigation, Methodology, Validation, Writing – review & editing. ZW: Conceptualization, Formal analysis, Investigation, Methodology, Writing – review & editing. CY: Conceptualization, Data curation, Formal analysis, Funding acquisition, Investigation, Methodology, Project administration, Resources, Software, Supervision, Validation, Visualization, Writing – review & editing.
Funding
The author(s) declare financial support was received for the research, authorship, and/or publication of this article. This research was supported by the Sanriku Fund, which provided financial assistance for material acquisition, data collection, and analysis. The fund played a crucial role in supporting the successful completion of this study.
Conflict of interest
The authors declare that the research was conducted in the absence of any commercial or financial relationships that could be construed as a potential conflict of interest.
Publisher's note
All claims expressed in this article are solely those of the authors and do not necessarily represent those of their affiliated organizations, or those of the publisher, the editors and the reviewers. Any product that may be evaluated in this article, or claim that may be made by its manufacturer, is not guaranteed or endorsed by the publisher.
References
Aryee, A. N., Agyei, D., and Akanbi, T. O. (2018). Recovery and utilization of seaweed pigments in food processing. Curr. Opin. Food Sci. 19, 113–119. doi: 10.1016/j.cofs.2018.03.013
Barman, U., and Saikia, M. J. (2024). Smartphone contact imaging and 1-D CNN for leaf chlorophyll estimation in agriculture. Agriculture 14:1262. doi: 10.3390/agriculture14081262
Beratto-Ramos, A., Agurto-Muñoz, C., Vargas-Montalba, J. P., and Castillo, R. d. P. (2020). Fourier-transform infrared imaging and multivariate analysis for direct identification of principal polysaccharides in brown seaweeds. Carbohydr. Polym. 230:115561. doi: 10.1016/j.carbpol.2019.115561
Calmes, B., Strittmatter, M., Jacquemin, B., Perrineau, M.-M., Rousseau, C., Badis, Y., et al. (2020). Parallelisable non-invasive biomass, fitness and growth measurement of macroalgae and other protists with nephelometry. Algal Res. 46:101762. doi: 10.1016/j.algal.2019.101762
Charles, A. L., Sridhar, K., and Alamsjah, M. A. (2020). Effect of drying techniques on color and bioactive potential of two commercial edible indonesian seaweed cultivars. J. Appl. Phycol. 32, 563–572. doi: 10.1007/s10811-019-01916-4
Donnelly, A., Yu, R., Rehberg, C., Meyer, G., and Young, E. B. (2020). Leaf chlorophyll estimates of temperate deciduous shrubs during autumn senescence using a spad-502 meter and calibration with extracted chlorophyll. Ann. For. Sci. 77, 1–12. doi: 10.1007/s13595-020-00940-6
Drenthen, G. S., Backes, W. H., Aldenkamp, A. P., Vermeulen, R. J., Klinkenberg, S., and Jansen, J. F. (2020). On the merits of non-invasive myelin imaging in epilepsy, a literature review. J. Neurosci. Methods 338:108687. doi: 10.1016/j.jneumeth.2020.108687
Galieni, A., D'Ascenzo, N., Stagnari, F., Pagnani, G., Xie, Q., and Pisante, M. (2021). Past and future of plant stress detection: an overview from remote sensing to positron emission tomography. Front. Plant Sci. 11:609155. doi: 10.3389/fpls.2020.609155
Guo, Y., Chen, S., Li, X., Cunha, M., Jayavelu, S., Cammarano, D., et al. (2022). Machine learning-based approaches for predicting spad values of maize using multi-spectral images. Rem. Sens. 14:1337. doi: 10.3390/rs14061337
Indrawati, R., Sukowijoyo, H., Wijayanti, R. D. E., Limantara, L., et al. (2015). Encapsulation of brown seaweed pigment by freeze drying: characterization and its stability during storage. Proc. Chem. 14, 353–360. doi: 10.1016/j.proche.2015.03.048
Ling, Q., Huang, W., and Jarvis, P. (2011). Use of a spad-502 meter to measure leaf chlorophyll concentration in arabidopsis thaliana. Photosynth. Res. 107, 209–214. doi: 10.1007/s11120-010-9606-0
Manninen, H., Paakki, M., Hopia, A., and Franzén, R. (2015). Measuring the green color of vegetables from digital images using image analysis. LWT-Food Sci. Technol. 63, 1184–1190. doi: 10.1016/j.lwt.2015.04.005
Netto, A. T., Campostrini, E., de Oliveira, J. G., and Bressan-Smith, R. E. (2005). Photosynthetic pigments, nitrogen, chlorophyll a fluorescence and spad-502 readings in coffee leaves. Sci. Horticult. 104, 199-209. doi: 10.1016/j.scienta.2004.08.013
Richardson, A. D., Duigan, S. P., and Berlyn, G. P. (2002). An evaluation of noninvasive methods to estimate foliar chlorophyll content. N. Phytol. 153, 185–194. doi: 10.1046/j.0028-646X.2001.00289.x
Selvaraj, S. (2021). Development of Novel Image Analysis Approaches for Seaweed Discrimination–Species Level Study Using Field Spectroscopy and UAV Multispectral Remote Sensing (Ph. D. thesis), Auckland University of Technology, Auckland, New Zealand.
Shah, S. H., Houborg, R., and McCabe, M. F. (2017). Response of chlorophyll, carotenoid and spad-502 measurement to salinity and nutrient stress in wheat (Triticum aestivum L.). Agronomy 7:61. doi: 10.3390/agronomy7030061
Sung, W.-C., Lin, H.-T., Liao, W.-C., and Fang, M. (2023). Effects of halogen lamp and traditional sun drying on the volatile compounds, color parameters, and gel texture of gongliao gelidium seaweed. Foods 12:4508. doi: 10.3390/foods12244508
Torres, M. D., Kraan, S., and Dominguez, H. (2020). Sustainable Seaweed Technologies: Cultivation, Biorefinery, and Applications. Amsterdam: Elsevier.
van Ginneken, V., and de Vries, E. (2017). Imaging spectroscopy of a green-, brown-, and red-seaweed under laboratory conditions. SCIAEON J. Radiol. 1, 1–11.
Wang, J., Zhou, Q., Shang, J., Liu, C., Zhuang, T., Ding, J., et al. (2021). UAV-and machine learning-based retrieval of wheat spad values at the overwintering stage for variety screening. Rem. Sens. 13:5166. doi: 10.3390/rs13245166
Wang, M., Hu, C., Cannizzaro, J., English, D., Han, X., Naar, D., et al. (2018). Remote sensing of sargassum biomass, nutrients, and pigments. Geophys. Res. Lett. 45, 12–359. doi: 10.1029/2018GL078858
Keywords: wakame, visual analysis, SPAD, thickness, strength, machine learning, food processing
Citation: Lu X, Suzuki T, Shimoyama N, Wang Z and Yuan C (2024) Visual identification of material attributes in wakame: exploring thickness, strength, and chlorophyll content. Front. Sustain. Food Syst. 8:1493220. doi: 10.3389/fsufs.2024.1493220
Received: 08 September 2024; Accepted: 27 November 2024;
Published: 18 December 2024.
Edited by:
Laurent Dufossé, Université de la Réunion, FranceCopyright © 2024 Lu, Suzuki, Shimoyama, Wang and Yuan. This is an open-access article distributed under the terms of the Creative Commons Attribution License (CC BY). The use, distribution or reproduction in other forums is permitted, provided the original author(s) and the copyright owner(s) are credited and that the original publication in this journal is cited, in accordance with accepted academic practice. No use, distribution or reproduction is permitted which does not comply with these terms.
*Correspondence: Zhuolin Wang, emh1b2xpbjZAaXdhdGUtdS5hYy5qcA==
 Xin Lu
 Tomoya Suzuki2
 Zhuolin Wang
 Chunhong Yuan