
95% of researchers rate our articles as excellent or good
Learn more about the work of our research integrity team to safeguard the quality of each article we publish.
Find out more
ORIGINAL RESEARCH article
Front. Plant Sci. , 03 May 2022
Sec. Plant Bioinformatics
Volume 13 - 2022 | https://doi.org/10.3389/fpls.2022.893278
 Qing Lu1Hao Liu1Yanbin Hong1Xuanqiang Liang1Shaoxiong Li1Haiyan Liu1Haifen Li1Runfeng Wang1Quanqing Deng1Huifang Jiang2Rajeev K. Varshney3,4Manish K. Pandey3Xiaoping Chen1*
The far-red-impaired response 1 (FAR1) transcription family were initially identified as important factors for phytochrome A (phyA)-mediated far-red light signaling in Arabidopsis; they play crucial roles in controlling the growth and development of plants. The reported reference genome sequences of Arachis, including A. duranensis, A. ipaensis, A. monticola, and A. hypogaea, and its related species Glycine max provide an opportunity to systematically perform a genome-wide identification of FAR1 homologous genes and investigate expression patterns of these members in peanut species. Here, a total of 650 FAR1 genes were identified from four Aarchis and its closely related species G. max. Of the studied species, A. hypogaea contained the most (246) AhFAR1 genes, which can be classified into three subgroups based on phylogenic relationships. The synonymous (Ks) and non-synonymous (Ka) substitution rates, phylogenetic relationship and synteny analysis of the FAR1 family provided deep insight into polyploidization, evolution and domestication of peanut AhFAR1 genes. The transcriptome data showed that the AhFAR1 genes exhibited distinct tissue- and stage-specific expression patterns in peanut. Three candidate genes including Ahy_A10g049543, Ahy_A06g026579, and Ahy_A10g048401, specifically expressed in peg and pod, might participate in pod development in the peanut. The quantitative real-time PCR (qRT-PCR) analyses confirmed that the three selected genes were highly and specifically expressed in the peg and pod. This study systematically analyzed gene structure, evolutionary characteristics and expression patterns of FAR1 gene family, which will provide a foundation for the study of genetic and biological function in the future.
Plants, as sessile organisms, utilize sophisticated sensory systems to adapt to environmental changes. As one of the most important environmental factors, light participates in multiple biological processes, such as plant growth, photomorphogenesis, stomata movement, chloroplast development, circadian rhythms, and flowering (Quail, 2002; Wang and Deng, 2003; Huang et al., 2012; Huai et al., 2020; Krzeszowiec et al., 2020). In order to adapt to different light environment changes, such as direction, duration, quantity, and wavelength of light, plants have obtained a series of sophisticated photoreceptors, including phytochromes, cryptochromes, and phototropins receptors (Casal, 2000). The phytochromes mainly sense red and far-red wavelengths whereas the cryptochromes and phototropins detect the blue/ultraviolet-A region of the spectrum. Of them, phytochromes are the most extensively studied. In Arabidopsis, five distinct genes (PHYA-PHYE) encoding specific phytochromes were identified (Briggs and Olney, 2001). Of the five phytochromes, PHYA is primarily responsible for eliciting various far-red light-mediated responses, including regulation of hypocotyl elongation and controlling flowering and expansion of cotyledons (Whitelam et al., 1993; Briggs and Olney, 2001). The energetic activity of PHYA is transported from the cytosol to the nucleus to mediate various far-red light induced responses through interactions with far-red elongated hypocotyls 1 (FHY1) or FHY1-like (FHL) proteins, whose products are crucial for PHYA nuclear accumulation. Subsequently, the nuclear accumulation of PHYA promotes downstream transcription and activates the subsequent responses (Wang and Deng, 2002; Lin et al., 2007). Molecular studies have confirmed that far-red elongated hypocotyl 3 (FHY3) and its homologous gene far-red-impaired response 1 (FAR1), which encode two proteins related to Mutator-like transposases, directly activate the transcription of FHY1/FHL to modulate PHYA signaling under far-red light conditions by binding the promoters of FHY1 and FHL. Consequently, FHY3 and FAR1 also play multifaceted roles in PHYA signaling (Wang and Wang, 2015).
In Arabidopsis, FHY3, FAR1, and 12 FAR1-related sequences (FRS1 to FRS12) have been identified. These genes or sequences revealed high homology and highly conserved protein secondary structures (Lin and Wang, 2004). A phylogenetic analysis of proteins indicated that the FHY3 and FAR1 family can be classified into six subgroups. Most of the families of proteins have a DNA-binding domain in their N-terminal regions. As exceptions, FRS7 and FRS12 have two DNA-binding domains, and FRS9 has no DNA-binding domain in the N-terminal region (Ma and Li, 2018). In addition, FRSs and FRS-like proteins have also been identified in other plants, suggesting that these proteins are conserved throughout the evolution of the plant kingdom (Takano et al., 2001; Du et al., 2021). Chromatin immunoprecipitation sequencing analyses have indicated that FHY3 specifically binds to the promoter regions of 1559 and 1009 direct target genes in dark and far-red light conditions, respectively, through the FHY3/FAR1 binding motif (CACGCGC) in Arabidopsis (Ouyang et al., 2011). Although FRS9 contains no DNA-binding domain, it might be involved in light signal transduction by interacting with other target genes. Gene expression regulation studies indicated that FHY3/FAR1 play a critical role in light signal transduction, and regulates plant growth, development, immunity, and defense (Wang et al., 2016; Liu et al., 2019b; Xie et al., 2020).
Peanut or groundnut (Arachis hypogaea) is one of the most important oil and food leguminous crops, which was expanded to Europe, Africa, Asia, and the Pacific Islands and has an annual production of ∼53.6 million tons in 2020 (FAOSTAT., 2020). Peanut is an allotetraploid (AABB, 2n = 4x = 40) derived from hybridization between two diploids progenitors, A. duranensis (AA) and A. ipaensis (BB), which all have been sequenced previously (Seijo et al., 2007; Robledo et al., 2009; Bertioli et al., 2016; Chen et al., 2016a; Lu et al., 2018). Genomic in situ hybridization indicated that the allotetraploid wild species A. monticola (AABB, 2n = 4x = 40) might be the immediate wild ancestor of A. hypogaea (Seijo et al., 2007). Peanut is distinguished from other crops that flower by aerial methods and form subterranean fruits. After flowering, self-pollination and fertilization, the gynophore (commonly called peg) carrying the embryo elongates into to the ground to penetrate the soil to develop into a pod, under dark conditions. However, when the gynophore fails to penetrate into the soil, the embryo is affected by light, resulting in abortion of the embryo formation. Therefore, light plays a crucial determining role in regulating embryo development and promoting pod enlargement in peanut. The FAR1 gene has been observed to play key roles in light signal transduction and regulation of plant development. In peanut species, functional analysis of AhJ11-FAR1-5 indicated that this gene enhanced tolerance to drought stress (Yan et al., 2020). However, there are several reports of the FAR1 gene family being involved in light responses in peanut. Interestingly, we identified that the FAR1 transcription factors expanded in cultivated peanut and its two wild diploid progenitors, A. duranensis and A. ipaensis (Chen et al., 2016a; Lu et al., 2018). We hypothesized that the Arachis-specific expansion of the FAR1 family may be related to geocarpy and pod development, considering the pivotal role of the FAR1 gene family in modulating phyA-signaling transduction in plants (Casal, 2000; Wang and Deng, 2003; Huang et al., 2012). Herein, a genome wide identification of FAR1 gene family in Arachis, including A. duranensis, A. ipaensis, A. monticola, and A. hypogaea, and its closely related species G. max was performed to interrogate gene structure, evolutionary relationships, conserved motifs, and expression patterns. This study will provide a theoretical reference for further genetic and functional studies.
The HMMER3 (Mistry et al., 2013)1 was used to search FAR1 gene family domains based on the hidden Markov model (HMM) file (PF03101), which was downloaded from the Pfam (Finn et al., 2014) database2 by the FAR1 DNA binding domain identity PF03101. Four Arachis genomes, including A. duranensis, A. ipaensis (Bertioli et al., 2016), A. monticola (Yin et al., 2018), and A. hypogaea (Chen et al., 2019), were downloaded from the relevant database exhibited in each previous report. The G. max genome version 2.1 was obtained from the NCBI database (assembly accession: GCF_000004515.5). The key parameters were set as default and the cutoff value was set as 1e-15. The identified FAR1 members were confirmed using NCBI-Conserved Domain Database (CDD),3 SMART,4 and Pfam (Finn et al., 2014) (see text footnote 2) databases. All incorrect, repetitive, and non-FAR1 family members were removed.
The protein sequences of FAR1 family members were used to create multiple alignments using ClustalW with default parameter sets. The phylogenetic tree was constructed using MEGA version 7.0 under the neighbor-joining (NJ) method with 1000 bootstrap replicates (Kumar et al., 2016).
According to physical position, all the FAR1 genes were mapped to each reference genome using TBtools version 1.068 (Chen et al., 2020). Gene duplication events were analyzed using MCScanX with default parameters (Wang et al., 2012). The syntonic map was constructed using Python jcvi utility libraries.5 Non-synonymous (Ka) and synonymous (Ks) substitution of duplicated FAR1 genes were calculated by using KaKs_Calculator 2.0 (Wang et al., 2010) and plotted using R ggplot2 (Wickham, 2016).
The FAR1 gene structures were analyzed based on reference genome annotation information using our in-house Perl scripts. The conserved domain motifs of FAR1 members were identified by MEME version 4.12.0 (Bailey et al., 2015) with the number of motifs set to 10 and minimum and the maximum length of motifs set to six and 100, respectively (Bailey et al., 2009). The results of the gene structures, conserved domains and phylogenetic tree were plotted by using TBtools version 1.068 (Chen et al., 2020). The in silico elements of the AhFAR1 promoter in 1500 bp regions were searched using the PlantCARE database (Lescot et al., 2002).6 The original results were filted and “light responsive” elements were retained. The features of in silico elements were visualized by GSDS 2.0 (Hu et al., 2015).7
The transcriptomes of five different typical tissues, including flower, peg, leaf, root, and stem, were obtained from our previous study to analyses the expression levels of the members of the AhFAR1 gene family (Chen et al., 2019). Moreover, the transcriptomes of 11 development stages of shell and seed were downloaded from our previous report to evaluate the AhFAR1 gene expression patterns in underground tissues (Chen et al., 2016b). The expression levels of the AhFAR1 were evaluated using the fragment per kilobase million (FPKM) method. The expression levels were visualized using FPKM standardization data in R pheatmap packages.8
Six different typical components of peanut, including root, stem, leaf, peg, and pod, were used to verify AhFAR1 gene expression levels. In addition, five different developmental stages of ovule-carrying peg (peg length = 1–5 cm with 1 cm as step) and pods (including aerial, not swelling subterranean, early swelling subterranean, swelling subterranean, and mature pods) were used to confirm the expression levels of candidate AhFAR1 genes. Total RNA was extracted from each sample using a Plant RNeasy Mini Kit (TIANGEN, Beijing, China). The quality of the RNA extracted from each sample was checked using a Nano Drop (Thermo Scientific, United States). The qRT-PCR was carried out as described by Liu et al. (2019a). DNA-free RNA was used to synthesize the first strand of cDNA. The yellow leaf specific 8 (yls8) gene (Forward Primer: 5′-AACTGCTTAGCTGCTATTACCC-3′, Reverse Primer: 5′-TCGCCAAATAACACGTTGCATT-3′) was used as an internal control. Each measurement was carried out in three experimental replications, and each reaction was performed in biological triplicate replications. The relative expression levels of each target gene was analyzed using 2–△ △ CT method.
A total of 650 FAR1 genes were identified from four Aarchis and its closely related species G. max (Supplementary Table 1). Of them, the most (246) and least (36) FAR1 genes were retrieved from A. hypogaea and G. max, respectively. The total number of FAR1 genes identified from each genome exhibited great consistency with the evolutionary genetic relationships (Supplementary Figure 1). This result suggested that the FAR1 gene family was expanding rapidly in the Arachis species, which was consistent with our previous findings (Chen et al., 2016a; Lu et al., 2018; Yan et al., 2020). All of the identified FAR1 genes were mapped on the chromosomes of their respective genomes based on the physical positions of the genes (Figure 1A and Supplementary Figure 2).
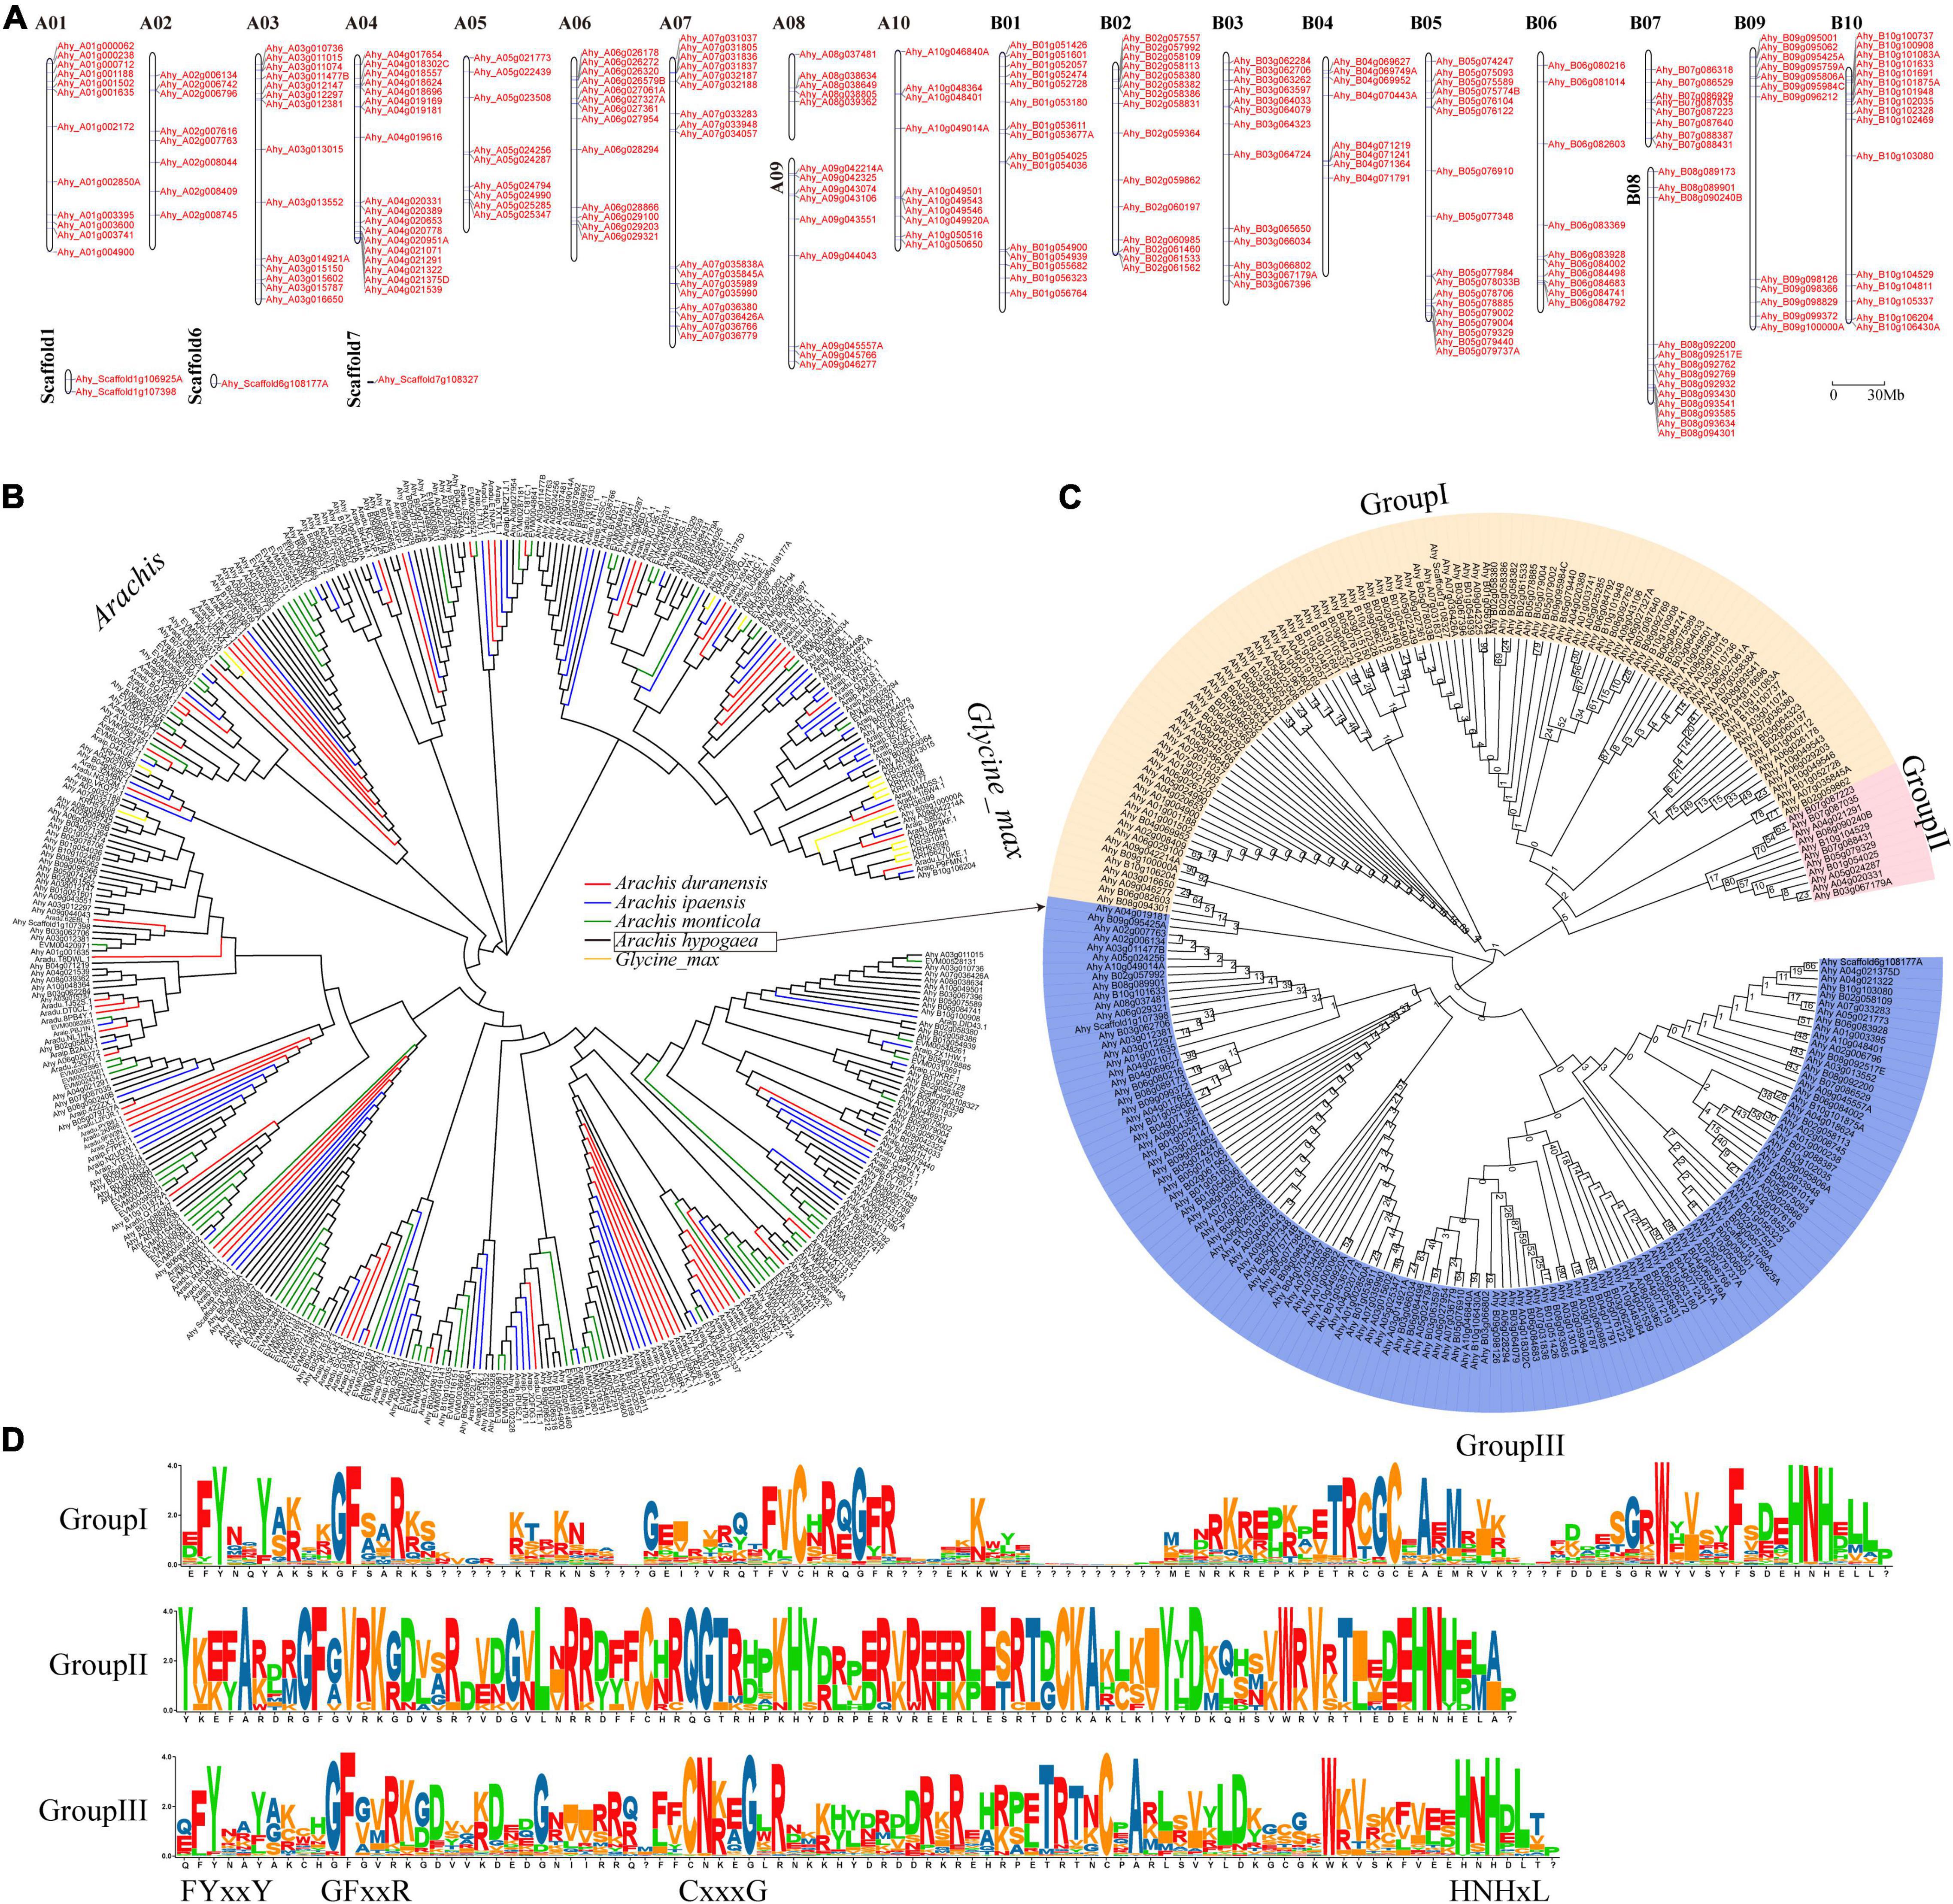
Figure 1. Genome-wide distribution and phylogenetic tree of AhFAR1 domains. (A) Distribution of the 246 AhFAR1 genes on peanut 20 chromosomes and 3 scaffolds. (B) Phylogenetic tree of FAR1 domains of different Arachis and G. max. (C) Phylogenetic tree of 246 AhFAR1 domains of A. hypogaea. The numbers at the nodes represent bootstrap percentage values computed by 1,000 replications. (D) Motif analysis of three subgroups of 246 AhFAR1.
The phylogenetic analysis revealed that the FAR1 domains could be roughly divided into Arachis and G. max groups. However, these domains identified in Arachis species could not be clearly clustered by different species attributes (Figure 1B). Moreover, the FAR1 identified in different species could be classified into different corresponding groups (Supplementary Figure 3). Deep phylogenetic analysis of the 246 AhFAR1 domains identified in A. hypogaea indicated that these domains could be classified into three main groups. Among them, 99, 11, and 136 members belong to group I, II, and III, respectively (Figure 1C). The protein sequence analysis indicated that the conserved motifs of the domains in each group were different, although they all contained the typical FAR1 conserved motifs, for example the N-terminus contained FYxxY, GFxxR, and CxxxG and the C-terminus had HNHxL (Figure 1D).
The gene structure (exon-intron-UTR), conserved motif organization and phylogenetic tree of all the FAR genes identified in each species were analyzed to gain insight into the difference of the FAR family in different plant species (Figure 2 and Supplementary Figure 4). The results showed that members belonging to the same group had almost similar motifs and gene structures. For example, in A. duranensis, the members of the red group typically contained motif 3 and motif 8. The special motif 10 gene was observed in blue group (Supplementary Figure 4). In A. hypogaea, the distribution of exon-intron-UTR structure and the motif phase corresponded with the clusters of AhFAR1 genes (Figures 1C, 2), especially for group I (yellow) and III (blue), most of which contains motif 1 and motif 2. However, for group II (red) the genes did not contain these two motifs, but contained motif 3 and motif 4 instead (Figure 2). Overall, the conserved motif organizations, similarity of gene structures and phylogenetic tree results could be confidently verified, confirming the reliability of the classifications and evolutions of the FAR1 gene family in different leguminous plant species.
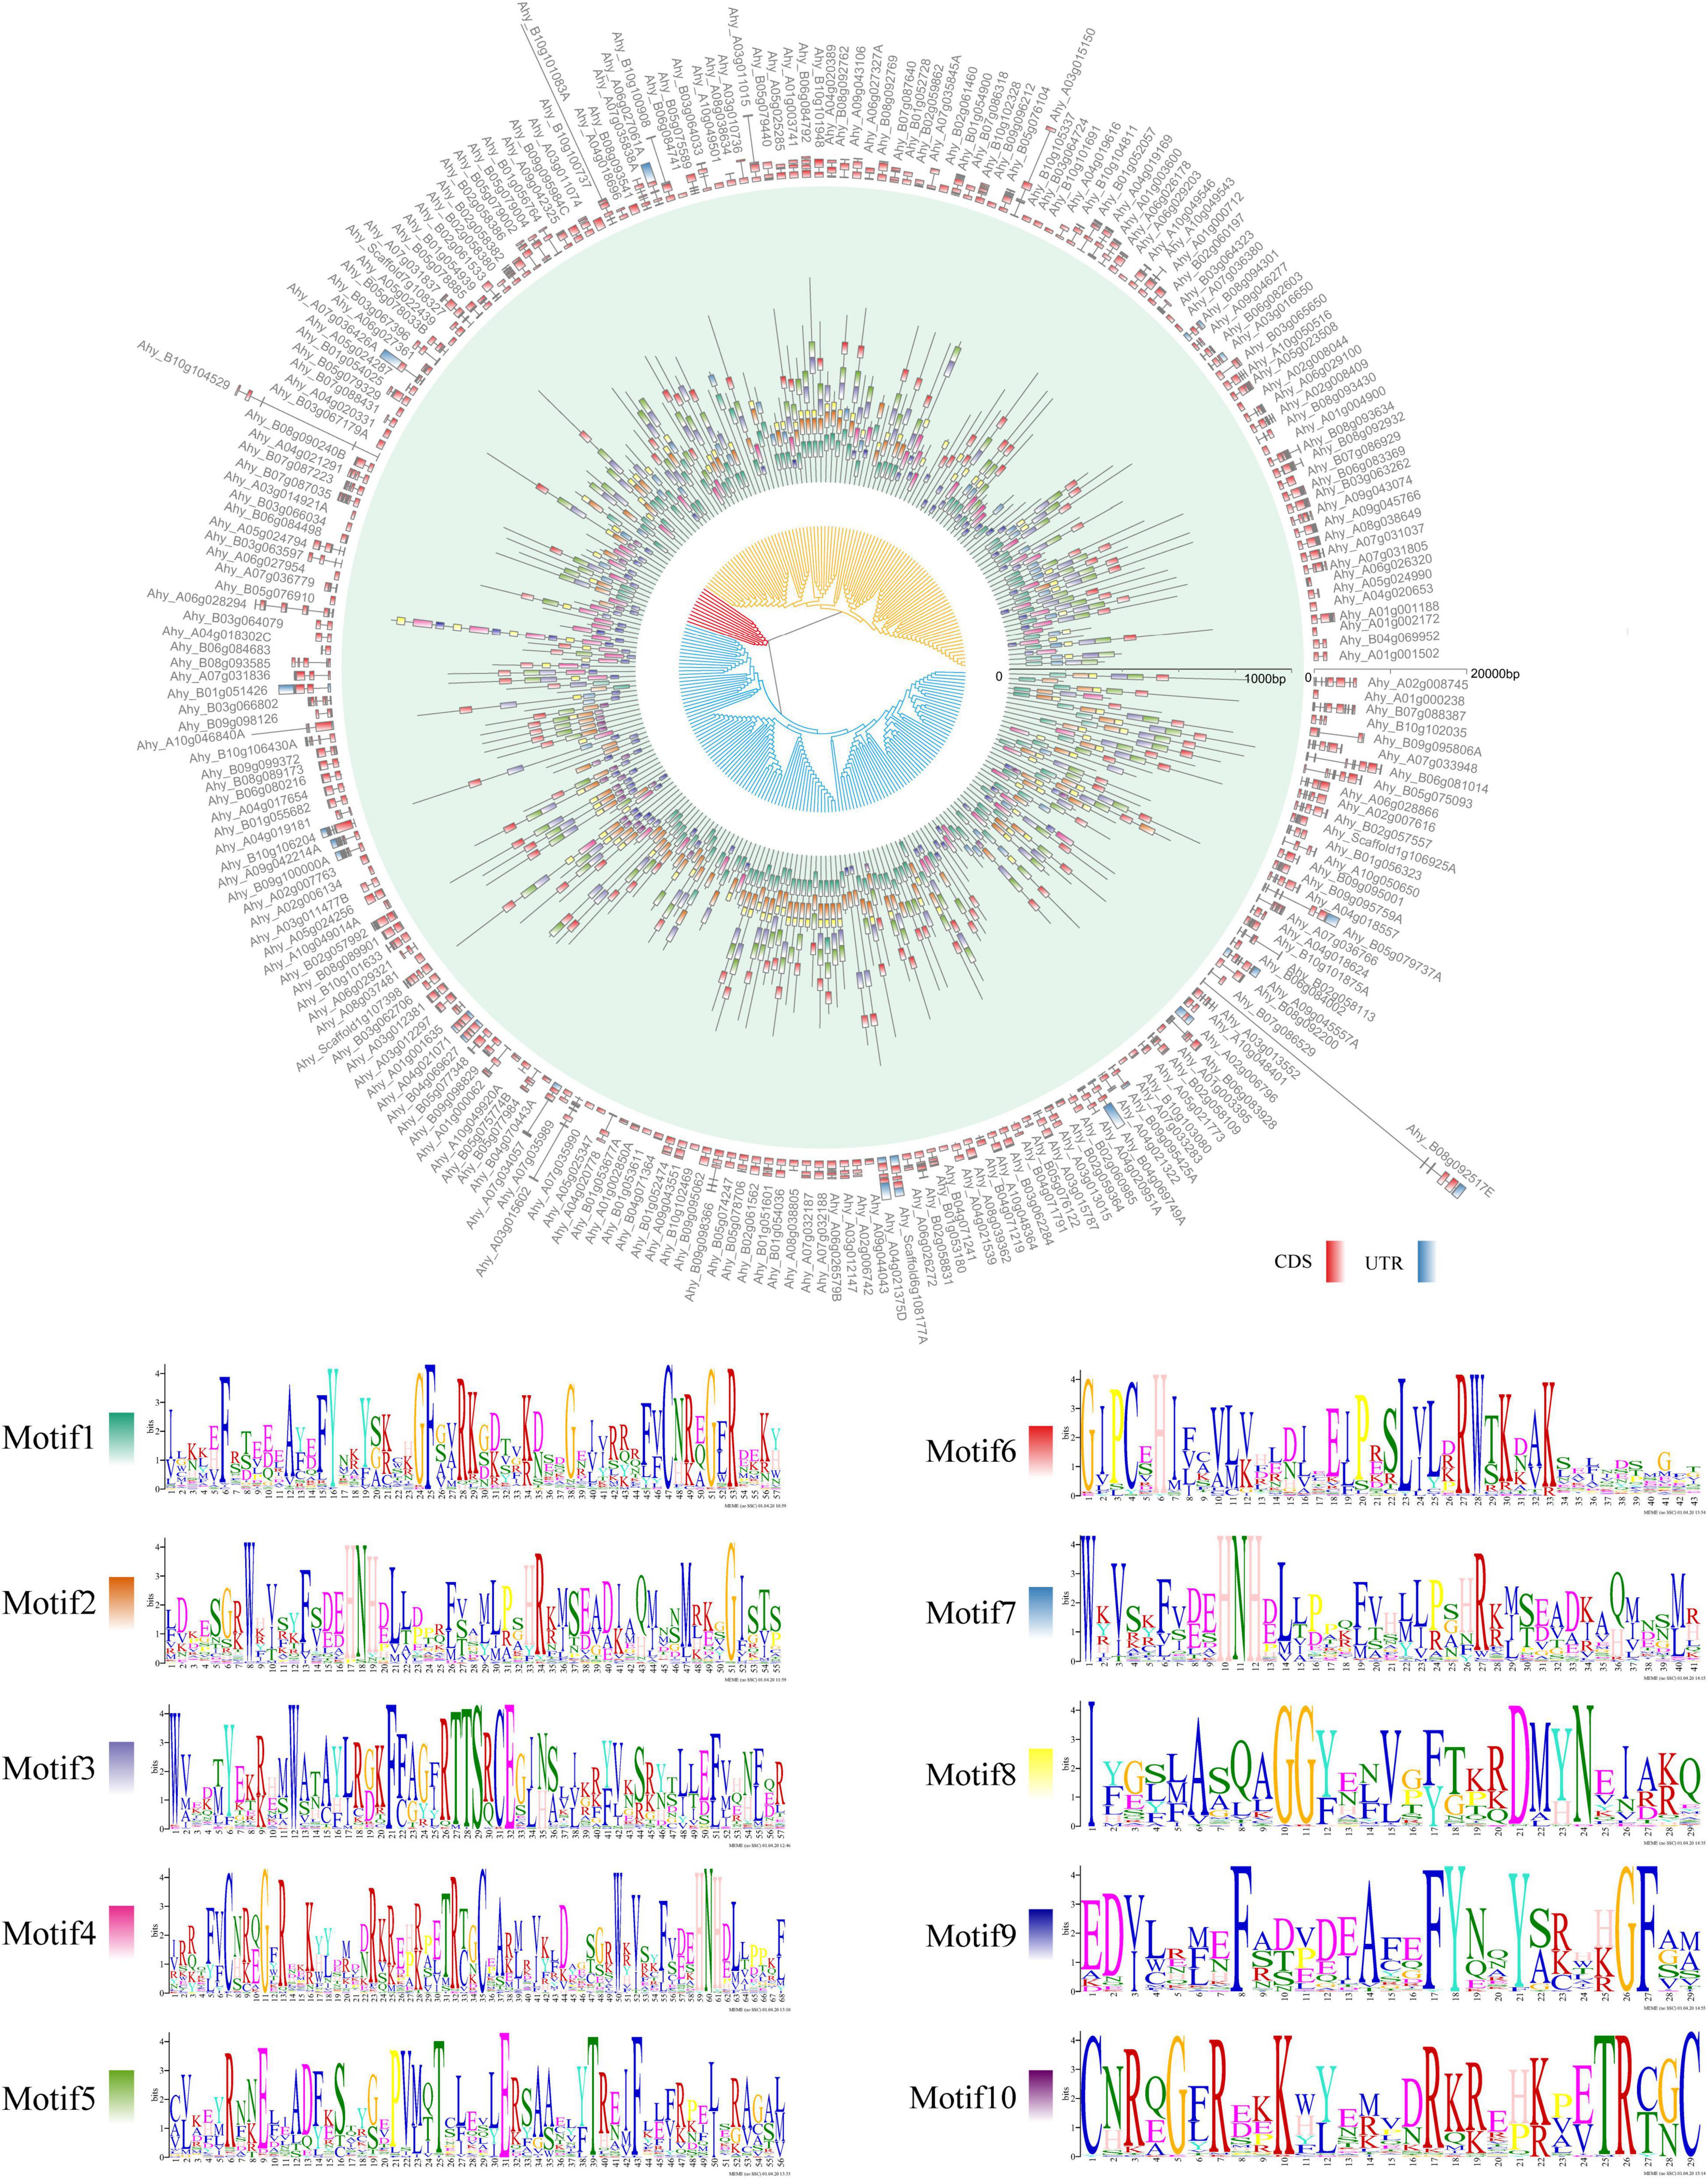
Figure 2. Comparative gene structure, phylogenetic tree, and motif analysis of AhFAR1 genes. Inner, middle, and outer circle represent phylogenetic tree, motif, and gene structure, respectively.
In plants, cis-acting elements of promoter regions often affect the biological functions of genes. Here, in order to identify the cis-acting elements of the 246 AhFAR1 genes obtained from A. hypogaea genome, a 1.5 Kb upstream genomic region of each gene was explored in the PlantCARE database (Lescot et al., 2002). A total of 2,147 cis-acting elements related to “light responsiveness” were identified (Supplementary Table 2 and Supplementary Figure 5). The average number of cis-acting elements identified by each gene was 8.7 (from 2 to 18). In Ahy_A03g015787 and Ahy_B02g058113, 18 cis-acting elements were identified (Supplementary Table 3). Moreover, a total of 31 types of cis-acting elements were obtained. Among them, the Box-4 element was the most widely distributed (601), and the ACA-motif, Pc-CMA2a, CAG-motif and P-box were each only identified once (Supplementary Table 4). Functional annotation indicated that all of the obtained cis-acting elements, such as Box-4, G-box and GT1-motif, were identified to be involved in the photopic response system (Supplementary Table 2). All of these cis-acting elements were functional annotated as light responsiveness through different regulation patterns, such as conserved DNA module, MYB binding site, gapA-CMA1, and gibberellin pathway (Supplementary Table 2). The results regarding of the cis-acting elements suggested that the AhFAR1 gene family could play critical roles in peanut growth and development.
The synonymous (Ks) and non-synonymous (Ka) substitution rates of paralogous and orthologous gene pairs were calculated to study selection pressures of FAR1 genes in Aarchis and its related species G. max in the process of biological evolution. Each of the 13 paralogous gene pairs were identified in subgenome A (At) and subgenome B (Bt), respectively. Moreover, a total of 33 paralogous gene pairs were observed between At and Bt (Supplementary Table 5). There was no significant difference in Ka/Ks value either within or between the two subgenomes (Figure 3A), suggesting that the paralogous AhFAR1 genes had undergone a relaxed selection pressure. Furthermore, a total of 11, 6, 21, 40, and 62 FAR1 paralogous gene pairs were identified in G. max, A. ipaensi, A. duranensiss, A. monticola, and A. hypogaea, respectively (Supplementary Table 6). A large number of paralogous gene pairs were identified in the allotetraploid A. hypogaea, which might be caused by polyploidization or whole genome duplication events during evolution. The average Ka/Ks of paralogous FAR1 in G. max (0.30) was significantly smaller than that calculated for A. duranensiss (0.51), A. monticola (0.42), and A. hypogaea (0.49). However, there was no significant difference in the average Ka/Ks value among the four Aarchis species (Figure 3B). These results indicated that the FAR1 gene family experienced strong evolutionary selection pressure when evolution occurred from Leguminosae, while these genes were under relaxed selection in the subsequent evolution of Arachis species. The average Ka/Ks of orthologs in both G. max vs. A. hypogaea and G. max vs. A. monticola were all smaller than that of the Arachis combination gene pairs, suggesting that the biological functions of the FAR1 gene family underwent a relaxed diversification after the divergence in Arachis species (Figure 3C and Supplementary Table 7).
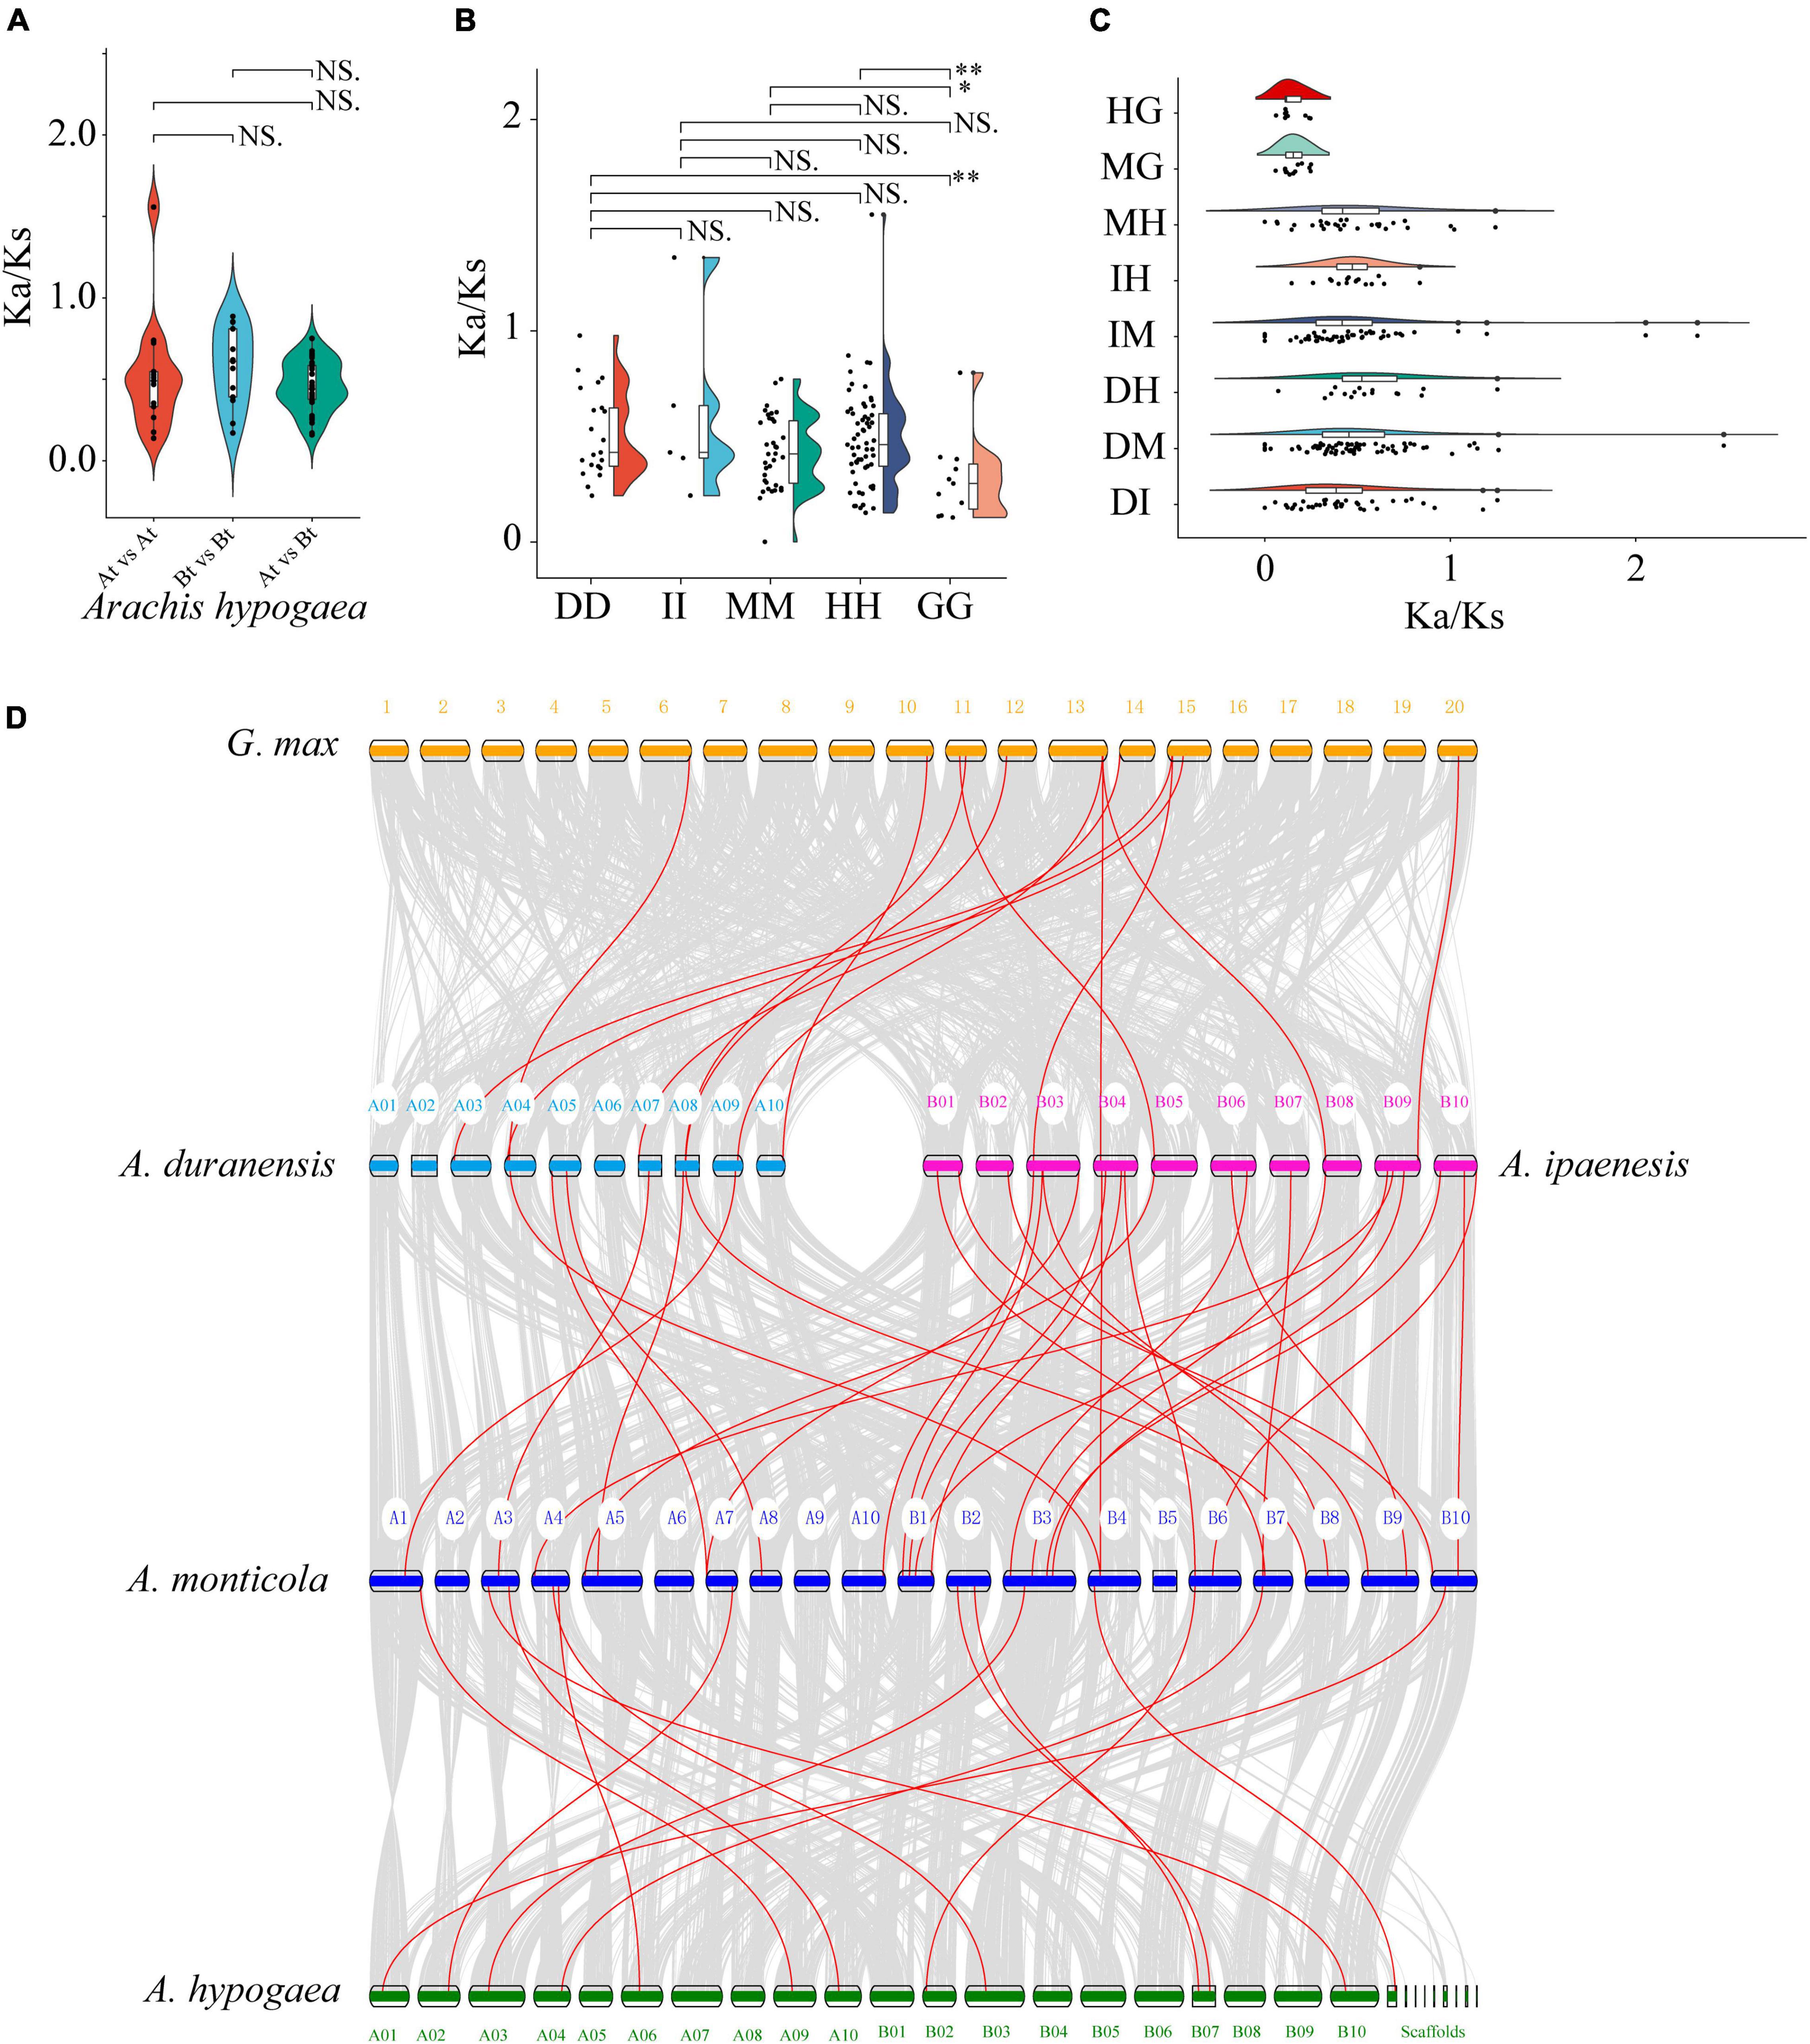
Figure 3. The Ka/Ks and synteny analyzes of AhFAR1 genes among different plant species. (A) The comparison of Ka/Ks paralogous gene pairs within and between At and Bt. (B) The comparison of Ka/Ks paralogous gene pairs among Arachis and G. max. DD, A. duranensis; II, A. ipaensis; MM, A. monticola; HH, A. hypogaea; GG, G. max. (C) The comparison of Ka/Ks orthologous gene pairs among Arachis and G. max. HG, A. hypogaea vs. G. max; MG, A. monticola vs. G. max; MH, A. monticola vs. A. hypogaea; IH, A. ipaensis vs. A. hypogaea; IM, A. ipaensis vs. A. monticola; DH, A. duranensis vs. A. hypogaea; DM, A. duranensis vs. A. monticola; DI, A. duranensis vs. A. ipaensis. (D) Synteny plot of AhFAR1 genes. Gray lines represent the collinear blocks between two plants, and red lines represent the syntenic AhFAR1 gene pairs. NS. represents no significant at 0.05 significance level. * and ** indicate 0.05 and 0.01 significance level, respectively.
According to the collinearity analyzes among G. max and Arachis species, only 13 FAR1 gene pairs showed a syntenic relationship in both G. max vs. A. duranensis (8) and vs. A. ipaenesis (5), which was significantly less than that identified among Arachis plants (50) (Figure 3D and Supplementary Table 8). This result suggested that the FAR1 gene family was substantially expanded during polyloidization, evolution, and domestication. In addition, many more FAR1 homologous gene pairs were identified among A. monticola vs. A. duranensis (8) and vs. A. ipaenesis (25) than that of among A. hypogaea vs. A. duranensis (2) and vs. A. ipaenesis (8) (Supplementary Table 8 and Supplementary Figure 6). This finding might support the conclusion that A. hypogaea was domesticated from an intermediate species, the wild tetraploid A. monticola, which was formed from its two diploid progenitors, A. duranensis and A. ipaenesis (Yin et al., 2019). Interestingly, some FAR1 genes were associated with at least three or more syntenic gene pairs, such as Araip.M4D5S displaying collinearity with GLYMA_13G341600, EVM0033853, and Aradu.8P3KF in different plants (Figure 3D and Supplementary Table 8), indicating that these genes play key roles in the FAR1 gene family and were highly conserved during evolution.
In order to investigate the expression patterns of AhFAR1 in different tissues (flower, peg, leaf, root, and stem) and in the different development stages of the pod (11 stages of shell and seed), the transcriptome data obtained from our previous study (Chen et al., 2016b,2019) was re-interrogated. The results revealed that a total of 157 AhFAR1 genes were not expressed in any detected tissue, which was speculated to be because these genes had other special expression patterns and could not be detected in our previous study (Supplementary Table 9). However, as showed in Figure 4A, a total of 89 AhFAR1 genes showed tissue-specific expression in peanut. For example, 12 genes in flower, 18 genes in pod, 15 genes in leaf, 31 genes in leaf and root, and 13 genes in stem showed the highest expression levels of the different tissues. In depth analysis of the expression patterns of the 246 AhFAR1 genes in 11 developmental stages of shell and seed showed that 84 of them were expressed in at least one development stage (Supplementary Table 10), and some of the 84 genes exhibited stage-specific expression in shell or seed (Figure 4B). Moreover, a lot of genes were highly expressed in whole-seed developmental stages but expressed at low levels in the shell (Figure 4B). These findings indicated that the AhFAR1 genes might be involved in shell or seed development in peanut. Unequal expression of the AhFAR1 genes between the two subgenomes (At > Bt) was observed (Figure 4C) indicating a divergence of gene biological function compared to in other polyploid plants (Wu et al., 2018). GO term enrichment analysis revealed that the AhFAR1 genes are mainly involved ion, nucleic acid, and compound binding (Figure 4D).
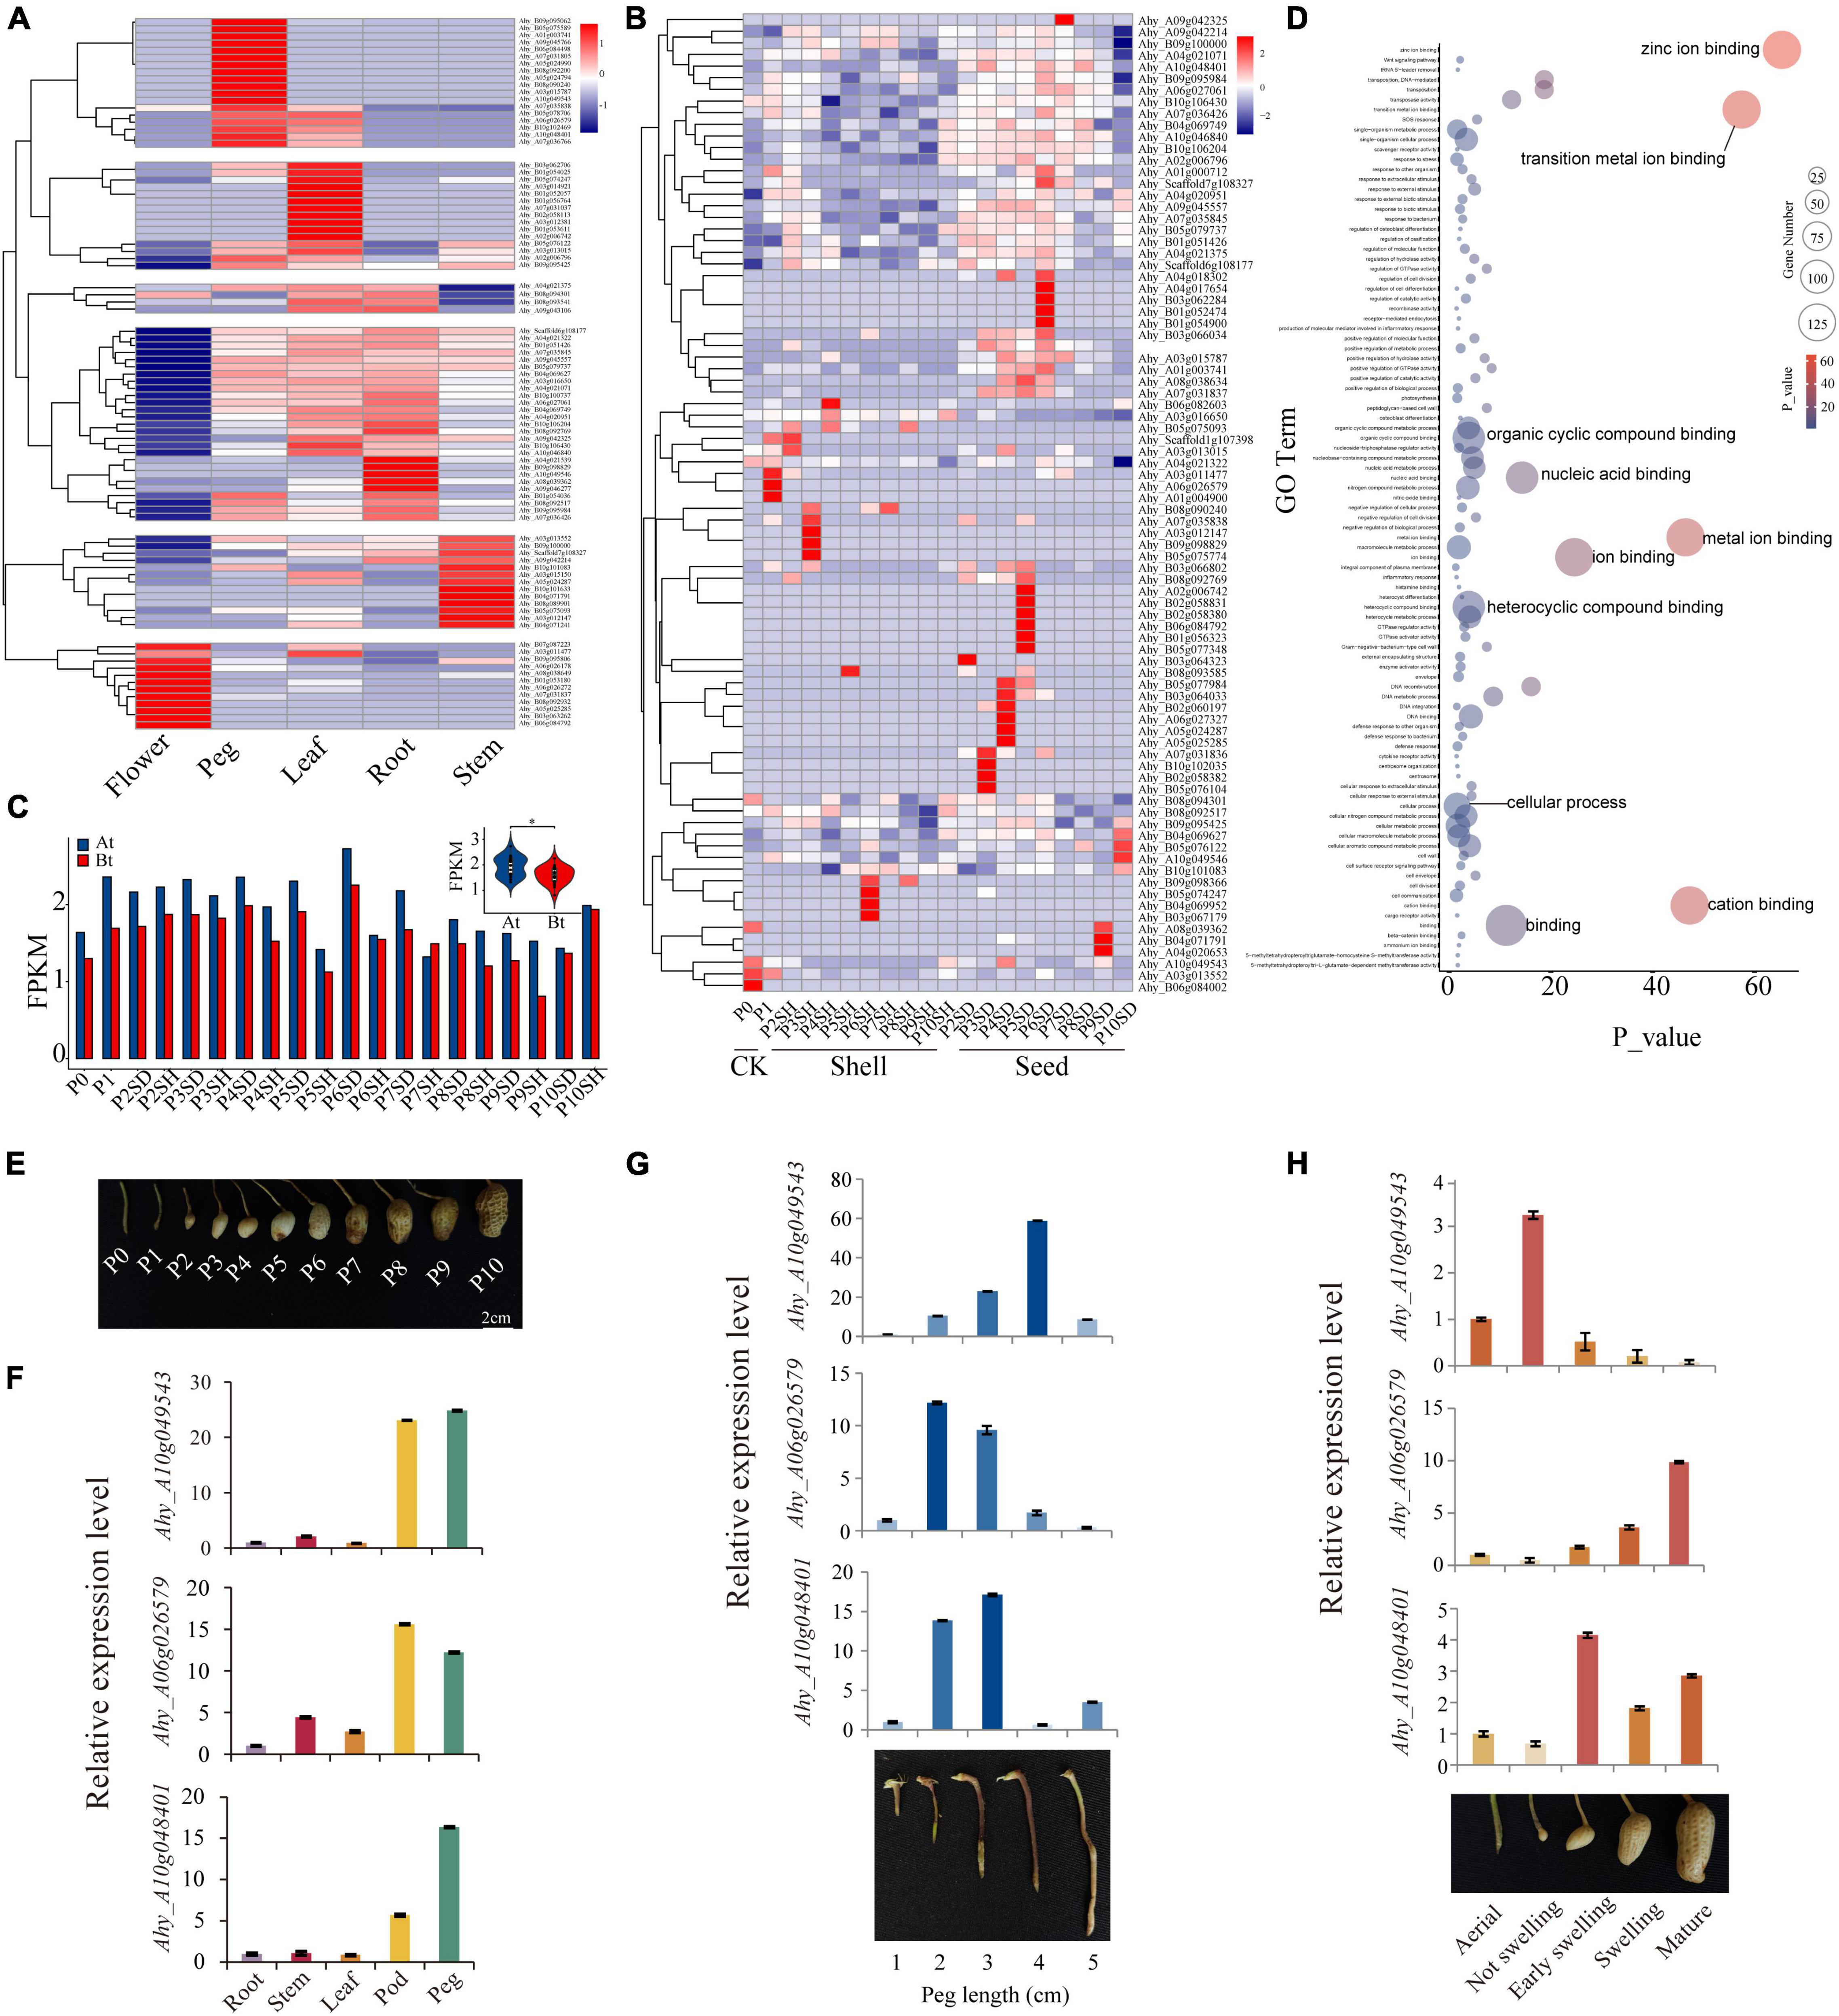
Figure 4. Expression patterns of the peanut AhFAR1 gene family. (A) Clustering of expression profiles of AhFAR1 genes in different tissues, such as flower, peg, leaf, root, and stem. (B) Clustering of expression profiles of AhFAR1 genes in shell and seed at 11 development stages. (C) Comparison of the AhFAR1 expression levels between At and Bt. (D) GO term enrichment analysis of the AhFAR1 genes. (E) Eleven different developmental stages of peanut pods. (F–H) Relative expression level analyses of three candidate AhFAR1 genes in representative tissues, different length of pegs, and development stages of pod. *represents t-test of P < 0.05.
Previous reports indicated that the FAR1 gene family is involved in the light response in plants (Casal, 2000; Wang and Deng, 2003; Huang et al., 2012), and expanded in A. hypogaea, A. duranensis, and A. ipaensis (Chen et al., 2016a; Lu et al., 2018; Yan et al., 2020). From these findings, we hypothesized that the FAR1 genes might be related to the peanut’s unique pod development pattern, such as its aerial flower and subterranean fruit. After pollination, the ovule-carrying peg (P0 stage) forms and elongates with peg-bending growth to bury the fertilized ovule into the soil (P1 stage), and then the pod develops continuously until maturation (P2–P10 stages) (Figure 4E). In this study, seven AhFAR1 members were specifically expressed in peg and pod (shell or seed) as identified through the transcriptome analyses (Supplementary Figure 7 and Figures 4A,B). The quantitative real-time PCR (qRT-PCR) in A. hypogaea cv. Fuhuasheng confirmed that three of the seven AhFAR1 genes, including Ahy_A10g049543, Ahy_A06g026579, and Ahy_A10g048401, had tissue-specific expression, especially in the pod and peg (Figure 4F). Moreover, examination of the five different development stages of ovule-carrying peg revealed that Ahy_A10g049543 was highly expressed in middle and later stages but the other two genes possessed the opposite pattern (Figure 4G). In addition, the relative expression in the different development stages of the pod indicated that Ahy_A10g049543 was highly expressed in the early stage of the pod, Ahy_A06g026579 was mainly expressed in mature stage of the pod and Ahy_A10g048401 was expressed in middle and late stages of the pod, such as early swelling, swelling, and mature stages (Figure 4H). The above results suggested that the AhFAR1 genes showed specific expression responses in different tissues or development stages and might play an important role in regulating pod development in peanut. The biological function verification of the three candidate AhFAR1 genes should not be ignored in future.
Higher plants regulate their growth and development through response to light changes by a system of photoreceptors. Red and far-red light are two key environmental factors influencing plant growth and development through a series of light signal transduction (Huang et al., 2012). The FAR1 gene was identified as an important component of phyA-mediated far-red light signal pathway and was initially identified in Arabidopsis. As a crucial positive regulator in the phyA pathway, FAR1 can directly interact with the promoters of FHY1 and FHL. In Arabidopsis, a total of 14 FHY/FAR1 or FRS with high homology of gene structure, molecular morphology, and biological functions have been identified (Lin and Wang, 2004). Moreover, in tea plant (Camellia sinensis), cotton (Gossypium hirsutum) and pepper (Capsicum annuum) 25, 88, and 20 FAR1 family members were identified, respectively (Yuan et al., 2018; Xia and Fang, 2020; Liu et al., 2021). In A. hypogaea, a FAR1 gene, AhJ11-FAR1-5, which can enhance tolerance to drought stress, was isolated and cloned using a rapid-amplification of cDNA ends method (Yan et al., 2020). In this study, a total of 246 FAR1 family members were identified in A. hypogaea, which is substantially more than those identified in the plants listed above. In addition, in two wild diploids progenitors, A. duranensis and A. ipaensis, and one wild allotetraploid species A. monticola, 94, 111, and 163 FAR1 genes were identified, respectively (Supplementary Table 1). This may be due to the polyploidization events of A. hypogaea genome in plant evolution, which was confirmed by the subsequent FAR1 gene family collinearity analyzes (Figure 3D).
According to phylogenetic analysis, the FAR1 genes were divided into Arachis and G. max groups but this did not correspond to species composition and attributes among Arachis species (Figure 1B). This suggested that the FAR1 genes have a greater differentiation between Arachis and G. max than among Arachis species. The differences between average Ka/Ks values of paralogous FAR1 in Arachis and G. max also support the above statement (Figure 3B). The three classifications of 246 AhFAR1 genes contained the same conserved motifs, suggesting that the FAR1 genes have experienced a conservative evolutionary process and undergone relaxed diversification in peanut. The conserved protein motifs and gene structures are the most important molecular basis of gene biological function. In the present study, each group of FAR1 family members had similar protein motifs and gene structure features (Figure 2 and Supplementary Figure 4). This finding is consistent with previous reports in Arabidopsis and tea plant (Lin and Wang, 2004; Liu et al., 2021). The prediction of the number of cis-acting elements indicated that the AhFAR1 gene family contained rich regulatory elements, such as Box-4, G-box, GT1-motif, and TCT-motif (Supplementary Table 4), suggesting a wide range of biological functions of the FAR1 family members in peanut.
Previous reports indicated that the FAR1 genes exhibit different tissue-specific expression patterns in different plants. For example, in Arabidopsis, the AtFAR1 genes were expressed in leaves, stems, and flowers (Lin and Wang, 2004). In cotton, most genes were highly expressed in leaves but not stems and torus (Yuan et al., 2018). In this study, about 36.2% of AhFAR1 genes revealed tissue-specific expression patterns in flower, peg, leaf, root, and stem (Figure 4A), and 34.1% of genes exhibited development-stage-specific patterns in shell and seed (Figure 4B). The tissue- and stage-specific expression patterns revealed that the AhFAR1 genes might play different biological functions in different tissues or developmental stages in peanut. The expression levels of the AhFAR1 genes identified in At were higher than in Bt (Figure 4C), indicating that the AhFAR1 genes in At might play a more important role in regulating plant growth and development in peanut. Previous findings revealed that FAR1 acted positively in axillary bud outgrowth and could be involved in regulating branching and plant architecture by participating in strigolactones and cytokinins synthesis (Stirnberg et al., 2012). In addition, other reports indicated that the FAR1 gene family was mainly involved in biotic and abiotic stresses, such as high or low temperature, drought, and salt exposure (Yuan et al., 2018; Liu et al., 2021). In our study, three candidate AhFAR1 genes were specifically expressed in peg, flower, and during early pod development stages. The subsequent qRT-PCR results further confirmed the tissue-specific expression patterns (Figure 4F). Moreover, three selected AhFAR1 genes were specifically expressed in different development stages of peg and pod (Figures 4G,H). These new findings indicate that the AhFAR1 gene family might participate in pod development in peanut although gene biological function verification is essential future work.
In summary, comprehensive and systematic analysis of the FAR1 gene family in Arachis, including A. duranensis, A. ipaensis, A. monticola, and A. hypogaea, and G. max was performed in this study. Phylogenetic relationship and gene structure analyses suggest the conservation of FAR1 gene family in different plant species. Phylogenetic comparison, Ka/Ks values and synteny analysis was carried out to uncover duplication, evolution, and domestication of the FAR1 gene family. Most of AhFAR1 genes were revealed to likely play multiple key roles in peanut growth and development, especially in pod development, by their differential expression patterns in distinct tissues and pod developmental stages. Overall, these analyses will promote the biological functional research of AhFAR1 genes in pod development and shed light on the current understanding of the mechanisms of the gene family in peanut.
The original contributions presented in the study are included in the article/Supplementary Material, further inquiries can be directed to the corresponding author.
XC, XL, YH, and QL designed the study. QL, HaoL, HaiyL, SL, and HaifL performed the experiments. QL, RW, and QD analyzed the data. QL wrote the manuscript. HJ, RV, and MP improved the manuscript. All authors have read and approved the final manuscript.
This work was supported by Guangdong Provincial Key Research and Development Program-Modern Seed Industry (2020B020219003), China Agriculture Research System of MOF and MARA (CARS-13), The National Natural Science Foundation of China (32001442 and 32172051), Guangdong Basic and Applied Basic Research Foundation (2020A1515010021 and 2021A1515010811), Agricultural Competitive Industry Discipline Team Building Project of Guangdong Academy of Agricultural Sciences (202104TD), Special Fund for Scientific Innovation Strategy-Construction of High Level Academy of Agriculture Science (R2020PY-JX004 and R2020PY-JG005), President Fund of Guangdong Academy of Agriculture Sciences (202042), Open Fund of Guangdong Provincial Key Laboratory of Crop Genetic Improvement (202201).
The authors declare that the research was conducted in the absence of any commercial or financial relationships that could be construed as a potential conflict of interest.
All claims expressed in this article are solely those of the authors and do not necessarily represent those of their affiliated organizations, or those of the publisher, the editors and the reviewers. Any product that may be evaluated in this article, or claim that may be made by its manufacturer, is not guaranteed or endorsed by the publisher.
We thank to lab members for assistance.
The Supplementary Material for this article can be found online at: https://www.frontiersin.org/articles/10.3389/fpls.2022.893278/full#supplementary-material
FAR1, far-red-impaired response 1; FHY1, far-red elongated hypocotyls 1; FHY3, far-red elongated hypocotyl 3; FRS, FAR1-related sequences; HMM, Hidden Markov model; CCD, conserved domain database; NJ, neighbor-joining; Ks, the synonymous substitution rate; Ka, the non-synonymous substitution rate; qRT-PCR, quantitative real-time PCR.
Bailey, T. L., Boden, M., Buske, F. A., Frith, M., Grant, C. E., Clementi, L., et al. (2009). MEME SUITE: tools for motif discovery and searching. Nucleic Acids Res. 37, W202–W208. doi: 10.1093/nar/gkp335
Bailey, T. L., Johnson, J., Grant, C. E., and Noble, W. S. (2015). The MEME Suite. Nucleic Acids Res. 43, W39–W49.
Bertioli, D. J., Cannon, S. B., Froenicke, L., Huang, G., Farmer, A. D., Cannon, E. K., et al. (2016). The genome sequences of arachis duranensis and arachis ipaensis, the diploid ancestors of cultivated peanut. Nat. Genet. 48, 438–446. doi: 10.1038/ng.3517
Briggs, W. R., and Olney, M. A. (2001). Photoreceptors in plant photomorphogenesis to date. Five phytochromes, two cryptochromes, one phototropin, and one superchrome. Plant Physiol. 125, 85–88. doi: 10.1104/pp.125.1.85
Casal, J. J. (2000). Phytochromes, cryptochromes, phototropin: photoreceptor interactions in plants. Photochem. Photobiol. 71, 1–11. doi: 10.1562/0031-8655(2000)071<0001:pcppii>2.0.co;2
Chen, C., Chen, H., Zhang, Y., Thomas, H. R., Frank, M. H., He, Y., et al. (2020). TBtools: an integrative toolkit developed for interactive analyses of big biological data. Mol. Plant 13, 1194–1202. doi: 10.1016/j.molp.2020.06.009
Chen, X., Li, H., Pandey, M. K., Yang, Q., Wang, X., Garg, V., et al. (2016a). Draft genome of the peanut A-genome progenitor (Arachis duranensis) provides insights into geocarpy, oil biosynthesis, and allergens. Proc. Natl. Acad. Sci. U.S.A. 113, 6785–6790. doi: 10.1073/pnas.1600899113
Chen, X., Lu, Q., Liu, H., Zhang, J., Hong, Y., Lan, H., et al. (2019). Sequencing of cultivated peanut, Arachis hypogaea, yields insights into genome evolution and oil improvement. Mol. Plant 12, 920–934. doi: 10.1016/j.molp.2019.03.005
Chen, X., Yang, Q., Li, H., Li, H., Hong, Y., Pan, L., et al. (2016b). Transcriptome-wide sequencing provides insights into geocarpy in peanut (Arachis hypogaea L.). Plant Biotechnol. J. 14, 1215–1224. doi: 10.1111/pbi.12487
Du, J., Zhang, L., Ge, X., Xiang, X., Cao, D., Yang, H., et al. (2021). Genome-wide identification and characterization of the FAR1/FHY3 family in Populus trichocarpa Torr. & Gray and expression analysis in light response. Forest 12:1385. doi: 10.3390/f12101385
FAOSTAT. (2020). Food and Agriculture Organization ofthe United Nations (FAO). FAOSTATDatabase. Rome: Food and Agriculture Organization.
Finn, R. D., Bateman, A., Clements, J., Coggill, P., Eberhardt, R. Y., Eddy, S. R., et al. (2014). PFAM: the protein families database. Nucleic Acids Res. 42, D222–D230.
Hu, B., Jin, J., Guo, A., Zhang, H., Luo, J., and Gao, G. (2015). GSDS 2.0: an upgraded gene feature visualization server. Bioinformatics 31, 1296–1297. doi: 10.1093/bioinformatics/btu817
Huai, J., Zhang, X., Li, J., Ma, T., Zha, P., Jing, Y., et al. (2020). SEUSS and PIF4 coordinately regulate light and temperature signaling pathways to control plant growth. Mol. Plant 13:1825. doi: 10.1016/j.molp.2020.11.014
Huang, X., Ouyang, X., Yang, P., Lau, O. S., Li, G., Li, J., et al. (2012). Arabidopsis FHY3 and HY5 positively mediate induction of COP1 transcription in response to photomorphogenic UV-B light. Plant Cell 24, 4590–4606. doi: 10.1105/tpc.112.103994
Krzeszowiec, W., Novokreshchenova, M., and Gabryś, H. (2020). Chloroplasts in C3 grasses move in response to blue-light. Plant Cell Rep. 39, 1331–1343. doi: 10.1007/s00299-020-02567-3
Kumar, S., Stecher, G., and Tamura, K. (2016). MEGA7: molecular evolutionary genetics analysis version 7.0 for bigger datasets. Mol. Biol. Evol. 33, 1870–1874. doi: 10.1093/molbev/msw054
Lescot, M., Déhais, P., Thijs, G., Marchal, K., Moreau, Y., Van de Peer, Y., et al. (2002). PlantCARE, a database of plant cis-acting regulatory elements and a portal to tools for in silico analysis of promoter sequences. Nucleic Acids Res. 30, 325–327. doi: 10.1093/nar/30.1.325
Lin, R., Ding, L., Casola, C., Ripoll, D. R., Feschotte, C., and Wang, H. (2007). Transposase-derived transcription factors regulate light signaling in Arabidopsis. Science 318, 1302–1305. doi: 10.1126/science.1146281
Lin, R., and Wang, H. (2004). Arabidopsis FHY3/FAR1 gene family and distinct roles of its members in light control of arabidopsis development. Plant Physiol. 136, 4010–4022. doi: 10.1104/pp.104.052191
Liu, Y., Wei, H., Ma, M., Li, Q., Kong, D., Sun, J., et al. (2019b). Arabidopsis FHY3 and FAR1 regulate the balance between growth and defense responses under shade conditions. Plant Cell 31, 2089–2106. doi: 10.1105/tpc.18.00991
Liu, H., Gu, J., Lu, Q., Li, H., Hong, Y., Chen, X., et al. (2019a). Transcriptomic analysis reveals the high-oleic acid feedback regulating the homologous gene expression of stearoyl-ACP desaturase 2 (SAD2) in peanuts. Int. J. Mol. Sci. 20:3091. doi: 10.3390/ijms20123091
Liu, Z., An, C., Zhao, Y., Xiao, Y., Bao, L., Gong, C., et al. (2021). Genome-wide identification and characterization of the CsFHY3/FAR1 gene family and expression analysis under biotic and abiotic stresses in tea plants (Camellia sinensis). Plants 10, 570. doi: 10.3390/plants10030570
Lu, Q., Li, H., Hong, Y., Zhang, G., Wen, S., Li, X., et al. (2018). Genome sequencing and analysis of the peanut B-genome progenitor (Arachis ipaensis). Front. Plant Sci. 9:604. doi: 10.3389/fpls.2018.00604
Ma, L., and Li, G. (2018). FAR1-RELATED SEQUENCE (FRS) and FRS-RELATED FACTOR (FRF) family proteins in Arabidopsis growth and development. Front. Plant Sci. 9:692. doi: 10.3389/fpls.2018.00692
Mistry, J., Finn, R. D., Eddy, S. R., Bateman, A., and Punta, M. (2013). Challenges in homology search: HMMER3 and convergent evolution of coiled-coil regions. Nucleic Acids Res. 41:e121. doi: 10.1093/nar/gkt263
Ouyang, X., Li, J., Li, G., Li, B., Chen, B., Shen, H., et al. (2011). Genome-wide binding site analysis of FAR-RED elongated hypocotyl3 reveals its novel function in Arabidopsis development. Plant Cell 23, 2514–2535. doi: 10.1105/tpc.111.085126
Quail, P. H. (2002). Phytochrome photosensory signalling networks. Nat. Rev. Mol. Cell Biol. 3, 85–93. doi: 10.1038/nrm728
Robledo, G., Lavia, G. I., and Seijo, G. (2009). Species relations among wild Arachis species with the A genome as revealed by FISH mapping of rDNA loci and heterochromatin detection. Theor. Appl. Genet. 118, 1295–1307. doi: 10.1007/s00122-009-0981-x
Seijo, G., Lavia, G. I., Fernández, A., Krapovickas, A., Ducasse, D. A., Bertioli, D. J., et al. (2007). Genomic relationships between the cultivated peanut (Arachis hypogaea, Leguminosae) and its close relatives revealed by double GISH. Am. J. Bot. 94, 1963–1971. doi: 10.3732/ajb.94.12.1963
Stirnberg, P., Zhao, S., Williamson, L., Ward, S., and Leyser, O. (2012). FHY3 promotes shoot branching and stress tolerance in Arabidopsis in an AXR1-dependent manner. Plant J. 71, 907–920. doi: 10.1111/j.1365-313X.2012.05038.x
Takano, M., Kanegae, H., Shinomura, T., Miyao, A., Hirochika, H., and Furuya, M. (2001). Isolation and characterization of rice phytochrome a mutants. Plant Cell 13, 521–534. doi: 10.1105/tpc.13.3.521
Wang, D., Zhang, Y., Zhang, Z., Zhu, J., and Yu, J. (2010). KaKs_Calculator 2.0: a toolkit incorporating gamma-series methods and sliding window strategies. Genom. Proteom. Bioinf. 8, 77–80. doi: 10.1016/S1672-0229(10)60008-3
Wang, H., and Deng, X. W. (2002). Arabidopsis FHY3 defines a key phytochrome a signaling component directly interacting with its homologous partner FAR1. EMBO J. 21, 1339–1349. doi: 10.1093/emboj/21.6.1339
Wang, H., and Deng, X. W. (2003). Dissecting the phytochrome a-dependent signaling network in higher plants. Trends Plant Sci. 8, 172–178. doi: 10.1016/S1360-1385(03)00049-9
Wang, H., and Wang, H. Y. (2015). Multifaceted roles of FHY3 and FAR1 in light signaling and beyond. Trends Plant Sci. 20, 453–461. doi: 10.1016/j.tplants.2015.04.003
Wang, W., Tang, W., Ma, T., Niu, D., Jin, J. B., Wang, H., et al. (2016). A pair of light signaling factors FHY3 and FAR1 regulates plant immunity by modulating chlorophyll biosynthesis. J. Integr. Plant Biol. 58, 91–103. doi: 10.1111/jipb.12369
Wang, Y., Tang, H., Debarry, J. D., Tan, X., Li, J., Wang, X., et al. (2012). MCScanX: a toolkit for detection and evolutionary analysis of gene synteny and collinearity. Nucleic Acids Res. 40:e49. doi: 10.1093/nar/gkr1293
Whitelam, G. C., Johnson, E., Peng, J., Carol, P., Anderson, M. L., Cowl, J. S., et al. (1993). Phytochrome A null mutants of Arabidopsis display a wild-type phenotype in white light. Plant Cell 5, 757–768. doi: 10.1105/tpc.5.7.757
Wu, J., Lin, L., Xu, M., Chen, P., Liu, D., Sun, Q., et al. (2018). Homoeolog expression bias and expression level dominance in resynthesized allopolyploid Brassica napus. BMC Genomics 19:586. doi: 10.1186/s12864-018-4966-5
Xia, C., and Fang, D. (2020). Analysis of FAR1 gene family from whole genome of pepper. J. Anhui Agric. Sci 48, 97–102.
Xie, Y., Zhou, Q., Zhao, Y., Li, Q., Liu, Y., Ma, M., et al. (2020). FHY3 and FAR1 integrate light signals with the miR156-SPL module-mediated aging pathway to regulate Arabidopsis flowering. Mol. Plant 13, 483–498. doi: 10.1016/j.molp.2020.01.013
Yan, C., Li, C., Sun, Q., Zhang, H., Wang, J., Yuan, C., et al. (2020). Cloning and function analysis of FAR1-5 transcription factor in peanut. J. Peanut Sci. 49, 16–20.
Yin, D., Ji, C., Ma, X., Li, H., Zhang, W., Li, S., et al. (2018). Genome of an allotetraploid wild peanut Arachis monticola: a de novo assembly. GigaScience 7:giy066. doi: 10.1093/gigascience/giy066
Yin, D., Ji, C., Song, Q., Zhang, W., Zhang, X., Zhao, K., et al. (2019). Comparison of Arachis monticola with diploid and cultivated tetraploid genomes reveals asymmetric subgenome evolution and improvement of peanut. Adv. Sci. 7:1901672. doi: 10.1002/advs.201901672
Keywords: peanut (Arachis hypogaea), genome-wide, far-red-impaired response 1 (FAR1), pod development, expression pattern
Citation: Lu Q, Liu H, Hong Y, Liang X, Li S, Liu H, Li H, Wang R, Deng Q, Jiang H, Varshney RK, Pandey MK and Chen X (2022) Genome-Wide Identification and Expression of FAR1 Gene Family Provide Insight Into Pod Development in Peanut (Arachis hypogaea). Front. Plant Sci. 13:893278. doi: 10.3389/fpls.2022.893278
Received: 10 March 2022; Accepted: 14 April 2022;
Published: 03 May 2022.
Edited by:
Dev Mani Pandey, Birla Institute of Technology, Mesra, IndiaReviewed by:
Humira Sonah, Laval University, CanadaCopyright © 2022 Lu, Liu, Hong, Liang, Li, Liu, Li, Wang, Deng, Jiang, Varshney, Pandey and Chen. This is an open-access article distributed under the terms of the Creative Commons Attribution License (CC BY). The use, distribution or reproduction in other forums is permitted, provided the original author(s) and the copyright owner(s) are credited and that the original publication in this journal is cited, in accordance with accepted academic practice. No use, distribution or reproduction is permitted which does not comply with these terms.
*Correspondence: Xiaoping Chen, chenxiaoping@gdaas.cn
Disclaimer: All claims expressed in this article are solely those of the authors and do not necessarily represent those of their affiliated organizations, or those of the publisher, the editors and the reviewers. Any product that may be evaluated in this article or claim that may be made by its manufacturer is not guaranteed or endorsed by the publisher.
Research integrity at Frontiers
Learn more about the work of our research integrity team to safeguard the quality of each article we publish.