
94% of researchers rate our articles as excellent or good
Learn more about the work of our research integrity team to safeguard the quality of each article we publish.
Find out more
ORIGINAL RESEARCH article
Front. Mar. Sci., 06 January 2025
Sec. Aquatic Physiology
Volume 11 - 2024 | https://doi.org/10.3389/fmars.2024.1507994
 Peter Almaiz Palma1*Michaël Bekaert1†Alejandro P. Gutierrez1†Elfred John C. Abacan2Herve Migaud1†Mónica B. Betancor1
Thermal condition has profound influence on physiology and behaviour of ballan wrasse (Labrus bergylta), a cleaner fish commonly deployed in salmon cages to control sea lice infection. To address knowledge gaps on the species thermal biology, critical thermal limits were determined by acclimating fish (21.5 ± 3.1 g, 10.5 ± 0.4 cm) at a range of temperatures (6, 10, or 14°C) found in its natural habitat on the west coast of Scotland for one week and subjecting them to ramping temperature (~0.3°C/min) until loss of equilibrium. Critical thermal maxima (CTmax), minima (CTmin), and thermal breadth values increased with acclimation temperature. Thermal tolerance polygon was constructed and showed the intrinsic (7.9 to 16.8°C) and acquired (3.4°C and 22.8°C) thermal tolerance zones, supporting the seasonal differences in behaviour and delousing efficacy of ballan wrasse deployed in salmon farms. Gill transcriptomic profiles of ballan wrasse were performed following thermal acclimation and subsequent exposure to CTmax and CTmin. Initial acclimation resulted in unique differentially expressed genes (DEGs) and enrichment of GO terms that were almost exclusively found in each acclimation group. Transcriptome response to CTmax and CTmin also varied between acclimation groups. CTmax and CTmin shared 0% DEGs at 6°C, 43% at 10°C, and 7% at 14°C, but some overlapping GO terms. This study is the first to investigate the thermal tolerance limits of ballan wrasse and provides new data into the plasticity of thermal tolerance limits and molecular response to thermal stimuli in fish.
Temperature has a profound influence on fish physiology, which in turn determines their growth rate, reproductive success, and overall survival (Farrell, 2009; Moyano et al., 2017). In general, fish tend to live in areas where temperature is within their optimal range (Soyano and Mushirobira, 2018). To maintain homeostasis in an environment where temperature shifts periodically (e.g., diurnal, seasonal), fish have developed behavioural adaptations such as thermal navigation to seek optimal conditions in a thermal gradient (Schulte, 2011; Soyano and Mushirobira, 2018). Fish also take advantage of thermal navigation to strategically support specific physiological function. For instance, lake sculpin (Cottus extensus) and coho salmon (Oncorhynchus kisutch) forage in cold food-rich areas and then migrate to warmer areas of the water column or stream for efficient digestion thereby improving energy intake and growth (Armstrong et al., 2013). Some evidence has also been found to suggest that infected fish seek warmer conditions to hasten recovery (Huntingford et al., 2020). However, fish in captive conditions, such as in aquaculture settings, are unable to use these behavioural mechanisms. Therefore, when ambient water temperature fluctuates to suboptimal level, they rely on physiological adaptations that can be detrimental to their health and affect their survival (Kottmann et al., 2023).
During on-growing culture of Atlantic salmon (Salmo salar) which takes at least ~2 years in sea water, ballan wrasse (Labrus bergylta) are deployed as biological control against sea lice infection in sea cages where they inevitably experience seasonal changes in thermal conditions (Brooker et al., 2018). Water temperature in salmon farms in Scotland can range from ~6°C in winter to ~15°C in summer. Temperate wrasse species (family Labridae) however have been reported to avoid temperatures below 8°C in the wild (Dipper et al., 1977) while experimental exposure to low temperature (5°C) has been shown to induce lethargic behaviour or dormancy (Yuen et al., 2019). Consequently, in salmon cages, a reduction in the delousing activity of ballan wrasse has been noticed during winter (Brooker et al., 2018; Geitung et al., 2020) together with increased mortality rates (Treasurer, 2002; Geitung et al., 2020). During hatchery rearing, the decrease of water temperature in winter is associated with reduced feeding activity and, consequently, slower growth rate (Brooker et al., 2018). These observations from cage and hatchery settings demonstrate the impact of temperature on the condition, welfare and performance of ballan wrasse. Unfortunately, current knowledge on the thermal biology including thermal tolerance limits of ballan wrasse is very limited despite its growing popularity as cleaner fish in the salmon industry.
Fish thermal tolerance can be determined using laboratory measures such as the incipient lethal temperature technique (ILT), chronic lethal methodology (CLM), and critical thermal methodology (CTM) (Beitinger and Lutterschmidt, 2011). These tests involve subjecting fish to thermal challenge, either increasing or decreasing temperatures, to determine upper or lower thermal limits. While ILT and CLM rely on mortality as the endpoint, CTM is a non-lethal test that uses loss of equilibrium (LOE) as the endpoint, hence is generally used for ethical consideration. Considering that the thermal tolerance limits of fish are markedly influenced by thermal experience, these tests are performed on fish that have been acclimated at a range of temperatures (Becker and Genoway, 1979; Beitinger and Bennett, 2000). It is known that acclimation temperature regulates the standard metabolic rate and aerobic scope of fish, affecting their capacity to cope with external stimuli (Farrell, 2009; Moyano et al., 2017).
The heat shock and other molecular responses of fish to thermal stimuli (e.g., exposure to thermal tolerance limits) can similarly be altered by prior thermal experience, however the role of acclimation temperatures is often overlooked in studies looking at heat response in fish (Logan and Buckley, 2015). In molecular studies where acclimation temperature is accounted, the focus is limited to either response to upper or lower limit, but rarely both (Logan and Somero, 2011; Hu et al., 2016). Hence a comprehensive investigation on the molecular response of fish to both upper and lower thermal tolerance limit and across different acclimation temperatures is lacking.
Understanding the thermal biology and physiology of fish species is essential for successful aquaculture however, this knowledge is lacking for ballan wrasse. Thus, this study aimed to determine the thermal tolerance of ballan wrasse using the CTM. Specifically, we examined the upper and lower thermal tolerance limits after acclimating the fish to a range of temperatures. Gill tissue samples were analysed for transcriptomic changes in response to these acclimation temperatures and exposure to thermal tolerance limits. These analyses provided novel insights into the plasticity of underlying molecular response to temperature in fish.
The trial was performed according to the guidelines of the Animals Scientific Procedures Act 1986 (Home Office Code of Practice. HMSO: London January 1997) and in accordance with EU regulation (EC Directive 86/609/EEC). Prior to conducting the trial, it has undergone thorough ethical review and received approval from the Animal Welfare and Ethical Review Body of the University of Stirling (AWERB 2022 7597 7975). This study was conducted under the project licence number PBBB474D5 (Environmental and genetic regulation of fish physiology) and personal licence number I76131148 (PA Palma).
Hatchery-bred ballan wrasse (21.5 ± 3.1 g, 10.5 ± 0.4 cm, condition factor (K) = 1.9 ± 0.2; mean ± S.D.) were obtained from Otter Ferry Seafish Ltd. (OFS; Tighnabruaich, Scotland) and transported to the University of Stirling Marine Environmental Research Laboratory (MERL, Machrihanish, Scotland) where the experiment was conducted. Fish were produced from wild-sourced broodstock and were grown using standard practice at OFS. At MERL, fish were divided into three 100-L flow through tanks (60 fish/tank) equipped with artificial hides and aeration. Fish were held in these tanks for two weeks at ambient temperature of 13.2 ± 0.2°C to allow recovery from transport. During this period, fish were fed 1.5% biomass/day with a commercial wrasse diet (Symbio Plus 1.5; BioMar, Denmark) and photoperiod maintained at 12:12 light:dark cycle. Water quality parameters were monitored daily (salinity 33.0 ± 0.0 ppt, D.O. 96.9 ± 0.7%). We note that this species is a protogynous hermaphrodite and is undergoing early stage of oogenesis at this size (Palma et al., 2023).
Following post-transport recovery, water temperature in each of the three tanks was gradually adjusted (~1°C/day) from ambient 13.2°C temperature to either 6, 10 or 14°C, where fish were acclimated for 7 days. Actual temperatures were 6.2 ± 0.1, 10.1 ± 0.1, 13.9 ± 0.2°C, respectively. During acclimation, water quality and photoperiod were maintained as during quarantine. Fish were also fed at a similar rate except 24 h prior to thermal tolerance test, when fish were fasted.
Critical Thermal Methodology (CTM) was used to determine the upper (critical thermal maxima; CTmax) and lower (critical thermal minima; CTmin) thermal tolerance limit of ballan wrasse as described by Beitinger and Lutterschmidt (2011). In each acclimation group, 20 fish were used to determine CTmax and another 20 for CTmin. During the test, fish were individually placed in baskets in the experimental setup (Figure 1) with the same water temperature as their acclimation tank and allowed to adjust for about 10-15 mins. Only a maximum of four fish were challenged each time. The water temperature was then either chilled or heated (Figure 1) at a ramping rate of ~0.3°C/min until fish displayed LOE which was considered as the endpoint (i.e., CTmin or CTmax). LOE is defined as “the inability to maintain an upright position in the water column” (Lee et al., 2016; Rodgers et al., 2019). Fish were then either immediately transferred to a recovery tank or held at the endpoint temperature in the challenge container for 10 mins followed by euthanasia for tissue collection.
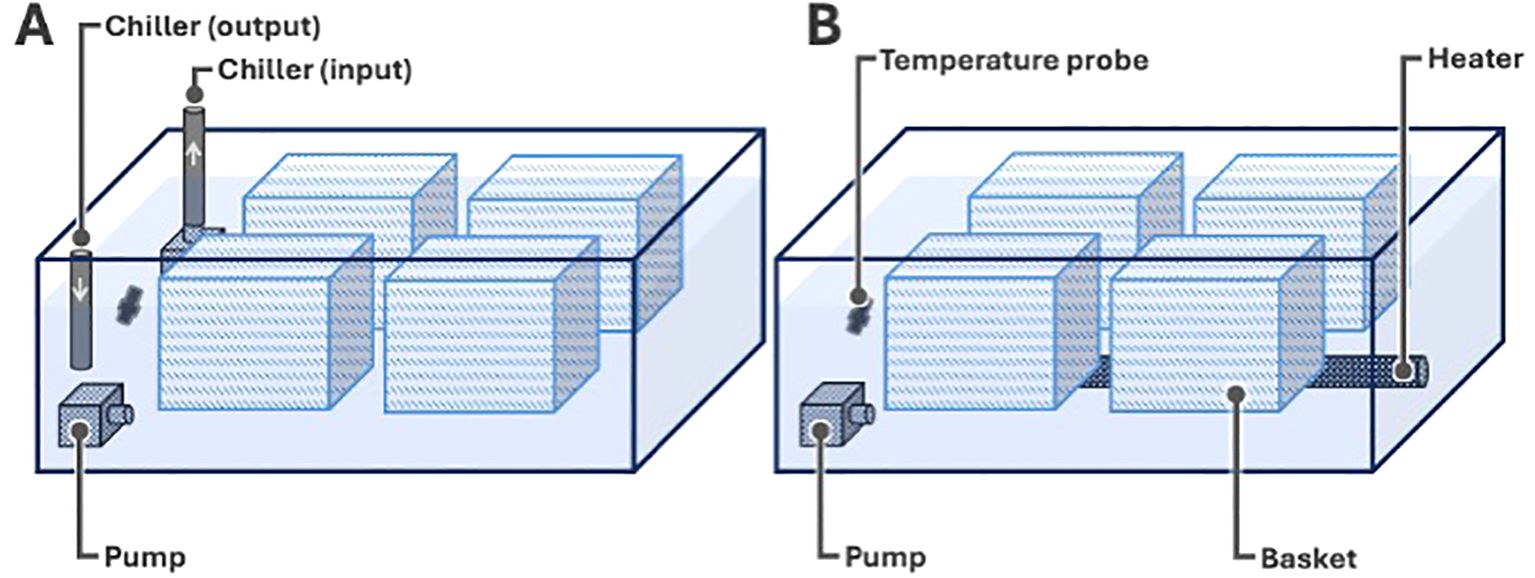
Figure 1. Experimental setup for CTM to determine (A) CTmin and (B) CTmax. The experimental set up consisted of a plastic tub with seawater (8 L for CTmin, 11 L for CTmax), a pump for water circulation, temperature probe for monitoring of water temperature, and four baskets that individually hold the fish. For CTmin, another pump was used to move the water from the experimental setup, into a chiller (input) (TK 150 Aquarium Chiller; TECO, USA) and back (output). For CTmax, a submersible heater (V2 Therm 200 Digital Heater; TMC, UK) was placed at the bottom of the experimental setup.
The thermal tolerance polygon was constructed based on mean critical limits values at different acclimation temperatures. Tolerances zones were drawn, and the areas calculated expressed as °C2. Thermal breadth (Tbr) was calculated as the difference between CTmax and CTmin. Upper Tbr and Lower Tbr were also calculated as the difference between the acclimation temperature and CTmax and CTmin, respectively.
Gill tissue samples were collected in this study given its critical function in thermal physiology and its sensitivity to thermal conditions. After reaching the critical thermal limits during thermal challenge, some fish (CTmax and CTmin = 12/acclimation group) were held at the endpoint temperature (i.e., CTmax or CTmin) for 10 mins and then euthanized by anaesthetic overdose (200 ppm, MS-222 bath; Pharmaq, UK) followed by destruction of brain. For each acclimation temperature, tissue sample of left gills were collected from fish exposed to CTmax (n = 12/acclimation group) or CTmin (n = 12/acclimation group). Tissue samples were also collected from fish that were acclimated at different temperatures but not subjected to CTM (n = 12/acclimation group) which served as base samples. Tissues were placed in RNA preservation buffer (3.62 M ammonium sulphate, 20 mM sodium citrate, 10 mM EDTA di sodium salt; pH 5.2) which were kept overnight at 4°C and then stored at -80°C until RNA extraction.
RNA extraction was done using QIAGEN (Germany) RNeasy Mini Kit following the manufacturer’s instruction. RNA extracts were resuspended in molecular grade water (Thermo Fisher, USA) and stored at -80°C. The extracts were quantified on NanoDrop™ 2000 (Thermo Scientific, USA) and the quality checked through agarose gel electrophoresis. For each of the three acclimation temperatures, 6 base samples, 6 from CTmax and 6 from CTmin were randomly selected and sent for commercial sequencing (Azenta/GENEWIZ UK Ltd., UK). Commercial quality check confirmed the RNA Integrity Number of the samples to be ≥ 7.0. This was followed by library preparation and sequencing on Illumina NovaSeq platform (150 bp pair-end reads).
Raw sequence data were cleaned using fastp (Chen et al., 2018). Sequences were then aligned against ballan wrasse genome assembly (BallGen_V1 [GCA_900080235.1], Ensembl) using HiSat2 v2.2.0 (Kim et al., 2019). This was followed by annotation using stringtie v2.1.0. Sequences were deposited in the database of the European Bioinformatics Institute (Project No. PRJEB61459).
Differential gene expression was analysed using DESeq2 (version 1.40.2) package on R by comparing the transcriptome of: (1) base samples or fish acclimated at 6°C and 14°C against 10°C, and (2) fish subjected to CTmax or CTmin against the base samples in each acclimation temperature. Differentially expressed genes (DEGs) were identified based on threshold adjusted P-value of 0.05 and Log2 fold change of 1. Venn diagrams were created using ggVenDiagram (version 1.2.2) R package to show shared and unique DEGs between treatment groups.
Gene ontology (GO) term enrichment analysis for DEGs was done on g:Profiler (https://biit.cs.ut.ee/gprofiler/gost) using the g:GOSt Functional Profiling option. DEGs were used as input to obtain statistically significantly enriched GO terms (P<0.05) under different biological domains namely molecular function, cellular component, and biological process. Shared and unique terms were visualized on Venn diagrams created using ggVenDiagram (version 1.2.2) R package. The driver GO terms or the leading gene sets among closely related sub-ontogenies were also identified using g:Profiler.
The normality of data (CTmax, CTmin, Upper Tbr, and Lower Tbr) distribution was initially tested using Shapiro-Wilk Test performed in IBM SPSS Statistics (version 29.0.2.0) software. Since data was not normally distributed, differences in average values among acclimation groups were determined by Kruskal-Wallis Test followed by multiple pairwise comparisons with Bonferroni adjustment. Differences were considered significant at P <0.05.
Principal Component Analysis was conducted using DESeq2 (version 1.40.2) package on R to determine the effects of thermal acclimation temperatures and subsequent exposure to thermal limits (i.e., CTmax and CTmin) on gill transcriptome of ballan wrasse.
Acclimation temperatures resulted in differences in fish behaviour especially at 6°C wherein fish displayed inactivity, mainly laying at the bottom of the tank. In comparison, fish at 10 and 14°C were relatively more active, swimming in the upper and middle portions of the tank. There was no mortality recorded during the acclimation period in all groups.
The thermal tolerance values of ballan wrasse are shown in Table 1. CTmax (22.8 ± 1.2°C) and CTmin (7.9 ± 0.7°C) were highest in fish acclimated at 14°C. Critical thermal limits decreased significantly when fish were acclimated at lower temperatures. Fish acclimated at 6°C displayed the lowest CTmax (16.8 ± 2.3°C) and CTmin (3.4 ± 0.8°C). Similarly, Tbr appeared to be wider for 10 and 14°C groups (15.0-15.6°C) compared to Tbr at 6°C (13.4°C). The same trend was observed for Lower Tbr, as evidenced by significantly increasing values. Interestingly, Upper Tbr was significantly larger at 10°C (12.3 ± 1.7°C) relative to other groups with 14°C group showing significantly lower Tbr (8.8 ± 1.2°C).
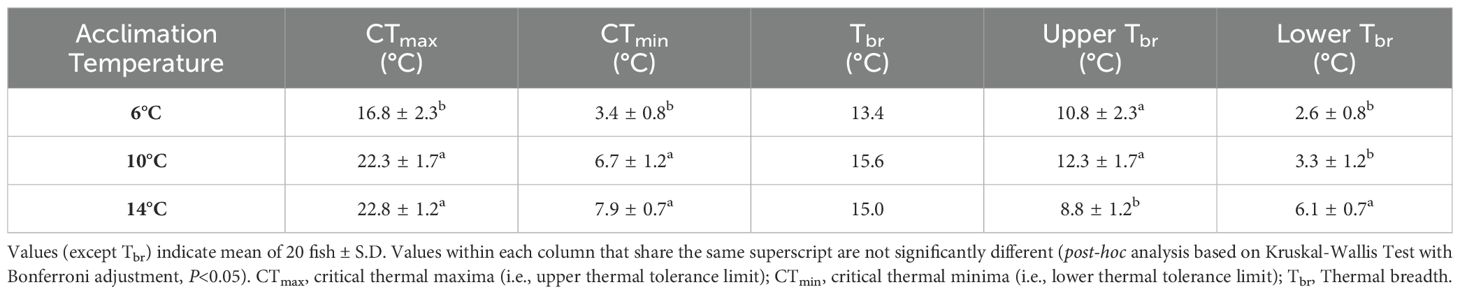
Table 1. Thermal tolerance limits and thermal breadth of ballan wrasse acclimated at different temperatures.
The thermal tolerance polygon is divided into acquired tolerance zone and intrinsic tolerance zone as shown in Figure 2. The intrinsic tolerance zone or the temperatures that fish were able to tolerate regardless of the prior acclimation temperature ranged from 7.9 to 16.8°C. With prior acclimation, fish acquired an upper tolerance of up to 22.8°C and lower tolerance of 3.4°C.
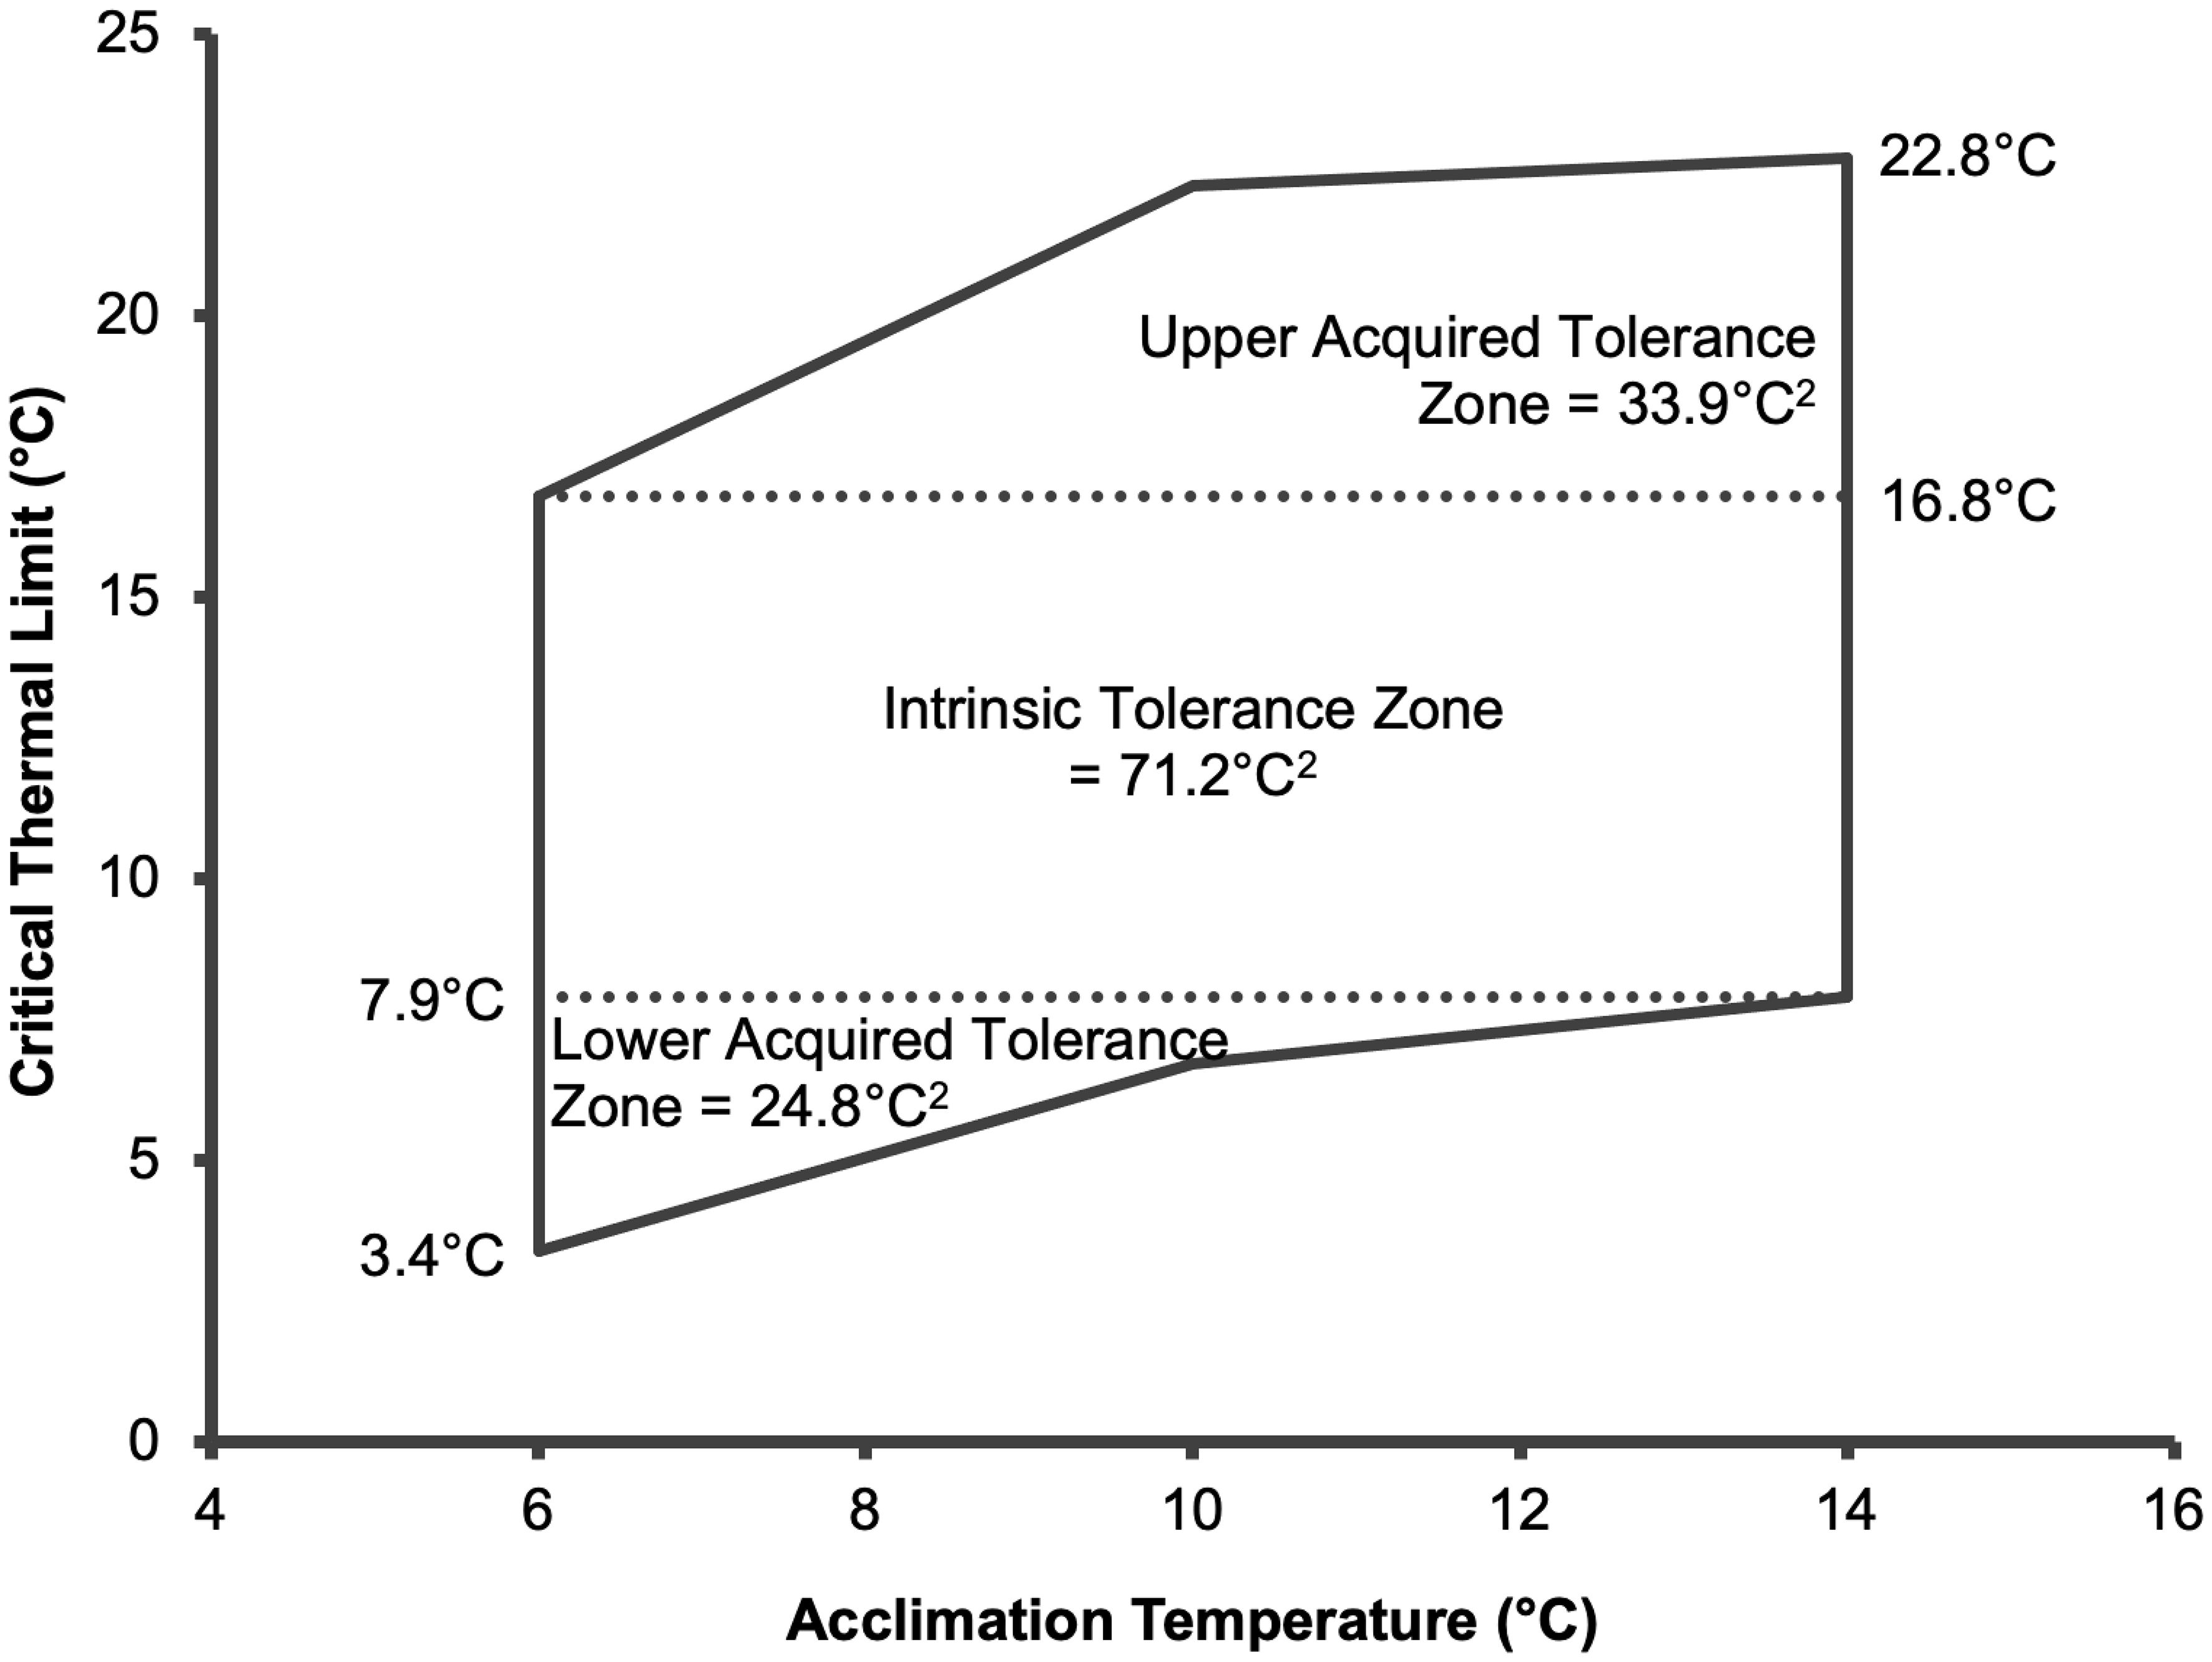
Figure 2. Critical thermal tolerance polygon of ballan wrasse constructed from mean CTmax and CTmin values. Total area of thermal tolerance polygon is 129.9°C2.
Acclimation to a range of temperatures for a week markedly influenced the gill transcriptome profile of ballan wrasse as shown through the Principal Component Analysis (PCA; Figure 3) and differential gene expression analysis and GO term enrichment analysis (Figure 4). The PCA plot of the normalized gill transcriptomic response of ballan wrasse to acclimation and subsequent exposure to CTmax and CTmin shows that, along PC1 (24% variance explained), transcriptome response of individuals tends to cluster and exhibit a global shift according to acclimation temperature. Separation or clustering according to exposure to the critical thermal limits was not observed.
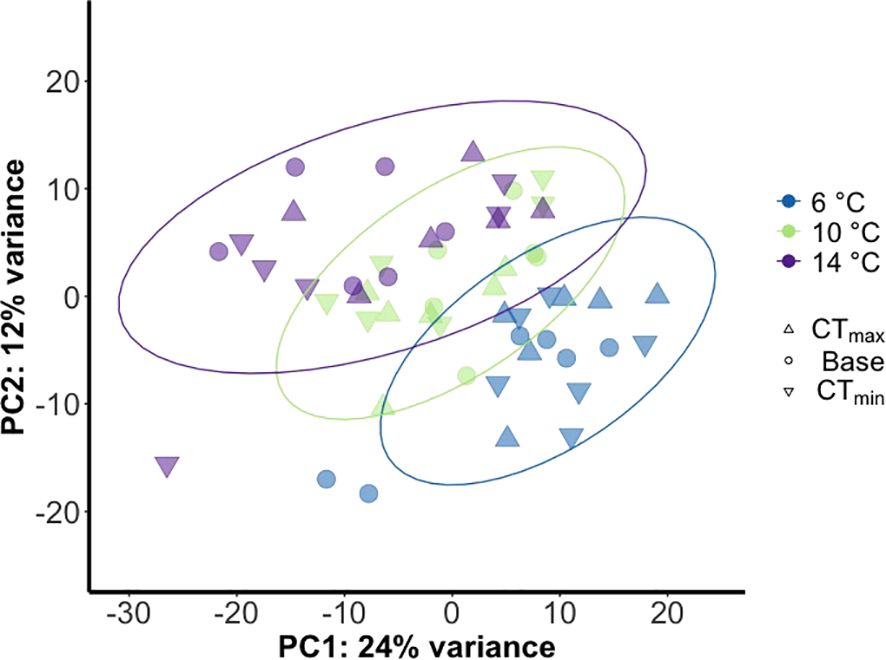
Figure 3. Principal component analysis of global gill transcriptome in ballan wrasse in response to different acclimation temperatures and exposure to either CTmax or CTmin. Each dot represents individual fish. Sample number is 18 fish/temperature group, consisting of 6 fish exposed to CTmax, 6 to CTmin and 6 basal. Total sample number is 72.
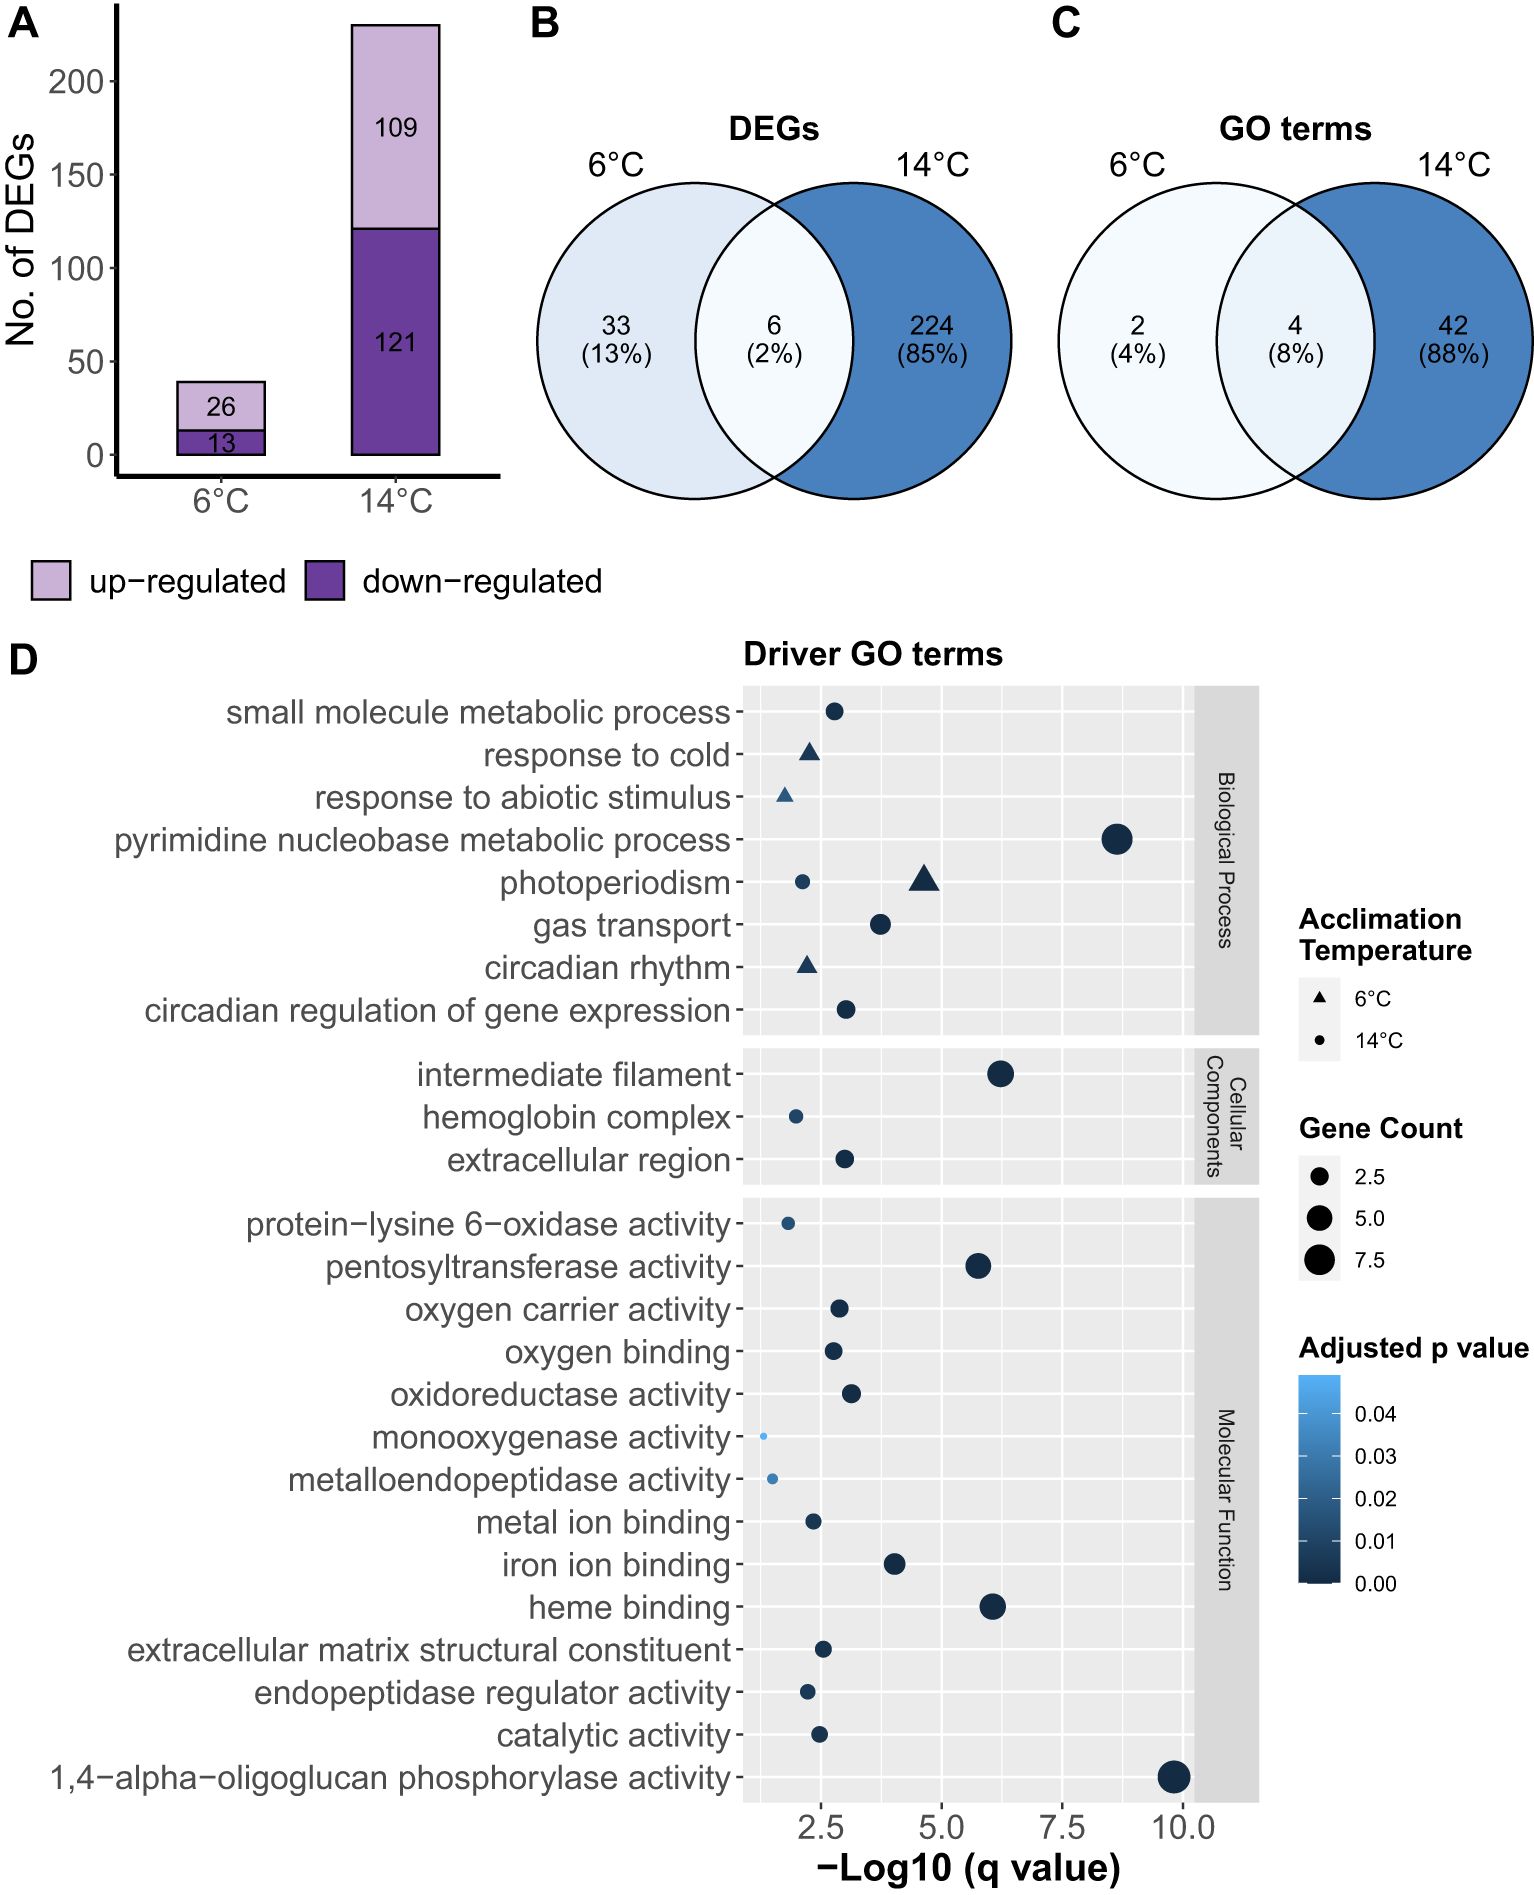
Figure 4. Effects of temperature on the gill transcriptome profile of ballan wrasse. (A) Bar plot of number of up- and down-regulated genes, (B) Venn diagram of common and unique genes differentially expressed per acclimation group, (C) Venn diagram of common and unique GO terms significantly enriched in each acclimation group, and (D) driver GO terms which were classified under three domains – biological process, cellular component, and molecular function. DEGs at 6°C and 14°C were determined relative to 10°C.
Results of differential gene expression and GO term enrichment analyses are shown in Figure 4. The number of DEGs were much higher in 14°C fish compared to 6°C (Figure 4A). We found that the identity of the DEGs were predominantly unique to each temperature group (Figure 3B), although GO term enrichment analysis showed that all three temperature groups shared 8% GO terms (Figure 4C). Fish in 6°C group showed activation of various driver GO terms such as “response to cold”, “response to abiotic stimulus”, and “circadian rhythm” under the Biological Process domain (Figure 4D). In comparison, 14°C enriched various driver GO terms in all of three domains. One driver GO term “photoperiodism” was found to be affected by both 6 and 14°C temperatures.
Gill transcriptome analyses have shown varying response to critical thermal limits depending on temperature (Figure 5). The number of DEGs were relatively higher in response to CTmax compared to CTmin (Figure 5A). The highest number of DEGs in response to CTmax was in 14°C fish followed by 10°C while fish at 6°C exhibited the least number of DEGs (Figure 5A). In response to CTmin, fish at 10°C had the highest number of DEGs followed by those at 14°C and then at 6°C (Figure 5A). Interestingly, the DEGs in response to both CTmax and CTmin are all unique to each group acclimated at different temperatures (Figures 5B, C), except 10 and 14°C that shared 4% DEGs in response to CTmax. We found that transcriptomic changes appear to be different in response to CTmax compared to CTmin at 6 and 14°C where common DEGs is only 0-7% (Figures 5D, F). At 10°C, CTmax and CTmin share 43% genes in common (Figure 5E). The top DEGs (based on q-value) found in response to CTmax and CTmin at different acclimation temperatures are shown in Table 2. The complete list of DEGs is provided in Supplementary Data Sheet 1.
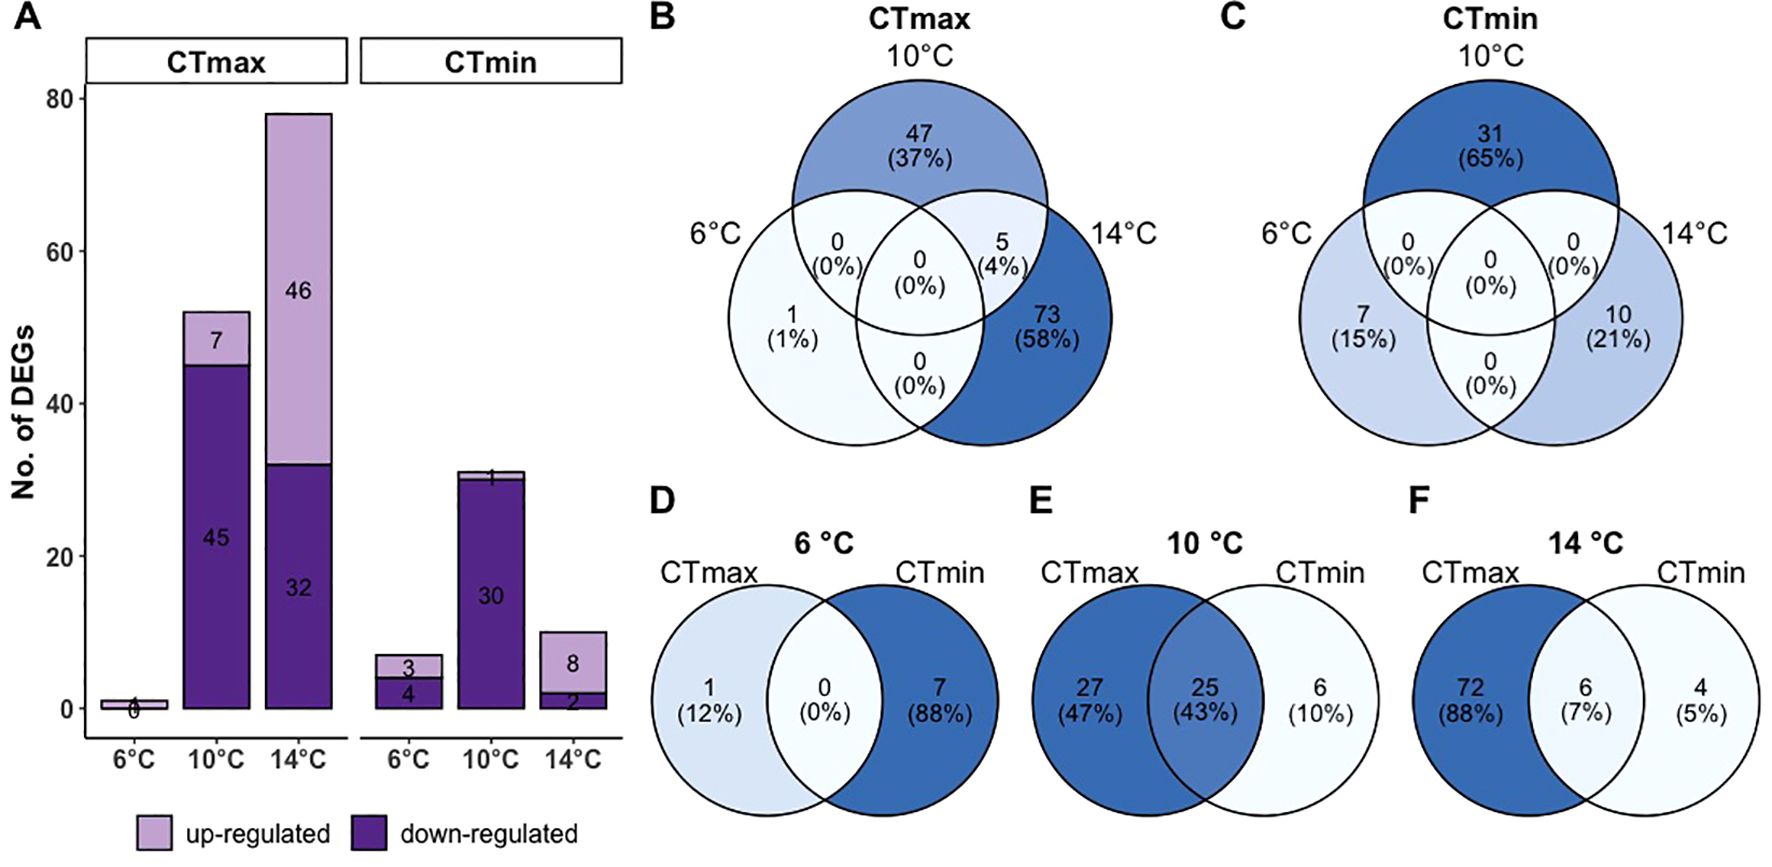
Figure 5. Differentially expressed genes in the gills of ballan wrasse exposed to CTmax or CTmin following acclimation to either 6°C, 10°C, or 14°C. (A) Number of up- and down-regulated genes, and (B-F) common and unique genes differentially expressed at CTmax or CTmin at different acclimation temperatures.

Table 2. Top DEGs in response to CTmax and CTmin following acclimation at different temperatures.
Results of GO term enrichment analysis is shown in Figure 6. The number of enriched GO terms in response to CTmax was highest in fish at 14°C followed by fish at 10°C while the number of enriched GO terms in response to CTmin was highest in fish at 10°C followed by fish at 14°C (Figure 6A). Due to limited number of DEGs in fish at 6°C, the analysis was not able to identify significantly enriched GO terms. These observations are consistent with our data on the number of DEGs (Figure 5A). We found common GO terms (2-20%) in response to CTmax or CTmin in fish at 10 and 14°C (Figure 6B).
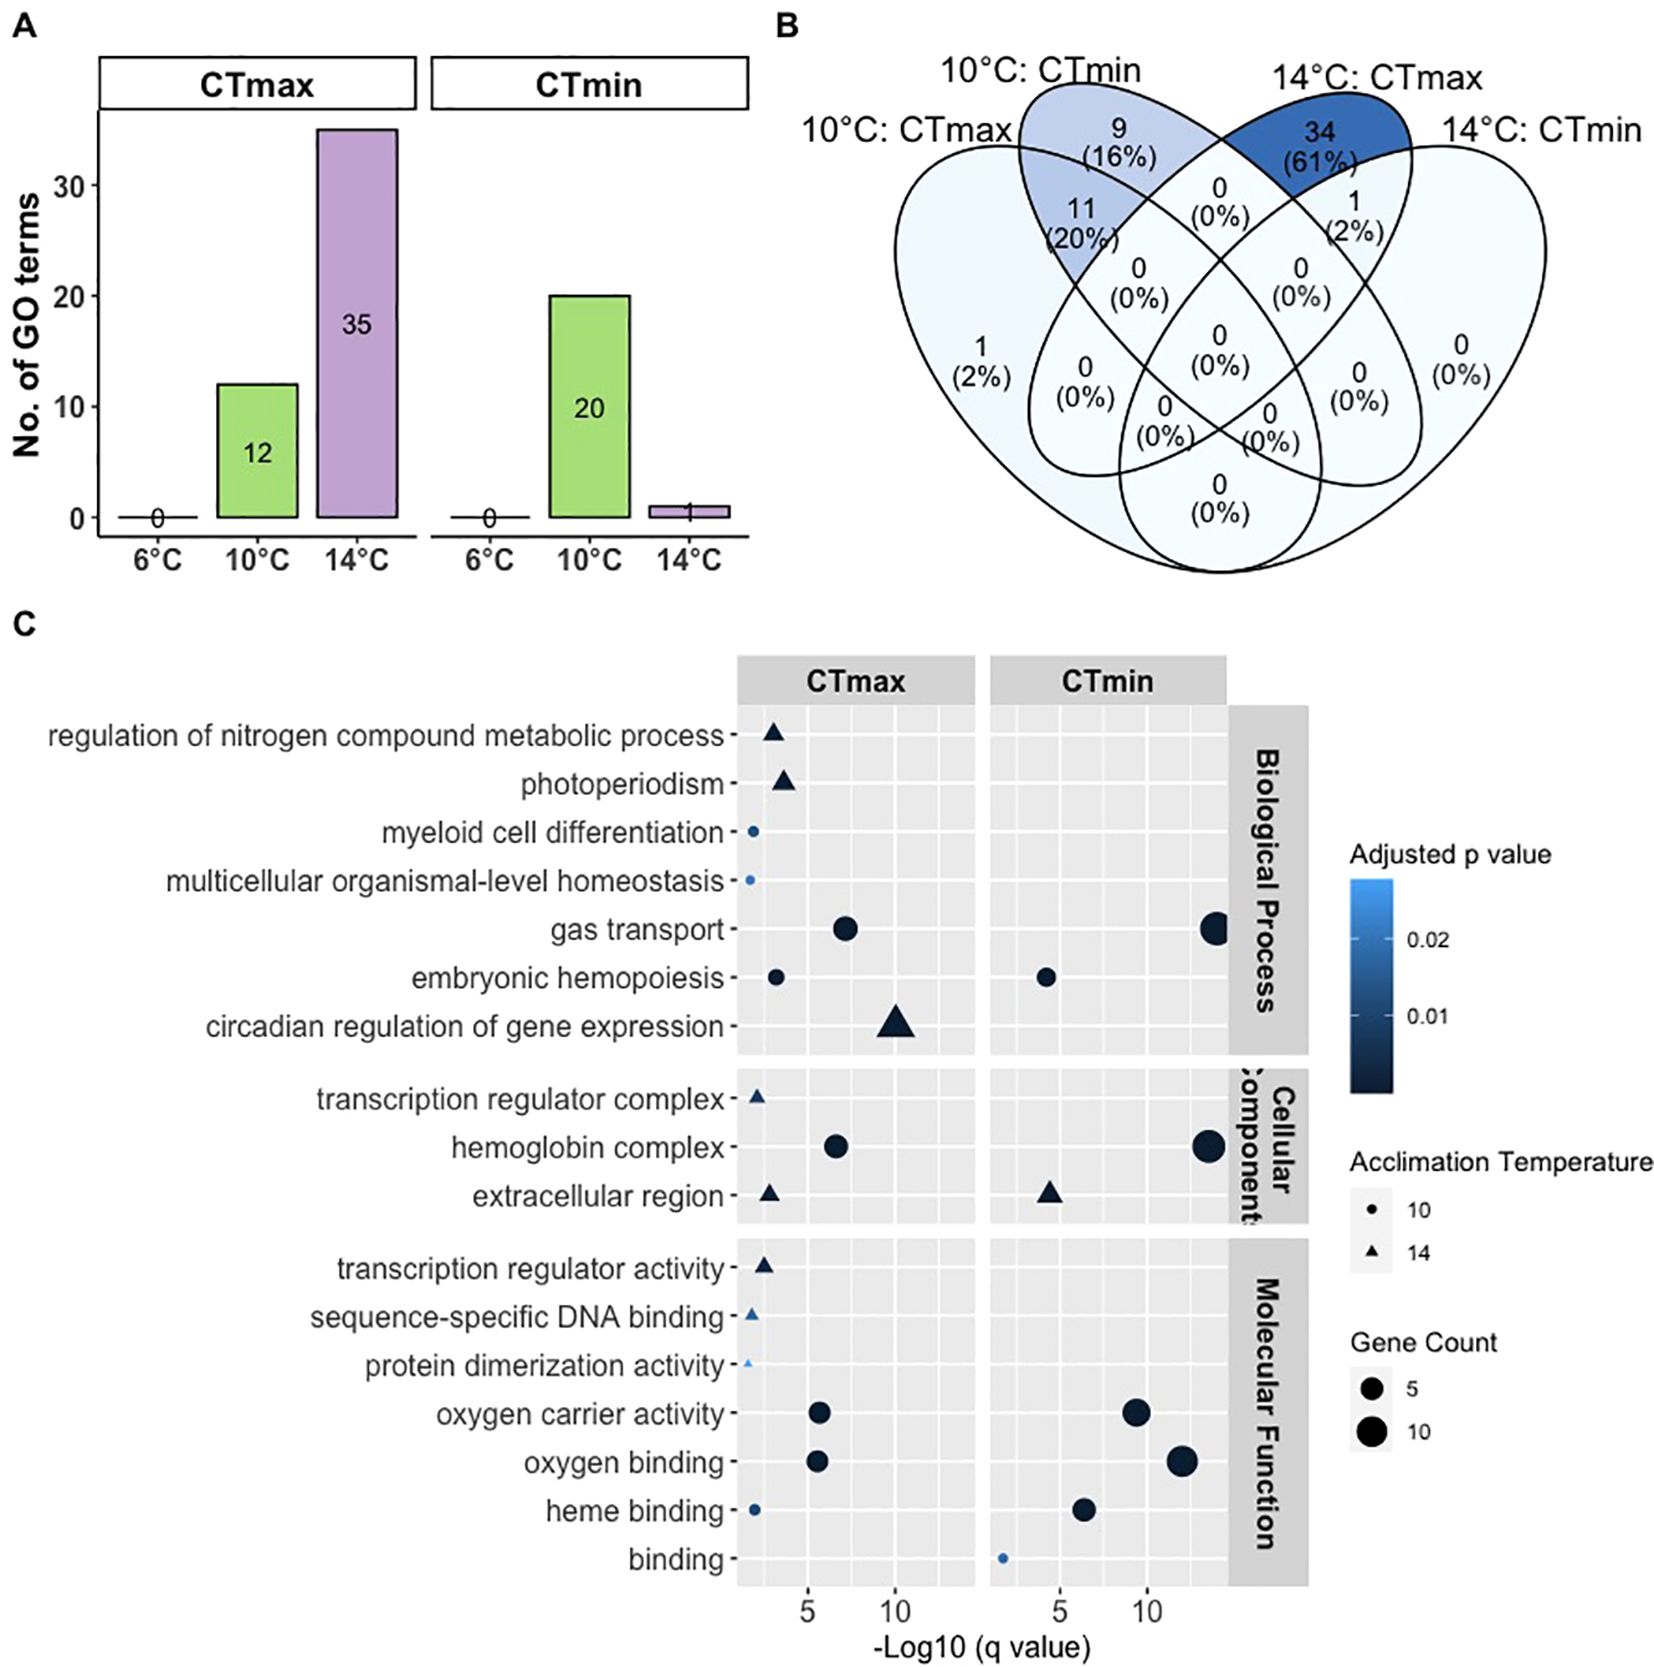
Figure 6. Gene ontology analysis of differentially expressed genes in the gills of ballan wrasse exposed to CTmax or CTmin following acclimation to either 6°C, 10°C, or 14°C. (A) Total number of significantly enriched GO terms, (B) common and unique GO terms between groups, and (C) driver GO terms classified under three domains – Biological Process, Cellular Component, and Molecular Function.
The driver GO terms were identified from the total enriched GO terms and are shown in Figure 6C. The complete list of all significantly enriched GO terms is shown in Supplementary Table 1. The driver GO terms are divided into three domains namely Biological Processes (41%), Cellular Components (18%) and Molecular Functions (41%). At 10°C, driver GO terms that are common in CTmax or CTmin include “gas transport”, “myeloid cell differentiation”, “hemoglobin complex”, “oxygen carrier activity”, “oxygen binding” and “heme binding”. Driver GO terms, “myeloid cell differentiation” and “multicellular organismal-level homeostasis” were found only in CTmax while “binding” was only found in CTmin. In comparison, fish at 14°C had a driver GO term (“extracellular region”) that was common in CTmax and CTmin while the rest were only found in response to CTmax such as “photoperiodism”, “circadian regulation of gene expression”, “transcription regulator complex”, and “transcription regulator activity”.
Temperature is a major regulator of fish physiology and behaviour. For ballan wrasse that is deployed in salmon cages to control sea lice infection, changes in water temperature can have major impact on their delousing performance. Despite the extensive use of ballan wrasse in the salmon farming sector, very little is known regarding the species thermal biology, specifically its intrinsic and acquired thermal tolerance limits hence there is no reference for interpretation or prediction of the species behaviour at different ambient temperatures. In this study, we determined the upper and lower thermal tolerance limits of ballan wrasse which showed plasticity as influenced by acclimation temperatures. Given the fragmentary information on tissue specific molecular changes in response to thermal stimuli, we analysed the gill transcriptome profiles of ballan wrasse associated with exposure to CTmax and CTmin which we found to be altered by acclimation temperature.
The thermal tolerance limits (CTmax and CTmin) of ballan wrasse acclimated at a range of temperatures (6, 10 o 14°C) were determined using CTM in this study. We found that thermal tolerance limits were directly related to the acclimation temperatures. Specifically, the highest CTmax and CTmin values were observed in 14°C fish while lowest CTmax and CTmin values were observed in 6°C fish. Similar trend has been reported in other fish species such as Atlantic salmon (Elliott, 1991), Arctic charr (Salvelinus alpinus) (Elliott and Klemetsen, 2002), Atlantic herring (Clupea harengus) and European seabass (Dicentrarchus labrax) (Moyano et al., 2017), and is consistent with the established thermal tolerance model in fish (Beitinger and Lutterschmidt, 2011). These studies clearly demonstrate the plasticity of thermal tolerance limits in fish, especially the effects of prior thermal experience. This also underscores the importance of testing for thermal tolerance at different acclimation temperature which is overlooked in some studies. Previous report on the plasticity of thermal tolerance in fish has pointed some degree of sexual dimorphism (Pottier et al., 2021) however such observation does not apply to ballan wrasse given their nature as protogynous hermaphrodites, with all individuals initially developing as females (Palma et al., 2023).
It should be noted that although CTM has been widely used to evaluate thermal tolerance in fish, caution must be taken when interpreting the endpoints. CTmax and CTmin are more relevant when used as basis to construct a thermal tolerance polygon where the intrinsic and acquired thermal tolerance zones can be drawn from (Eme and Bennett, 2009; Desforges et al., 2023). In the current study, a critical thermal tolerance polygon was constructed which showed the intrinsic tolerance zone of ballan wrasse, bound by 7.9°C and 16.8°C. Intrinsic tolerance zone represents the temperatures that fish can tolerate regardless of prior acclimation temperature. It is interesting to note that in the wild, temperate species of wrasse are known to avoid areas where temperature is below 8°C (Dipper et al., 1977). Indeed, ballan wrasse inhabiting Portelet Bay, Jersey (English Channel) have been observed to enter a state of dormancy or torpor during winter when mean water temperature is around 8.2°C (Morel et al., 2013). Similarly, anecdotal observations by salmon farmers suggest that delousing activity by ballan wrasse stops when temperature drops below 8°C (Brooker et al., 2018; Yuen et al., 2019). The temperature at which behavioural changes (i.e., dormancy) have been observed in the wild and under captive conditions supports the estimated lower end of intrinsic tolerance of ballan wrasse found in the present study. Although the exact physiological mechanism governing low temperature dormancy in fish is not completely understood, the shift from normal behaviour to dormancy is likely regulated by a threshold temperature (Soyano and Mushirobira, 2018). And based on the observations from the present and previous studies, the threshold temperature for ballan wrasse appears to be around 8°C.
The thermal tolerance polygon further shows that thermal tolerance of ballan wrasse can extend beyond the intrinsic zone when allowed to acclimate. Indeed, the acquired tolerance zone extends from 3.4°C (lower) to 22.8°C (upper). In this study, ballan wrasse acclimated at 6°C displayed lethargic behaviour characterised by a lack of swimming activity and positioning at the bottom of the tank. This is consistent with a previous observation of ballan wrasse acclimated for two weeks at 5°C (Yuen et al., 2019). Acclimation of ballan wrasse at such low temperature is associated with significant suppression in metabolic condition (Yuen et al., 2019). Additionally, long-term exposure (4.5 months at 6°C) leads to increased prevalence of emaciation and scale loss, significant reduction in epidermal thickness and epidermal mucous cells, as well as upregulation of the immune marker interleukin 6 (il-6) (Kottmann et al., 2023). These observations seem to suggest that the tolerance of ballan wrasse to temperatures below the intrinsic tolerance zone is facilitated through physiological and metabolic adaptation that has health and welfare trade-offs that are evident after extended period of exposure. In Tvedestrand fjord in Norway, ballan wrasse have been noted to explore wide areas of the water column with temperatures ranging from 12 to 17°C during summer, while activity is limited to areas with 7 to 8°C during spring and 8 to 9°C during winter (Freitas et al., 2021). It is likely that ballan wrasse may have developed a strategy to survive winter season by utilizing areas with temperature that is sufficiently low (i.e., around the threshold) to trigger dormancy but not too low to minimize negative health and welfare consequences. To ensure the welfare and sustain year-round delousing activity of ballan wrasse during deployment in salmon farms, the industry could benefit from selecting populations that are more tolerant to low temperatures. To achieve this, molecular markers associated with thermal tolerance must first be developed. Meanwhile, rearing ballan wrasse in hatchery facilities with controlled water temperatures should maintain thermal conditions above ~8°C to prevent dormancy and ensure continued feeding activity and growth.
The Tbr of ballan wrasse in the present study, calculated as the difference between CTmax and CTmin, was also affected by acclimation temperature. The lowest Tbr value was recorded in fish acclimated at 6°C while fish acclimated at 10 and 14°C had relatively higher Tbr. A previous study in ballan wrasse has demonstrated that low acclimation temperature reduces the metabolic performance (i.e., aerobic scope), which limits the fish physiological capacity to cope with environmental challenges (Kassahn et al., 2009; Petitjean et al., 2019; Yuen et al., 2019). Similar effect of acclimation temperature on Tbr has been reported in other species such as Atlantic salmon (Hvas et al., 2017) and lumpfish (Cylopterus lumpus) (Hvas et al., 2018). Some species such as Atlantic salmon can tolerate a wide range of temperature with estimated thermal tolerance limit below 0°C and up to 33°C which is a necessary adaptation for its migratory behaviour (Elliott, 1991; Farrell, 2009; Calado et al., 2021). In comparison, ballan wrasse naturally exhibit high site fidelity covering only a relatively small area in the wild therefore its narrow Tbr is not surprising (Villegas-Ríos et al., 2013; Skiftesvik et al., 2015).
There have been many studies that show the significant impact of thermal acclimation on fish transcriptome profile although these were mostly limited to either low- or high-temperature only. In this study, we were able to compare the transcriptome response to both low- and high-temperature conditions that ballan wrasse experience in the field (i.e., winter and summer). The gill transcriptome profile is different in fish from 6°C and 14°C as evidenced by global shifts in PCA analysis. Similar findings were reported in the gill transcriptome of wild pink salmon (Oncorhynchus gorbuscha) and sockeye salmon (O. nerka) wherein 5 to 7 days acclimation at either cool (13-14°C) or warm condition (19°C) resulted in distinct separation of acclimation groups in PCA plot (Jeffries et al., 2014). These global shifts in transcriptome are likely driven by temperature-dependent pathways and gene networks as previously reported in rainbow trout (O. mykiss) (Rebl et al., 2013). Between the acclimation groups, the number of DEGs and subsequently the enriched GO terms are higher in 14°C compared to 6°C fish which is plausible and reflective of the active behaviour and physiology of ballan wrasse at 14°C and its dormancy at 6°C. Moreover, this is supported by the identity of enriched driver GO terms across different domains in fish at 14°C while enriched driver GO terms at 6°C only include “response to cold” and “response to abiotic stimulus”.
The subsequent impact of acclimation on the transcriptome of fish in response to CTmax and CTmin has been particularly understudied. In the present study, since the Upper and Lower Tbr values were affected by acclimation temperature, the time it took to reach CTmax or CTmin also varied between the acclimation groups. Thus, a bias in transcriptome response was anticipated towards those that spent more time in the challenge unit. However, the number of DEGs in response to CTmax (6°C < 10°C < 14°C) was not consistent with the order of Upper Tbr (14°C < 6°C < 10°C). The number of DEGs in response to CTmin (6°C < 14°C < 10°C) were also inconsistent with the Lower Tbr (6°C < 10°C < 14°C). Our findings are in agreement with previous speculation in longjaw mudsucker (Gillichthys mirabilis) that the differences in gill transcriptome response to thermal challenge is primarily driven by acclimation temperature rather than the time taken to reach point of LOE (Logan and Somero, 2011). In juvenile lake whitefish (Coregonus clupeaformis), acclimation at different temperatures (6, 12 or 18°C) followed by exposure to ramping water temperature (0.2°C/min) until sublethal level (2°C-less than CTmax) resulted in expression of heat shock response genes (hsp70, hsp47, hsp90β, hsc70) in the gills that was consistently highest in 12°C-acclimated fish (Manzon et al., 2022). In the present study, DEGs were highest at 14°C (CTmax) and 10°C (CTmin) and consistently lowest at 6°C. These observations likely suggest that molecular responses to temperature challenge are facilitated in an ideal (presumably optimal) thermal environment and constrained in suboptimal condition.
Further examination of the gill transcriptome profiles of ballan wrasse shows that the identity of DEGs in response to both critical thermal limits and the enriched GO terms were predominantly different between acclimation temperatures. At 6°C, transcriptome response to CTmax and CTmin was minimal, and shared 0% common DEGs. One of the DEGs found was slc25a15b which is associated with metabolic processes including temperature adaptation as well as maintenance of homeostasis in fish (Guderley and Johnston, 1996; Jiang et al., 2013). The low number of DEGs was insufficient to identify significantly enriched GO terms. This could be because of reduced transcription activity at low temperature and as part of overall metabolic depression and energy-saving strategy during dormancy in fish (Soyano and Mushirobira, 2018; Reeve et al., 2022). However, this could imply that during winter, when ambient temperatures drop to around 6°C and transcription activity is constrained, the ballan wrasse’s capacity to cope with environmental stressors is compromised, making them more vulnerable.
At 10°C, driver GO terms such as “gas transport”, “embryonic haematopoiesis”, “hemoglobin complex”, “oxygen carrier activity”, “oxygen binding”, and “heme binding” were shared by CTmax and CTmin. Similar GO terms (e.g., “oxygen transport”, “hemopoiesis”, and “hemoglobin biosynthetic process”) were also significantly enriched in zebrafish exposed to lethal low temperature (Long et al., 2015). Consistently, among the top DEGs found such as sptb, ANK1 and gatala have known functions associated with structure, development and function of red blood cells (Liao et al., 2000; Li et al., 2014; Daane et al., 2020). These observations suggest that a key molecular response to critical thermal limits is to facilitate efficient uptake and supply of oxygen. However, we note that this appears to be only true at 10°C and not at 6 and 14°C acclimation group.
At 14°C, driver GO terms at CTmax and CTmin were entirely different to other acclimation groups and include “photoperiodism” and “circadian regulation of gene expression”, among others. “Circadian rhythm” is also among the significantly enriched GO terms in delta smelt (Hypomesus transpacificus) and inland silverside (Menidia beryllina) exposed to sublethal temperatures (Komoroske et al., 2021). Among the top DEGs include genes such as clocka, per3, nr1d2b, cry3a, and dbpa which are known to regulate circadian rhythm in fish (Zhdanova and Reebs, 2005; Amaral and Johnston, 2012; Frøland Steindal and Whitmore, 2019). These observations indicate the role of temperature as an environmental zeitgeber (time cue) that influences circadian rhythm in fish (Zhdanova and Reebs, 2005). Taken together, our findings suggest that during deployment in salmon cages, the physiological and molecular response strategies of ballan wrasse to environmental stimuli or stressors vary with seasonal changes in ambient temperature. Furthermore, our findings highlight that future studies examining the molecular responses of fish to environmental stimuli should consider the effects of holding temperature when interpreting the results.
This study is the first to investigate gill transcriptome response of fish to both upper and lower critical thermal limits following acclimation at different temperatures. Thorough comparison of our results with other studies is difficult given that most studies do not account for prior acclimation temperature when investigating transcriptomic response to critical thermal limits. Additionally, previous studies primarily focus on either upper or lower thermal tolerance limit but not both. Further studies are needed to fully understand how molecular response shifts between acclimation temperature and between upper and lower thermal limits. This includes effects of longer period of acclimation and longer exposure to thermal limits. The epigenetic effects of seasonal ambient temperature may provide another explanation on the observed differences in DEGs at different acclimation temperature hence should be further explored. In the present study, we analysed the transcriptome response in gill tissues given its sensitivity to thermal fluctuation in the environment however other tissues such as liver, kidney and brain can also provide useful information on thermal tolerance in fish (Logan and Buckley, 2015; Li et al., 2021). To further understand the physiological changes in ballan wrasse because of seasonal fluctuation in water temperature, various physiological parameters (e.g., stress and immune) should also be analysed following exposure to different temperatures.
In summary, this study is the first to investigate the thermal tolerance of ballan wrasse, specifically its critical thermal tolerance limits (CTmax and CTmin) which varied depending on acclimation temperature. Data generated from the critical thermal methodology enabled the construction of a thermal tolerance polygon, revealing the intrinsic (7.9 to 16.8°C) and acquired (3.4 and 22.8°C) thermal tolerance zones of ballan wrasse. This provides insights into a potential threshold temperature of around 8°C that triggers winter dormancy in this species. Thermal conditions during hatchery production of ballan wrasse should be kept well above this threshold so as not to trigger dormancy and disrupt feeding activity and growth. To address the issue associated with poor delousing activity of ballan wrasse in winter during deployment in salmon cage, genetic selection for low temperature-tolerance must be pursued. In terms of the underlying gill transcriptome response, acclimation to different temperatures led to global shifts in the gill transcriptome profile of ballan wrasse. Moreover, acclimation to different temperatures alters the DEGs and enriched GO terms in response to CTmax and CTmin strongly suggesting that molecular response strategies of ballan wrasse to environmental stimuli during deployment in cages vary depending on seasonal in ambient temperature. New insights into the thermal physiology of ballan wrasse are directly relevant to both wild and farmed populations deployed in salmon farms across Europe, highlighting seasonal differences in welfare, condition, behaviour, and delousing efficacy.
The data presented in the study are deposited in the European Bioinformatics Institute repository, study accession number PRJEB61459.
The animal study was approved by Animal Welfare and Ethical Review Body, University of Stirling. The study was conducted in accordance with the local legislation and institutional requirements.
PAP: Conceptualization, Data curation, Formal analysis, Investigation, Writing – original draft. MB: Data curation, Formal analysis, Software, Supervision, Writing – review & editing. APG: Conceptualization, Funding acquisition, Project administration, Supervision, Writing – review & editing. EJCA: Formal analysis, Software, Visualization, Writing – review & editing. HM: Conceptualization, Funding acquisition, Project administration, Writing – review & editing. MBB: Formal analysis, Project administration, Supervision, Writing – review & editing.
The author(s) declare financial support was received for the research, authorship, and/or publication of this article. This study was funded by Innovate UK (KTP12430 - ballan wrasse broodstock project). PAP was supported by EASTBIO DTP.
The authors would like to thank Chessor Matthew, Alan Anderson, John Arthur, and the staff of Marine Environmental Research Laboratory in Machrihanish for their assistance during the conduct of the fish trial. The authors also thank Dr. Eduardo Jiménez Fernández for his assistance in acquiring the experimental animals.
The authors declare that the research was conducted in the absence of any commercial or financial relationships that could be construed as a potential conflict of interest.
The author(s) declare that no Generative AI was used in the creation of this manuscript.
All claims expressed in this article are solely those of the authors and do not necessarily represent those of their affiliated organizations, or those of the publisher, the editors and the reviewers. Any product that may be evaluated in this article, or claim that may be made by its manufacturer, is not guaranteed or endorsed by the publisher.
The Supplementary Material for this article can be found online at: https://www.frontiersin.org/articles/10.3389/fmars.2024.1507994/full#supplementary-material
Supplementary Data SHEET 1 | Complete list of DEGs in response to CTmax and CTmin following acclimation at different temperatures.
Amaral I. P. G., Johnston I. A. (2012). Circadian expression of clock and putative clock-controlled genes in skeletal muscle of the zebrafish. Am. J. Physiology-Regulatory Integr. Comp. Physiol. 302, R193–R206. doi: 10.1152/ajpregu.00367.2011
Armstrong J. B., Schindler D. E., Ruff C. P., Brooks G. T., Bentley K. E., Torgersen C. E. (2013). Diel horizontal migration in streams: Juvenile fish exploit spatial heterogeneity in thermal and trophic resources. Ecology 94, 2066–2075. doi: 10.1890/12-1200.1
Becker C. D., Genoway R. G. (1979). Evaluation of the critical thermal maximum for determining thermal tolerance of freshwater fish. Environ. Biol. Fish 4, 245–256. doi: 10.1007/BF00005481
Beitinger T. L., Bennett W. A. (2000). Quantification of the role of acclimation temperature in temperature tolerance of fishes. Environ. Biol. Fish. 58, 277–288. doi: 10.1023/A:1007618927527
Beitinger T. L., Lutterschmidt W. I. (2011). “Temperature - Measures of Thermal Tolerance,” in Encyclopedia of Fish Physiology (USA: Elsevier), 1695–1702. doi: 10.1016/B978-0-12-374553-8.00200-8
Brooker A. J., Papadopoulou A., Gutierrez C., Rey S., Davie A., Migaud H. (2018). Sustainable production and use of cleaner fish for the biological control of sea lice: recent advances and current challenges. Vet. Rec. 183, 383–383. doi: 10.1136/vr.104966
Calado R., Mota V. C., Madeira D., Leal M. C. (2021). Summer is coming! Tackling ocean warming in Atlantic salmon cage farming. Animals 11, 1800. doi: 10.3390/ani11061800
Chen S., Zhou Y., Chen Y., Gu J. (2018). fastp: an ultra-fast all-in-one FASTQ preprocessor. Bioinformatics 34, i884–i890. doi: 10.1093/bioinformatics/bty560
Daane J. M., Auvinet J., Stoebenau A., Yergeau D., Harris M. P., Detrich H. W. (2020). Developmental constraint shaped genome evolution and erythrocyte loss in Antarctic fishes following paleoclimate change. PloS Genet. 16, e1009173. doi: 10.1371/journal.pgen.1009173
Desforges J. E., Birnie-Gauvin K., Jutfelt F., Gilmour K. M., Eliason E. J., Dressler T. L., et al. (2023). The ecological relevance of critical thermal maxima methodology for fishes. J. Fish Biol. 102, 1000–1016. doi: 10.1111/jfb.15368
Dipper F. A., Bridges C. R., Menz A. (1977). Age, growth and feeding in the ballan wrasse Labrus bergylta Ascanius 1767. J. Fish Biol. 11, 105–120. doi: 10.1111/j.1095-8649.1977.tb04103.x
Elliott J. M. (1991). Tolerance and resistance to thermal stress in juvenile Atlantic salmon, Salmo salar. Freshw. Biol. 25, 61–70. doi: 10.1111/j.1365-2427.1991.tb00473.x
Elliott J. M., Klemetsen A. (2002). The upper critical thermal limits for alevins of Arctic charr from a Norwegian lake north of the Arctic circle. J. Fish Biol. 60, 1338–1341. doi: 10.1111/j.1095-8649.2002.tb01727.x
Eme J., Bennett W. A. (2009). Critical thermal tolerance polygons of tropical marine fishes from Sulawesi, Indonesia. J. Thermal Biol. 34, 220–225. doi: 10.1016/j.jtherbio.2009.02.005
Farrell A. P. (2009). Environment, antecedents and climate change: lessons from the study of temperature physiology and river migration of salmonids. J. Exp. Biol. 212, 3771–3780. doi: 10.1242/jeb.023671
Freitas C., Villegas-Ríos D., Moland E., Olsen E. M. (2021). Sea temperature effects on depth use and habitat selection in a marine fish community. J. Anim. Ecol. 90, 1787–1800. doi: 10.1111/1365-2656.13497
Frøland Steindal I. A., Whitmore D. (2019). Circadian Clocks in Fish—What Have We Learned so far? Biology 8, 17. doi: 10.3390/biology8010017
Geitung L., Wright D. W., Oppedal F., Stien L. H., Vågseth T., Madaro A. (2020). Cleaner fish growth, welfare and survival in Atlantic salmon sea cages during an autumn-winter production. Aquaculture 528, 735623. doi: 10.1016/j.aquaculture.2020.735623
Guderley H., Johnston I. A. (1996). Plasticity of fish muscle mitochondria with thermal acclimation. J. Exp. Biol. 199, 1311–1317. doi: 10.1242/jeb.199.6.1311
Hu P., Liu M., Liu Y., Wang J., Zhang D., Niu H., et al. (2016). Transcriptome comparison reveals a genetic network regulating the lower temperature limit in fish. Sci. Rep. 6, 28952. doi: 10.1038/srep28952
Huntingford F., Rey S., Quaggiotto M.-M. (2020). Behavioural fever, fish welfare and what farmers and fishers know. Appl. Anim. Behav. Sci. 231, 105090. doi: 10.1016/j.applanim.2020.105090
Hvas M., Folkedal O., Imsland A., Oppedal F. (2017). The effect of thermal acclimation on aerobic scope and critical swimming speed in Atlantic salmon Salmo salar. J. Exp. Biol. 220, 2757–2764. doi: 10.1242/jeb.154021
Hvas M., Folkedal O., Imsland A., Oppedal F. (2018). Metabolic rates, swimming capabilities, thermal niche and stress response of the lumpfish, Cyclopterus lumpus. Biol. Open 7, 036079. doi: 10.1242/bio.036079
Jeffries K. M., Hinch S. G., Sierocinski T., Pavlidis P., Miller K. M. (2014). Transcriptomic responses to high water temperature in two species of Pacific salmon. Evol. Appl. 7, 286–300. doi: 10.1111/eva.12119
Jiang L., Cheng A., Wang Y., Zhang B. (2013). Genomic and expression analysis of a solute carrier protein (CcSLC25a5) gene from Cyprinus carpio Linnaeus. SpringerPlus 2, 458. doi: 10.1186/2193-1801-2-458
Kassahn K. S., Crozier R. H., Pörtner H. O., Caley M. J. (2009). Animal performance and stress: responses and tolerance limits at different levels of biological organisation. Biol. Rev. 84, 277–292. doi: 10.1111/j.1469-185X.2008.00073.x
Kim D., Paggi J. M., Park C., Bennett C., Salzberg S. L. (2019). Graph-based genome alignment and genotyping with HISAT2 and HISAT-genotype. Nat. Biotechnol. 37, 907–915. doi: 10.1038/s41587-019-0201-4
Komoroske L. M., Jeffries K. M., Whitehead A., Roach J. L., Britton M., Connon R. E., et al. (2021). Transcriptional flexibility during thermal challenge corresponds with expanded thermal tolerance in an invasive compared to native fish. Evol. Appl. 14, 931–949. doi: 10.1111/eva.13172
Kottmann J. S., Berge G. M., Kousoulaki K., Østbye T. K., Ytteborg E., Gjerde B., et al. (2023). Welfare and performance of ballan wrasse (Labrus bergylta) reared at two different temperatures after a preparatory feeding trial with enhanced dietary eicosapentaenoic acid. J. Fish Biol. 103, 906–923. doi: 10.1111/jfb.15482
Lee S., Hung S. S. O., Fangue N. A., Haller L., Verhille C. E., Zhao J., et al. (2016). Effects of feed restriction on the upper temperature tolerance and heat shock response in juvenile green and white sturgeon. Comp. Biochem. Physiol. Part A: Mol. Integr. Physiol. 198, 87–95. doi: 10.1016/j.cbpa.2016.04.016
Li P., Liu Q., Li J., Wang F., Wen S., Li N. (2021). Transcriptomic responses to heat stress in gill and liver of endangered Brachymystax lenok tsinlingensis. Comp. Biochem. Physiol. Part D: Genomics Proteomics 38, 100791. doi: 10.1016/j.cbd.2021.100791
Li X., Lu Y.-C., Dai K., Torregroza I., Hla T., Evans T. (2014). Elavl1a regulates zebrafish erythropoiesis via posttranscriptional control of gata1. Blood 123, 1384–1392. doi: 10.1182/blood-2013-09-526962
Liao E. C., Paw B. H., Peters L. L., Zapata A., Pratt S. J., Do C. P., et al. (2000). Hereditary spherocytosis in zebrafish riesling illustrates evolution of erythroid β-spectrin structure, and function in red cell morphogenesis and membrane stability. Development 127, 5123–5132. doi: 10.1242/dev.127.23.5123
Logan C. A., Buckley B. A. (2015). Transcriptomic responses to environmental temperature in eurythermal and stenothermal fishes. J. Exp. Biol. 218, 1915–1924. doi: 10.1242/jeb.114397
Logan C. A., Somero G. N. (2011). Effects of thermal acclimation on transcriptional responses to acute heat stress in the eurythermal fish Gillichthys mirabilis (Cooper). Am. J. Physiology-Regulatory Integr. Comp. Physiol. 300, R1373–R1383. doi: 10.1152/ajpregu.00689.2010
Long Y., Yan J., Song G., Li X., Li X., Li Q., et al. (2015). Transcriptional events co-regulated by hypoxia and cold stresses in Zebrafish larvae. BMC Genomics 16, 385. doi: 10.1186/s12864-015-1560-y
Manzon L. A., Zak M. A., Agee M., Boreham D. R., Wilson J. Y., Somers C. M., et al. (2022). Thermal acclimation alters both basal heat shock protein gene expression and the heat shock response in juvenile lake whitefish (Coregonus clupeaformis). J. Thermal Biol. 104, 103185. doi: 10.1016/j.jtherbio.2021.103185
Morel G. M., Shrives J., Bossy S. F., Meyer C. G. (2013). Residency and behavioural rhythmicity of Ballan wrasse (Labrus bergylta) and rays (Raja spp.) captured in Portelet Bay, Jersey: implications for Marine Protected Area design. J. Mar. Biol. Ass. 93, 1407–1414. doi: 10.1017/S0025315412001725
Moyano M., Candebat C., Ruhbaum Y., Álvarez-Fernández S., Claireaux G., Zambonino-Infante J.-L., et al. (2017). Effects of warming rate, acclimation temperature and ontogeny on the critical thermal maximum of temperate marine fish larvae. PloS One 12, e0179928. doi: 10.1371/journal.pone.0179928
Palma P. A., Lwin S. S., Jimenez-Fernandez E., Perschthaler J. H., Baily J. L., Gutierrez A. P. (2023). Insights into the early gonad development of the protogynous ballan wrasse (Labrus bergylta). Aquacult Rep. 33, 101857. doi: 10.1016/j.aqrep.2023.101857
Petitjean Q., Jean S., Gandar A., Côte J., Laffaille P., Jacquin L. (2019). Stress responses in fish: From molecular to evolutionary processes. Sci. Total Environ. 684, 371–380. doi: 10.1016/j.scitotenv.2019.05.357
Pottier P., Burke S., Drobniak S. M., Lagisz M., Nakagawa S. (2021). Sexual (in)equality? A meta-analysis of sex differences in thermal acclimation capacity across ectotherms. Funct. Ecol. 35, 2663–2678. doi: 10.1111/1365-2435.13899
Rebl A., Verleih M., Köbis J. M., Kühn C., Wimmers K., Köllner B., et al. (2013). Transcriptome profiling of gill tissue in regionally bred and globally farmed rainbow trout strains reveals different strategies for coping with thermal stress. Mar. Biotechnol. 15, 445–460. doi: 10.1007/s10126-013-9501-8
Reeve C., Rowsey L. E., Speers-Roesch B. (2022). Inactivity and the passive slowing effect of cold on resting metabolism as the primary drivers of energy savings in overwintering fishes. J. Exp. Biol. 225, 243407. doi: 10.1242/jeb.243407
Rodgers E. M., Todgham A. E., Connon R. E., Fangue N. A. (2019). Stressor interactions in freshwater habitats: Effects of cold water exposure and food limitation on early-life growth and upper thermal tolerance in white sturgeon, Acipenser transmontanus. Freshw. Biol. 64, 348–358. doi: 10.1111/fwb.13224
Schulte P. M. (2011). “Temperature: Effects of Temperature: An Introduction,” in Encyclopedia of Fish Physiology (USA: Elsevier), 1688–1694. doi: 10.1016/B978-0-12-374553-8.00159-3
Skiftesvik A. B., Durif C. M. F., Bjelland R. M., Browman H. I. (2015). Distribution and habitat preferences of five species of wrasse (Family Labridae) in a Norwegian fjord. ICES J. Mar. Sci. 72, 890–899. doi: 10.1093/icesjms/fsu211
Soyano K., Mushirobira Y. (2018). “The mechanism of low-temperature tolerance in fish,” in Survival Strategies in Extreme Cold and Desiccation. Eds. Iwaya-Inoue M., Sakurai M., Uemura M. (Springer Singapore, Singapore), 149–164. doi: 10.1007/978-981-13-1244-1_9
Treasurer J. W. (2002). A review of potential pathogens of sea lice and the application of cleaner fish in biological control. Pest Manage. Sci. 58, 546–558. doi: 10.1002/ps.509
Villegas-Ríos D., Alós J., March D., Palmer M., Mucientes G., Saborido-Rey F. (2013). Home range and diel behavior of the ballan wrasse, Labrus bergylta, determined by acoustic telemetry. J. Sea Res. 80, 61–71. doi: 10.1016/j.seares.2013.02.009
Yuen J. W., Dempster T., Oppedal F., Hvas M. (2019). Physiological performance of ballan wrasse (Labrus bergylta) at different temperatures and its implication for cleaner fish usage in salmon aquaculture. Biol. Control 135, 117–123. doi: 10.1016/j.biocontrol.2019.05.007
Keywords: cleaner fish, ballan wrasse, thermal tolerance, acclimation, transcriptome, plasticity
Citation: Palma PA, Bekaert M, Gutierrez AP, Abacan EJC, Migaud H and Betancor MB (2025) Plasticity of thermal tolerance and associated gill transcriptome in ballan wrasse (Labrus bergylta). Front. Mar. Sci. 11:1507994. doi: 10.3389/fmars.2024.1507994
Received: 08 October 2024; Accepted: 03 December 2024;
Published: 06 January 2025.
Edited by:
Anthony (Tony) John Hickey, The University of Auckland, New ZealandReviewed by:
Sofia Priyadarsani Das, National Taiwan Ocean University, TaiwanCopyright © 2025 Palma, Bekaert, Gutierrez, Abacan, Migaud and Betancor. This is an open-access article distributed under the terms of the Creative Commons Attribution License (CC BY). The use, distribution or reproduction in other forums is permitted, provided the original author(s) and the copyright owner(s) are credited and that the original publication in this journal is cited, in accordance with accepted academic practice. No use, distribution or reproduction is permitted which does not comply with these terms.
*Correspondence: Peter Almaiz Palma, p.a.palma@stir.ac.uk; peteralmaizpalma@gmail.com
†Present address: Michaël Bekaert, Cooke Aquaculture Scotland, Bellshill, United Kingdom Alejandro P. Gutierrez, The Center for Aquaculture Technologies, San Diego, CA, United States Herve Migaud, Mowi Scotland, Fort William, United Kingdom
Disclaimer: All claims expressed in this article are solely those of the authors and do not necessarily represent those of their affiliated organizations, or those of the publisher, the editors and the reviewers. Any product that may be evaluated in this article or claim that may be made by its manufacturer is not guaranteed or endorsed by the publisher.
Research integrity at Frontiers
Learn more about the work of our research integrity team to safeguard the quality of each article we publish.