
94% of researchers rate our articles as excellent or good
Learn more about the work of our research integrity team to safeguard the quality of each article we publish.
Find out more
ORIGINAL RESEARCH article
Front. Mar. Sci. , 05 June 2024
Sec. Marine Biogeochemistry
Volume 11 - 2024 | https://doi.org/10.3389/fmars.2024.1395799
 Melanie R. Cohn1Brandon M. Stephens2†Meredith G. Meyer1Garrett Sharpe1Alexandria K. Niebergall3Jason R. Graff4Nicolas Cassar3Adrian Marchetti1Craig A. Carlson2Scott M. Gifford1*
Microbial respiration is a critical component of the marine carbon cycle, determining the proportion of fixed carbon that is subject to remineralization as opposed to being available for export to the ocean depths. Despite its importance, methodological constraints have led to an inadequate understanding of this process, especially in low-activity oligotrophic and mesopelagic regions. Here, we quantify respiration rates as low as 0.2 µmol O2 L-1 d-1 in contrasting ocean productivity provinces using oxygen optode sensors to identify size-fractionated respiration trends. In the low productivity region of the North Pacific Ocean at Station Papa, surface whole water microbial respiration was relatively stable at 1.2 µmol O2 L-1 d-1. Below the surface, there was a decoupling between respiration and bacterial production that coincided with increased phytodetritus and small phytoplankton. Size-fractionated analysis revealed that cells <5 µm were responsible for the majority of the respiration in the Pacific, both at the surface and below the mixed layer. At the North Atlantic Porcupine Abyssal Plain, surface whole water microbial respiration was higher (1.7 µmol O2 L-1 d-1) than in the Pacific and decreased by 3-fold below the euphotic zone. The Atlantic size-fraction contributions to total respiration shifted on the order of days during the evolution of a phytoplankton bloom with regular storm disturbances. The high-resolution optode method used in the Atlantic captured these significant shifts and is consistent with coinciding stain-based respiration methods and historical site estimates. This study highlights the dynamic nature of respiration across vertical, temporal, and size-fractionated factors, emphasizing the need for sensitive, high-throughput techniques to better understand ocean ecosystem metabolism.
Aerobic respiration is a crucial process in which organic carbon is oxidized to fuel metabolism, transforming the carbon pool and generating carbon dioxide (CO2). In the ocean, up to half of all phytoplankton-derived organic matter is respired by heterotrophic bacteria (Williams, 1984), which reduces carbon export potential (Azam et al., 1983; Moran et al., 2022). Despite its importance, respiration rates in the ocean are poorly constrained due to under-sampling and methodological limitations, reducing the accuracy of biogeochemical models (Pomeroy et al., 1995; del Giorgio and Duarte, 2002; Robinson, 2019).
Most respiration rate assays rely on measuring the consumption of oxygen (O2) over time. The accuracy of oceanic O2 consumption measurements is hindered by the relatively minor O2 depletion (usually <1 µmol L-1) against the substantial background levels in seawater (c.a. 200 to 300 µmol L-1). Further, low oceanic metabolic rates require longer incubation periods (>24 h) to detect a measurable change in O2 concentration, during which time the microbial processes within the sample may deviate from the environment (Ducklow and Doney, 2013). As a result, most oceanic respiration assays rely on gathering a few highly precise O2 measurements at the cost of sample resolution. Winkler titrations obtain accurate and precise dissolved O2 measurements, but they are time-consuming, destructive to the sample, and resource intensive. Alternatives to the O2-based assays, including respiratory stains such as in vivo 2-para-(iodophenyl)-3(nitrophenyl)-5(phenyl) tetrazolium chloride (INT) measure activity of the electron transport system which can yield highly precise and sensitive measures of respiration without a long incubation period (Griffith, 1988), but are still time and wet-lab resource intensive with limited sample throughput. While environmental and culture studies find the INT method to be representative of marine plankton respiration (García-Martín et al., 2019b and García-Martín et al., 2019c), other studies caution that INT may underestimate respiration due to toxicity effects (Villegas-Mendoza et al., 2015; Baños et al., 2020).
Optode assays are an increasingly common method to determine dissolved O2 concentrations for respiration and net community production in marine environments. In such assays, a commercially available optode “sensor spot” is excited with blue/green light. Oxygen disrupts the excitation reaction, thus the fluorescence of the spot can be related to the O2 concentration of the sample (Vandermeulen and Chaves, 2022). Previous applications of optode assays in oceanic systems have been largely limited to resolving rates >1 µmol O2 L-1 d-1 without concentrating environmental samples (Pomeroy and Johannes, 1966; Griffith, 1988; del Giorgio and Williams, 2005). More recently, Edwards et al. (2011) reliably measured rates <1 µmol O2 L-1 d-1 using O2 optodes and incubation assays in oligotrophic waters. Wikner et al. (2013) expanded on this, increasing optode detection limits three-fold, comparable to Winkler titrations. The use of optodes is promising, as they are sensitive, easy to use, and capable of rapid, frequent point measurements (on the order of seconds). Rather than taking relatively few point measurements hours apart, hundreds of measurements can be made through high-temporal resolution assays with the potential to resolve pelagic respiration rates in shorter incubations (Chen et al., 2023). Recent efforts are moving towards higher sample throughput and measurement resolution with automated systems such as the AutoBOD (Stephens et al., 2023b). With improved sample throughput and coverage, optical methods have the potential to address current methodological limitations and provide needed insight into the critical role of microbial respiration in global, oceanic carbon cycling (Edwards et al., 2011; Martínez-García and Karl, 2015; Robinson, 2019).
Developing models of oceanic metabolism hinges on the accurate segregation of metabolic processes across the marine food web (McNair et al., 2023). For respiration, this is most often accomplished by physical size-fractionation, in which O2 consumption is measured for a series of microbial size classes. These size classes often include a whole water fraction representing the total microbial community; the small (<5 µm) containing large particles, phytoplankton, and bacterioplankton; micro (<3 µm) containing pico-eukaryotes, particle-associated, and free-living bacteria; and the nano (<1.2 µm) fraction contains free-living bacteria and some pico-eukaryotes. These measurements are often nested, with each size class containing the organisms of the smaller classes within it.
Size-fractionation, while crucial for assessing the contributions of various food web components to community respiration (Griffith, 1988; McNair et al., 2021; Guo et al., 2022), has its limitations. These include reducing grazing pressure and failing to accurately delineate trophic levels, such as primary producers and consumers. Moreover, size-fractionation and small-volume incubations may introduce biases by excluding community interactions and top-down pressures. This can impact microbial growth, the release of organic carbon by grazers, and metabolic rates. Nonetheless, size-fractionation has been pivotal in highlighting the significant role of microbes in oceanic systems (Pomeroy, 1974). Despite its importance, the labor-intensive nature of existing respiration measurement techniques often limits the ability to conduct extensive size-fractionated assays.
In this study, we evaluated size-fractionated microbial respiration rates in two contrasting oceanic regions using O2 consumption assays and optode measurements: the low productivity and low carbon export area of the North Pacific Ocean at Station Papa (Wong et al., 1995; Boyd and Harrison, 1999; Meyer et al., 2022), and the high productivity North Atlantic Porcupine Abyssal Plain (PAP) (Fasham et al., 1999; Frigstad et al., 2015; Meyer et al., 2023). For the N. Pacific, respiration rates were determined using a single, manually applied fiber optic cable to obtain optode readings. In contrast, in the N. Atlantic, we enhanced the methodology by attaching the optode fiber optical cables directly to the Biological Oxygen Demand (BOD) bottles. This adjustment increased the frequency of O2 measurements by three orders of magnitude. This research is part of the EXport Processes in the Ocean from RemoTe Sensing (EXPORTS) program, which investigates ocean metabolism and export potential at opposing ends of the productivity-export spectrum (Siegel et al., 2016, 2021). Our findings underscore the effectiveness of optodes and incubation assays in accurately determining respiration rates in pelagic ecosystems while reducing the need for extensive ship-board labor. The results highlight differences in size-fractionation of sample microbial communities and their contributions to total respiration, both between surface and sub-euphotic zones and across different oceanic provinces.
Samples were collected in the N. Pacific at Ocean Station Papa (Station P; 50° N and 145° W) from August 8 to September 3, 2018 aboard the R/V Roger Revelle (RR1813) and in the N. Atlantic at PAP (49° N, 15° W) from May 5 to 31, 2021 aboard the RRS James Cook (JC214) (Figure 1) while following Lagrangian floats (Siegel et al., 2021; Johnson et al., 2023). Sample water was collected from 10-L Go-Flow (N. Pacific) or 20-L Niskin (N. Atlantic) bottles attached to a CTD rosette directly into 1-L polycarbonate bottles (acid-washed with 10% HCl). Rosette casts were deployed between 2 to 5 am GMT in the N. Atlantic and variable times in the N. Pacific. At a minimum for each sampling cast, a “surface” depth (<10 m in the N. Pacific; 5 m in the N. Atlantic) was collected. In the N. Pacific, depth profiles to 200 m were opportunistically taken, and in the N. Atlantic, a “sub-euphotic” depth (collection depth of 75 m or 95 m; euphotic zone range of 1% surface irradiance from 37 to 59 m) near the base of the mixed layer (range 15 m to 197 m, 0.03 kg m-3 potential density differential) were collected (Johnson et al., 2023). Additional physical context methodology is referenced in the ancillary data below.
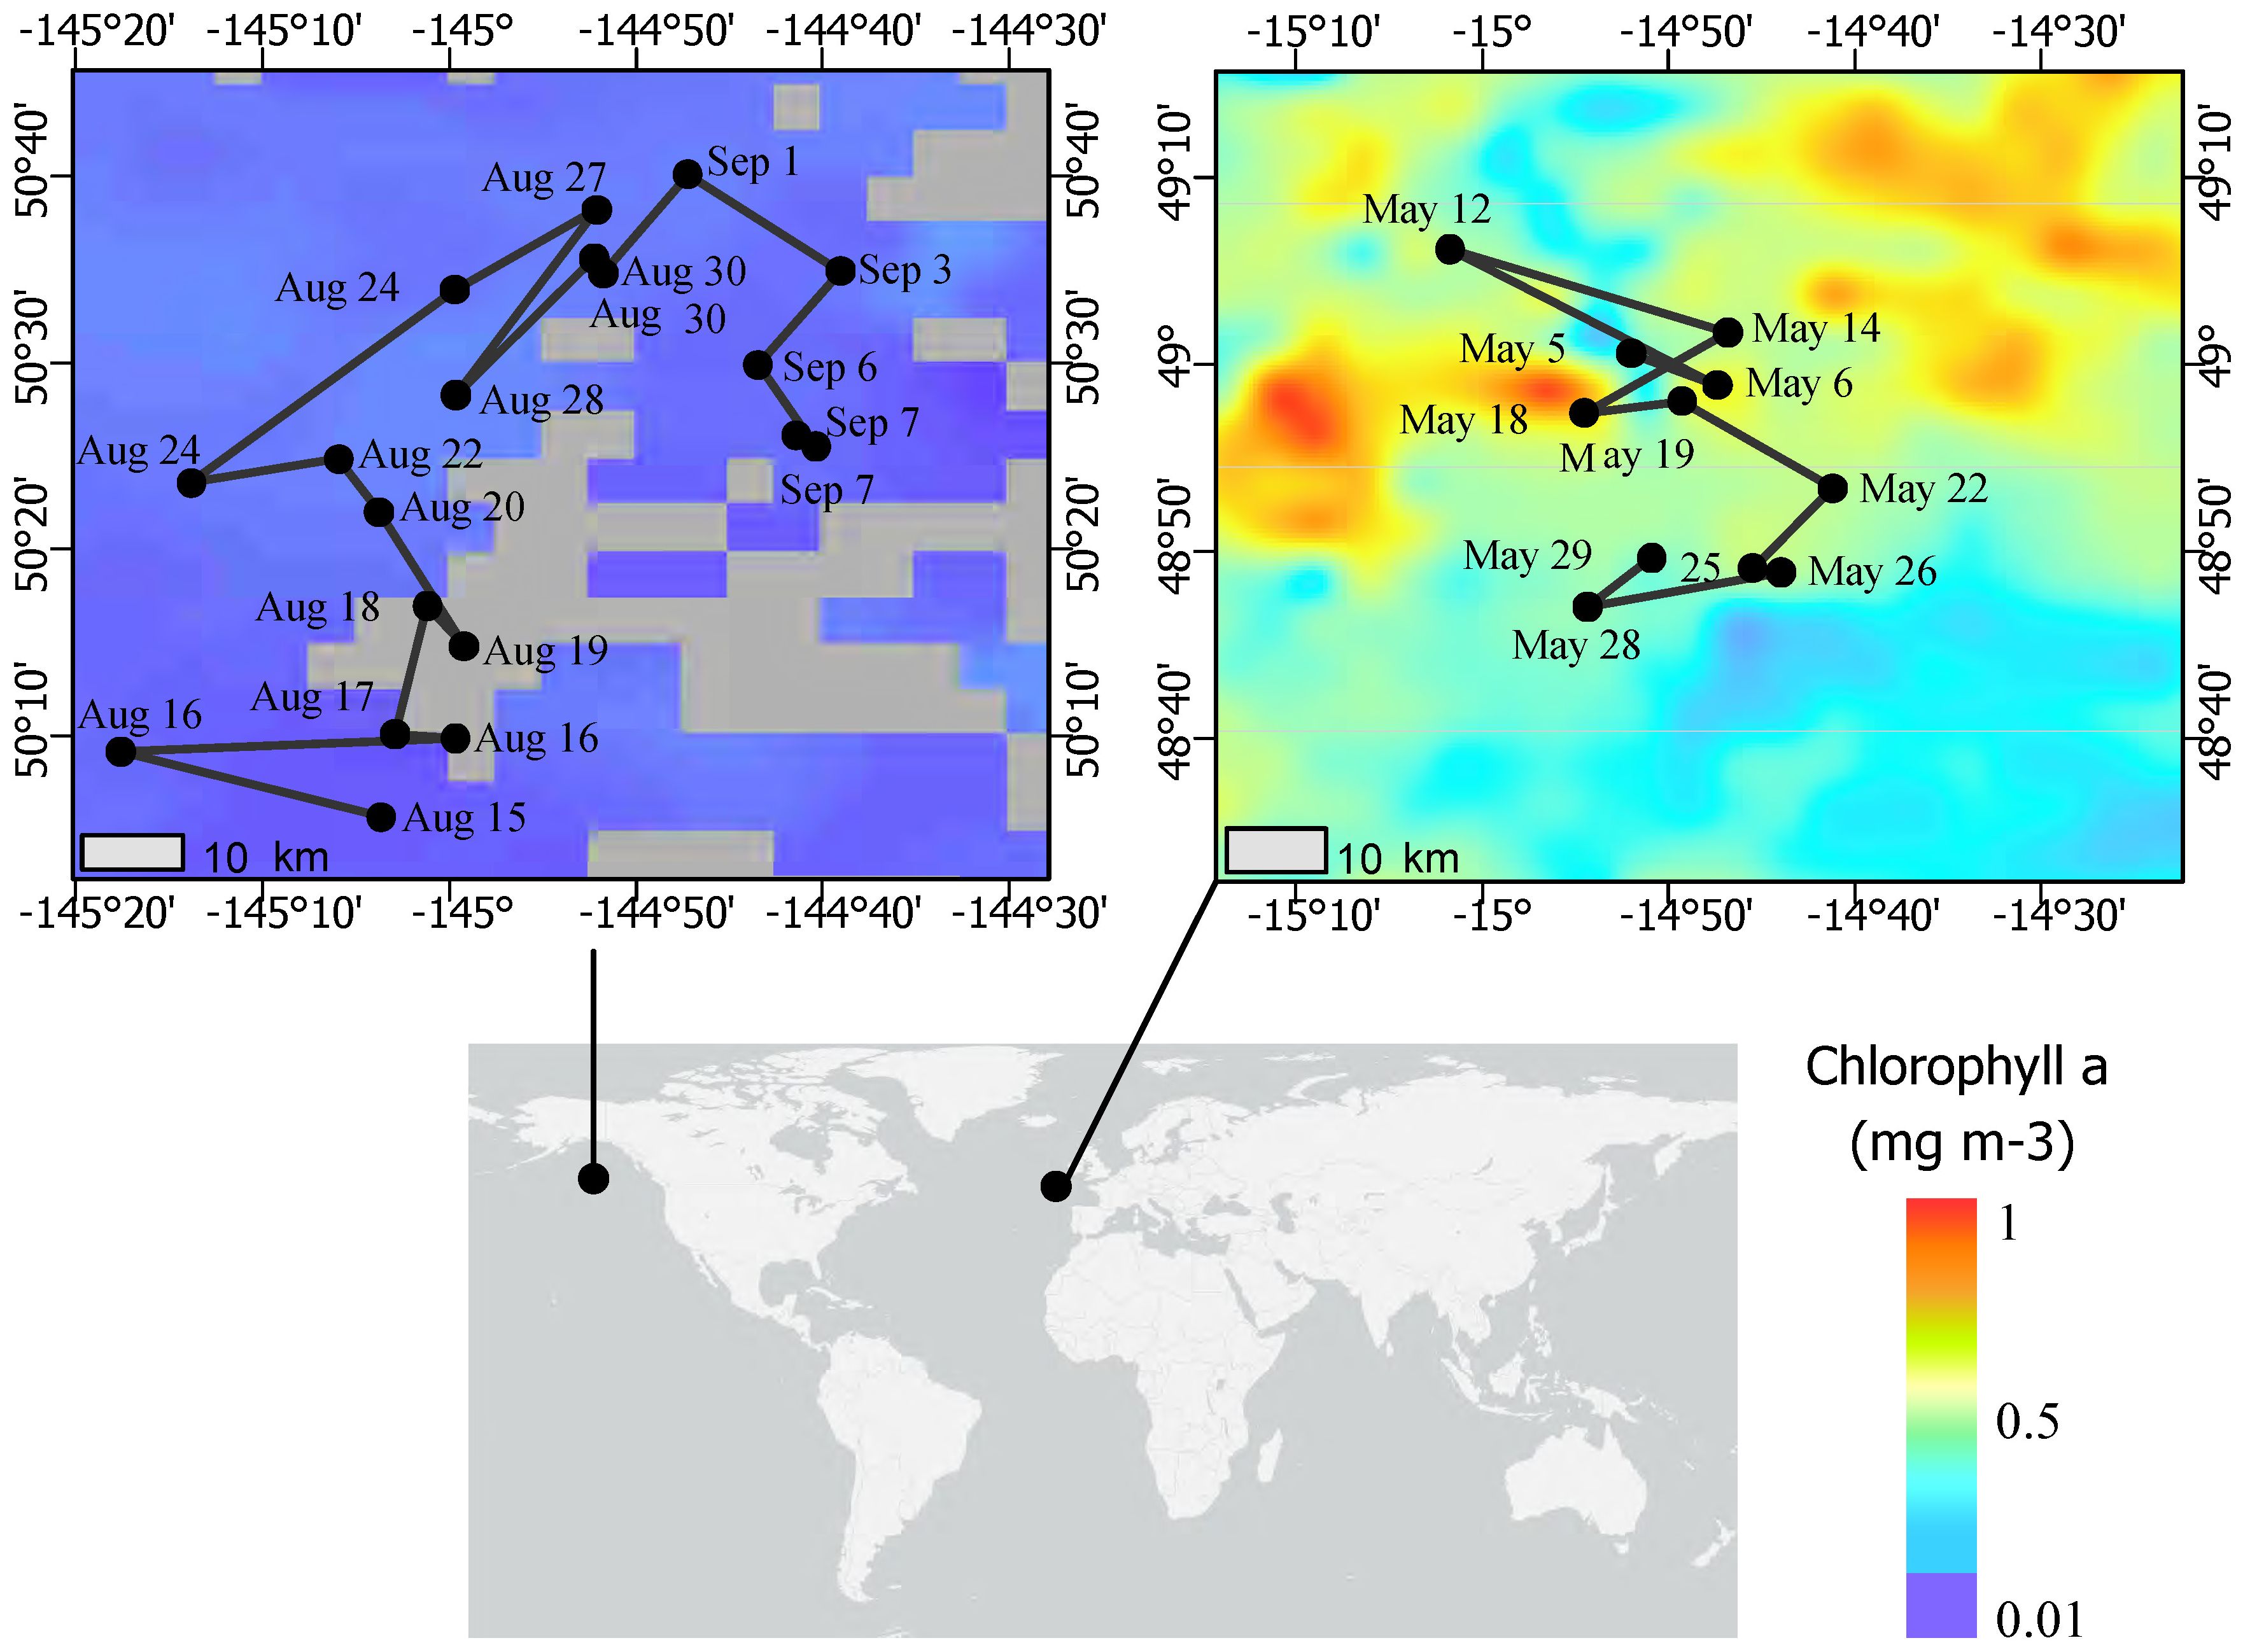
Figure 1 Map of EXPORTS field campaigns for August 2018 at Ocean Station Papa and May 2021 at the Porcupine Abyssal Plain. Sampling dates are labeled on the Lagrangian (Pacific) and quasi-Lagrangian (Atlantic) cruise tracks. The color scale depicts the monthly average of chlorophyll a at each site during the occupation period (NASA MODIS-Aqua, 2018, 2021; https://oceancolor.gsfc.nasa.gov/l3/).
Whole or size-fractionated seawater incubations were performed in 60-mL glass BOD bottles with O2 sensor spots (SP-PSt-3-NAU, PreSens) mounted to the interior of the bottle wall. The BOD bottles were washed with 5% HCl for 3–6 h and triple rinsed with 18.2 MΩ Milli-Q water before use. For size-fractionation, seawater samples were poured from the collection bottle into acid-washed polycarbonate filter towers. The tower and filter were rinsed with 100 mL of seawater sample, which was gravity filtered, using gentle (>-5 in Hg) vacuum pressure to dry the filter between rinses to help avoid contamination from unfiltered droplets during the sample transfer. The rinsate was discarded, and then 300 mL of the sample was similarly filtered. Size fractions in the N. Pacific included an unfiltered fraction for community respiration and <5 µm small plankton respiration (polycarbonate, Millipore Sigma). The N. Atlantic had these fractions, as well as <3 µm microplankton and <1.2 µm nanoplankton respiration fractions (polycarbonate, Millipore Sigma). The BOD bottles were then filled with either unfiltered or size-fractionated seawater samples by first triple rinsing with c.a. 20 mL of sample water poured directly from the collection bottle (unfiltered) or filter tower (size-fractionated) and overfilled. Bubbles were removed from the BOD bottle over one minute by gently tapping the side, then the bottle was capped with an air-tight glass stopper and carefully inspected for any bubbles.
The BODs were submerged in a dark, temperature-controlled water bath at c.a. in situ temperature for incubation. Incubation times ranged from 16 to 72 h based on detecting a robust decrease in O2 concentration (Vandermeulen and Chaves, 2022). In the N. Pacific, O2 measurements were made non-invasively through the bottle wall at 4 h intervals by manually holding the optical fiber to the BOD wall at the sensor spot (OXY1-SMA, PreSens). The N. Pacific average incubation time was 38 h with 8 to 10 discrete O2 measurements per assay. Over the 30-day occupation, 214 O2 consumption assays were conducted at Station Papa with 94 unfiltered and small size-fraction assays in the mixed layer (avg. 29 ± 4.5 m) (Siegel et al., 2021). In the N. Atlantic, O2 measurements were acquired continuously every 30 s by directly mounting the polymer optical fibers to the BOD bottles over the sensor spot. Measurements were made with OXY4-SMA (precision ± 1.4 µmol L-1 O2 at 283 µmol L-1 O2; PreSens), with an average incubation time of 30 h and 3,000 discrete O2 measurements per assay, totaling 41 unfiltered and 66 filtered assays. The bottles were inspected at the end of the incubation for bubbles and none were noted.
O2 measurements were automatically temperature- and salinity-corrected using the PreSens Measurement Studio2 based on direct, continuous temperature measurements of the water bath and a defined in situ salinity and pressure (35 psu, 1013 hPa). A Milli-Q control BOD bottle was kept in the water bath for the duration of the cruise as a secondary temperature control and a reference for sensor drift. Further temperature correction of the samples was performed by subtracting the change in O2 concentration of a Milli-Q control bottle from the sample bottles for each point. The corrected sample O2 values were then plotted against incubation time.
For the N. Pacific campaign, only one fiber optic cable was available for reading the optode spots; thus optode measurements were manually acquired from all BOD bottles every few hours, generating relatively few O2 measurements per experiment (n=8 to 20), as is precedent in Winkler assays and prior optode studies (Edwards et al., 2011; Wikner et al., 2013). The O2 consumption rates were calculated as a Model I regression of the measured points, as is standard for O2 consumption assays. Apparent O2 outliers (>1 µmol L-1 O2 difference from the surrounding points) were identified and removed within each assay (avg. 1.2 points removed). Assays with rates <0.2 µmol O2 L-1 d-1 were considered below detection (n=9), and rates greater than 3 µmol O2 L-1 d-1 were considered anomalously high for summer at the N. Pacific site and excluded from analysis (n=3).
In the N. Atlantic, we added 12 more sensor channels and cables, which enabled continuous, operator-independent monitoring for a substantially increased set of point measurements. The first 2.5 h of data were initially removed to compensate for abiotic acclimation of the PSt3 sensor spot and BOD bottles to the water bath conditions. Plots were then visually inspected to trim additional nonlinear components at the beginning or end of the incubation, similar to the effects discussed in Wikner et al. (2013). To calculate the rate over c.a. 3,000 discrete O2 measurements in a single assay, a rolling mean with a window size of 12.5 min was applied to the trimmed data, and a linear regression was calculated based on the rolling mean points. Only for the purpose of comparing respiration rates with other studies was a respiratory quotient of 1.4 O2 to CO2 applied to the O2 measurements. This respiratory quotient was determined experimentally in the N. Atlantic campaign (Stephens et al., 2023b) and matches that used by Sherry et al. (1999) in the N. Pacific.
Respiratory stain (INT) and O2-based incubations were conducted independently on the N. Atlantic expedition and were used here as a check for the optode-derived rates. Sample water for INT incubations was collected at midday casts, whereas O2 consumption samples were collected from pre-dawn rosette casts. For each depth, 3 live samples and 2 poisoned (2 w/v formaldehyde) control incubations were conducted. Following methods detailed by Martínez-García et al. (2009), 8 mmol L-1 INT was added to a final concentration of 0.2 mmol L-1 and incubated in the dark at in situ temperature for 2 h. The samples were then filtered under gentle vacuum pressure through stacked (Sartorius), in-line filters (45 mm 3.0 µm and 47 mm 0.2 µm, polycarbonate, Millipore Sigma) to capture size-fractionated cells. The absorbance of the extracted propanol-formazan solution was measured at 485 nm. Linear regressions of the INT concentrations to absorbance were made using 3 unique 12-point dilution-based standard curves of freshly prepared Fomazan dye (Fisher Scientific) (Supplementary Figure S1). After the killed control INT absorbance was subtracted from the live sample, the absorbance units were converted to INT concentrations using the mean slope measured from the known standards (0.0174 absorbance units per µmol INT L-1). Values were then converted into oxygen units using the previously identified INT to oxygen relationship for samples collected from a nearby site in García-Martín et al. (2019a): Log O2 = 0.80Log(INT) + 0.45. To compare the O2 consumption rates to the INT-derived rates, assays were selected from both methods where sample collection occurred within 16 h of each other.
Care was taken to limit carbon contamination in respiration assays by acid washing and sample water rinsing surfaces, as well as using gravity filtration to reduce cell shear on rinsed filters, with gentle vacuum pressure used to dry the filter. All respiration assays were monitored for anomalously high rates (>3 µmol O2 L-1 d-1). Intermittent samples were collected for total organic carbon (TOC) measurements to monitor for carbon contamination during the sample handling process. Samples were taken directly off the rosette cast and compared to the BOD bottle samples at the start of the respiration incubation assays. TOC was quantified by the high-temperature combustion method as described by Stephens et al. (2020).
Chlorophyll-a and net primary production were performed in the Pacific and N. Atlantic as reported in Meyer et al (Meyer et al., 2022, 2023). Briefly, net primary production (24 h 13C uptake incubation) was estimated based on samples collected at the surface on the same days as respiration assays in the N. Pacific and at the same rosette casts as respiration assays in the N. Atlantic.
Linear regressions were performed on each respiration assay as described above using a general linear regression model (Supplementary Figure S2, Supplementary Figure S3). For the N. Atlantic, the residual standard error (RSE) was calculated across the multiple size fractions and unfiltered samples. One outlier was identified in the sub-euphotic <5 µm fraction using the ROUT method (Q=1%) and removed. Welch’s ANOVA and Dunnett T3 multiple comparisons test (α=0.05) were used to identify significantly different (p<0.001) RSE pairings across size fractions and depth (Supplementary Figure S4, Supplementary Figure S5). Normality was determined using the Shapiro-Wilk test with α=0.05. The test statistic (W) for all size fractions and depths was >0.89, except for the unfiltered sub-euphotic (W=0.76, p=0.001). Thus, normality is assumed for all fractions but deviates slightly for the unfiltered sub-euphotic samples, though they were still best represented by normal distributions. Pearson’s correlation coefficients were calculated on the means and standard deviations of the N. Atlantic biological variables, assuming Gaussian distributions to identify significant relationships (n=8 to 18, p<0.05) (Supplementary Figure S6). In the N. Pacific, unfiltered respiration was compared to coinciding program measurements over a depth profile taken on September 3, 2018. Spearman’s correlation was used with one-tailed p-tests and a 95% confidence interval.
Physical parameters were defined by Siegel et al. (2021) in the N. Pacific and Erickson et al. (2023) and Johnson et al. (2023) in the N. Atlantic. Bacterial abundance was enumerated via epifluorescence, as described in Stephens et al. (2023a). To evaluate bacterial activity, 3H-leucine incorporation rates are used as a proxy for bacterial production (BP) as described by Stephens et al. (2023a). Phytoplankton were enumerated via flow cytometry following Graff and Behrenfeld (2018). Additional ancillary measurements from the EXPORTS program and their respective methods can be found on the NASA SeaBASS data repository (doi:10.5067/SeaBASS/EXPORTS/DATA001).
Station Papa is a high nitrate, low chlorophyll-a region where primary productivity was low and representative of typical conditions during the sampling (Figure 1) (Boyd and Harrison, 1999; Meyer et al., 2022). The mixed layer was shallow, stable, and above the euphotic zone (1% surface irradiance) for the majority of our Lagrangian study (Siegel et al., 2021). Over the 30-day occupation, 214 O2 consumption assays were conducted at Station Papa (Figure 1), with 94 whole water and small (<5 µm) size fraction assays in the mixed layer (avg. depth of 29 ± 4.5 m) (Siegel et al., 2021). Over the two-day assay incubation period, typically 8 to 10 O2 measurements were obtained for each assay by manually holding the optic fiber over the sensor spot. Linear fits of consumption over time were variable, ranging from strong (r2>0.8, n=25), to moderate (r2 = 0.5 to 0.8, n=33), to weak (r2<0.5, n=12) (Figure 2B-D, Supplementary Figure S2). Surface respiration rates averaged 1.2 µmol O2 L-1 d-1 for both the whole water (range 0.34 to 2.25 µmol L-1 O2 d-1) and small fractions (range 0.55 to 2.41 µmol L-1 O2 d-1) and were relatively stable during the study (Figures 2A, 3). The respiration rates often showed no significant statistical difference between size fractions (Figures 2, 3). These rates are similar to the mean 1.56 µmol O2 L-1 d-1 total respiration rate derived from Winkler titrations in the summer of 1997 at Station Papa (Sherry et al., 1999).
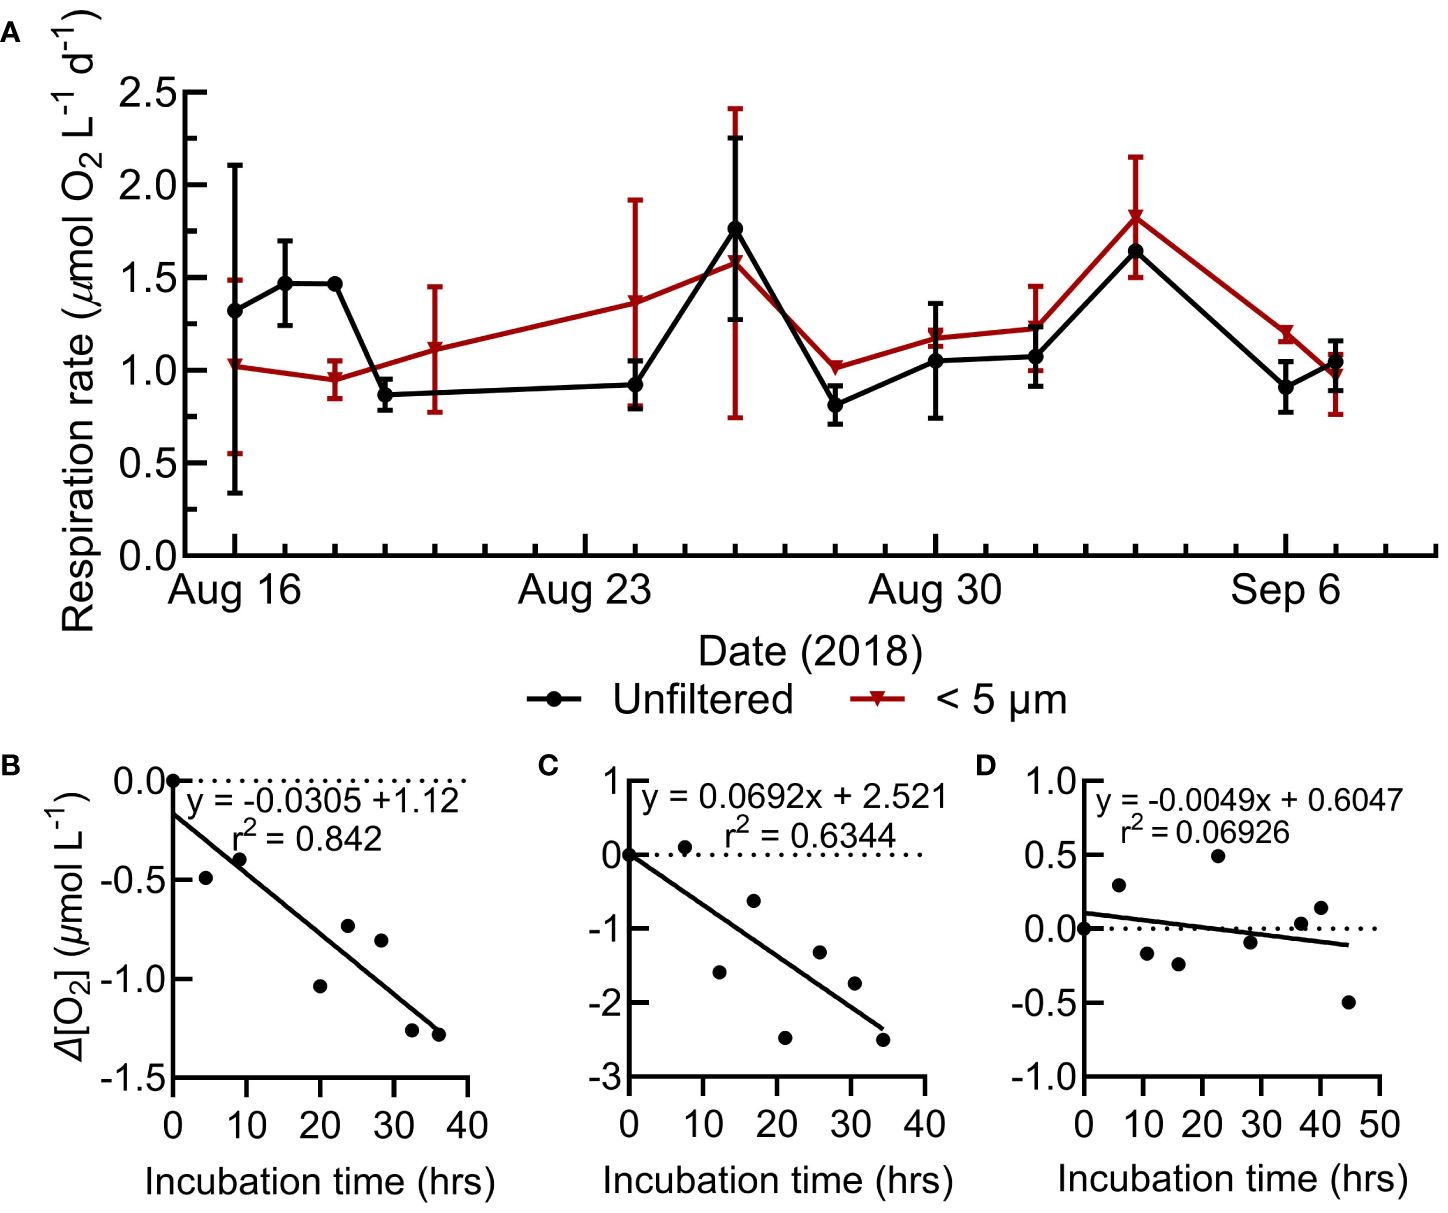
Figure 2 (A) Range of surface respiration rates for the whole water and small size fractions during the N. Pacific sampling. (B-D) Select N. Pacific respiration assays showing the change in O2 concentration during the incubation, representative of strong, moderate, and weak model fits. Model I linear regressions represent the assay’s respiration rate (O2 consumption) and statistics are shown in the upper right of the assay plots. All N. Pacific O2 consumption assays are shown in Supplementary Figure S1.
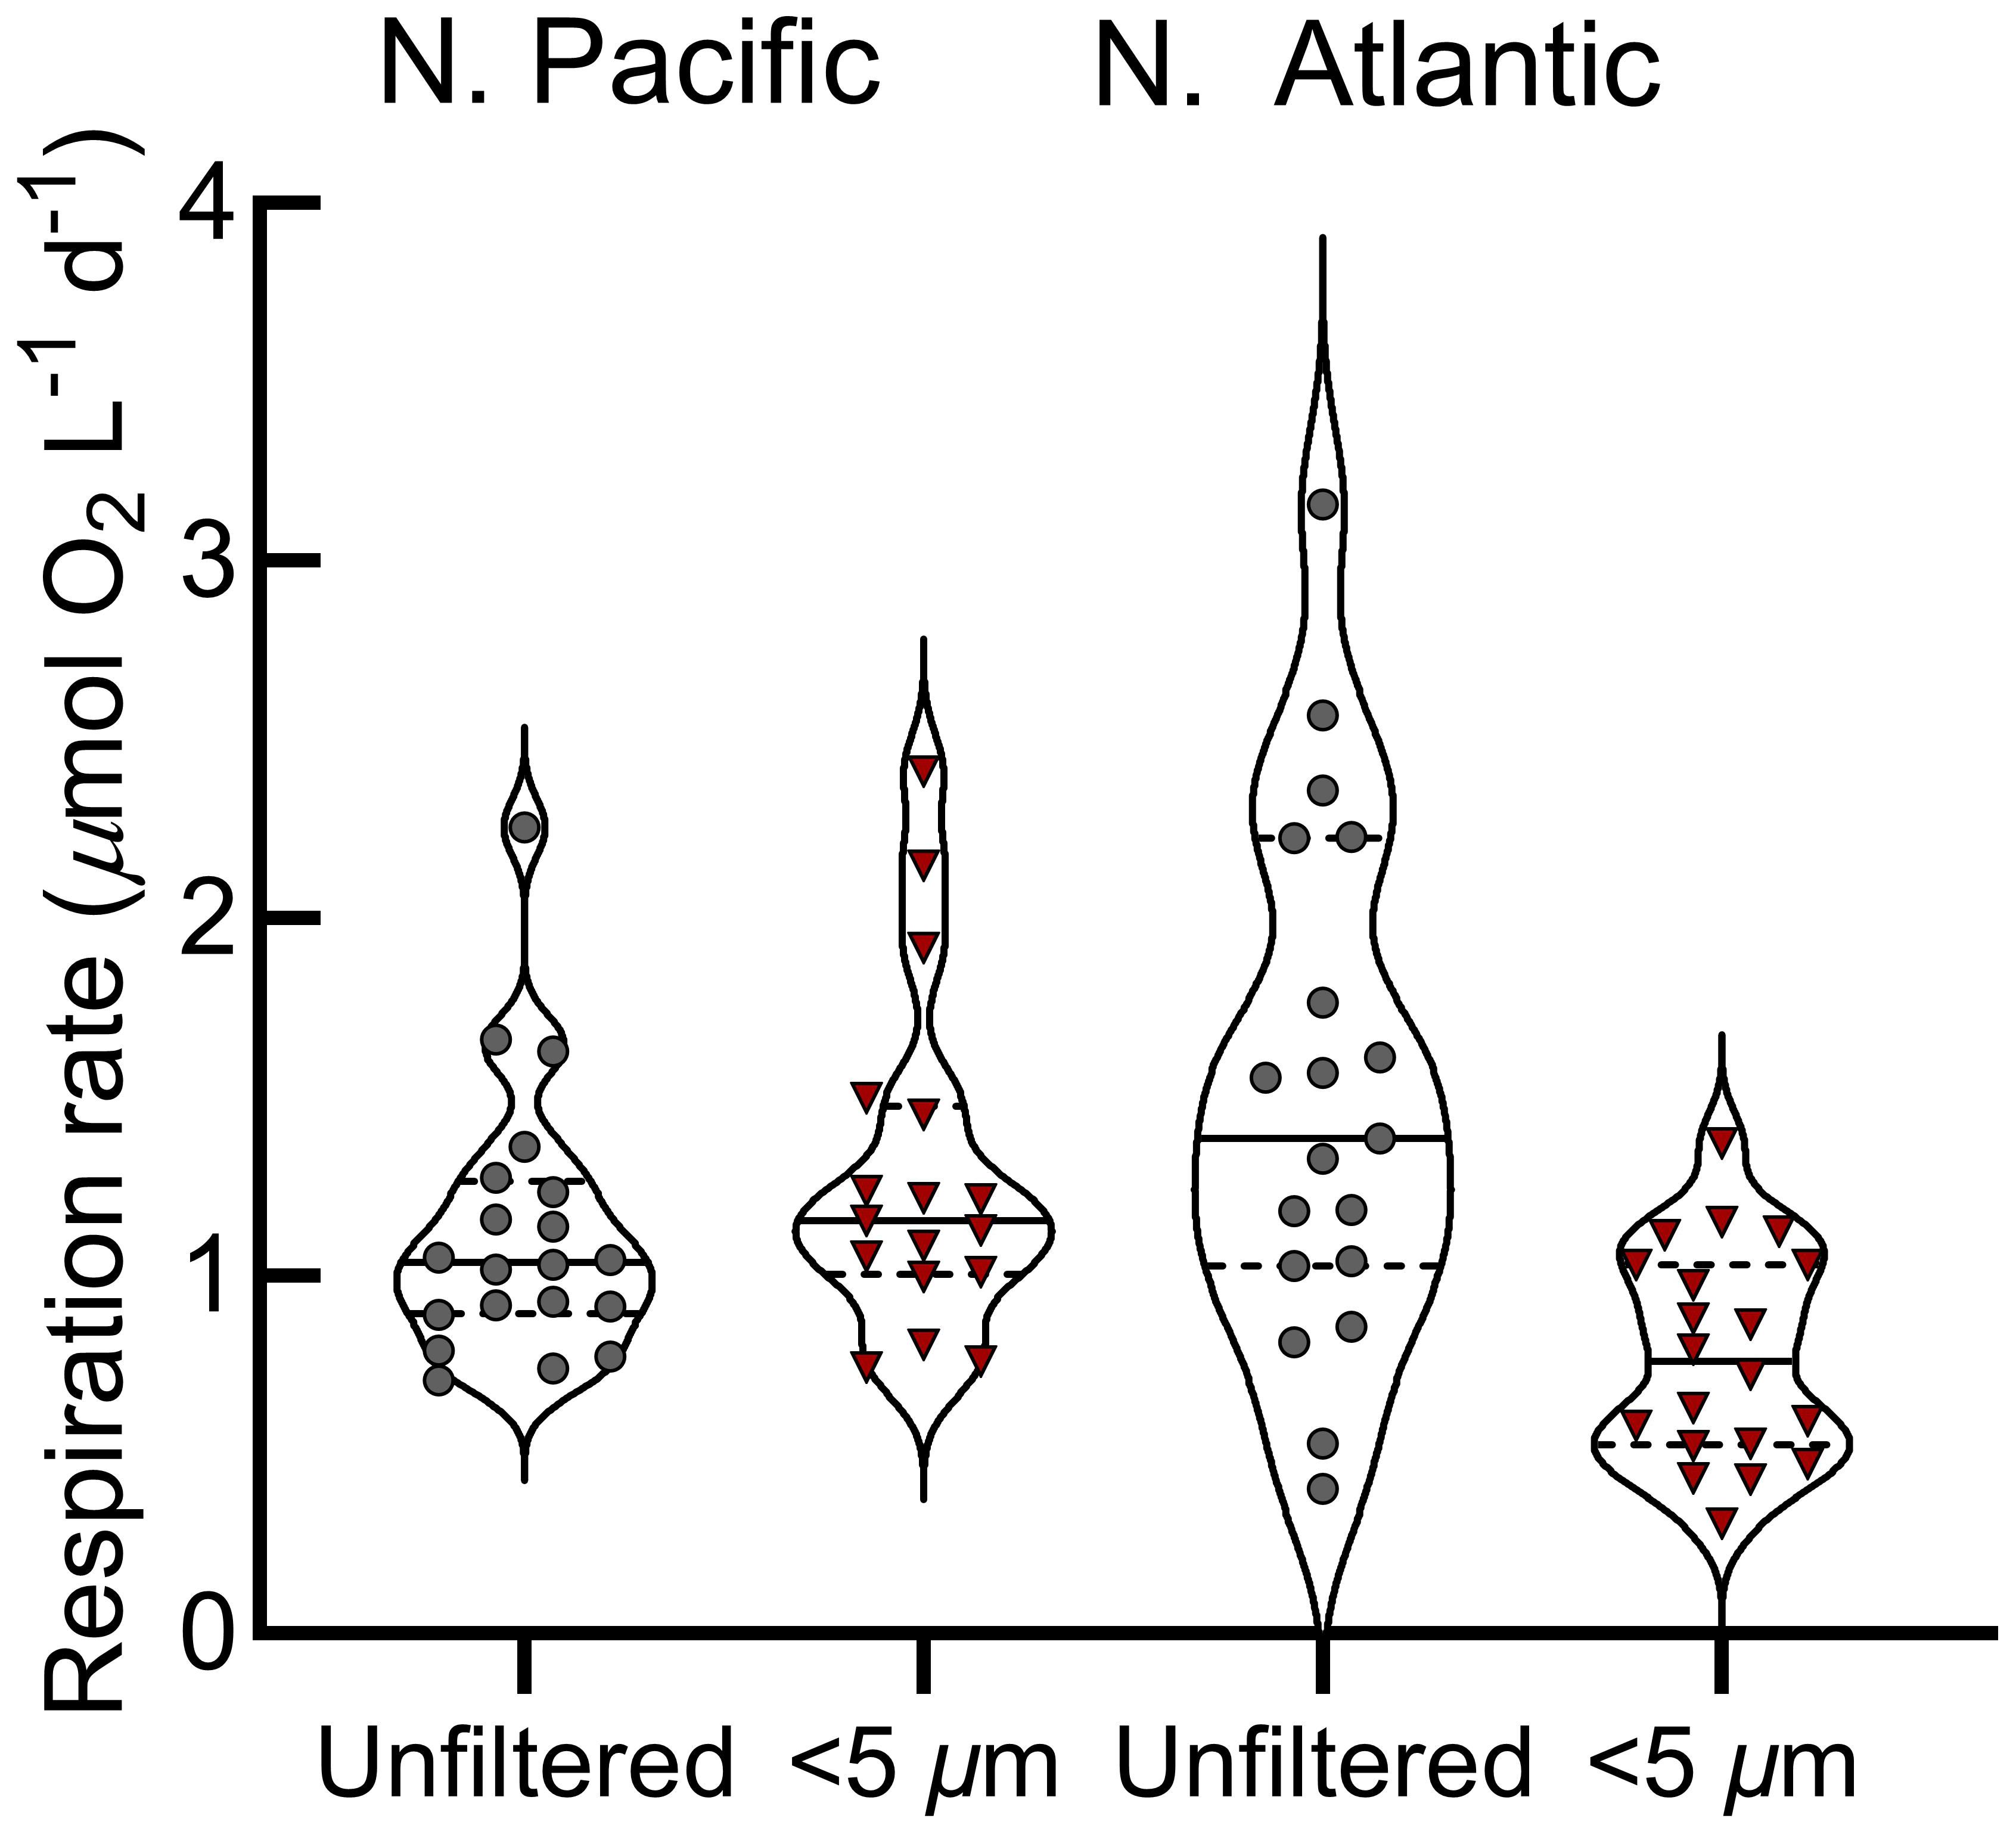
Figure 3 Mixed layer respiration rates across the N. Pacific and N. Atlantic provinces. Violin plots show respiration rates with the median (solid horizontal lines) and the 25th and 75th percentiles (dashed horizontal lines); whole water (gray points), size-fractionated (red points). .
Vertical profiling in the N. Pacific revealed a pattern in whole water respiration rates: a decrease from the surface down to 50 m, a near-maximum level at 95 m followed by a decline to levels below reliable quantification at 200 m (Figure 4, Supplementary Figure S2). Simultaneous measurements of BP did not show an increase at 95 meters, despite the relatively high respiration observed at this depth. Instead, BP consistently attenuated from the surface to deeper waters (Figure 4) (Stephens et al., 2023a).
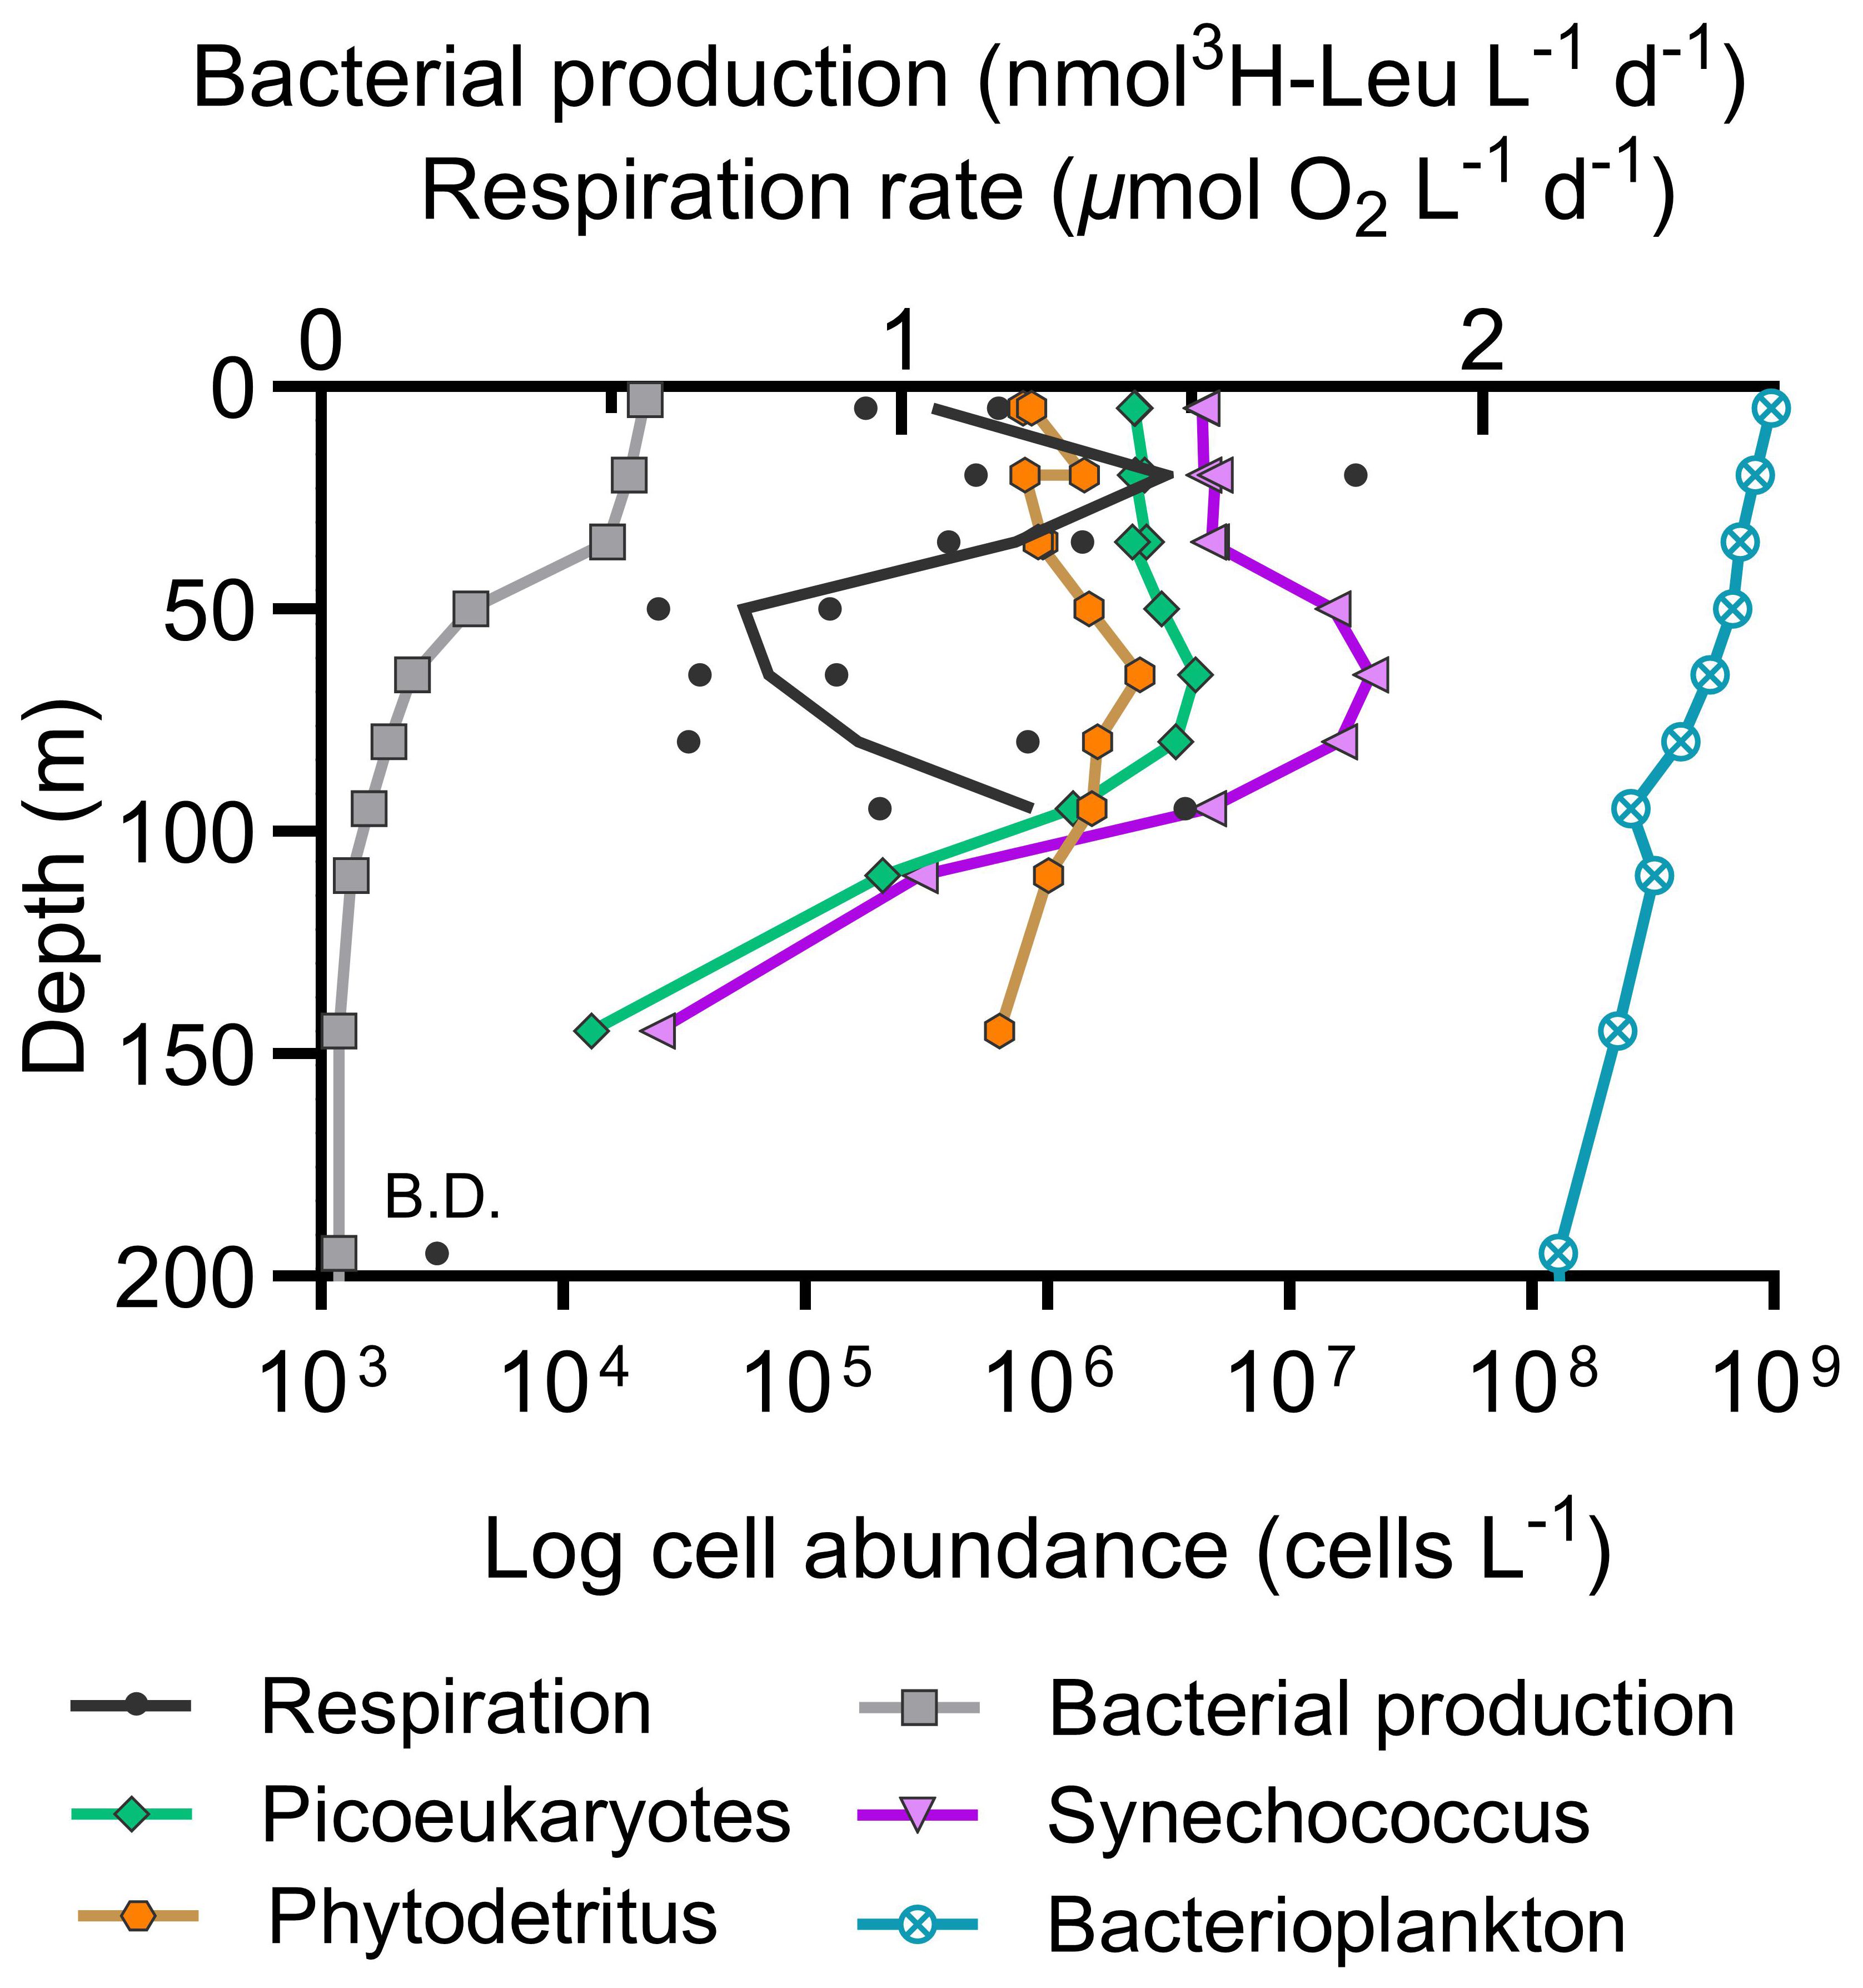
Figure 4 Vertical profile of N. Pacific whole water respiration rates and bacterial production (top x-axis) with phytoplankton abundances and phytodetritus (bottom x-axis) on September 3, 2018 at Ocean Station Papa. (B.D. = below detection limit of 0.2 µmol O2 L-1 d-1).
While we successfully estimated respiration rates in the N. Pacific, suggesting that small cells are the primary contributors to community respiration, our capacity to distinguish trends among size classes was hindered by the infrequent resolution of O2 measurements. To improve on this in the N. Atlantic PAP site (Figure 1), we increased the number of O2 meter channels and directly mounted the polymer optical fibers to the BOD bottles (Supplementary Figure S7), enabling simultaneous O2 measurements every 30 s for 12 sample bottles and one Milli-Q control. As a result, the number of O2 measurements increased from c.a. ten in the N. Pacific to c.a. 3,000 measurements per assay in the N. Atlantic (Figure 5A). Within an assay, a rolling mean was applied to the large number of point measurements, which was then used to calculate the rate (Figure 5A). The high-resolution O2 measurements made it clear if portions of the consumption curve needed to be trimmed: the first c.a. 2.5 to 5 h were generally removed (Supplementary Figure S8) as they had a sharp slope consistent with sensor acclimation (as demonstrated in the Milli-Q control; Supplementary Figure S9), or if the curve became non-linear at the end of incubation or due to sensor slips (Supplementary Figure S3). These improvements allowed us to calculate O2 consumption rates with greater accuracy and precision (mean residual standard error of respiration rates <0.1 µmol O2 L-1 d-1; Supplementary Figure S4, Supplementary Figure S5) than the point resolution of the instrumentation (± 1.4 µmol L-1 O2), and reduce the incubation time required to obtain a reliable, linear consumption signal in this environment to under 20 h. Sensor drift was negligible (5- and 10-fold less than the average N. Atlantic respiration rates for the small and unfiltered fractions, respectively). With this approach, we resolved respiration rates <0.2 µmol O2 L-1 d-1 (Figure 5D-I, Supplementary Figure S3).
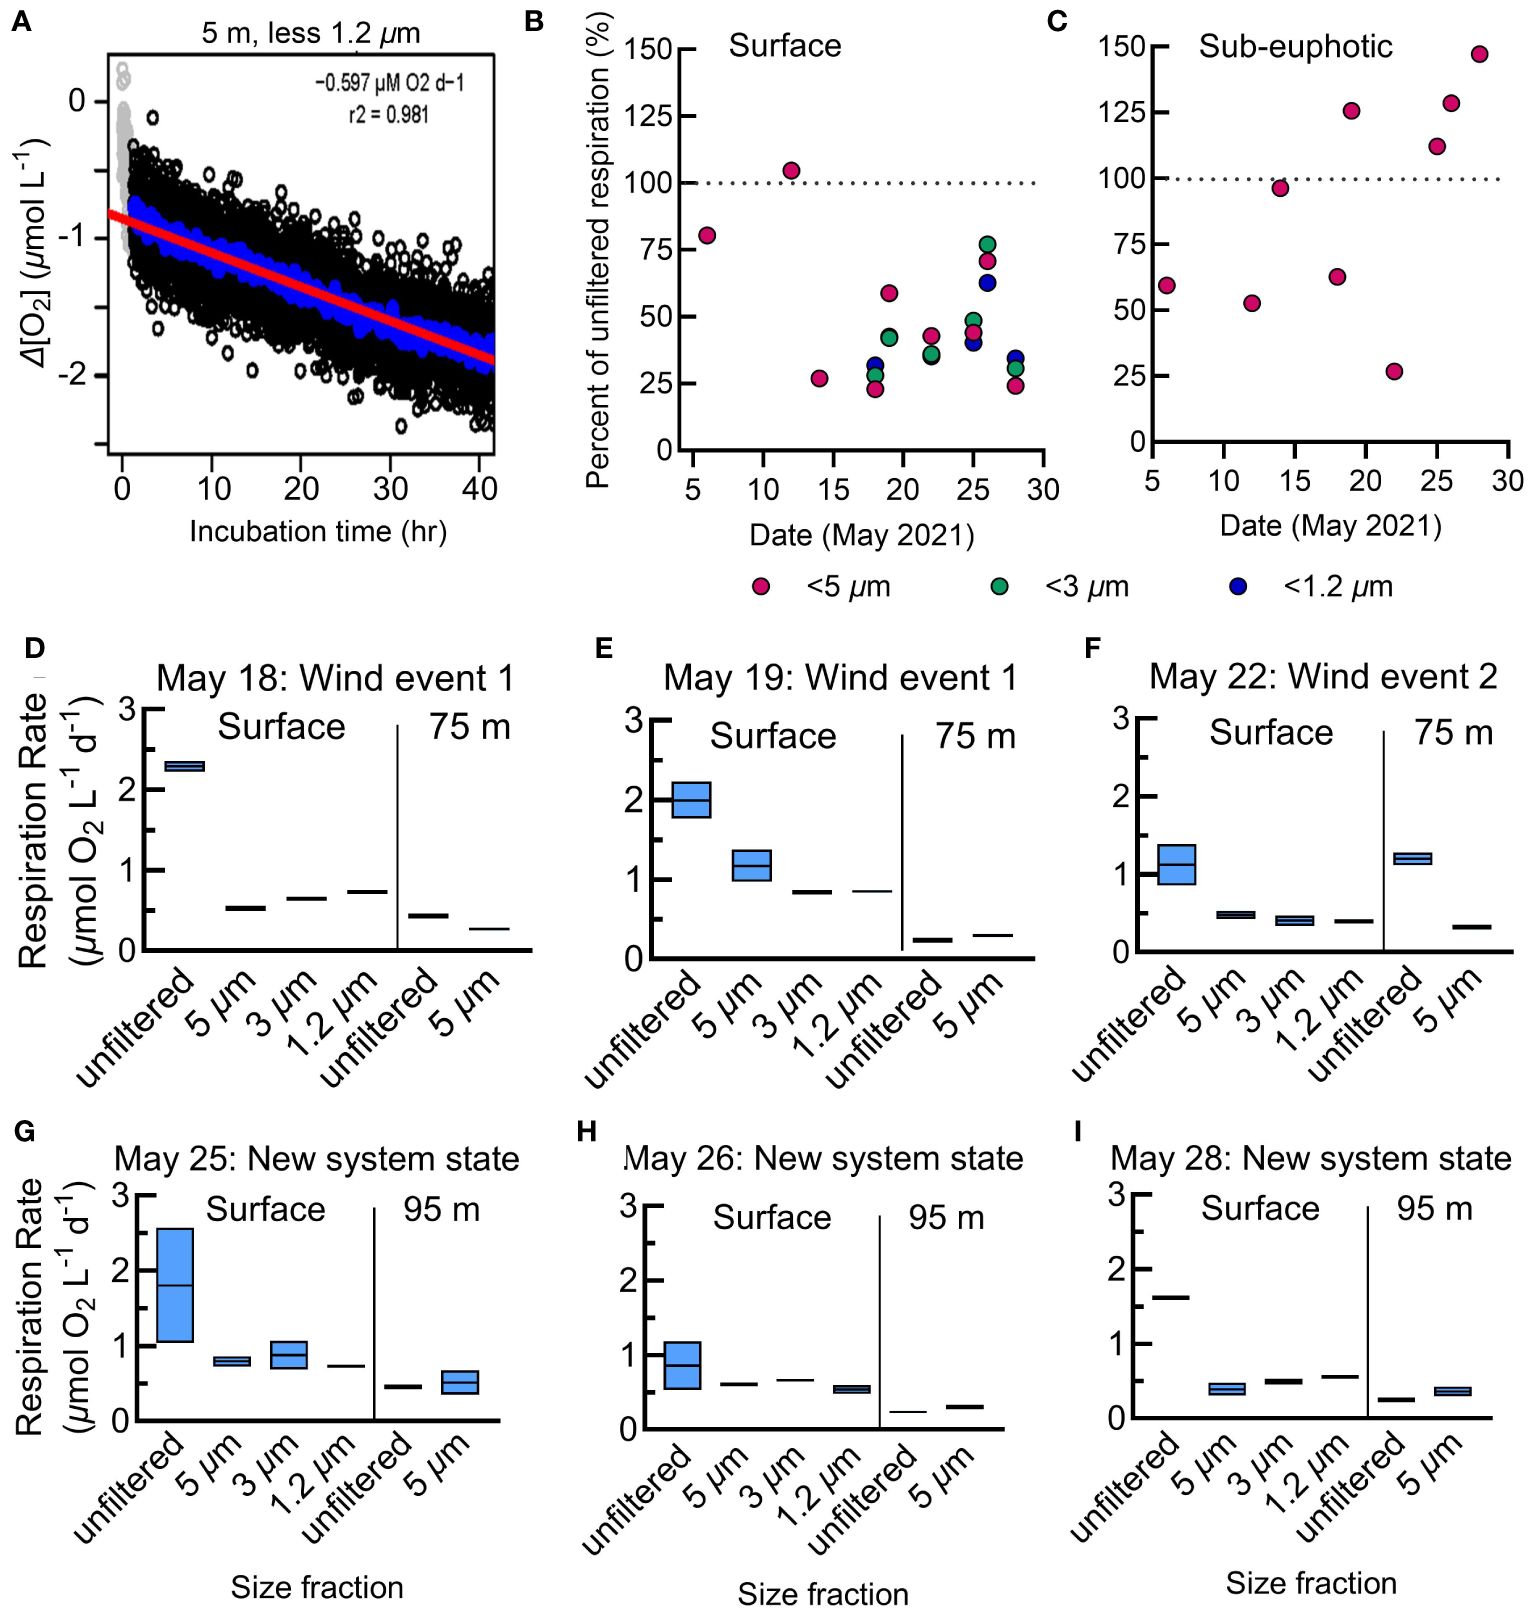
Figure 5 (A) Representative respiration assay from the N. Atlantic showing individual O2 measurements made every 30 s as the change in O2 concentration from the incubation start (black circles). Gray points represent normalized O2 measurements determined to be in the acclimation period and are excluded from calculations. The linear regression (red line) represents the respiration rate and is calculated from the 12.5-min rolling average (blue circles). Plots for all N. Atlantic assays are in Supplementary Figure S3. (B, C) The percent contribution of each size class to total (whole water) respiration at the surface (B) and sub-euphotic zones (C) in the N. Atlantic. The size classes are nested rates, where the <3 µm fraction includes respiration from the <1.2 µm fraction, and so forth. (D-I) Size-fractionated respiration rates in the N. Atlantic. Assays of duplicate unfiltered, small <5 µm, micro <3 µm, and nano <1.2 µm filtrate at the surface and below the euphotic zone beginning May 18th with the storm period noted following the date of each plot. The boxes represent the range and average of the duplicates.
Organic carbon contamination can be a significant challenge in obtaining accurate respiration rates in oligotrophic systems, considering the low in situ labile TOC concentrations and carbon limitation of heterotrophic bacteria. TOC concentrations were higher in the BOD than samples obtained directly from the rosette (ranging from 0 to 8 µmol C L-1 increase; Supplementary Figure S10). However, there was no consistent pattern in TOC enrichment in whole water versus size-fractionated bottles, and the variability in TOC enrichment was not reflected in the variation of respiration rates.
To validate the accuracy of our assay setup and optode-derived respiration rates, we compared data with independently-derived INT measurements available in the N. Atlantic campaign. INT respiration rates (<3 µm size class) ranged from 0.55 to 0.80 µmol O2 L-1 d-1, closely aligning with our optode-derived ranges from the same dates (0.42 to 0.84 µmol O2 L-1 d-1; Figure 6). The consistency (<0.2 µmol O2 L-1 d-1 difference on May 18th, May 28th, and May 26th/27th) between the INT and optode-based methods further support the accuracy of the high-throughput optode assays.
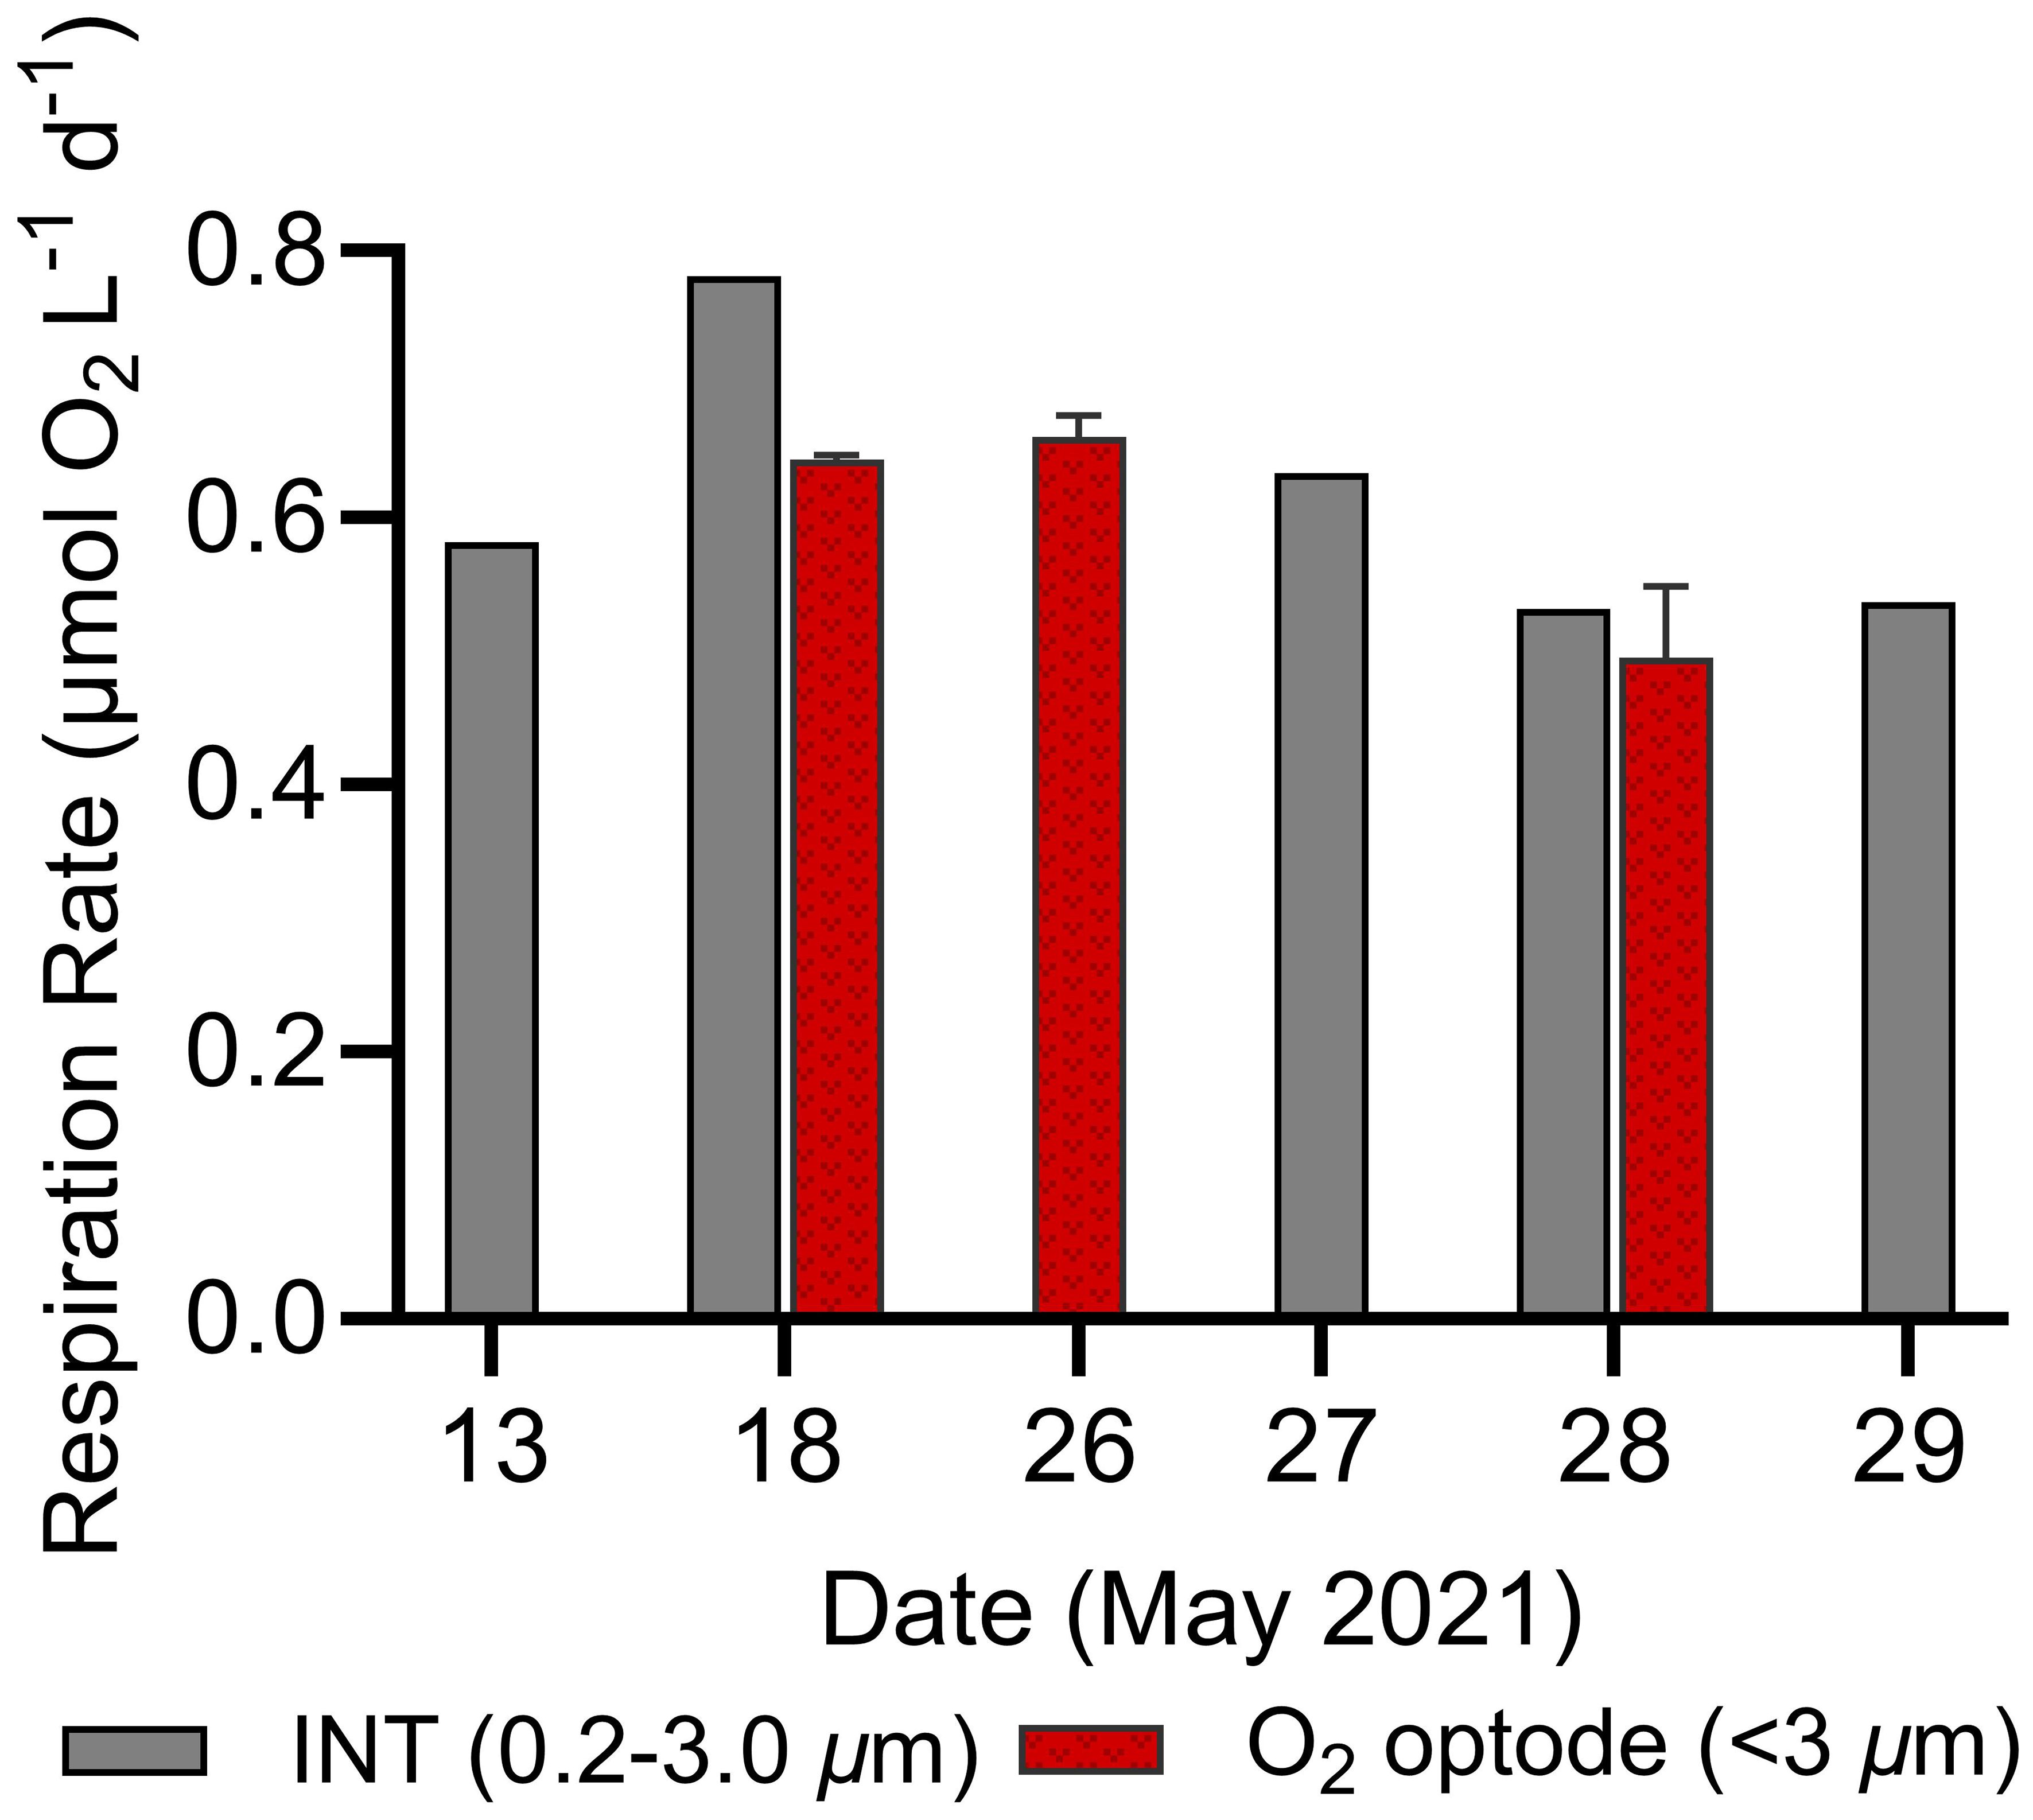
Figure 6 Comparison of surface in vivo 2-para-(iodophenyl)-3(nitrophenyl)-5(phenyl) tetrazolium chloride (INT, 0.2–3.0 µm) and O2 optode derived (<3 µm) respiration rates for several dates in the N. Atlantic. Error bars represent standard deviations of optode duplicates.
Just as in the N. Pacific, in the N. Atlantic we measured respiration rates among two size classes, whole water and small cells, at the surface and below the euphotic zone. In addition, for six surface samples, we included two additional size classes: micro (<3 µm), and nano (<1.2 µm) (Figures 5D–I). Only whole and small (<5 µm) size classes were collected below the euphotic zone due to limited sensor availability. At the surface, N. Atlantic respiration rates averaged 1.7 µmol O2 L-1 d-1 for whole water and 0.9 µmol O2 L-1 d-1 for the small size fraction (Figure 5B). The small-, micro-, and nano-size classes averaged 45% of this whole water surface respiration (Figures 5B, C), with differences between these three classes often not statistically distinguishable (Figures 5D–I). Considering the nested nature of the size fractions, this suggests that nanoplankton were the major contributors to small-fraction respiration at the surface. Additionally, over half of the total community respiration was accounted for by size classes larger than 5 µm.
N. Atlantic respiration rates were substantially lower at depths below the euphotic zone (mean 0.6 µmol O2 L-1 d-1 whole water, 0.3 µmol O2 L-1 d-1 small fraction; Figures 5, 7B, C). In contrast to the surface where the small fraction accounted for 53% of total respiration, they contributed 90% of the total in the sub-euphotic zone (Figure 5C). This demonstrates a shift towards small cells being the predominant active microbial community size classes with depth, particularly as large chlorophyll-a decreased substantially in the second half of the cruise (Figure 7D).
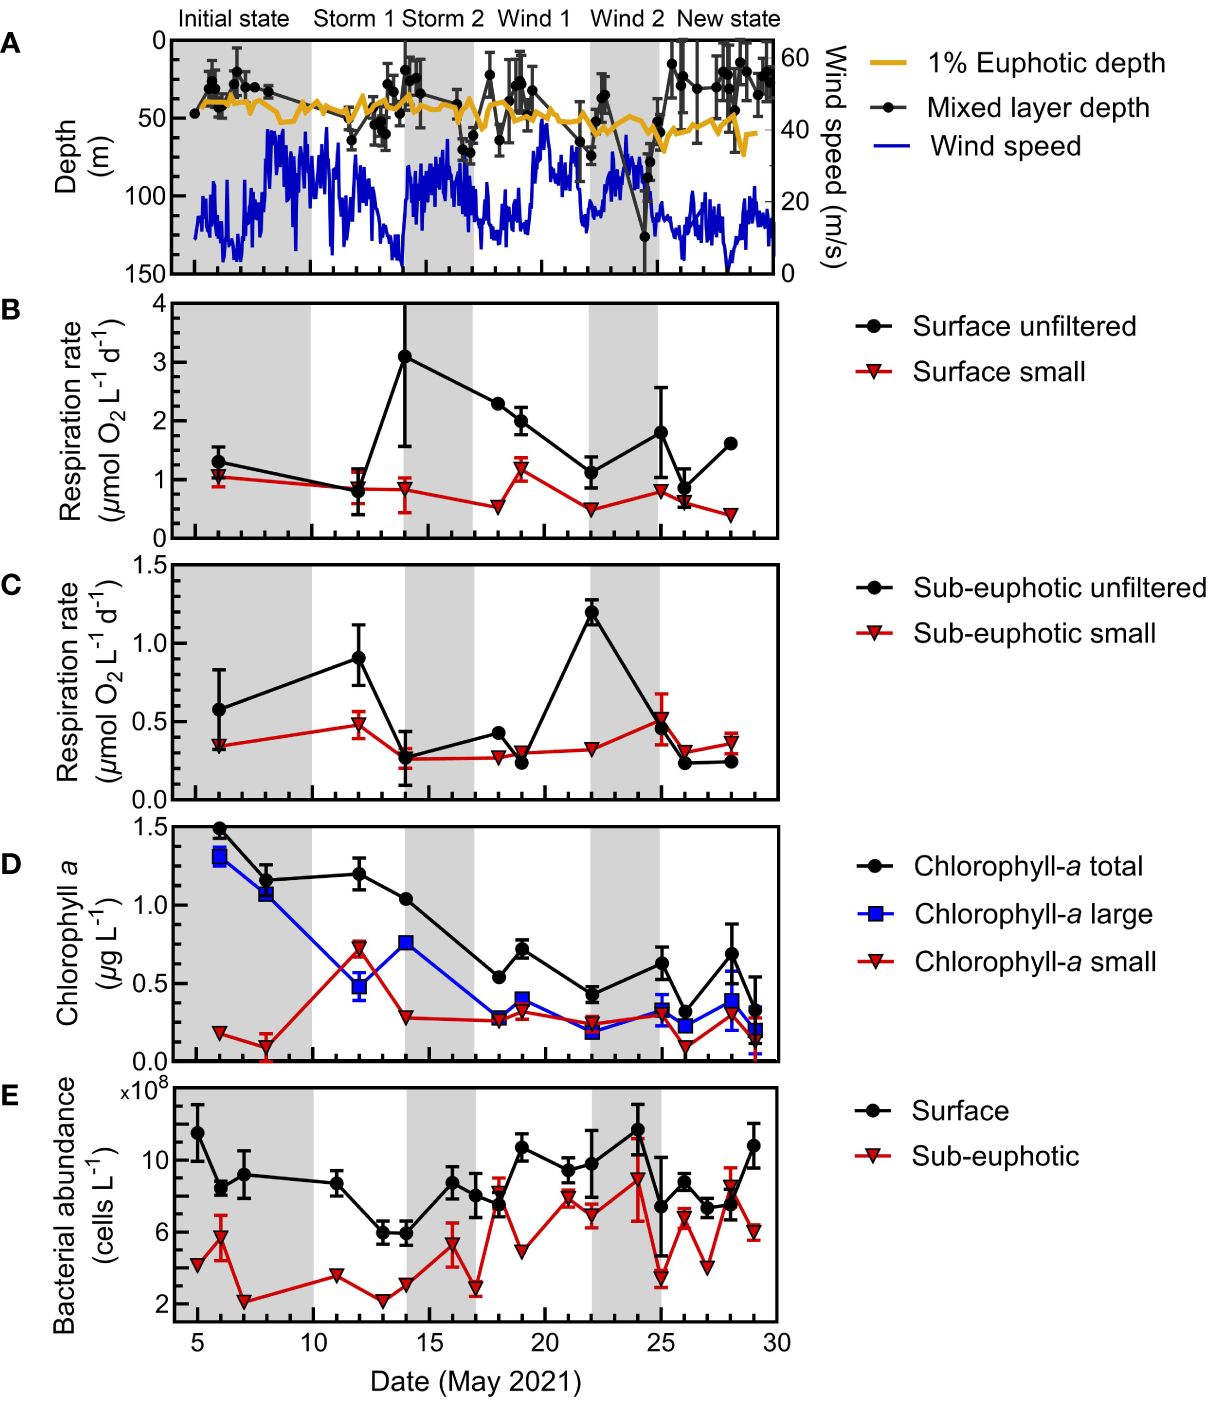
Figure 7 N. Atlantic physical context, respiration, and biomass proxies at the Porcupine Abyssal Plain at the surface (5 m) and sub-euphotic depths (75 m or 95 m). Gray and white shading indicates the periods for arrival on station, storm (wind and cloud cover/precipitation) or wind-only events and recovery, and new system state. (A) Physical parameters include mixed layer depth, wind speed, and euphotic zone depth (1% surface irradiance). (B) Size-fractionated microbial respiration means and range at the surface and (C) below the euphotic zone for the whole water and <5 µm fractions. (D) Proxies for biomass are given as size-fractionated surface chlorophyll-a and bacterial abundance at the surface and (E) sub-euphotic depths.
Assay uncertainty tends to increase with a decrease in the O2 consumption signal as the abundance of respiring cells decreases (such as through fractioning samples or moving from the surface to the mesopelagic) (del Giorgio and Williams, 2005). Given the robust nature of our N. Atlantic measurements, we examined the assay model fit to understand the potential sources of variability across such parameters. Variation between replicate respiration assays demonstrated a dependency on both depth and size fraction. For surface samples, variability was relatively low for the size-fractionated samples and significantly higher for the whole water sample (RSE analysis, Dunnett’s T3 multiple comparisons test, p<0.001). Additionally, surface whole water replicates had significantly higher coefficients of variation (66.2% CV, F*5.000, 27.38 = 16.65) compared to the size-fractionated assays (23% small, 26% micro, 16% nano.; Supplementary Figure S5). The increased variability in surface whole water samples likely stems from the stochasticity in capturing large plankton and particles in the upper water column samples. In the deeper, sub-euphotic samples, no significant differences in replicate variability or % CV were observed between whole water and size-fractionated samples (Supplementary Figure S5), fitting with respiration being dominated in the sub-euphotic by smaller cells that are more consistently captured in the BOD setup.
In contrast to the relatively stable N. Pacific system, the N. Atlantic survey exhibited greater dynamics, encompassing a phytoplankton bloom decline with multiple storms and associated mixing events (Figure 7). Though the N. Atlantic campaign was Lagrangian, following a retentive, anticyclonic eddy with a warm core, project sampling above the eddy core was quasi-Lagrangian, as it was impacted by mixing events (Erickson et al., 2023; Johnson et al., 2023). Consequently, we divided the temporal trends of the N. Atlantic campaign at PAP into six periods (the initial system state, four mixing events, and the final system state) to better understand the drivers of respiration between size classes and depth within this water mass.
At PAP, we initially observed a declining, large phytoplankton bloom, marked by reduced primary production and chlorophyll-a levels (Meyer et al., 2023). During this period, surface whole water and small-fraction respiration decreased (Figure 7B). A storm event then deepened the mixed layer, corresponding with a maximum in surface whole water respiration (Figures 7A, B). During this period, total respiration and chlorophyll-a were dominated by large cells (>5 µm) (Figure 7D). Further wind events continued to shift the mixed layer, and the phytoplankton bloom steadily dissipated with a marked decrease of large phytoplankton. This phytoplankton biomass was mixed below the surface with the storm events. In general, whole water surface respiration declined, following chlorophyll-a trends.
Below the euphotic zone, the small size fraction had relatively stable respiration rates. However, whole water respiration rates had two significant increases, corresponding to mixing during the first storm and first wind periods. Notably, a peak in deep water respiration rates was observed at the end of the first wind period, coinciding with a major flux event and an increase in particulate carbon (Meyer et al., 2023).
Accurately measuring respiration rates has traditionally been challenging, especially in oligotrophic regions, due to low rates which can evade the precision of optical techniques (del Giorgio and Duarte, 2002; Robinson, 2019). Here, we use standard optode/O2 incubation methods in the N. Pacific and then improved the O2 optode assay’s quantitative application in the N. Atlantic by attaching the optical fiber directly to the BOD bottle (Supplementary Figure S7) and performing frequent measurements in a stable temperature environment. The high-frequency O2 measurement approach reduced the need for time-consuming, operator-reliant measurements, increased the accuracy and robustness of respiration rate determinations, and reduced the incubation time needed to obtain a detectable signal. The continuous-mounted optical sensor method resolved rates as low as 0.2 µmol O2 L-1 d-1, providing a means to expand respiration rate coverage and precision in the mesopelagic and oligotrophic ocean.
While Winkler titrations remain the standard for measuring respiration, their labor-intensive and resource-demanding nature typically restricts studies to only two endpoint measurements, forcing the assumption of linear O2 consumption (del Giorgio and Williams, 2005). In contrast, our use of O2-based optodes at high temporal resolution provides unprecedented detail in O2-based incubations, allowing us to evaluate assumptions such as drawdown linearity over the course of the incubation. At the beginning of our incubations, we noted a significant non-linear period of apparent O2 drawdown. We found that the assay was linear after trimming on average the first 5 h ± 0.5 h of the assay (Supplementary Figure S8). This acclimation period was also observed in the abiotic Milli-Q control bottle upon introduction to the water bath, suggesting an abiotic phenomenon rather than a result of respiration (Supplementary Figure S9). Another EXPORTS study used the optode-based AutoBOD system in remineralization experiments (Stephens et al., 2023b). They recorded c.a. 1 O2 measurement per assay every 15 min, similarly discarding the first 4–6 h even with direct temperature readings of the optode sensor spot. Detailed observations of the optode equilibration are only possible with such high-resolution measurements, revealing acclimation periods that may have gone unnoticed in many other O2 incubation assays that relied on sparse measurements.
Optodes are known to be highly sensitive to small changes in temperature, salinity/partial pressure, and light (Bittig et al., 2018; Precision Sensing, 2024). The acclimation period observed in our experiments is likely due to a combination of these effects on the optode which we took care to minimize. Incubations were conducted in the dark, although the optodes were briefly exposed to low-level laboratory light during sample filling to inspect and remove any air bubbles from the bottles. Additionally, optodes must remain hydrated, thus, the BOD bottles were filled with Milli-Q water during storage and required equilibration to the seawater matrix sample upon use. Temperature is a critical factor affecting optode sensitivity; even minor changes can significantly influence the O2 readings. A temperature shift of 0.14°C results in an apparent oxygen change of 1 µmol O2 L-1 d-1 (Wikner et al., 2013), contributing to the observed acclimation. The BOD bottles were stored at ambient temperature before sampling, necessitating a period of equilibration to the in situ temperature of the water bath which was used to minimize temperature fluctuations during incubation. Storing the BOD bottles at in situ temperature before sampling could further reduce the acclimation period and limit impacts on metabolic rates. An analysis of assay trim times by size-fraction and depth showed no systematic differences in the number of points removed, indicating that sample handling procedures and differences in microbial community composition did not significantly affect the acclimation time (Supplementary Figure S8).
We also consider possible biotic explanations for the initial period of high apparent O2 consumption and non-linearity. If the acclimation period was the result of biotic factors, it would represent an anomalously high respiration rate (maximum of 2 to 3 µmol O2 L-1 d-1) for productive open ocean regions (Pomeroy and Johannes, 1966; Sherry et al., 1999; Robinson et al., 2002). We did not observe any biofilms that would explain the initial O2 drawdown and the required growth rate would not align with the observed timing or shape of the assay curves. We did observe moderate TOC enrichment in our respiration assays compared to the casts but there was little indication that this was labile or due to disaggregation of particulate matter; most of our measured respiration rates were <1 µmol O2 L-1 d-1, and we could clearly differentiate rates in the surface, sub-euphotic zones, and across various size classes. It’s more likely acclimation time results from known optode sensitivity to abiotic factors rather than a biological response- especially since it occurs immediately and not on the time scales which changes in the microbial community would develop- yet additional validation of the linearity assumption should be sought.
In addition to the primary optode-derived O2 assay method, we utilized a few coinciding INT-based measurements from the EXPORTS program. These INT-based rates from subsequent casts served as a validation of our optode method. We observed a close correlation between the rates obtained from these two methods (Figure 6). This agreement suggests that the extended incubation periods and initial acclimation phase in our optode assays did not significantly impact the measured respiration rates compared to shorter-term incubation methods.
A more extensive study by García-Martín et al. (2019b) validated the INT-based respiration assay using Winkler-derived O2 measurements for marine plankton, reporting reasonable agreement with incubations times tailored to each method (2 h for INT and 20–48 h for O2 incubation). However, given evidence of potential underestimation by INT methods despite their validation against O2 techniques (Villegas-Mendoza et al., 2015; García-Martín et al., 2019c; Baños et al., 2020), future research should further explore how INT, O2 optode, and BP-derived respiration rates compare. Additionally, the potential of emerging techniques, such as new single-cell respiration measurements (Munson-McGee et al., 2022), should be investigated. Implementing such advancements for in situ observations could enhance our capacity to quantify under-sampled respiration rates, which require increased methodological sensitivity.
Utilizing these optode assays in the N. Pacific and N. Atlantic, we observed varying contributions of different microbial size classes to community respiration in two contrasting oceanic provinces. The Northeast Pacific sampling (Station Papa) represented the low productivity endmember where our surface, small size-fraction rates were relatively low and similar to historical measurements in the same region by Sherry et al. (1999). Both biomass and rate measurements were dominated by small cells (Meyer et al., 2022), and small-fraction respiration rates were often statistically indistinguishable from the whole water samples (Figures 2A, 3). When converted to carbon units, total surface respiration (average 0.86 µmol CO2 L-1 d-1 using a respiratory quotient of 1.4 O2 to CO2) is elevated compared to the project’s respiration estimates derived from remineralization assays (0.19 µmol CO2 L-1 d-1) (Stephens et al., 2020). This speaks to the importance of size-fractionated rate assays, as our small size fraction (<5 µm) encompasses a larger portion of the microbial community than that of the <3 µm dilutions used in remineralization experiments. Additionally, the size-fractionated respiration rates build on Niebergall et al. (2023) study of several independent ship-based, autonomous, and satellite-based EXPORTS program estimates of net community production at the site, finding it to be slightly net autotropic with low export potential. Overall, these results imply that the bulk of microbial community respiration in the mixed layer can be attributed to small cells, including bacterioplankton, cyanobacteria, and small eukaryotes and was in close balance with primary production (McNair et al., 2021; Meyer et al., 2022).
A comparison of total respiration rates to coinciding program depth profile measurements (Meyer et al., 2022) revealed a significant negative correlation to small-cell chlorophyll-a (Spearman correlation, r=-1.00, p=0.042, n=4), and weak positive correlations with total particulate carbon and net primary production (r=0.80, p=0.17, n=4). These findings reflect the low biomass, low productivity, and highly recycled nature of the Station Papa ecosystem in late summer (Meyer et al., 2022; McNair et al., 2023; Niebergall et al., 2023). The vertical respiration profile decreases with depth (Figure 4), consistent with minimal particle flux occurring at this time (Durkin et al., 2021; Estapa et al., 2021), then respiration rebounds just below the deep chlorophyll maximum. Interestingly, there is no concurrent increase in BP or bacterial abundance observed at the base of the deep chlorophyll maximum. In fact, respiration between 65 to 95 m displays an inverse relationship with BP and small phytoplankton abundance. This pattern suggests a spatial decoupling of microbial respiration from BP and plankton abundance.
Kim et al. (2017) previously found a decoupling between BP and bacterial respiration in downwelling systems where nutrients are low, proposing that a shift in metabolism towards cellular maintenance rather than growth was driving decoupling. We postulate that bacteria around the 100 m depth horizon utilized solubilizing phytodetritus as dissolved organic matter became more recalcitrant (Baetge et al., 2021), leading to an increase in respiration despite the divergence from the BP trend. The 95 m respiration increase occurs just below the base of the euphotic zone, the deep chlorophyll maximum, and the phytodetritus maximum, which presumably originates from high densities of cyanobacteria and picoeukaryotes (Figure 4). Simultaneous work at Station Papa by Stephens et al. (2020) shows a decrease in bacterioplankton growth efficiency with depth, indicating a higher proportion of respiration to BP. It is also possible that the inherently flexible metabolism of mixotrophs, such as abundant Synechococcus, are not well-captured by the BP assay, contributing to the decoupling trend. Below 100 m, respiration, BP, bacterial abundance, and phytodetritus concentrations decreased to rate or concentration minimum as expected.
In the N. Atlantic (PAP), we improved our respiration rate estimates with higher frequency O2 measurements and additional size fractions to further resolve microbial community member contributions. We observed substantial dynamics in N. Atlantic respiration rates driven by the decline of a phytoplankton bloom and multiple mixing events. Here, large phytoplankton were more prevalent than in the N. Pacific (Meyer et al., 2023). Accordingly, our N. Atlantic whole water respiration rates were, on average, 1.4-fold higher than the N. Pacific and small size-fraction rates were, on average, 1.3-fold lower. Unlike the N. Pacific, small-fraction respiration strongly correlated with small net primary production (p=0.05, Pearson’s correlation; Supplementary Figure S6). Small-fraction respiration also moderately correlated with large and total chlorophyll-a (p=0.11, r=0.57 and p=0.09, r=0.60, respectively). However, BP decoupled from small respiration with depth, as observed in the N. Pacific (p=0.01, r=0.83 at the surface and p=0.53, r=-0.26 in the sub-euphotic, Pearson’s correlation; Supplementary Figure S6).
While on average, small-fraction respiration in the N. Atlantic was responsible for 45% of the total respiration (similar to prior estimates for this system) (Fasham et al., 1999; Aranguren-Gassis et al., 2012; Binetti et al., 2020), we observed substantial temporal dynamics in the size class contributions. At the surface, initially the small fraction contributed most of the respiration. After the first storm, large size chlorophyll-a decreased, yet the respiration in the whole water was the dominant signal of all size fractions, likely from particle-associated respiration. The largest contribution to respiration then gradually shifted back to the small fraction in the mid to late stages of the observation period, coincident with a decline in chlorophyll-a. As large cells aggregated into phytodetritus, storms mixed the particles below the euphotic zone (Estapa et al., 2023; Clevenger et al., 2024). There were notable increases in respiration in the whole water treatment within the sub-euphotic zone. Otherwise, sub-euphotic respiration was low with a markedly higher contribution (80%) of the small size fraction to total respiration (Figures 5C, 7). After major wind events in the second half of the study, the three filtered size fractions displayed little difference in magnitude at the surface, coinciding with the second bloom phase where chlorophyll-a had shifted from large to small cells (Meyer et al., 2023) and small-fraction respiration accounted for a greater portion of community respiration (Figure 7B, D).
Several studies have documented similar dynamics in the N. Atlantic during spring blooms, including the Biogeochemical Ocean Flux Study Spring Bloom Experiment, the N. Atlantic Bloom Experiment, and recent research near PAP (Bender et al., 1992; Savidge et al., 1992; Binetti et al., 2020). These studies all demonstrate that this is an energetic system, net autotrophic annually, with frequent switching between net autotrophic and heterotrophic states. Our findings reveal that these dynamics can occur on relatively short timescales (days) and drive interactions between respiration rates in the surface and sub-euphotic zones. These active systems influenced by regular redistribution of biological and chemical stocks, taken with our findings, suggest that infrequent respiration sampling may miss critical, large shifts in the system and lead to a misrepresentation of regions as net auto- or heterotrophic.
This work sampled two well-studied oceanographic stations for several weeks. At both stations, we found that respiration often followed chlorophyll-a trends, though respiration also unexpectedly decoupled from BP with depth. Facilitated in part by advancements in respiration measurement techniques, like those detailed here, our findings reveal that significant fluctuations in respiration rates can occur on the order of days. This rapid metabolic response can considerably affect incubation-based estimates of net community production within a system. More extensive sampling is required across both temporal and spatial scales to better resolve carbon cycle components, enabling a more accurate assessment of respiration’s role in ocean ecosystem metabolism.
The datasets presented in this study can be found in online repositories. The names of the repository/repositories and accession number(s) can be found in the article/Supplementary Material.
MC: Conceptualization, Data curation, Formal Analysis, Investigation, Methodology, Validation, Visualization, Writing – original draft, Writing – review & editing. BS: Conceptualization, Data curation, Formal Analysis, Investigation, Methodology, Validation, Visualization, Writing – review & editing. MM: Data curation, Formal Analysis, Investigation, Methodology, Visualization, Writing – review & editing. GS: Investigation, Writing – review & editing. AN: Investigation, Writing – review & editing. JG: Data curation, Formal Analysis, Funding acquisition, Investigation, Methodology, Project administration, Supervision, Visualization, Writing – review & editing. NC: Conceptualization, Funding acquisition, Investigation, Methodology, Writing – review & editing. AM: Conceptualization, Funding acquisition, Writing – review & editing. CC: Conceptualization, Data curation, Formal Analysis, Funding acquisition, Investigation, Methodology, Resources, Supervision, Validation, Visualization, Writing – review & editing. SG: Conceptualization, Data curation, Formal Analysis, Funding acquisition, Investigation, Methodology, Project administration, Resources, Supervision, Validation, Visualization, Writing – original draft, Writing – review & editing.
The author(s) declare that financial support was received for the research, authorship, and/or publication of this article. AM, SG, and NC received National Aeronautics and Space Administration award 80NSSC17K0552 AM, SG, NC (equal) and award 80NSSC18K0437 to CC (supporting) with resources primarily supplied by SG. JG was supported by 80NSSC17K0568.
The authors thank the NASA EXPORTS team, including program leads D. Seigel and I. Cetinić, chief scientists D. Steinberg and JG, and the 2018 and 2021 EXPORTS team. We thank the captain and crew of the R/V Roger Revelle (RR1813) and RSS James Cook (JC214) for their facilities, expertise, and dedication.
The authors declare that the research was conducted in the absence of any commercial or financial relationships that could be construed as a potential conflict of interest.
All claims expressed in this article are solely those of the authors and do not necessarily represent those of their affiliated organizations, or those of the publisher, the editors and the reviewers. Any product that may be evaluated in this article, or claim that may be made by its manufacturer, is not guaranteed or endorsed by the publisher.
The Supplementary Material for this article can be found online at: https://www.frontiersin.org/articles/10.3389/fmars.2024.1395799/full#supplementary-material
BOD – Biological oxygen demand, BP – Bacterial production, INT - In vivo 2-para-(iodophenyl)-3(nitrophenyl)-5(phenyl) tetrazolium chloride, PAP – Porcupine Abyssal Plain, North Atlantic, RSE – Residual standard error, TOC – Total organic carbon.
Aranguren-Gassis M., Teira E., Serret P., Martínez-García S., Fernández E. (2012). Potential overestimation of bacterial respiration rates in oligotrophic plankton communities. Mar. Ecol. Prog. Ser. 453, 1–10. doi: 10.3354/meps09707
Azam F., Fenchel T., Field J. G., Gray J. S., Meyer-Reil L. A., Thingstad F. (1983). The ecological role of water-column microbes in the sea. Mar. Ecol. Prog. Ser. 10, 257–263. doi: 10.3354/meps010257
Baetge N., Behrenfeld M. J., Fox J., Halsey K. H., Mojica K. D. A., Novoa A., et al. (2021). The seasonal flux and fate of dissolved organic carbon through bacterioplankton in the western north Atlantic. Front. Microbiol. 12. doi: 10.3389/fmicb.2021.669883
Baños I., Montero M. F., Benavides M., Arístegui J. (2020). INT toxicity over natural bacterial assemblages from surface oligotrophic waters: implications for the assessment of respiratory activity. Microb. Ecol. 80, 237–242. doi: 10.1007/s00248-019-01479-4
Bender M., Ducklow H., Kiddon J., Marra J., Martin J. (1992). The carbon balance during the 1989 spring bloom in the North Atlantic Ocean, 47°N, 20°W. Deep Sea Res. Part Oceanogr. Res. Pap. 39, 1707–1725. doi: 10.1016/0198-0149(92)90025-O
Binetti U., Kaiser J., Damerell G. M., Rumyantseva A., Martin A. P., Henson S., et al. (2020). Net community oxygen production derived from Seaglider deployments at the Porcupine Abyssal Plain site (PAP; northeast Atlantic) in 2012–13. Prog. Oceanogr. 183, 102293. doi: 10.1016/j.pocean.2020.102293
Bittig H. C., Körtzinger A., Neill C., van Ooijen E., Plant J. N., Hahn J., et al. (2018). Oxygen optode sensors: principle, characterization, calibration, and application in the ocean. Front. Mar. Sci. 4. doi: 10.3389/fmars.2017.00429
Boyd P., Harrison P. J. (1999). Phytoplankton dynamics in the NE subarctic Pacific. Deep Sea Res. Part II Top. Stud. Oceanogr. 46, 2405–2432. doi: 10.1016/S0967-0645(99)00069-7
Chen S. T., Ward C. P., Long M. H. (2023). Quantifying pelagic primary production and respiration via an automated in situ incubation system. Limnol. Oceanogr-Meth 21 (8), 495–507. doi: 10.1002/lom3.10560
Clevenger S. J., Benitez-Nelson C. R., Roca-Martí M., Bam W., Estapa M., Kenyon J. A., et al. (2024). Carbon and silica fluxes during a declining North Atlantic spring bloom as part of the EXPORTS program. Mar. Chem. 258, 104346. doi: 10.1016/j.marchem.2023.104346
del Giorgio P. A., Duarte C. M. (2002). Respiration in the open ocean. Nat. Lond. 420, 379–384. doi: 10.1038/nature01165
del Giorgio P., Williams P. (2005). Respiration in Aquatic Ecosystems (New York, USA: Oxford University Press). doi: 10.1093/acprof:oso/9780198527084.001.0001
Ducklow H. W., Doney S. C. (2013). What is the metabolic state of the oligotrophic ocean? A debate. Annu. Rev. Mar. Sci. 5, 525–533. doi: 10.1146/annurev-marine-121211-172331
Durkin C. A., Buesseler K. O., Cetinić I., Estapa M. L., Kelly R. P., Omand M. (2021). A visual tour of carbon export by sinking particles. Glob. Biogeochem. Cycles 35, e2021GB006985. doi: 10.1029/2021GB006985
Edwards B. R., Reddy C. M., Camilli R., Carmichael C. A., Longnecker K., Van Mooy B. A. S. (2011). Rapid microbial respiration of oil from the Deepwater Horizon spill in offshore surface waters of the Gulf of Mexico. Environ. Res. Lett. 6, 35301. doi: 10.1088/1748-9326/6/3/035301
Erickson Z. K., Fields E., Johnson L., Thompson A. F., Dove L. A., D’Asaro E., et al. (2023). Eddy tracking from in situ and satellite observations. J. Geophys. Res. Oceans 128, e2023JC019701. doi: 10.1029/2023JC019701
Estapa M., Buesseler K., Durkin C. A., Omand M., Benitez-Nelson C. R., Roca-Martí M., et al. (2021). Biogenic sinking particle fluxes and sediment trap collection efficiency at Ocean Station Papa. Elem. Sci. Anthr. 9, 122. doi: 10.1525/elementa.2020.00122
Estapa M. L., Durkin C. A., Slade W. H., Huffard C. L., O’Neill S. P., Omand M. M. (2023). A new, global optical sediment trap calibration. Limnol. Oceanogr-Meth 22 (2), 77–92. doi: 10.31223/X5NQ1X
Fasham M. J. R., Boyd P. W., Savidge G. (1999). Modeling the relative contributions of autotrophs and heterotrophs to carbon flow at a Lagrangian JGOFS station in the Northeast Atlantic: The importance of DOC. Limnol. Oceanogr. 44, 80–94. doi: 10.4319/lo.1999.44.1.0080
Frigstad H., Henson S. A., Hartman S. E., Omar A. M., Jeansson E., Cole H., et al. (2015). Links between surface productivity and deep ocean particle flux at the Porcupine Abyssal Plain sustained observatory. Biogeosciences 12, 5885–5897. doi: 10.5194/bg-12-5885-2015
García-Martín E. E., Aranguren-Gassis M., Karl D. M., Martínez-García S., Robinson C., Serret P., et al. (2019b). Validation of the in vivo iodo-nitro-tetrazolium (INT) salt reduction method as a proxy for plankton respiration. Front. Mar. Sci. 6. doi: 10.3389/fmars.2019.00220
García-Martín E. E., Daniels C. J., Davidson K., Davis C. E., Mahaffey C., Mayers K. M. J., et al. (2019a). Seasonal changes in plankton respiration and bacterial metabolism in a temperate shelf sea. Prog. Oceanogr. 177, 101884. doi: 10.1016/j.pocean.2017.12.002
García-Martín E. E., Seguro I., Robinson C. (2019c). INT reduction is a valid proxy for eukaryotic plankton respiration despite the inherent toxicity of INT and differences in cell wall structure. PloS One 14, e0225954. doi: 10.1371/journal.pone.0225954
Graff J. R., Behrenfeld M. J. (2018). Photoacclimation responses in subarctic atlantic phytoplankton following a natural mixing-restratification event. Front. Mar. Sci. 5. doi: 10.3389/fmars.2018.00209
Griffith P. C. (1988). A high-precision respirometer for measuring small rates of change in the oxygen concentration of natural waters. Limnol. Oceanogr. 33, 632–638. doi: 10.4319/lo.1988.33.4.0632
Guo C., Ke Y., Chen B., Zhang S., Liu H. (2022). Making comparable measurements of bacterial respiration and production in the subtropical coastal waters. Mar. Life Sci. Technol. 4, 414–427. doi: 10.1007/s42995-022-00133-2
Johnson L., Siegel D. A., Thompson A. F., Fields E., Erickson Z., Cetinic I., et al. (2023). Assessment of oceanographic conditions during the north Atlantic EXport processes in the ocean from remoTe sensing (EXPORTS) field campaign. Prog. Oceanogr. 220, 103170. doi: 10.31223/X5C097
Kim B., Kim S.-H., Kwak J. H., Kang C.-K., Lee S. H., Hyun J.-H. (2017). Heterotrophic bacterial production, respiration, and growth efficiency associated with upwelling intensity in the Ulleung Basin, East Sea. Deep-Sea Res. Oceanogr. Part II Top. Stud. Oceanogr. 143, 24–35. doi: 10.1016/j.dsr2.2017.07.002
Martínez-García S., Fernández E., Aranguren-Gassis M., Teira E. (2009). In vivo electron transport system activity: a method to estimate respiration in natural marine microbial planktonic communities. Limnol. Oceanogr-Meth. 7, 459–469. doi: 10.4319/lom.2009.7.459
Martínez-García S., Karl D. M. (2015). Microbial respiration in the euphotic zone at Station ALOHA. Limnol. Oceanogr. 60, 1039–1050. doi: 10.1002/lno.10072
McNair H. M., Meyer M. G., Lerch S. J., Maas A. E., Stephens B. M., Fox J., et al. (2023). Quantitative analysis of food web dynamics in a low export ecosystem [Preprint]. doi: 10.1101/2023.03.17.532807
McNair H. M., Morison F., Graff J. R., Rynearson T. A., Menden-Deuer S. (2021). Microzooplankton grazing constrains pathways of carbon export in the subarctic North Pacific. Limnol. Oceanogr. 66, 2697–2711. doi: 10.1002/lno.11783
Meyer M. G., Brzezinski M. A., Cohn M. R., Kramer S. J., Paul N., Sharpe G., et al. (2023). Primary production dynamics during the decline phase of the North Atlantic annual spring bloom. bioRxiv [Preprint]. doi: 10.1101/2023.05.18.541304
Meyer M. G., Gong W., Kafrissen S. M., Torano O., Varela D. E., Santoro A. E., et al. (2022). Phytoplankton size-class contributions to new and regenerated production during the EXPORTS Northeast Pacific Ocean field deployment. Elem. Sci. Anthr. 10, 68. doi: 10.1525/elementa.2021.00068
Moran M. A., Ferrer-González F. X., Fu H., Nowinski B., Olofsson M., Powers M. A., et al. (2022). The Ocean’s labile DOC supply chain. Limnol. Oceanogr. 67, 1007–1021. doi: 10.1002/lno.12053
Munson-McGee J. H., Lindsay M. R., Sintes E., Brown J. M., D’Angelo T., Brown J., et al. (2022). Decoupling of respiration rates and abundance in marine prokaryoplankton. Nature 612, 764–770. doi: 10.1038/s41586-022-05505-3
Niebergall A. K., Traylor S., Huang Y., Feen M., Meyer M. G., McNair H. M., et al. (2023). Evaluation of new and net community production estimates by multiple ship-based and autonomous observations in the Northeast Pacific Ocean. Elementa: Sci. Anthropocene 11, 107. doi: 10.1525/elementa.2021.00107
Pomeroy L. R. (1974). The ocean’s food web, A changing paradigm. BioScience 24, 499–504. doi: 10.2307/1296885
Pomeroy L. R., Johannes R. E. (1966). Total plankton respiration. Deep-Sea Res. Oceanogr. Abstr. 13, 971–973. doi: 10.1016/0011-7471(76)90915-3
Pomeroy L. R., Sheldon J. E., Sheldon W. M., Peters F. (1995). Limits to growth and respiration of bacterioplankton in the Gulf of Mexico. Mar. Ecol. Prog. Ser. 117, 259–268. doi: 10.3354/meps117259
Precision Sensing (2024) Product: Oxygen Sensor Spot SP-PSt3-NAU. Available online at: https://www.presens.de/oemcustom/detail/oxygen-sensor-spot-sp-pst3-nau (Accessed April 30, 2024).
Robinson C. (2019). Microbial respiration, the engine of ocean deoxygenation. Front. Mar. Sci. 5. doi: 10.3389/fmars.2018.00533
Robinson C., Serret P., Tilstone G., Teira E., Zubkov M. V., Rees A. P., et al. (2002). Plankton respiration in the eastern Atlantic ocean. Deep Sea Res. Part I: Oceanogr. Res. Pap. 49, 787–813. doi: 10.1016/S0967–0637(01)00083–8
Savidge G., Turner D. R., Burkill P. H., Watson A. J., Angel M. V., Pingree R. D., et al. (1992). The BOFS 1990 spring bloom experiment: Temporal evolution and spatial variability of the hydrographic field. Prog. Oceanogr. 29, 235–281. doi: 10.1016/0079-6611(92)90005-K
Sherry N. D., Boyd P. W., Sugimoto K., Harrison P. J. (1999). Seasonal and spatial patterns of heterotrophic bacterial production, respiration, and biomass in the subarctic NE Pacific. Deep Sea Res. Part II Top. Stud. Oceanogr. 46, 2557–2578. doi: 10.1016/S0967-0645(99)00076-4
Siegel D. A., Buesseler K. O., Behrenfeld M. J., Benitez-Nelson C. R., Boss E., Brzezinski M. A., et al. (2016). Prediction of the export and fate of global ocean net primary production: The EXPORTS science plan. Front. Mar. Sci. 3. doi: 10.3389/fmars.2016.00022
Siegel D. A., Cetinić I., Graff J. R., Lee C. M., Nelson N., Perry M. J., et al. (2021). An operational overview of the EXport Processes in the Ocean from RemoTe Sensing (EXPORTS) Northeast Pacific field deployment. Elem. Sci. Anthr. 9, 107. doi: 10.1525/elementa.2020.00107
Stephens B. M., Fox J., Liu S., Halsey K. H., Nicholson D. P., Traylor S., et al. (2023a). Influence of amino acids on bacterioplankton production, biomass and community composition at Ocean Station Papa in the subarctic Pacific. Elem. Sci. Anthr. 11, 95. doi: 10.1525/elementa.2022.00095
Stephens B. M., Opalk K., Petras D., Liu S., Comstock J., Aluwihare L. I., et al. (2020). Organic matter composition at Ocean Station Papa affects its bioavailability, bacterioplankton growth efficiency and the responding taxa. Front. Mar. Sci. 7. doi: 10.3389/fmars.2020.590273
Stephens B. M., Stincone P., Petras D., English C., Opalk K., Giovannoni S. J., et al. (2023b)Oxidation state of bioavailable dissolved organic matter influences bacterioplankton respiration and growth efficiency [Preprint] (Accessed Jan 1, 2024). doi: 10.21203/rs.3.rs-2658570/v1
Vandermeulen R. A., Chaves J. E. (2022) Aquatic primary productivity field protocols for satellite validation and model synthesis (International Ocean Colour Coordinating Group (IOCCG). Available online at: https://repository.oceanbestpractices.org/handle/11329/2059 (Accessed September 2, 2022).
Villegas-Mendoza J., Cajal-Medrano R., Maske H. (2015). INT (2-(4-iodophenyl)-3-(4-nitrophenyl)-5-(Phenyl) tetrazolium chloride) is toxic to prokaryote cells precluding its use with whole cells as a proxy for in vivo respiration. Microb. Ecol. 70, 1004–1011. doi: 10.1007/s00248-015-0626-3
Wikner J., Panigrahi S., Nydahl A., Lundberg E., Båmstedt U., Tengberg A. (2013). Precise continuous measurements of pelagic respiration in coastal waters with Oxygen Optodes. Limnol. Oceanogr-Meth. 11, 1–15. doi: 10.4319/lom.2013.11.1
Williams P.J.l. (1984). “A Review of Measurements of Respiration Rates of Marine Plankton Populations,” in Heterotrophic Activity in the Sea NATO Conference Series. Eds. Hobbie J. E., Williams P.J.l. (Springer US, Boston, MA), 357–389. doi: 10.1007/978–1-4684–9010-7_16
Keywords: microbial respiration, dissolved oxygen, optode, size-fractionated, marine, ocean, bacteria, carbon
Citation: Cohn MR, Stephens BM, Meyer MG, Sharpe G, Niebergall AK, Graff JR, Cassar N, Marchetti A, Carlson CA and Gifford SM (2024) Microbial respiration in contrasting ocean provinces via high-frequency optode assays. Front. Mar. Sci. 11:1395799. doi: 10.3389/fmars.2024.1395799
Received: 04 March 2024; Accepted: 14 May 2024;
Published: 05 June 2024.
Edited by:
Jun Sun, China University of Geosciences (Wuhan), ChinaReviewed by:
Helmut Maske, Center for Scientific Research and Higher Education in Ensenada (CICESE), MexicoCopyright © 2024 Cohn, Stephens, Meyer, Sharpe, Niebergall, Graff, Cassar, Marchetti, Carlson and Gifford. This is an open-access article distributed under the terms of the Creative Commons Attribution License (CC BY). The use, distribution or reproduction in other forums is permitted, provided the original author(s) and the copyright owner(s) are credited and that the original publication in this journal is cited, in accordance with accepted academic practice. No use, distribution or reproduction is permitted which does not comply with these terms.
*Correspondence: Scott M. Gifford, sgifford@email.unc.edu
†Present address: Brandon M. Stephens, Institute of Oceanography, National Taiwan University, Taipei, Taiwan
Disclaimer: All claims expressed in this article are solely those of the authors and do not necessarily represent those of their affiliated organizations, or those of the publisher, the editors and the reviewers. Any product that may be evaluated in this article or claim that may be made by its manufacturer is not guaranteed or endorsed by the publisher.
Research integrity at Frontiers
Learn more about the work of our research integrity team to safeguard the quality of each article we publish.