 Blanda A. Matzenbacher
 Geert-Jan A. Brummer
 Maarten A. Prins
 Jan-Berend W. Stuut
95% of researchers rate our articles as excellent or good
Learn more about the work of our research integrity team to safeguard the quality of each article we publish.
Find out more
ORIGINAL RESEARCH article
Front. Mar. Sci. , 24 June 2024
Sec. Ocean Observation
Volume 11 - 2024 | https://doi.org/10.3389/fmars.2024.1367786
This article is part of the Research Topic Aerosol Deposition in the Ocean: Drivers and Biogeochemical Effects View all 5 articles
In this study we present data collected between August 2017 and December 2018 from submarine sediment trap M1 located in the eastern tropical North Atlantic and determine lithogenic and biogenic fluxes, and grain-size distributions of aerosol dust. An unprecedented high sampling resolution of four days in combination with satellite imagery allowed the identification of thirteen major dust events of two types within the 468-day series. Seven dust events were classified as high-flux events identified by a deposition of >=25 mg m-2 d-1. The average dust deposition rate increased by 461.3% during these types of events. The remaining six events were characterized by a high composition of giant particles (>7.3 vol%). Seasonal variations of dust flux were recorded, with highest fluxes observed in spring at an average deposition rate of 14.8 mg m-2 d-1, and lowest fluxes in fall with an average rate of 8.6 mg m-2 d-1. The estimated total dust flux in the tropical North Atlantic was 4040.02 mg m-2 y-1. We suggest that most of the summer dust was likely transported over the sampling site at high altitudes while winter transport occurred closer to the sea surface, resulting in generally higher background fluxes. Grain-size distributions exhibited seasonal variations with increased occurrences of giant particles (>62.5 μm) in fall 2017 and spring, and less occurrences in winter and fall 2018. Grain-size sorting was high in spring and most variable in summer. Precipitation did not affect depositional fluxes or grain-size distributions of the aeolian dust significantly. Organic matter was deposited continuously at the sampling site with a deposition rate ranging from 14.4–862.25 mg m-2 d-1. Organic matter fluxes increased by 199.5% during high-flux dust events but decreased by 13.6% during anomalous grain-size events. Spring experienced the highest number of dust events (n=5). This unprecedented high-resolution dataset of dust deposition in marine sediment-traps enabled the distinction of dust events and their relation to organic matter flux. This suggests the possibility of a dust fertilization or mineral ballasting effect.
The study of the many relationships between desert dust and Earth’s climate leads to a better quantification of its role in the global climate and thus in predicting future climate scenarios. Aerosol dust has been studied for its abilities to reflect and absorb incoming solar radiation (Lafon et al., 2006; Ryder et al., 2013), its effects on cloud nucleation (Atkinson et al., 2013), fertilization of the oceans (Mahowald et al., 2009), atmospheric carbon sequestration (e.g., Fischer and Karakas, 2009; Pabortsava et al., 2017), and removal of atmospheric methane (CH4; Van Herpen et al., 2023), all of which directly affect the climate. Furthermore, understanding the annual dust cycle provides insights into changing dust patterns in paleoclimate scenarios (Stuut et al., 2001). With this knowledge, past shifts of the Intertropical Convergence Zone (ITCZ) can be determined, thus advancing the understanding of past climate changes in North Africa (Tjallingii et al., 2008).
Around 585–759 Tg of aerosol dust is emitted from the Sahara Desert yearly (Laurent et al., 2008), of which 136–222 Tg are estimated to land in the tropical Atlantic Ocean (Yu et al., 2019). Trade winds are responsible for the transport and deposition of dust particles across the Atlantic throughout the year (Carlson and Prospero, 1972; Engelstaedter et al., 2006; Fiedler et al., 2015). Due to the seasonally shifting position of the ITCZ (Nicholson et al., 2018), and therefore also the concentration and latitudinal position of the trade winds, a change in precipitation and wind patterns occurs over the North African continent and the tropical North Atlantic (Nicholson, 2000). These highly variable meteorological conditions result in complicated dust emission-transport-deposition patterns, on both temporal and spatial scales, including wet and dry dust deposition, differences in dust fluxes, grain-size distributions, and sorting heterogeneities (Friese et al., 2016; van der Does et al., 2016, 2020; van der Does et al., 2016, 2020, 2021a, 2021b).
The Sahara Air Layer (SAL) is the dominant air mass above North Africa during summer months (June-August). It travels at 3–7km above sea level (Carlson and Prospero, 1972; Tsamalis et al., 2013) and is known to transport aerosol dust particles at these high altitudes over long distances (van der Does et al., 2016). Because of the high altitude transport, dust deposition in the Atlantic close to the African continent is generally low compared to other seasons (Schepanski et al., 2009; van der Does et al., 2021a). However, the summer monsoon is characterized by a northward shift of the ITCZ and leads to increased wet deposition of dust over the tropical North Atlantic as the atmosphere is flushed out of dust particles (Yu et al., 2019). Thus, summer dust deposition is mainly controlled by precipitation (van der Does et al., 2021a). Additionally, high temperatures over North Africa in summer can lead to convection of air masses in the Sahara Desert which facilitates the emission of coarse dust particles (Heinold et al., 2013). Grains as large as 450 μm have been found 3500 km west of the African west coast as a result of interplaying forces (van der Does et al., 2018; Adebiyi et al., 2023). Therefore, less sorted grain-size distributions have been found in summer-deposited samples (Friese et al., 2016).
Wind patterns shift from the high-altitude SAL layer in summer to the low-lying Harmattan winds traveling below 500m AMSL (above mean sea level) in winter (Fiedler et al., 2015). Because these low-altitude winds transport dust particles closer to the ocean surface, dust deposition offshore northwest Africa increases in winter months. Precipitation over the tropical North Atlantic mainly ceases in winter due to a southward shift of the ITCZ, and dry deposition of dust particles controlled by gravitation prevails (van der Does et al., 2020). Reduced precipitation and a lack of convection over North Africa lead to a reduction of deposited coarse grains. As a result, grain-size distributions of dust deposited in winter are generally better sorted than in summer (van der Does et al., 2021a).
Aerosol dust particles are known to be an important source of nutrients in oligotrophic regions of the Atlantic Ocean where upwelling and riverine input are low (Pabortsava et al., 2017; Korte et al., 2018). Nutrient availability increases when aerosol mineral dust undergoes atmospheric acidic dissolution such as precipitation (Nenes et al., 2011) but can also supply nutrients without rain input (Korte et al., 2018). This fertilization by dust particles can cause phytoplankton blooms in the surface oceans which take up carbon dioxide (CO2) from the atmosphere (Jickells et al., 2005; Guerreiro et al., 2017). The CO2 uptake of the biota and subsequent sinking of this organic matter to the deep sea is called the marine biological carbon pump. Dust deposition in remote ocean regions has been attributed to enhancing this process via nutrient supply and (bio)mineral ballasting (Bressac et al., 2014; Pabortsava et al., 2017). The marine biological carbon pump is affected by mineral ballasting through the process of lithogenic particles forming aggregates with particulate organic matter in the upper water column. These aggregates, called Marine Snow, enhance particle sinking velocities (van der Jagt et al., 2018). Additionally, the formation of carbonate and opal shells of calcifying and silicifying organisms contributes to biomineral ballast, thereby accelerating organic matter deposition in the deep sea (Le Moigne et al., 2012; Wilson et al., 2012). Dust fertilization and (bio)mineral ballasting play an intricate role in the marine carbon pump and are both influenced in the tropical Atlantic Ocean by Saharan dust activity. The quantification of Saharan dust deposition and event occurrences provides better understanding of their roles in centennial to millennial climate changes and future ramifications.
Land-based dust monitoring stations have observed an increase in dust storm activity since the 1950s (Goudie and Middleton, 2001; Mulitza et al., 2010). Dust storms form when cool, high latitude winds clash with hot Saharan air masses, leading to strong cold fronts (Knippertz, 2014). These can lead to an anomalous increase in dust flux (Nowald et al., 2015) and/or an increase in coarse-grain uplift and deposition when strong winds are coupled with convective systems over the Sahara (Friese et al., 2016). Here we report modern seasonal deposition patterns of aerosol dust and organic matter of unprecedented high-resolution in the tropical North Atlantic Ocean. We aim to detect dust fluxes of short time periods in which single dust events can be identified. Fluxes help to understand the overall transport of lithogenic particles to the North Atlantic and geophysical components such as grain size play an important role in determining e.g. seasonal shifts in deposition. The variations of dust flux and geophysical properties between seasons and dust events provide detailed insights into the depositional patterns of aerosol dust. As such, we expect fluctuations of geophysical properties of dust particles between periods of low and high dust activity which could have varying effects on carbon export. We suspect that Saharan dust outbreaks are linked to an increase in the organic matter sink in the Atlantic Ocean off the North African coast possibly due to fertilization and mineral ballasting effects. With higher resolution sampling we aim to reveal further details on the correlations between lithogenic and organic fluxes. By monitoring this interplay, factors can be determined that impact primary productivity in the surface ocean and that lead to the deposition of organic matter on the sea floor.
Here, a time series of unprecedented high-resolution dust monitoring in the tropical North Atlantic is presented. Sampling intervals consisted of four days for a time span of 468 days from summer 2017 to fall 2018. Submarine sediment traps were utilized for uninterrupted dust and organic matter collection. An automated surface buoy was used to collect atmospheric (dry) dust simultaneously but at longer time intervals (12–24 days) (see section 2.2). The atmospheric dust collection served as a medium to compare geophysical properties of marine-deposited dust to air-collected dust.
Mooring M1 was located at 12°N, 23°W in the tropical North Atlantic Ocean (Supplementary Figure 1). It was kept in place by a 1200kg steel anchor at 5064m depth. Three funnel-shaped KUM sediment traps were mounted to a 7mm steel rope and have a collection area of 0.5m2 each. They were deployed approximately 100m apart at depths 1074m, 1165m, and 1275m, referred to as traps U (upper), M (middle), and L (lower), respectively (Kucera et al., 2019; Zonneveld et al., 2019). The traps sampled at different time periods in order to span the collection period; L from August 2017-January 2018, M from February-June 2018, and U from July-November 2018 (Supplementary Table 1). In the 2017/18 time series, the traps were equipped with rotating carrousels each carrying 39 bottles in which the collected material was kept (Supplementary Figure 2A). The bottles contained densified and filtered seawater, mercury chloride (HgCl2) as a biocide, and borax (Na2B4O7*10H2O) as a pH-buffer. The carrousels were programmed to rotate every four days between August 27th, 2017 (starting at 12:00h) until December 8th, 2018 (Kucera et al., 2019; Zonneveld et al., 2019). The sampling location was in an oligotrophic part of the ocean where upwelling does not occur (Korte et al., 2017). Previous measurements of current velocities at the depths of the sediment traps yielded an average of <10 cm s-1 and never exceeded 12 cm s-1. This ensured that collected particles settled locally (vertically) and were less likely transported to the sampling site from elsewhere. In addition, the sediment traps were located far enough from the African continent that riverine input was highly unlikely (van der Does et al., 2016). Lithogenic material was therefore expected to originate solely from aerosol dust sources. Additionally, the lowest sediment trap was located 3789m above the seafloor, high enough to exclude deposition of resuspended material from below (van der Does et al., 2016).
The dust-collecting subsurface buoy (BL), constructed by the Royal Netherlands Institute of Sea Research, was moored at 11°25’N, 22°56’W in close proximity to sediment-trap mooring M1 (Supplementary Figure 1) and was programmed to collect dust during the same time period. The buoy was equipped with (n=24) 47 mm polycarbonate filters of 0.2 μm pore size and sampled dust in situ directly from the atmosphere by pumping air through the filters for four hours per day if the meteorological conditions were right. The buoy was set-up to collect solely dry dust, therefore, dust collection only took place when there was no precipitation. Additionally, to avoid sampling salt from sea spray, air was filtered only when wind speeds did not exceed 20 m s-1. Precipitation was monitored by a rain sensor, while wind speed was monitored by a meteorological sensor, which were both installed on the buoy (Supplementary Figure 2B). For winter samples (Dec 1 – Mar 19) a sampling period of 12 days was chosen since the dust load was expected to be high. For the remaining period, filters sampled for 24 days each (Kucera et al., 2019; Zonneveld et al., 2019).
The collected material in the sampling bottles of the three sediments traps (n=3x39) were pre-treated at the Royal Netherlands Institute for Sea Research (NIOZ) on Texel. The material was washed to remove mercury chloride, borax, and salt. Not all samples contained the same amount of material. For those with an estimated volume larger than 0.5 g (n=28) were split into five subsamples (Supplementary Table 1). All (sub)samples were filtered on pre-weighed 47 mm polycarbonate filters of 0.2 μm pore size and refrigerated. Two of the sediment-trap samples went missing (L37, M28) and two contained too little material to be considered for this study (U38, U39). Sample details are listed in Supplementary Table 1.
The dried samples were subsequently dry-oxidized at 90°C in a Low Temperature Asher (LTA) from TRACERlab to combust soft organic tissue and polycarbonate filters. To eliminate any residual organic matter, including carbonate shells and remnants of the polycarbonate filter, and to chemically isolate the terrigenous sediment fraction, we followed the procedure outlined by McGregor et al. (2009) which is shortly described here. The samples were suspended in 20 ml Milli-Q water together with 2 ml 10% hydrochloric acid (HCl). The mixture was brought to a boil for exactly 1 minute to remove calcium carbonates, then diluted in reversed osmosis (R/O) water and left to settle overnight. The solution water was then reduced to approximately 20 ml by decanting. Subsequently, 20 mg sodium hydroxide pellets were added to the suspended material and brought to a boil for exactly 10 minutes to remove biogenic silica and neutralize the mixture. The beakers were again filled with R/O water to wash the samples and left to settle overnight. Surface-buoy samples skipped the steps to remove marine organic matter since the filters only contained lithogenic material collected from the atmosphere.
The samples were freeze-dried and weighed which yielded the dust weight, hereafter referred to as dust flux. The organic matter weight was calculated by subtracting dust flux and filter weight from bulk weight obtained after oven-drying, resulting in the organic flux. For missing samples L37 and M28 dust and organic fluxes were estimated by taking the average flux of neighboring samples. Samples containing >=50 mg lithogenic material in a sample bottle were considered dust events. The daily fluxes per square meter were then calculated by dividing the dust and organic fluxes by 4 (4-day sampling period), and multiplying by 2 (sediment-trap collection area is 0.5m2).
Grain-size measurements were conducted on a Beckman Coulter Laser Diffraction Particle Size Analyzer LS13320 (LDA) at NIOZ. The micro liquid module (MLM) was used to detect fine grains ranging from 0.400 μm to 2,000 μm (van der Does et al., 2016). A magnetic stirrer kept the particles in suspension. Immediately before grain-size measurements, two drops sodium pyrophosphate (Na4P2O7*10H2O) were added to the samples to facilitate complete disintegration of aggregates. The particles were kept in suspension in degassed water to avoid bubbles interfering with the size measurements. The resulting grain-size distributions were given as vol% versus 90 size bins. Giant particles were defined as >62.5 μm as proposed by Adebiyi et al. (2023). The LS13320 software provides the meta data of the analysis and includes the parameters mean, modal, and median grain size, and standard deviation (SD). The grain-size sorting of a sample can be inferred by its SD (Friese et al., 2016). The lower the SD value, the more homogeneous the sample. A limitation of the LDA is that particles smaller than 0.4 μm and larger than 100 μm are likely to remain undetected due to their limited presence. Samples containing an anomalous amount of giant particles (>7.3%, >62.5 μm) in addition to coinciding with concurrent dust plumes on satellite imagery are referred to as potential dust events.
For both types of dust events, identified by anomalous grain-size composition and increased dust flux, satellite images from the EOSDIS Worldview database (NASA: Earth Science Data, RRID: SCR_005078) were scanned for dust plumes above the sampling site on the days prior to the deposits. Dust particle settling rates were calculated using the number of days of lag between dust plume appearance and the deposition dates in the sediment traps considering their different depths (Brust et al., 2011; Bressac et al., 2014). Since each sampling bottle collected for four days, the mid-date was chosen to calculate the particle settling rate with error bars displaying the remaining possible deposition days (Supplementary Figure 5).
Area-averaged aerosol optical depth (AOD) data from MODIS-Terra at 550 nm wavelength (dark target) in daily resolution of the area 11–13°N, 19–21°W for the sampling period were obtained from the Giovanni online data system which is a product of the NASA GES DISC (NASA: Earth Science Data, RRID: SCR_005078). AOD is a unitless value. It was averaged at a location 2–4 degrees east of the sediment traps because of an assumed lag in deposition time. A limitation of satellite derived AOD data relates to other types of aerosols such as water vapor, black carbon, sulfates, and sea spray that can deter the signal and are included in AOD measurements (Nabat et al., 2012). It is therefore difficult to isolate solely aerosol dust from AOD.
Area-averaged precipitation data provided by the Tropical Rainfall Measurement Mission (TRMM) were retrieved from the Giovanni online data system (NASA: Earth Science Data, RRID: SCR_005078) in mm d-1 for the period of sampling and the area over the sampling site (11–13°N, 22–24°W). It should be kept in mind that precipitation is not always accurately measured by satellites as light rain events are often not recorded (Behrangi et al., 2014) but potentially also deposit dust.
Area-averaged chlorophyll-a concentration in mg m-3 from MODIS-Aqua was retrieved from the Giovanni online data system (NASA: Earth Science Data, RRID: SCR_005078) in 8-day resolution with a spatial resolution of 4 km of the area 11.5–12.5°N, 23.5–22.5°W. Chlorophyll-a data does not exist for large intervals of the sampling period possibly due to cloud coverage preventing satellites from gathering data. Therefore, chlorophyll-a is used solely for visual interpretation to validate our organic flux measurements.
The dust fluxes ranged from 0–90.0 mg m-2 d-1. Highest dust deposition occurred in the months September 2017 (609.6 mg m-2) and April 2018 (916 mg m-2) (Figure 1; Supplementary Table 1). Least dust deposition occurred in the months November 2017 (132.4 mg m-2) and August 2018 (144.8 mg m-2). The average daily dust deposition during the sampling period (n=468 days) was 11.1 mg m-2. High-flux dust events referred to as E1-E7 in Figure 1 were defined by dust fluxes >=25 mg m-2 d-1 and were observed in samples L04 (E1, fall 2017), L35 (E2), M01 (E3), M05 (E4, winter), M22-M23 (E5, spring), M39 (E6, summer), and U37 (E7, fall 2018). Anomalous grain-size events were marked as G1-G6 in Figure 1 and will be discussed in sections 3.3 and 3.5. During high-flux events the average deposition rate of dust particles was 47.2 mg m-2 d-1, 10.7 mg m-2 d-1 during anomalous grain-size events, and 8.4 mg m-2 d-1 on normal dusty days. Satellite-derived AOD ranged from 0.05–2.41 for the entire sampling period, with an average daily AOD value of 0.48 in winter and fall 2017, 0.6 in spring, 0.62 in summer, and 0.44 in fall 2018 (Figure 1).
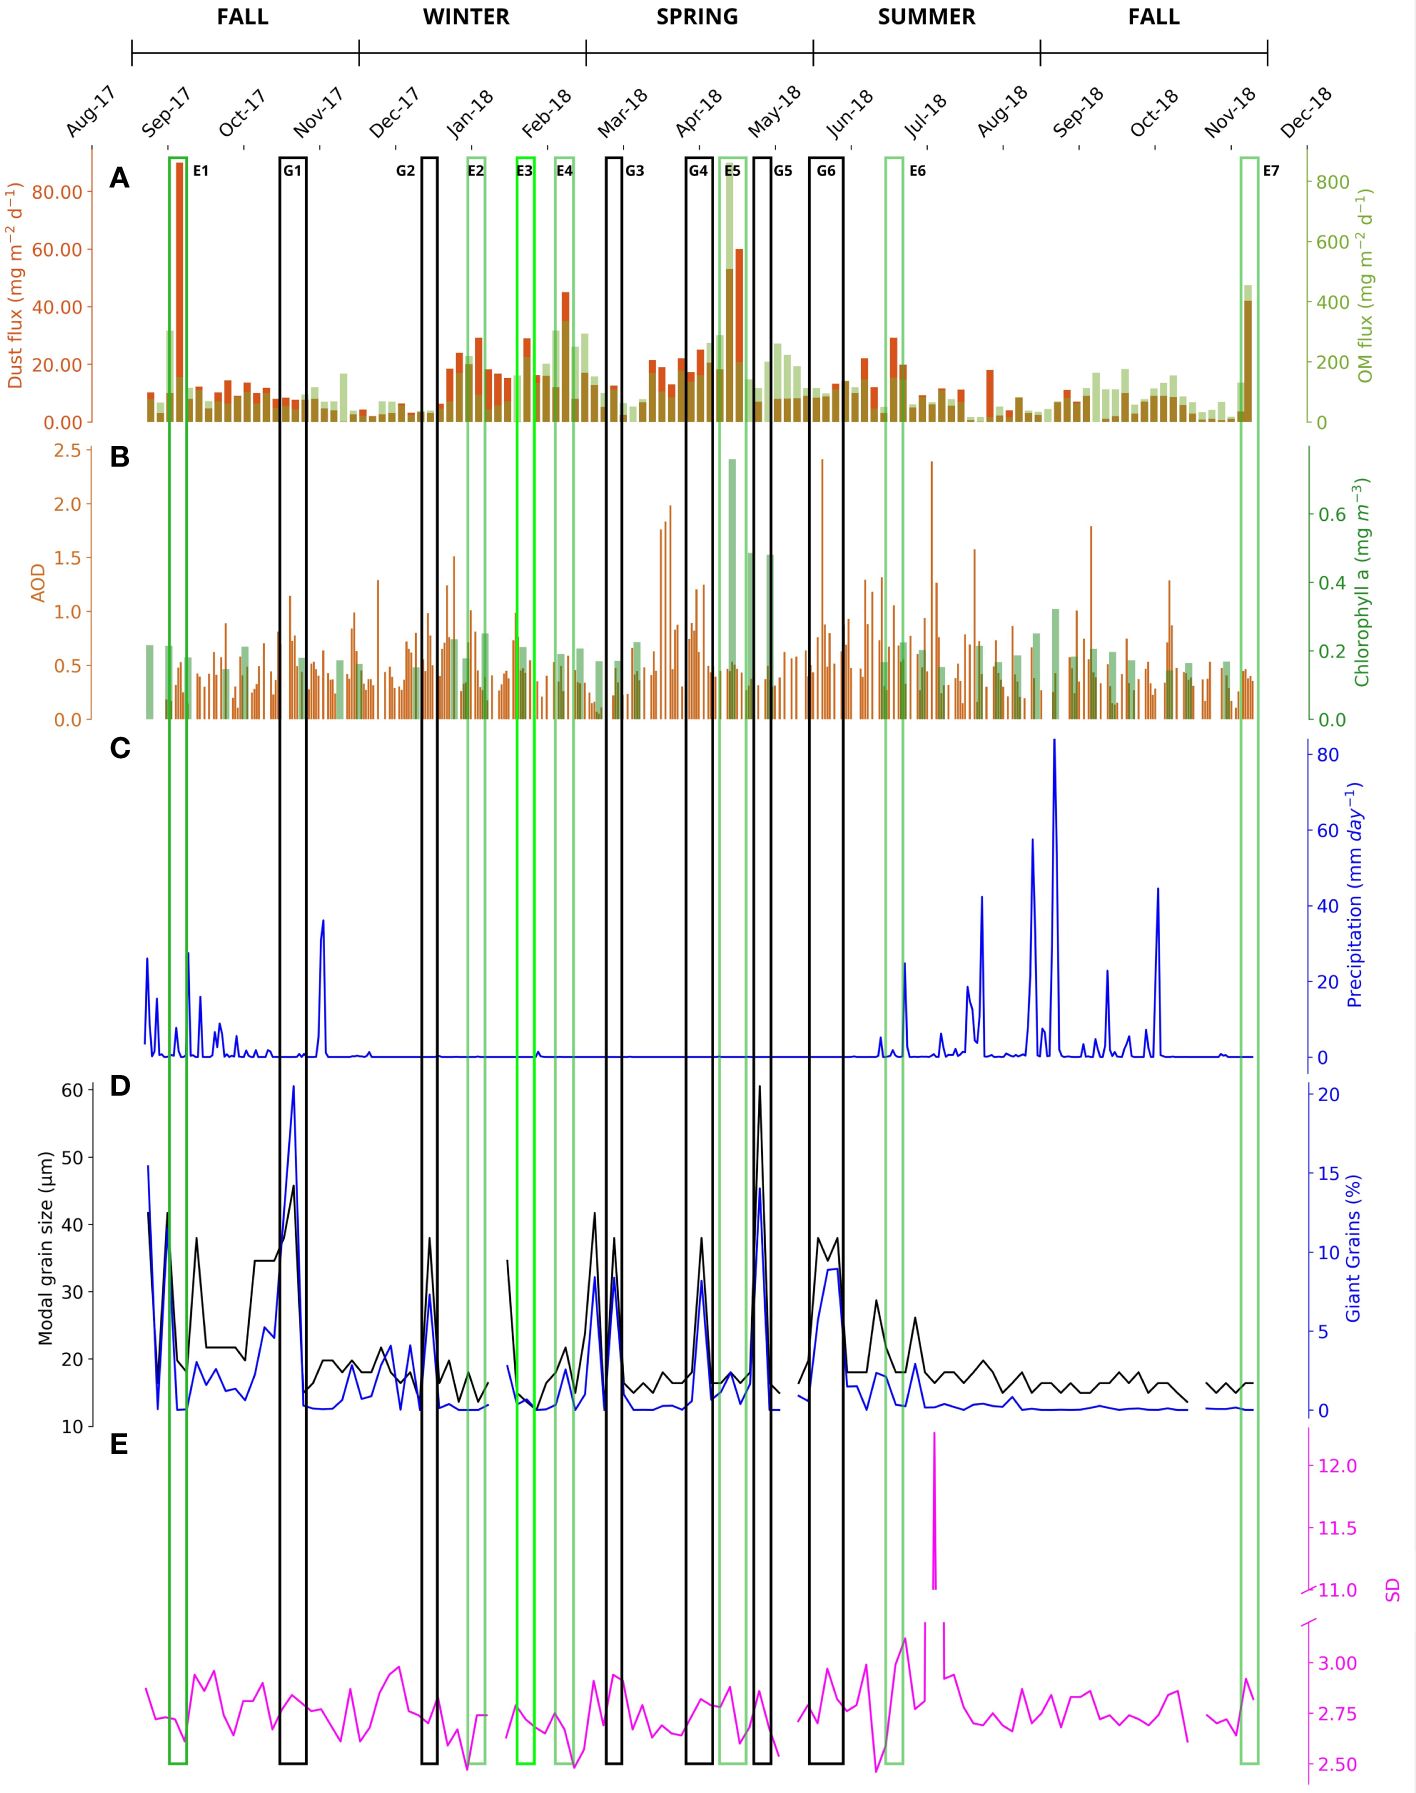
Figure 1 The time series is displayed in dust flux (orange bars) and organic matter flux (green bars) in mg m-2 day-1 (A). High-flux (E1-7) and anomalous grain size dust events (G1-6) are indicated. Note that OM flux is an order of magnitude higher than the dust flux. The data set is compared to AOD (orange bars) and chlorophyll-a data (green bars) (NASA Earth Science Data, RRID: SCR_005078) (B), as well as precipitation (C). Modal grain-size is displayed together with giant-particle fractions (D). The standard deviation of grain-size distributions indicates particle sorting (E).
Organic matter fluxes ranged from 28.8–1724.5 mg per sample which translates to 14.4–862.25 mg m-2 d-1 (Figure 1; Supplementary Table 1). The organic matter flux was thus approximately ten times higher than the dust flux. The largest deposition of organic matter was found in sample M22 (1724.5 mg) collected in April 2018, which also correlates to event E5. Lowest deposition was found in sample U12 (28.8 mg) collected in August 2018. Highest monthly organic matter fluxes occurred in April 2018 (7806.8 mg m-2), and lowest in August 2018 (928.32 mg m-2). The organic matter flux during high-flux dust events was 306.5 mg m-2 d-1, 88.4 mg m-2 d-1 during anomalous grain-size events, and 102.3 mg m-2 d-1 on normal dusty days. Area-averaged chlorophyll-a peaks occurred in the months of April and May 2018 (Figure 1). Since twenty out of fifty-seven satellite-derived chlorophyll-a data points were missing possibly due to cloud coverage, it made it difficult to compare the dataset with organic matter fluxes from this study. However, especially event E5 shows a correspondence between chlorophyll-a and organic matter deposition.
Grain-size distributions of the sediment-trap dust samples ranged from 0.4–140.1 μm (Figure 2; Supplementary Table 1). Finer and coarser grains below and above this range may have been present but were possibly left undetected by the LDA. An average of 36.9 vol% of grains of all samples exhibited grain-sizes below 10 μm, while an average of 63.1 vol% exhibited sizes between 10–100 μm. Only a tiny fraction (0.05 vol%) showed diameters larger than 100 μm. The giant-particle fraction (>62.5 μm) of samples ranged from 0–20.5 vol% (Figure 1; Supplementary Table 1). Samples L01 (summer 2017), L03, L15, L16 (fall 2017), L30, M08 (winter), M10, M19, M25 (spring), M32, and M33 (summer 2018) contained >7.3 vol% giant particles. These samples were initially considered as potential dust events (see section 3.5). Four filters from the surface-buoy (BL) contained sufficient material to conduct grain-size analysis. Grain-size distributions ranged from 0.393–390.95 μm (Figure 3; Supplementary Table 1). Giant-particle fractions ranged from 9.9–68.2 vol%, three times higher than the sediment-trap samples.

Figure 2 Grain-size distributions of individual samples colored by season collectively (A) and separated (B).
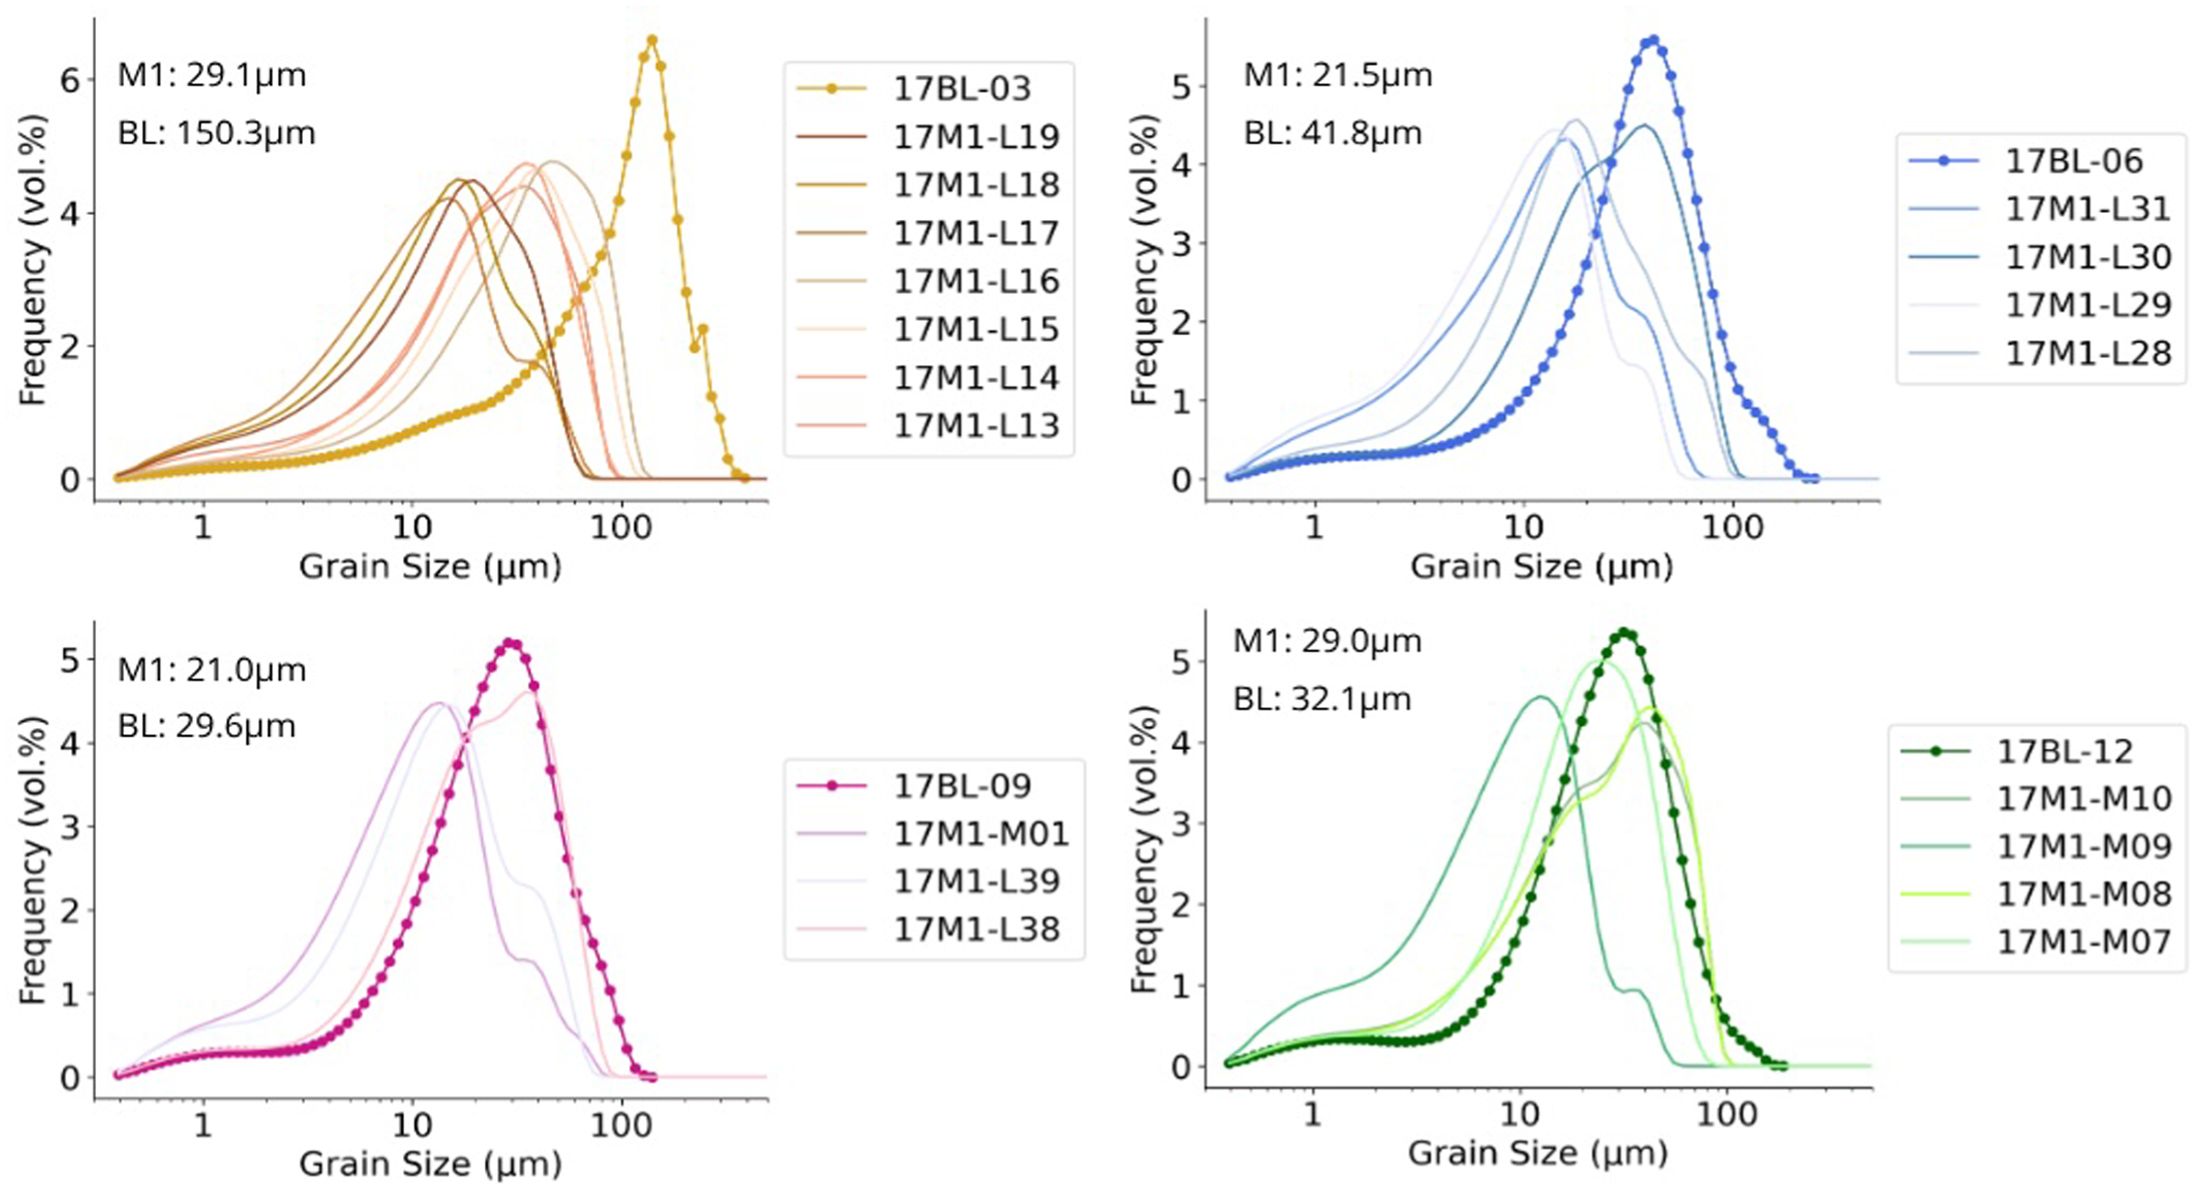
Figure 3 Grain-size distributions of the surface-buoy samples (BL) and simultaneous sediment-trap samples (M1).
Modal grain size demonstrates the geometric diameter range that occurs most frequently in a sample. Modal grain sizes of all sediment-trap samples ranged from 12.40–60.52 μm (Figure 2). The seasonal (average) mode of fall 2017 samples (n=23) was 19.8 (24.9 ± 9.4, 1σ) μm. Winter and summer samples (n=22 and 24, respectively) exhibited seasonal (average) modes of 18.0 (18.8 ± 6.6, 21.9 ± 8, 1σ, respectively) μm. Spring and fall 2018 samples (n=23 each) exhibited seasonal (average) modes of 16.4 (21.6 ± 11.9, 16.0 ± 1.1, 1σ, respectively) μm (Figure 2B). The seasonal means of fall 2017, winter, spring, summer, and fall 2018 samples were 14.8 ± 4.5, 12.0 ± 3.5, 12.5 ± 4.0, 13.5 ± 4.3, and 9.0 ± 0.9 (1σ), respectively. The occurrence of giant particles (>62.5 μm) amounted to 3.15%, 1.22%, 2.12%, 2.2%, and 0.05% in the above-mentioned seasons, respectively (Table 1). The modal grain sizes of the buoy samples ranged from 29.63–150.29 μm (Supplementary Table 1). Sample BL-03 (fall 2017) exhibited an anomalously high grain-size mode (150.29 μm), followed by sample BL-06 (41.8 μm), BL-12 (32.06 μm), and BL-09 (winter) with the smallest mode (29.63 μm).
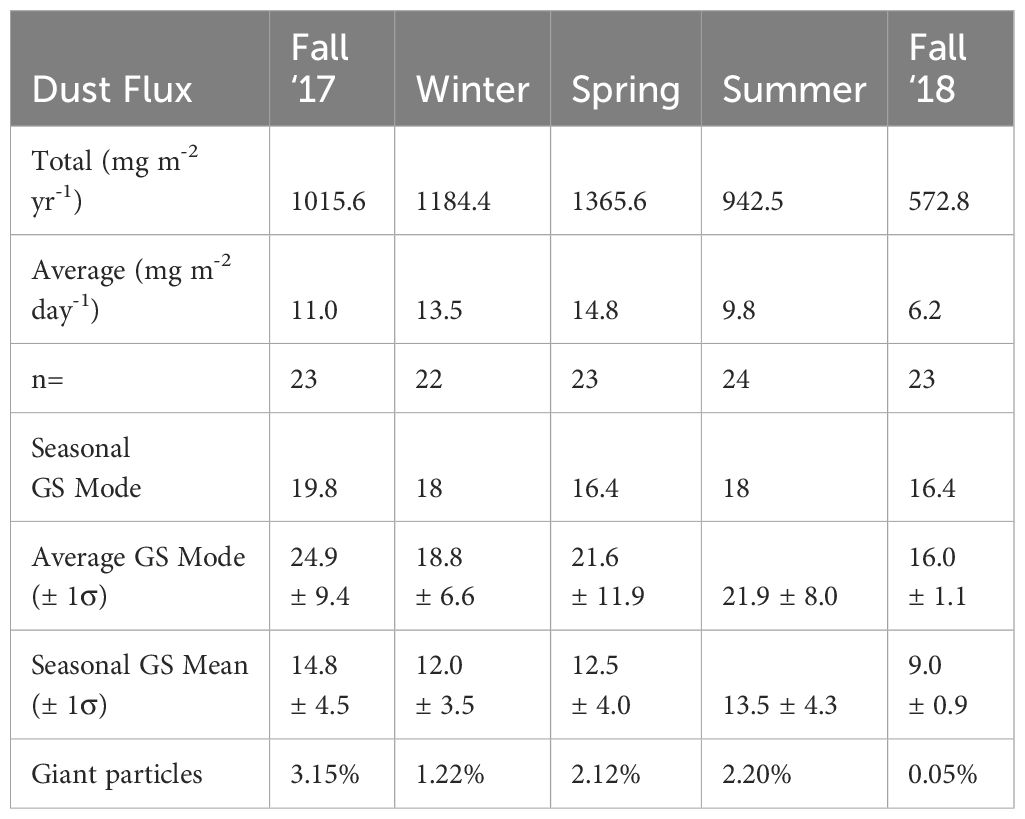
Table 1 Total and average dust fluxes, modal and mean grain size (GS), and giant particle occurrences per season.
The standard deviation (SD) of the sediment-trap samples ranged from 2.46–3.12 with the exception of one outlier (U04, summer) with a standard deviation of 12.26 (Figure 1). We suspected contamination of this sample although its modal grain-size value was in line with others (16.4 μm). Summer samples displayed the widest range of sorting (i.e. poorly sorted), followed by winter, spring, and fall samples with the narrowest range (i.e. well sorted) (Figure 4).
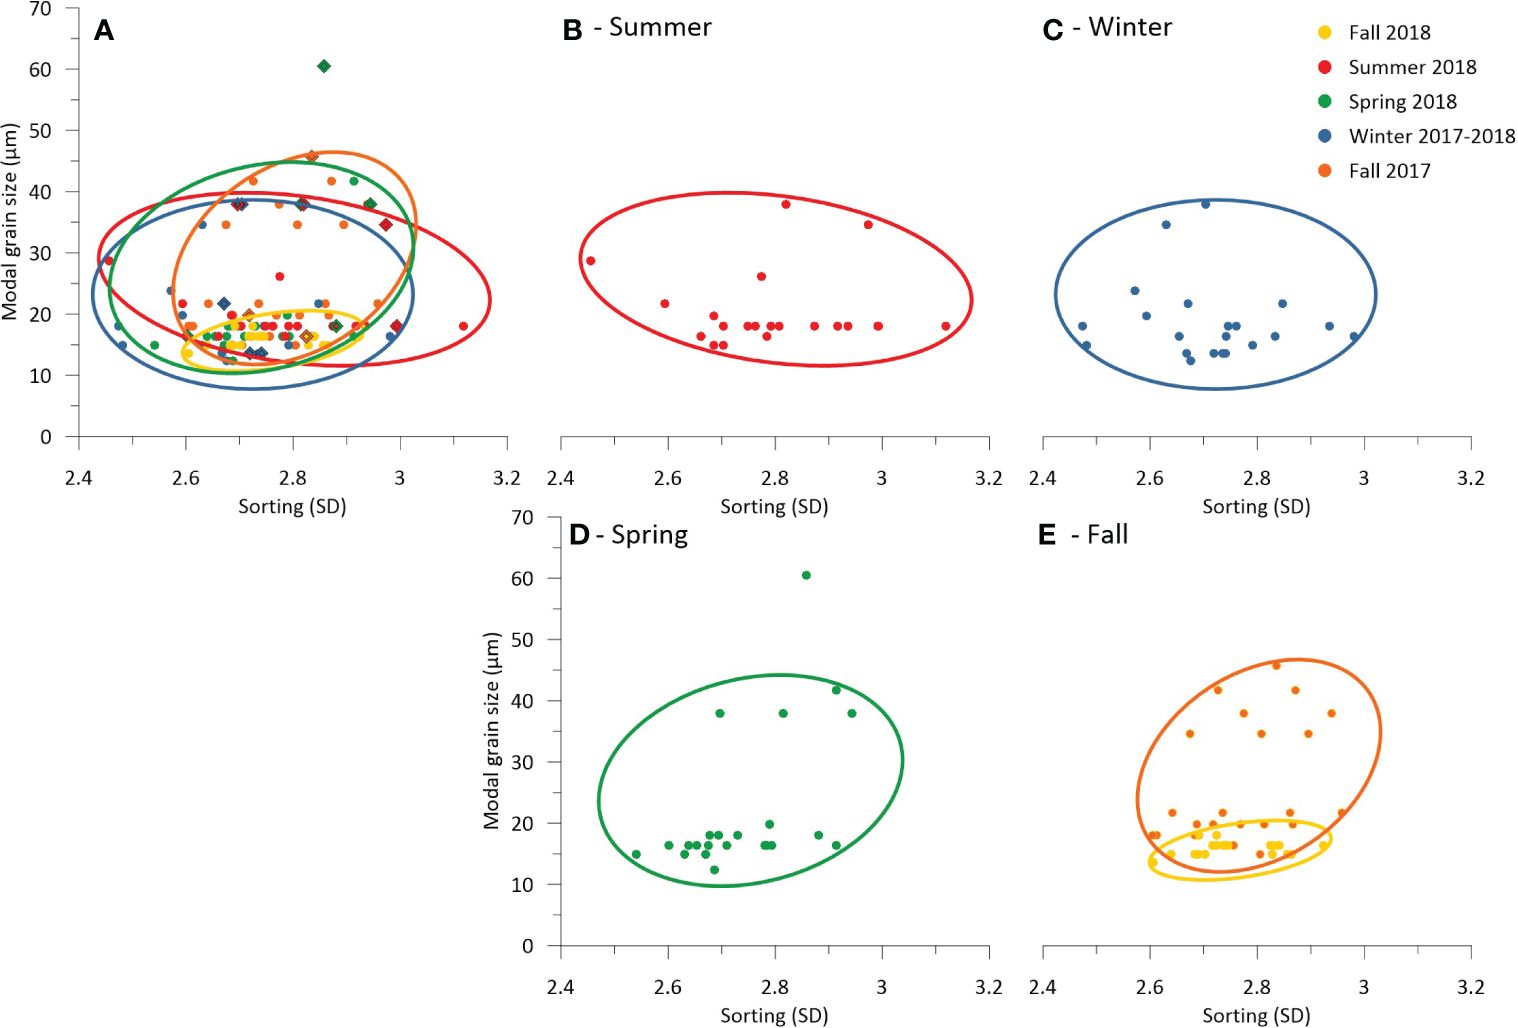
Figure 4 Modal grain size as a function of sorting displayed per season collectively (A) and separately (B–E). The lower the standard deviation, the better sorted the sample. Diamond shapes demonstrate dust events. Sample U04 was excluded due to an anomalously high SD (12.3).
At the start of sampling in August 2017, precipitation at the site ranged from 0–36.1 mm d-1 with an average of 2.8 mm d-1 until mid-November 2017 (Supplementary Table 1). Precipitation almost ceased completely from winter until early summer (December 2017 – June 2018) (Figure 1). From July to October 2018 an average of 4.9 mm of precipitation fell per day marking the heaviest rainfall during the sampling period. Precipitation peaked at 85.6 mm d-1 on September 8th, 2018. The rainiest months were August and September 2018 (235.6 mm, 222.17 mm, respectively), while the driest months were May and March 2018 (0.05 mm, 0.08 mm, respectively).
Seven dust events were identified by increased dust flux [>=25 mg m-2 d-1, L04 (fall 2017), L35, M01, M05 (winter), M22-M23 (spring), M39 (summer), U37 (fall 2018)] and the occurrence of dust plumes on satellite imagery (referred to as E1-E7; see Figure 5). Additionally, of the eleven samples containing an anomalous occurrence of giant particles [L01 (summer 2017), L03, L15-L16 (fall 2017), L30, M08 (winter), M10, M19, M25 (spring), M32-M33 (summer 2018)], eight were preceded by dust plumes spotted on the satellite imagery (L15–16, L30, M10, M19, M25, M32–33, Figure 6). It is therefore suggested that at least six anomalous grain-size events occurred in the time series (referred to as G1-G6; see Figure 6) as consecutive samples L15–16 and M32–33 were most likely deposited by the same event, adding up to at least thirteen dust events captured by the sediment traps during the 468-day time series (Table 2). On the days preceding the depositions of samples L01 (summer 2017), L03, and M08 (fall 2017), poor satellite image quality or cloud cover obscured the sky making it challenging to identify dust plumes (Supplementary Figure 3). Consequently, these deposits were not attributed to dust events although we acknowledge the possibility that they occurred during such events. Dust plumes were also spotted on satellite images on dates which showed no significant dust deposition in the sediment traps (Supplementary Figure 4). Dust plumes occurred 3–8 days prior to event deposition. Dust particle settling rates into the sediment traps ranged from 145.6–425.0 m d-1 (Supplementary Figure 5). The settling rates of samples containing giant particles were 1.4 times higher than those of high-flux events (Figure 7; Table 2).
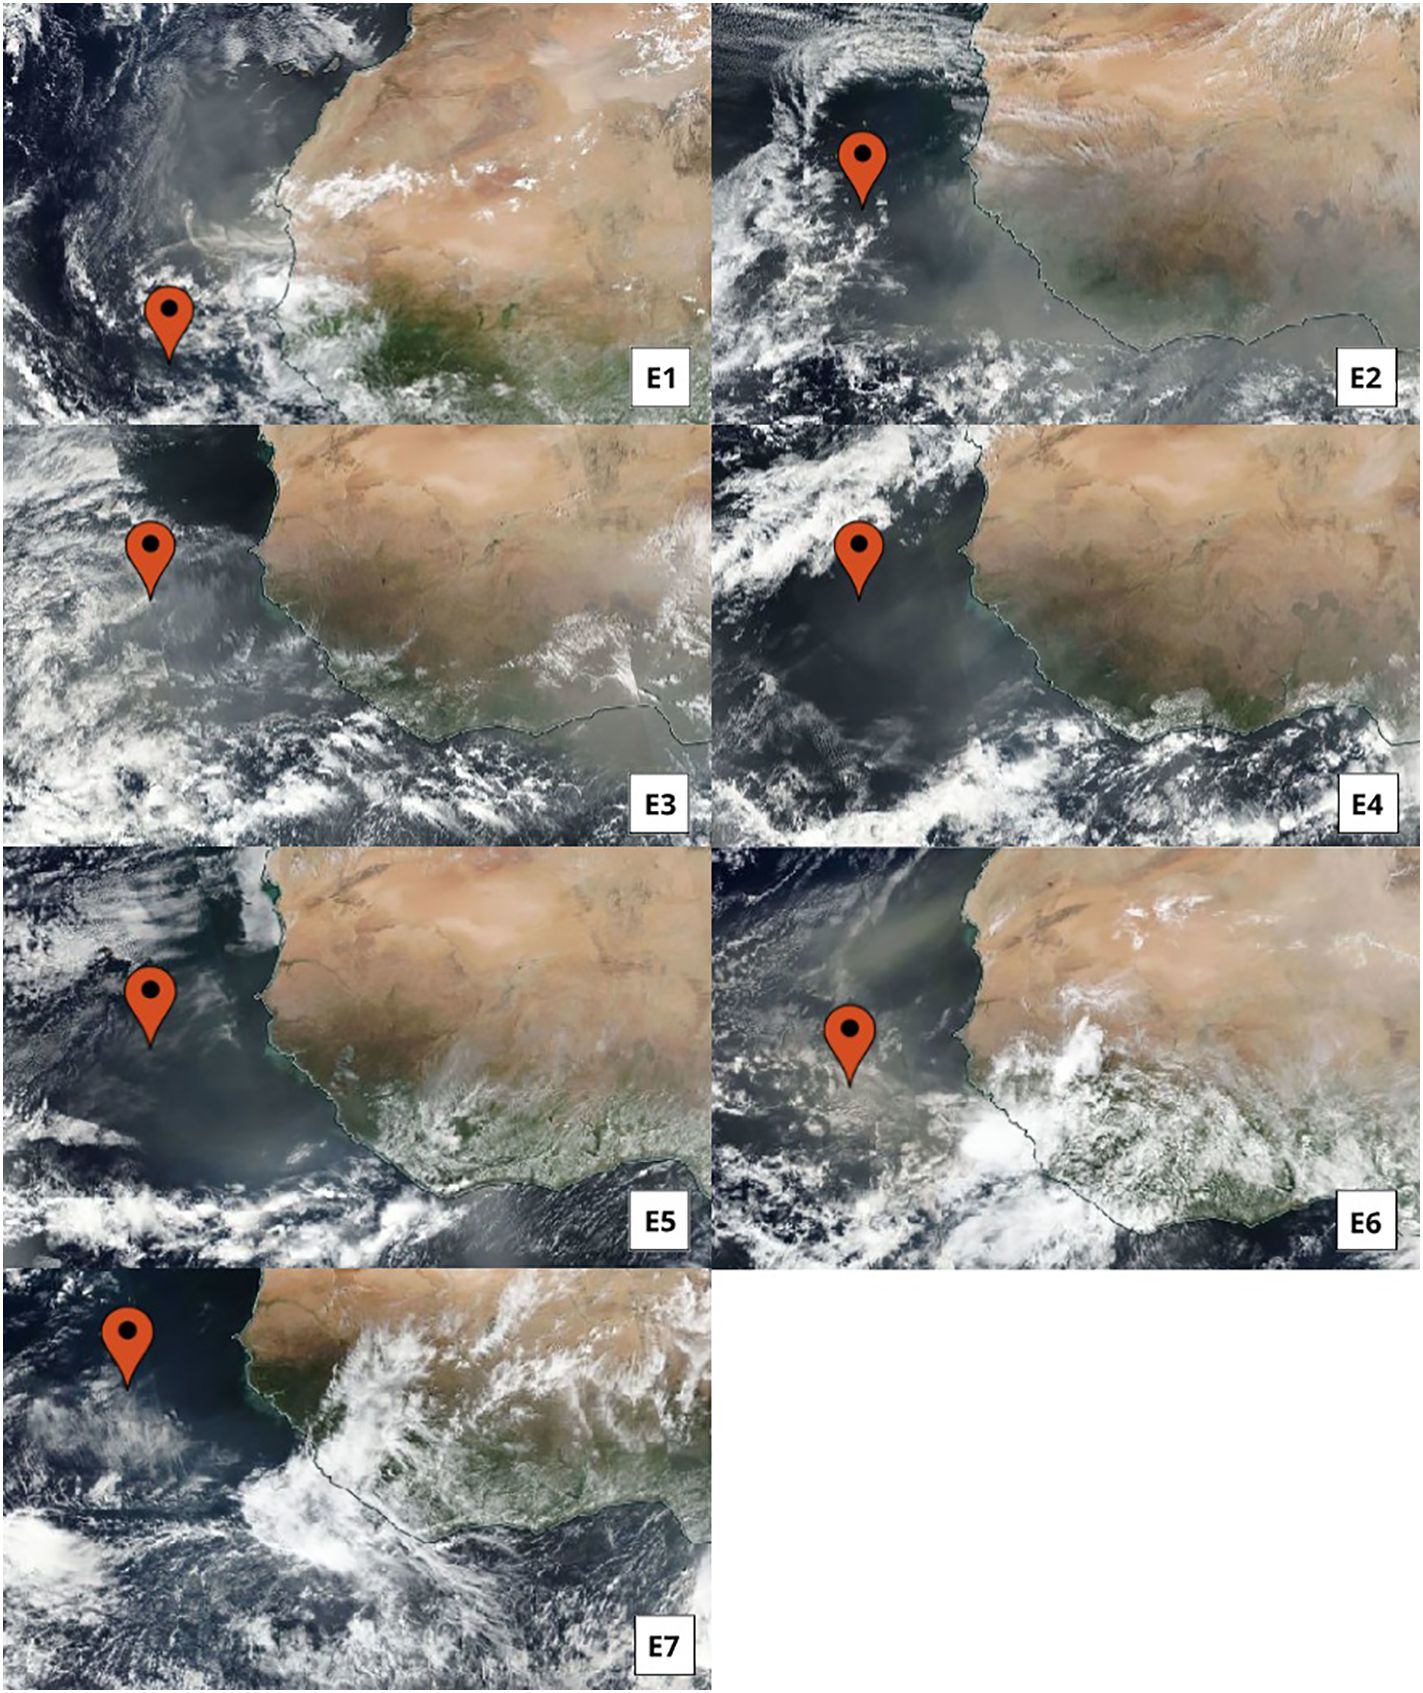
Figure 5 Satellite snapshots of dust plumes of identified high-flux events E1-E7.
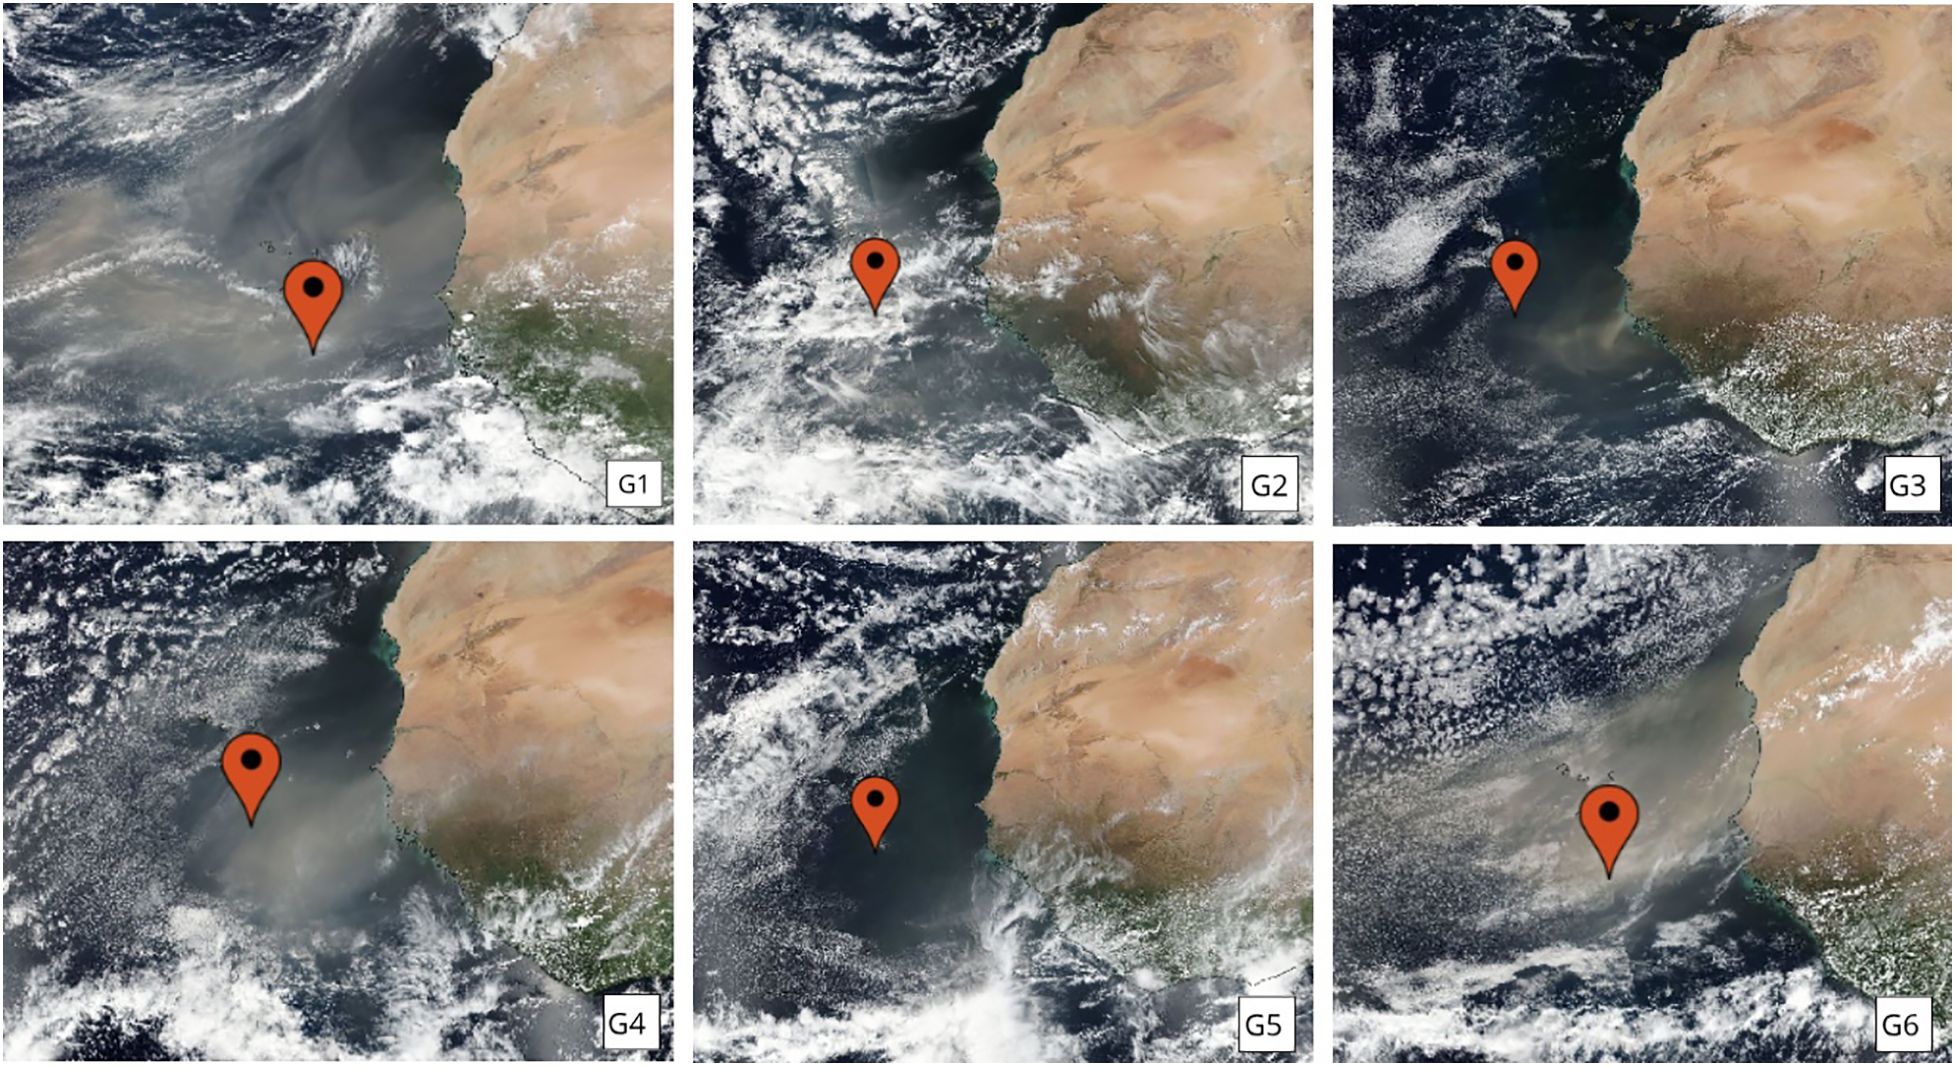
Figure 6 Satellite snapshots of dust plumes of identified anomalous grain-size events G1-G6.

Table 2 Dust event table displaying sample ID, event ID, submarine sediment-trap depth, mid-date of the 4-day sampling period, dust event date at which the dust plume appeared on satellite imagery, total flux dust deposition captured in the 4-day time window, modal grain size, settling rate, and minimum and maximum settling rates as potential error derived from the 4-day sampling period during which the particles could have settled.
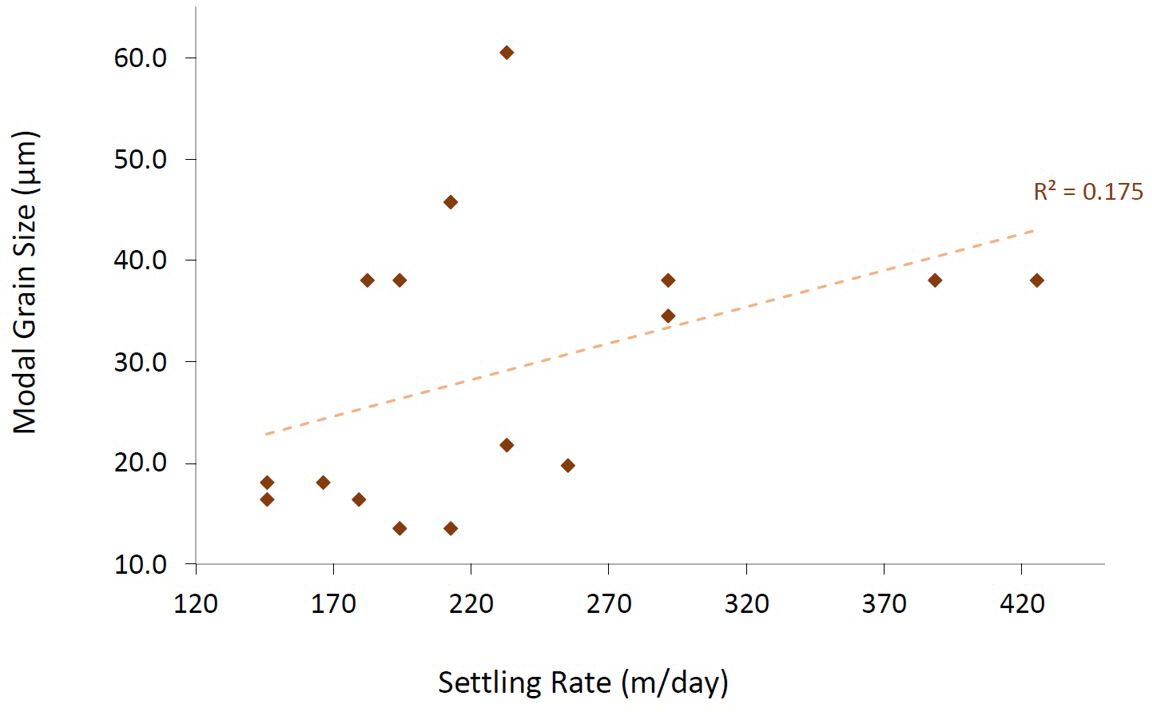
Figure 7 Relationship between modal grain size and settling rates of event samples. The dashed line displays the linear trendline (R2 = 0.175).
The dust fluxes of this study exceed most of previous data, ranging from 0–90 mg m-2 d-1 [Ratmeyer et al., 1999 (0.7–56.1 mg m-2 d-1); Brust et al., 2011 (<43 mg m-2 d-1); van der Does et al., 2020 (0–30 mg m-2 d-1)]. The high-resolution 4-day sampling enables the estimation of dust fluxes within this short time interval, contributing to the observed outcome. Neuer et al. (2004) found dust deposition reaching up to 160 mg m-2 d-1 when rain occurred in summer months leading to wet deposition of dust particles (van der Does et al., 2020). Precipitation was limited in this time series and cannot be associated with high deposition rates of lithogenic material (Figure 1) indicating that in 2017/18 dry dust deposition may have been the main mode of deposition at the sampling site. The highest fluxes occur in spring with an average of 14.8 mg m-2 d-1. This can be explained by stronger Harmattan surges in spring being responsible for about one third of total dust emissions from the Sahara Desert (Fiedler et al., 2015). Additionally, the dominating Harmattan winds operate closer to the ocean surface, thus facilitating dry deposition by gravitational forces, winds, and sea spray (Adams et al., 2012) leading to increased dust fluxes in winter and spring (van der Does et al., 2016). Summer and fall months experience lower deposition rates with lowest fluxes occurring in fall with an average of 8.6 mg m-2 d-1. This phenomenon was previously explained by van der Does et al. (2016) conveying that dust particles travel at high altitudes within the SAL layer in summer months and therefore mainly fly over the sampling site instead of being deposited. In addition, the summer dust plume is located north of the sampling site (Figure 5), therefore deposition is reduced not only by the seasonal change from low- to high-altitude winds, but also by the seasonal shift of the location of the major dust plume away from the sampling site. We estimate the total dust flux at our sampling site in the tropical North Atlantic at 4040.02 mg m-2 y-1 which is in line with previous data from the same site (4877.96 mg m-2 y-1, van der Does et al., 2020).
The various statistical methods provide insights into grain-size distribution variations between seasons (Table 1). While seasonal modes seem to vary minimally between seasons (16.4–19.8 μm), differences in grain-size averages (9.0 ± 0.9 – 14.8 ± 4.5) and the occurrence of giant particles in percentages can be observed within seasons. The results show that fall 2017 and summer deposits contained coarser dust grains than the winter, spring, and fall 2018 samples (Table 1). Summer deposits are also slightly less-well sorted than winter deposits (Figures 1, 5). These variations occur due to the seasonal differences in altitudes of the dominating winds. Convection over North Africa during summer allows the uplift and transportation of coarser-grained particles in the SAL at high altitudes (Schepanski et al., 2017). Finer grain sizes in winter corroborate with the lack of convection in source regions, and the low altitude transport in the Harmattan winds (Fiedler et al., 2015). This is supported by the larger and less well-sorted grain-size distributions in summer, while winter distributions are more homogeneous (Figure 4) (Friese et al., 2016; van der Does et al., 2018). Grain-size differences between seasons do not vary largely in this study. This can result from detection errors of the LDA that prevent the machine from detecting single coarse-sized grains when the signal is overpowered by fine grains. Furthermore, the SAL travels at high altitudes leading the dust plume to fly over the sampling site, thus reducing the deposition of dust particles. Lastly, seasonal effects may vary annually depending on wind patterns, precipitation, and dust source conditions. Seasonal grain-size variations for air-collected samples could not be determined because all filters that contained enough material to analyze their size distributions were obtained in winter.
Thirteen dust events were captured by the sediment traps, with seven identified by increased dust fluxes (>=25 mg m-2 d-1) (E1-E7, Figure 5) and six by an anomalous occurrence of giant particles (G1-G6, >62.5 μm) (Figure 6; Table 2). Dust events occurred throughout the sampling period with spring containing the highest number of dust events (n=5), followed by winter and fall (n=4). Only 3 events occurred in summer (Figure 1). The period between July and November 2018 lacks any dust events which corroborates decreased dust load in fall. The average deposition rate of dust particles during high-flux events increases by 461.3%, or 5.6 times higher than on normal dusty days, highlighting the sheer intensity and importance of such events for the transport of dust particles across the Atlantic. Modal grain sizes exhibit little variation among high-flux events (E1-E7), ranging from 13.6 to 21.7 μm, but show a broader range during anomalous grain-size events (G1-G6) (34.6 to 60.5 μm). Particle sorting (SD) does not vary between dust events and normal dusty days (SD=2.8, 2.85, respectively), and only varies minimally between high-flux events, and anomalous grain-size events (SD=2.77, 2.84, respectively). These combined characteristics indicate that atmospheric processes related to wind strength are the main drivers responsible for particle uplift during high-flux events (E1-E7) rather than convection and turbulence which are most likely the drivers for anomalous grain-size events (G1-G6) (Engelstaedter et al., 2006). The two phenomena could potentially impact different source regions, causing either an increased uplift of dust particles or variations in grain sizes. To confirm this hypothesis, a provenance study should be conducted to analyze the origins of dust particles from various events e.g. using radiogenic isotopes (Barkley et al., 2022; Guinoiseau et al., 2022).
The anomalous grain-size events are not accompanied by significant dust fluxes (10.7 mg m-2 d-1) suggesting that dust events can pass over the sampling site without impacting dust flux, leaving only a trace of coarse grains due to gravitational forces. This is supported by the observation of large dust plumes in satellite images that do not align with any anomalies in the sediment-trap depositions (Supplementary Figure 4). This indicates also that dust events can leave no discernible trace in the sediment traps. Consequently, sediment traps may not equally capture the occurrence and intensity of all dust events.
Precipitation at the sampling site occurred mainly in summer and fall months during the summer monsoon season (Figure 1). The rain events in this time series did not affect depositional fluxes unlike previous studies have shown (van der Does et al., 2020). Precipitation can flush out the atmosphere (Yu et al., 2019) as demonstrated by less well-sorted grain-size distributions (van der Does et al., 2016) and therefore lead to increased dust deposition (van der Does et al., 2020). Increased dust fluxes in this study do not relate to precipitation events (Figure 1), instead, lower dust fluxes are found in the summer and fall deposits although satellite derived AOD exhibits high values in summer (37.6). The high AOD values can, however, be derived from cloud coverage. Fall 2017 and 2018 show the lowest AOD values (27.7 and 23.5, respectively) inferring that a lack of dust in the atmosphere may be the reason for low dust deposition during precipitation events. Additionally, grain-size distributions do not vary with precipitation (Figure 1) indicating either low or homogeneous dust activity from August to October 2018.
The 4-day high-resolution sampling enables close examination of the interaction between organic matter and dust fluxes, with both fluxes typically exhibiting similar trends. Marine organic matter mainly consisting of phytoplankton detritus and zooplankton fecal material is deposited continuously at the sampling site with a minimum deposition rate of 14.4 mg m-2 d-1. The period of increased dust activity from January to April 2018 results in a total dust load of 1188.4 mg captured by the sediment traps, constituting 46% of the total dust load during the entire sampling period (Supplementary Table 1). Simultaneously, 11063.9 mg organic matter deposited which comprise 42% of the total flux (Figure 1). In contrast, periods of low dust activity such as November to December 2017 and August to September 2018 both exhibit low organic matter fluxes (60.1 mg m-2 d-1 and 60.0 mg m-2 d-1, respectively). During high-flux dust events, the average deposition rate of organic matter increases by 199.5%. This represents 3 times more deposition than during normal dusty days. During anomalous grain-size events, however, organic matter deposition decreases by 13.6%. While our data show that the occurrence of high-flux events positively affects organic matter deposition, dust fertilization effects and fertilization by organic material transported through the atmosphere cannot be ruled out. For instance, studies show that African biomass burning can supply nutrients across the Atlantic Ocean potentially influencing primary productivity at our sampling site in winter and spring (Barkley et al., 2019). Additionally, increased primary productivity is partially attributed to blooming calcifying and silicifying organisms in response to nutrient addition which can have an impact on the accelerated sinking of organic matter through biomineral ballasting (Le Moigne et al., 2012; Wilson et al., 2012). While our results agree with published studies demonstrating a positive relation between dust particle and organic matter fluxes (Brust et al., 2011; Bressac et al., 2014), here we add the observation that fine-grained particles seem to have a larger effect on the carbon export than coarse grains. It is suspected that either finer dust particles are a more effective nutrient supply thus enhancing primary growth in the surface ocean, or finer particles serve as a better binding agent to the formation of marine snow (van der Jagt et al., 2018), or both. The size and increased settling rates of giant particles may be less effective in aggregate formation.
Precipitation plays an important role in the release of bioavailable nutrients of dust particles during aerial transport and hence directly affects primary productivity in the surface ocean (Korte et al., 2018, 2020; van der Does et al., 2020). The precipitation events in this time series most likely impacted biological activity in the surface ocean as seen by increased chlorophyll-a peaks during heavy rain events (Figure 1). However, chlorophyll-a peaks and increased organic matter flux also occur independently of precipitation events indicating that primary productivity is also impacted by other factors. These could include fertilization by dry dust (Korte et al., 2018) or by African biomass burning as mentioned previously (Barkley et al., 2019). Nutrient supply from deeper depths by upwelling in this oligotrophic region is very unlikely (Monger et al, 1997; Korte et al., 2017).
Dust particles sampled in the atmosphere are a measure of dust transport while particles collected in the sub-marine sediment traps register dust deposition (van der Does et al., 2021a). The modal grain size of the surface-buoy samples is in all cases coarser than the average modal grain size of dust deposited in the sediment traps (Figure 3). The modal grain-size differences between the two sampling methods range from 3.1–121.1 μm (9.7–80.1%). The large volume percentages of giant-particle fractions in the buoy samples are also up to 3 times higher than those of the sediment-trap samples. These large differences make it difficult to differentiate systematic errors from a trend observed between the two sampling methods. If a trend exists, the results suggest that either the buoy-sampling method is more efficient in catching coarse grains, or the sediment traps more efficient in catching fine grains. It is possible that a coarse-grain signal remains unseen during grain-size analysis of the sediment-trap samples if the signal is ‘overpowered’ by finer grains. The discrepancy can also result from the differing sampling methods as the sediment traps collect dust from a wider catchment area and continuous sampling time, while atmospheric dust collection is limited to the right conditions. The four air samples that were usable for this experiment are, however, insufficient to form clear conclusions.
During the M1 sediment-trap time series of 2017/18 located at 12°N, 23°W in the tropical North Atlantic, the following results were found:
1. The highest dust fluxes occurred in spring with an average of 14.8 mg m-2 d-1. Fall months experienced the lowest flux with an average deposition rate of 8.6 mg m-2 d-1. The estimated total dust flux at the study site in the tropical North Atlantic is 4040.02 mg m-2 y-1.
2. Grain-size distributions exhibited seasonal variations with mean grain-sizes increasing in fall 2017 and summer, and decreasing in winter and fall 2018. Grain-size distributions in summer were generally less well-sorted while spring deposits were more homogeneous.
3. Rain events in this time series did not affect depositional fluxes nor grain-size distributions of the dust. This could have occurred due to low dust activity in the atmosphere.
4. Thirteen dust events were recorded during the sampling period of which seven were high dust flux events and six were anomalous grain-size events. Dust flux increased 5.6 times during high-flux events. Sediment traps may not equally capture the occurrence and intensity of all dust events as some dust plume appearances on satellite images left no trace in the sediment traps.
5. Organic matter was deposited continuously at the sampling site with a deposition rate ranging from 14.4–862.25 mg m-2 d-1. Organic matter fluxes increased 3 times during high-flux events but decreased 1.2 times during anomalous grain-size events.
6. The occurrence of high-flux events positively affected organic matter deposition by 199.5%.
The original contributions presented in the study are included in the article/Supplementary Material. Further inquiries can be directed to the corresponding authors.
BM: Conceptualization, Data curation, Formal analysis, Methodology, Project administration, Validation, Visualization, Writing – original draft, Writing – review & editing. MP: Supervision, Writing – review & editing, Formal analysis, Investigation, Validation. G-JB: Supervision, Writing – review & editing, Methodology, Resources. J-BS: Conceptualization, Data curation, Formal analysis, Funding acquisition, Investigation, Methodology, Project administration, Resources, Supervision, Validation, Writing – review & editing.
The author(s) declare financial support was received for the research, authorship, and/or publication of this article. Moorings M1 and Buoy Laura were managed by the NIOZ in the framework of the projects TRAFFIC funded by NWO (no. 822.01.008), and DUSTTRAFFIC funded by ERC (no. 311152), directed by J-BS. In addition, we are grateful for financial support of the NWO institute NIOZ -Royal Netherlands Institute for Sea Research.
We thank captains and ship crews as well as scientific crews of expeditions M140 – FORAMFLUX onboard the German FS Meteor and MSM79 – MACPEI onboard the German FS Maria S. Merian. NWO and ERC are thanked for financial support. We thank the institutes MARUM – Center for Marine Environmental Sciences and NIOZ – Royal Netherlands Institute for Sea Research for support. In particular, colleagues from the NMF – National Marine Facilities department are thanked for technical support. In addition, we thank Bob Koster for technical support. We acknowledge the use of imagery from the NASA Worldview application (https://worldview.earthdata.nasa.gov/), part of the NASA Earth Observing System Data and Information System (EOSDIS).
The authors declare that the research was conducted in the absence of any commercial or financial relationships that could be construed as a potential conflict of interest.
All claims expressed in this article are solely those of the authors and do not necessarily represent those of their affiliated organizations, or those of the publisher, the editors and the reviewers. Any product that may be evaluated in this article, or claim that may be made by its manufacturer, is not guaranteed or endorsed by the publisher.
The Supplementary Material for this article can be found online at: https://www.frontiersin.org/articles/10.3389/fmars.2024.1367786/full#supplementary-material
Adams A. M., Prospero J. M., Zhang C. (2012). CALIPSO-derived three-dimensional structure of aerosol over the Atlantic basin and adjacent continents. J. Climate 25, 6862–6879. doi: 10.1175/JCLI-D-11-00672.1
Adebiyi A., Kok J. F., Murray B. J., Ryder C. L., Stuut J.-B. W., Kahn R. A., et al. (2023). A review of coarse mineral dust in the Earth system. Aeolian Res. 60, 100849. doi: 10.1016/j.aeolia.2022.100849
Atkinson J. D., Murray B. J., Woodhouse M. T., Whale T. F., Baustian K. J., Carslaw K. S., et al. (2013). The importance of feldspar for ice nucleation by mineral dust in mixed-phase clouds. Nature 498, 355–358. doi: 10.1038/nature12278
Barkley A. E., Pourmand A., Longman J., Sharifi A., Prospero J. M., Panechou K., et al. (2022). Interannual variability in the source location of North African dust transported to the amazon. Geophysical Res. Lett. 49, e2021GL097344. doi: 10.1029/2021GL097344
Barkley A. E., Prospero J. M., Mahowald N., Hamilton D. S., Popendorf K. J., Oehlert A. M., et al. (2019). African biomass burning is a substantial source of phosphorus deposition to the Amazon, Tropical Atlantic Ocean, and Southern Ocean. Proc. Natl. Acad. Sci. 116, 16216–16221. doi: 10.1073/pnas.1906091116
Behrangi A., Stephens G., Adler R. F., Huffman G. J., Lambrigtsen B., Lebsock M. (2014). An update on oceanic precipitation rate and its zonal distribution in light of advanced observations from space. J. Climate 27, 3957–3965. doi: 10.1175/JCLI-D-13-00679.1
Bressac M., Guieu C., Doxaran D., Bourrin F., Desboeufs K., Leblond N., et al. (2014). Quantification of the lithogenic carbon pump following a simulated dust-deposition event in large mesocosms. Biogeosciences 11, 1007–1020. doi: 10.5194/bg-11-1007-2014
Brust J., Schulz-Bull D. E., Leipe T., Chavagnac V., Waniek J. J. (2011). Descending particles: From the atmosphere to the deep ocean—A time series study in the subtropical NE Atlantic. Geophysical Res. Lett. 38, L06603. doi: 10.1029/2010GL045399
Carlson T. N., Prospero J. M. (1972). The large-scale movement of Saharan air outbreaks over the northern equatorial Atlantic. J. Appl. Meteorology 11, 283–297. doi: 10.1175/1520–0450(1972)011<0283:TLSMOS>2.0.CO;2
Engelstaedter S., Tegen I., Washington R. (2006). North African dust emissions and transport. Earth-Science Rev. 79, 73–100. doi: 10.1016/j.earscirev.2006.06.004
Fiedler S., Kaplan M. L., Knippertz P. (2015). The importance of Harmattan surges for the emission of North African dust aerosol. Geophysical Res. Lett. 42, 9495–9504. doi: 10.1002/2015GL065925
Fischer G., Karakas G. (2009). Sinking rates and ballast composition of particles in the Atlantic Ocean: implications for the organic carbon fluxes to the deep ocean. Biogeosciences 6, 85–102. doi: 10.5194/bg-6-85-2009
Friese C., Does M., Merkel U., Iversen M. H., Fischer G., Stuut J.-B. W. (2016). Environmental factors controlling the seasonal variability in particle size distribution of modern Saharan dust deposited off Cape Blanc. Aeolian Res. 22, 165–179. doi: 10.1016/j.aeolia.2016.04.005
Goudie A. S., Middleton N. J. (2001). Saharan dust storms: nature and consequences. Earth-Science Rev. 56, 179–204. doi: 10.1016/S0012-8252(01)00067-8
Guerreiro C. V., Baumann K. H., Brummer G. J. A., Fischer G., Korte L. F., Merkel U., et al. (2017). Coccolithophore fluxes in the open tropical North Atlantic: influence of thermocline depth, Amazon water, and Saharan dust. Biogeosciences 14, 4577–4599. doi: 10.5194/bg-14-4577-2017
Guinoiseau D., Singh S. P., Galer S. J. G., Abouchami W., Bhattacharyya R., Kandler K., et al. (2022). Characterization of Saharan and Sahelian dust sources based on geochemical and radiogenic isotope signatures. Quaternary Sci. Rev. 293, 107729. doi: 10.1016/j.quascirev.2022.107729
Heinold B., Knippertz P., Marsham J. H., Fiedler S., Dixon N. S., Schepanski K., et al. (2013). The role of deep convection and nocturnal low-level jets for dust emission in summertime West Africa: Estimates from convection-permitting simulations. J. Geophysical Research: Atmospheres 118, 4385–4400. doi: 10.1002/jgrd.50402
Jickells T. D., An Z. S., Andersen K. K., Baker A. R., Bergametti G., Brooks N., et al. (2005). Global Iron Connections Between Desert Dust, Ocean Biogeochemistry, and Climate. Science 308 (5718), 67–71. https://doi.org/10.1126/science.1105959
Knippertz P. (2014). “Meteorological aspects of dust storms,” in Mineral dust: A key player in the earth system. Eds. Knippertz P., Stuut J.-B. W. (Springer, Netherlands), 121–147. doi: 10.1007/978–94-017–8978-3_6
Korte L. F., Brummer G. J. A., van der Does M., Guerreiro C. V., Hennekam R., Van Hateren J. A., et al. (2017). Downward particle fluxes of biogenic matter and Saharan dust across the equatorial North Atlantic. Atmospheric Chem. Phys. 17, 6023–6040. doi: 10.5194/acp-17-6023-2017
Korte L. F., Brummer G. J. A., van der Does M., Guerreiro C. V., Mienis F., Munday C. I., et al. (2020). Multiple drivers of production and particle export in the western tropical North Atlantic. Limnology Oceanography 65, 2108–2124. doi: 10.1002/lno.11442
Korte L. F., Pausch F., Trimborn S., Brussaard C. P. D., Brummer G. J. A., van der Does M., et al. (2018). Effects of dry and wet Saharan dust deposition in the tropical North Atlantic Ocean. Biogeosciences Discuss 2018, 1–20. doi: 10.5194/bg-2018-484
Kucera K., Siccha M., Morard R., Jonkers L., Schmidt C., Munz P., et al. (2019). Scales of population dynamics, ecology and diversity of planktonic foraminifera and their relationship to particle flux in the eastern tropical Atlantic, Cruise No. M140, 11.8.2017 - 5.9.2017, Mindelo (Cabo Verde) - Las Palmas (Spain), FORAMFLUX. In METEOR-Berichte (Vol. M140, pp. 1–66). Gutachterpanel Forschungsschiffe. doi: 10.2312/cr_m140
Lafon S., Sokolik I. N., Rajot J. L., Caquincau S., Gaudichet A. (2006). Characterization of iron oxides in mineral dust aerosols: Implications for light absorption. J. Geophysical Res. D: Atmospheres 111, D21207. doi: 10.1029/2005JD007016
Laurent B., Marticorena B., Bergametti G., Léon J. F., Mahowald N. M. (2008). Modeling mineral dust emissions from the Sahara desert using new surface properties and soil database. J. Geophys. Res. 113, D14218. doi: 10.1029/2007JD009484
Le Moigne F. A. C., Sanders R. J., Villa-Alfageme M., Martin A. P., Pabortsava K., PlanqueCe H., et al. (2012). On the propor;on of ballast versus non-ballast associated carbon export in the surface ocean. Geophys. Res. Lett. 39, L15610. doi: 10.1029/2012GL052980
Mahowald N. M., Engelstaedter S., Luo C., Sealy A., Artaxo P., Benitez-Nelson C., et al. (2009). Atmospheric iron deposition: global distribution, variability, and human perturbations. Annu. Rev. Mar. Sci. 1, 245–278. doi: 10.1146/annurev.marine.010908.163727
McGregor H. V., Dupont L., Stuut J.-B. W., Kuhlmann H. (2009). Vegetation change, goats, and religion: a 2000-year history of land use in southern Morocco. Quaternary Sci. Rev. 28, 1434–1448. doi: 10.1016/j.quascirev.2009.02.012
Monger B., McClain C., Murtugudde R. (1997). Seasonal phytoplankton dynamics in the eastern tropical Atlantic. J. Geophysical Res. 102, 12389–12411. doi: 10.1029/96JC03982
Mulitza S., Heslop D., Pittauerova D., Fischer H. W., Meyer I., Stuut J.-B., et al. (2010). Increase in African dust flux at the onset of commercial agriculture in the Sahel region. Nature 466, 226–228. doi: 10.1038/nature09213
Nabat P., Somot S., Mallet M., Chiapello I., Morcrette J.-J., Solmon F., et al. (2012). A 4-D climatology, (1979–2009) of the monthly aerosol optical depth distribution over the Mediterranean region from a comparative evaluation and blending of remote sensing and model products. Atmospheric Measurement Techniques Discussions 5, 8469–8538. doi: 10.5194/amtd-5-8469-2012
Nenes A., Krom M. D., Mihalopoulos N., Van Cappellen P., Shi Z., Bougiatioti A., et al. (2011). Atmospheric acidification of mineral aerosols: a source of bioavailable phosphorus for the oceans. Atmospheric Chem. Phys. 11, 6265–6272. doi: 10.5194/acp-11-6265-2011
Neuer S., Torres-Padrón M. E., Gelado-Caballero M. D., Rueda M. J., Hernández-Brito J., Davenport R., et al. (2004). Dust deposition pulses to the eastern subtropical North Atlantic gyre: Does ocean's biogeochemistry respond? Global Biogeochemical Cycles 18, GB4020. doi: 10.1029/2004GB002228
Nicholson S. E. (2000). The nature of rainfall variability over Africa on time scales of decades to millennia. Global Planetary Change 26, 137–158. doi: 10.1016/S0921-8181(00)00040-0
Nicholson S. E., Funk C., Fink A. H. (2018). Rainfall over the African continent from the 19th through the 21st century. Global Planetary Change 165, 114–127. doi: 10.1016/j.gloplacha.2017.12.014
Nowald N., Iversen M. H., Fischer G., Ratmeyer V., Wefer G. (2015). Time series of in-situ particle properties and sediment trap fluxes in the coastal upwelling filament off Cape Blanc, Mauritania. Progress in Oceanography 137, 1–11. doi: 10.1016/j.pocean.2014.12.015
Pabortsava K., Lampitt R. S., Benson J., Crowe C., McLachlan R., Le Moigne F. A. C., et al. (2017). Carbon sequestration in the deep Atlantic enhanced by Saharan dust. Nat. Geosci. 10, 189–194. doi: 10.1038/ngeo2899
Ratmeyer V., Fischer G., Wefer G. (1999). Lithogenic particle fluxes and grain-size distributions in the deep ocean off northwest Africa: Implications for seasonal changes of aeolian dust input and downward transport. Deep Sea Res. Part I: Oceanographic Res. Papers 46 (8), 1289–1337. doi: 10.1016/S0967-0637(99)00008-4
Ryder C. L., Highwood E. J., Rosenberg P. D., Trembath J., Brooke J. K., Bart M., et al. (2013). Optical properties of Saharan dust aerosol and contribution from the coarse mode as measured during the Fennec 2011 aircraft campaign. Atmospheric Chem. Phys. 13, 303–325. doi: 10.5194/acp-13-303-2013
Schepanski K., Heinold B., Tegen I. (2017). Harmattan, Saharan heat low, and West African monsoon circulation: modulations on the Saharan dust outflow towards the North Atlantic. Atmos. Chem. Phys. 17, 10223–10243. doi: 10.5194/acp-17-10223-2017
Schepanski K., Tegen I., Macke A. (2009). Saharan dust transport and deposition towards the tropical northern Atlantic. Atmos. Chem. Phys. 9, 1173–1189. doi: 10.5194/acp-9-1173-2009
Stuut J.-B. W. (2001). Late Quaternary Southwestern African terrestrial-climate signals in the marine record of Walvis Ridge, SE Atlantic Ocean (Utrecht: Utrecht University). Available at: http://igitur-archive.library.uu.nl/dissertations/2002–0503-091238/inhoud.htm. Geologica Ultraiectina No. 212, Ph.D.-.
Tjallingii R., Claussen M., Stuut J. B., Fohlmeister J., Jahn A., Bickert T., et al. (2008). Coherent high- and low-latitude control of the northwest African hydrological balance. Nat. Geosci 1, 670–675. doi: 10.1038/ngeo289
Tsamalis C., Chédin A., Pelon J., Capelle V. (2013). The seasonal vertical distribution of the Saharan Air Layer and its modulation by the wind. Atmos. Chem. Phys. 13, 11235–11257. doi: 10.5194/acp-13-11235-2013
van der Does M., Brummer G.-J. A., Korte L. F., Stuut J.-B. W. (2021a). Seasonality in Saharan dust across the Atlantic Ocean: from atmospheric transport to seafloor deposition. J. Geophysical Research: Atmospheres 126, e2021JD034614. doi: 10.1029/2021JD034614
van der Does M., Brummer G. J. A., van Crimpen F. C., Korte L. F., Mahowald N. M., Merkel U., et al. (2020). Tropical rains controlling deposition of Saharan dust across the North Atlantic Ocean. Geophysical Res. Lett. 47, e2019GL086867. doi: 10.1029/2019GL086867
van der Does M., Knippertz P., Zschenderlein P., Harrison G. R., Stuut J.-B. W. (2018). The mysterious long-range transport of giant mineral dust particles. Sci. Adv. 4 (12), eaau2768. doi: 10.1126/sciadv.aau2768
van der Does M., Korte L. F., Munday C. I., Brummer G. J. A., Stuut J. B. W. (2016). Particle size traces modern Saharan dust transport and deposition across the equatorial North Atlantic. Atmos. Chem. Phys. 16, 13697–13710. doi: 10.5194/acp-16-13697-2016
van der Does M., Wengler M., Lamy F., Martínez-García A., Jaccard S. L., Kuhn G., et al. (2021b). Opposite dust grain-size patterns in the Pacific and Atlantic sectors of the Southern Ocean during the last 260,000 years. Quaternary Sci. Rev. 263, 106978. doi: 10.1016/j.quascirev.2021.106978
van der Jagt H., Friese C., Stuut J.-B. W., Fischer G., Iversen M. H. (2018). The ballasting effect of Saharan dust deposition on aggregate dynamics and carbon export: Aggregation, settling, and scavenging potential of marine snow. Limnology Oceanography 63, 1386–1394. doi: 10.1002/lno.10779
Van Herpen M. M. J. W., Li Q., Saiz-Lopez A., Liisberg J. B., Röckmann T., Cuevas C. A., et al. (2023). Photocatalytic chlorine atom production on mineral dust–sea spray aerosols over the North Atlantic. Proc. Natl. Acad. Sci. 120, e2303974120. doi: 10.1073/pnas.2303974120
Wilson J. D., Barker S., Ridgwell A. (2012). Assessment of the spatial variability in particulate organic matter and mineral sinking fluxes in the ocean interior: Implications for the ballast hypothesis. Global Biogeochemical Cycles 26, GB4011. doi: 10.1029/2012GB004398
Yu H., Tan Q., Chin M., Remer L. A., Kahn R. A., Bian H., et al. (2019). Estimates of African dust deposition along the trans-atlantic transit using the decadelong record of aerosol measurements from CALIOP, MODIS, MISR, and IASI. J. Geophysical Research: Atmospheres 124, 7975–7996. doi: 10.1029/2019JD030574
Zonneveld K., Baumann K.-H., Boersen B., Bösche J., Decker C., de Visser J.-D., et al. (2019). A deglacial record of carbon release from thawing permafrost of the European tundra (EUROTHAW), Marine carbon production, export, relocation and degradation under varying ocean redox conditions off NW Africa (MACPEI), Cruise No. MSM 79, October 29 - November 9 - December 3, 2018, Edinburgh (UK) - Las Palmas (Spain) - Mindelo (Cape Verde). In MARIA S. MERIAN-Berichte (MSM79, pp. 1–80). Gutachterpanel Forschungsschiffe. doi: 10.2312/cr_msm79
Keywords: mineral dust flux, Saharan dust events, seasonal dust deposition, mineral ballasting, dust fertilization, marine carbon sink
Citation: Matzenbacher BA, Brummer G-JA, Prins MA and Stuut J-BW (2024) High-resolution sampling in the eastern tropical North Atlantic reveals episodic Saharan dust deposition: implications for the marine carbon sink. Front. Mar. Sci. 11:1367786. doi: 10.3389/fmars.2024.1367786
Received: 09 January 2024; Accepted: 05 June 2024;
Published: 24 June 2024.
Edited by:
Griet Neukermans, Ghent University, BelgiumReviewed by:
Cassandra Gaston, University of Miami, United StatesCopyright © 2024 Matzenbacher, Brummer, Prins and Stuut. This is an open-access article distributed under the terms of the Creative Commons Attribution License (CC BY). The use, distribution or reproduction in other forums is permitted, provided the original author(s) and the copyright owner(s) are credited and that the original publication in this journal is cited, in accordance with accepted academic practice. No use, distribution or reproduction is permitted which does not comply with these terms.
*Correspondence: Blanda A. Matzenbacher, YmxhbmRhLmFuaXRhQGdtYWlsLmNvbQ==; Jan-Berend W. Stuut, amFuLWJlcmVuZC5zdHV1dEBuaW96Lm5s
Disclaimer: All claims expressed in this article are solely those of the authors and do not necessarily represent those of their affiliated organizations, or those of the publisher, the editors and the reviewers. Any product that may be evaluated in this article or claim that may be made by its manufacturer is not guaranteed or endorsed by the publisher.
Research integrity at Frontiers
Learn more about the work of our research integrity team to safeguard the quality of each article we publish.