 Dilip Kumar Jha1*
 Vikas Pandey1
 Chandrasekaran Muthukumar2Ponnusamy Sathish Kumar1Srinivas Venkatnarayanan1Jebarathnam Prince Prakash Jebakumar3Gopal Dharani1
- 1Ocean Science and Technology for Islands, National Institute of Ocean Technology, Ministry of Earth Sciences, Government of India, Chennai, India
- 2National Centre for Coastal Research, Ministry of Earth Sciences, Government of India, Chennai, India
- 3Coastal and Environmental Engineering, National Institute of Ocean Technology, Ministry of Earth Sciences, Government of India, Chennai, India
Introduction
Coastal waters support a diverse range of marine life and contribute to the country’s economy. Seawater quality has a significant impact on the ecological sustainability and biological productivity of coastal and marine ecosystems (Dheenan et al., 2014; Dheenan et al., 2016). However, population growth and industrialization in the coastal regions have steadily increased the anthropogenic pressure, resulting in seawater quality degradation along the coast. Anthropogenic activities such as land-based runoff, sewage discharge, industrial & aquaculture effluent and eutrophication in the coastal environment could impact the aquatic biota of the region. Consequently, coastal pollution has become a global issue that requires intervention through the application of monitoring programs and improvement of the seawater quality through a mitigation management system.
The combined effects of salinity and temperature influence the coastal water, and nutrient content is responsible for productivity, therefore information on these parameter’s distribution in different coastal ecosystems is important (Satpathy et al., 1986). Among the numerous inorganic elements required for life support in marine coastal ecosystems, nitrogen, phosphorous, and silicates are believed to be more significant than the others because they play a vital role in phytoplankton abundance, growth, and metabolism (Barath Kumar et al., 2018). The distribution and behavior of nutrients in the coastal environment, particularly in the nearshore environment, varies greatly depending on local variables such as anthropogenic activities, fresh water influx, tidal variation, and biological activity such as phytoplankton intake and regeneration.
Although several studies on water quality have been conducted in other Indian coastal regions (Renjith et al., 2015; Jha et al., 2015; Yuvaraj et al., 2018; Satheeswaran et al., 2019; Ratnam et al., 2022), there is relatively less work carried out on the seawater quality characteristics for such a long coastal stretch in this region. Recently, Barath Kumar et al. (2018) have studied seawater characteristics at 8 locations over a 300 km coastal stretch along the Tamil Nadu coast. In the present study, we have monitored over 537 km of stretch spreading in five coastal districts. The objective of this study is to understand the spatial variation of physicochemical and biological characteristics in the seawater of five coastal districts in southeast coast India. The data gathered might be useful for comparative research aimed at evaluating the environmental conditions of other tropical coastal locations. The pattern of physicochemical characteristics of coastal waters along the southeast coast of India was evaluated using analysis of variance (ANOVA-one way), box-whisker plots, principal component analysis (PCA), and N/P ratio.
Methods
Tamil Nadu has a coastal length of 1076 Km and stretches along the Bay of Bengal, Arabian Sea and the India Ocean. Palk Bay (PB) and the Gulf of Mannar (GoM), which are located along India’s southeast coast, form a significant part of of the country’s entire coastline length (Barath Kumar et al., 2018; Pandey et al., 2022; Jha et al., 2022). Thanjavur (THA), Pudukottai (PUD), Ramanathapuram (RAM), Thoothukudi (THO), and Tirunelveli (TIR) were five coastal districts (hereafter ‘locations’) surveyed during the pre monsoon period (January to March) of 2020 to evaluate the seawater quality (Figure 1A). Surface and bottom seawater samples were collected from near shore and offshore sites (n= 168 samples). A hand-held GPS (Garmin eTrex Vista; ± 5 m) was used to record the sampling position in the present study.

Figure 1 Study area map and box-whisker plots display variations for selected physiochemical variables. (A) sampling locations, (B) WT, (C) salinity, (D) chl-a, (E) BOD, (F) nitrate, (G) phosphate, (H) silicate and (I) TSS. In each plot, the median is represented by the central point, the interval is represented by the rectangle (i.e. 25% and 75% percentiles), and range indicated by the whisker [(*: extreme outlier;◦: mild outlier); Sampling locations: THA, Thanjavur; PUD, Pudukottai; RAM, Ramanathapuram; THO, Thoothukudi; and TIR, Tirunelveli.
Sample Collection and Analysis
A Niskin's water sampler was used from a boat to collect seawater samples in polypropylene bottles for nutrient analysis. The titration method of Winkler (Winkler, 1888) was used to assess samples for dissolved oxygen (DO) and biochemical oxygen demand (BOD). The argentometric titration technique was used to determine salinity. Onboard, a calibrated thermometer and a pH meter were used to measure temperature and pH, respectively. To estimate total suspended solids (TSS), 1 L of seawater was filtered using 0.45 µm Millipore GF/C filter paper and rinsed with Milli-Q water to eliminate salt content (APHA, 2005). The nutrients namely nitrite, nitrate, inorganic phosphate (IP), silicate, total nitrogen (TN), ammonia, and total phosphorus (TP) were measured in seawater samples using procedures of Grasshoff et al. (1999). The Redfield ratio (N:P = 16:1) was used to compare nutrient ratio of dissolved inorganic nitrogen (nitrate + nitrite + ammonium = N) and phosphate to assess possible nutritional control on biological production (Van Nieuwerburgh et al., 2004). The spectrophotometric approach was used to examine chlorophyll-a (chl-a) and phaeophytin content (Parsons et al., 1992). Triplicate samples were analyzed, with quality control techniques including thorough standardization and blank measurements. To test spatial variations of physicochemical parameters, one-way ANOVA was employed. The Euclidean distance (ED) based hierarchical agglomerative cluster analysis (CA) (Ward, 1963) from normalized dataset was used to generated dendrogram. The dendrogram is a useful graphical tool for determining the number of clusters that explain the underlying mechanism that causes spatial patterns (Shrestha and Kazama, 2007; Yang et al., 2010). The same ED matrix was used for the non-metric multidimensional scaling (NMDS) ordination plot to corroborate the results of CA. Factor analysis (FA) is one of the most effective approach for decreasing the dimensionality of enormous datasets while preserving their content (Wunderlin et al., 2001). Strong (> 0.75), moderate (0.75–0.50), and weak (0.50–0.30) factor loadings were classified according to Liu et al. (2003) criteria. To establish sample adequacy, the Kaiser–Meyer–Olkin (KMO) criterion was used. To reduce the impact of discrepancies in measurement units and variance, all parameters were normalized using a Z-scale transformation (mean = 0; variance = 1), which rendered the data dimensionless for factor analysis. The analyses were conducted using SPSS software (version 18.0).
Results and Discussion
The physicochemical parameters of five coastal locations are summarized in Table S1 (Supplemental Material); the concentrations are shown as range and mean (± standard deviation [SD]). The presence of spatial variability induced by polluting sources and/or climatic conditions is indicated by environmental metrics with a high SD (Vega et al., 1998). At Ramanathapuram, the mean TSS (40.49 ± 10.09 mg/L), salinity (31.73 ± 1.52 PSU), and DO (5.93 ± 0.65 mg/L) were high compared to the other locations. The elevated TSS might be attributable to the persistent operation of fishing trawlers and tourist activities, which disturbed the water column in the study region. It was observed that mean AT (30.04 ± 0.73°C) and WT (28.47 ± 0.82°C) were comparatively higher at Tirunelveli and Ramanathapuram, respectively. The mean pH value (8.33 ± 0.10) was comparatively high at Pudukottai. The BOD varied significantly (F=7.011, p < 0.05) and was comparatively high (1.80 ± 0.73 mg/L) at Thanjavur, however, it was well within the prescribed limits of the Central Pollution Control Board (CPCB). The nutrients such as nitrite (0.27 ± 0.07 µM), nitrate (3.32 ± 0.27 µM), phosphate (1.75 ± 0.57 µM), total nitrogen (10.70 ± 4.43 µM), and total phosphate (2.28 ± 0.63 µM) concentrations were found higher in Thanjavur while silicate (18.34 ± 5.60 µM) was higher in Pudukottai. This might be due to more anthropogenic activity such as agriculture based land discharge and sewage mixing in the coastal water bodies. Chlorophyll-a, and phaeophytin content were comparatively high in Tirunelveli. In the present study, the spatial variation of all the physicochemical and biological parameters was significant (p < 0.05) among different locations except WT, DO, and ammonia (p > 0.05).
The Figures 1B–I shows box-whisker plots for selected seawater quality parameters. A box plot with no upper whisker indicates that the upper quartile is equal to the maximum [such as that of WT (Figure 1B). Long whiskers at the top of the box plot [such as that for TSS (Figure 1I) & phosphate (Figure 1G) and the bottom [such as salinity (Figure 1C) and chl-a (Figure 1D), indicate the underlying distribution is skewed toward the high and low range, respectively. Comparatively higher values of BOD (Figure 1E) were observed in near-shore samples. The box plots with wide spread revealed spatial deviation in sample distribution which was evident in the nitrate (Figure 1F) at Thanjavur. Box plots showed higher silicate in Pudukottai (Figure 1H). Further, the selected environmental parameters showed higher concentration towards the nearshore compared to the offshore. The mild (circles) and extreme outliers (asterisks) are indicating a difference in the observed factors at a few sampling stations that might be influenced by some human activities (Jha et al., 2014).
The cluster analysis generated a dendrogram with only one cluster containing THO & TIR which might be explained by the similarity in average values of physicochemical characteristics and dissimilarity from the other locations. The other locations i.e. THA, PUD and RAM were outliers Figure 2A. The PUD and RAM, however, showed closed distance on the dendrogram with the cluster formed between THO & TIR. On the other hand, THA showed maximum distance from the cluster resulting from the significant differences in physicochemical values at this location when compared to the other locations. The distance between PUD and RAM was very less which could be attributed to the similar values of silicate compared to other locations. The physiochemical variables depicted a comparable pattern to that of cluster analysis while exposed to 2D nMDS analysis (Figure 2B).
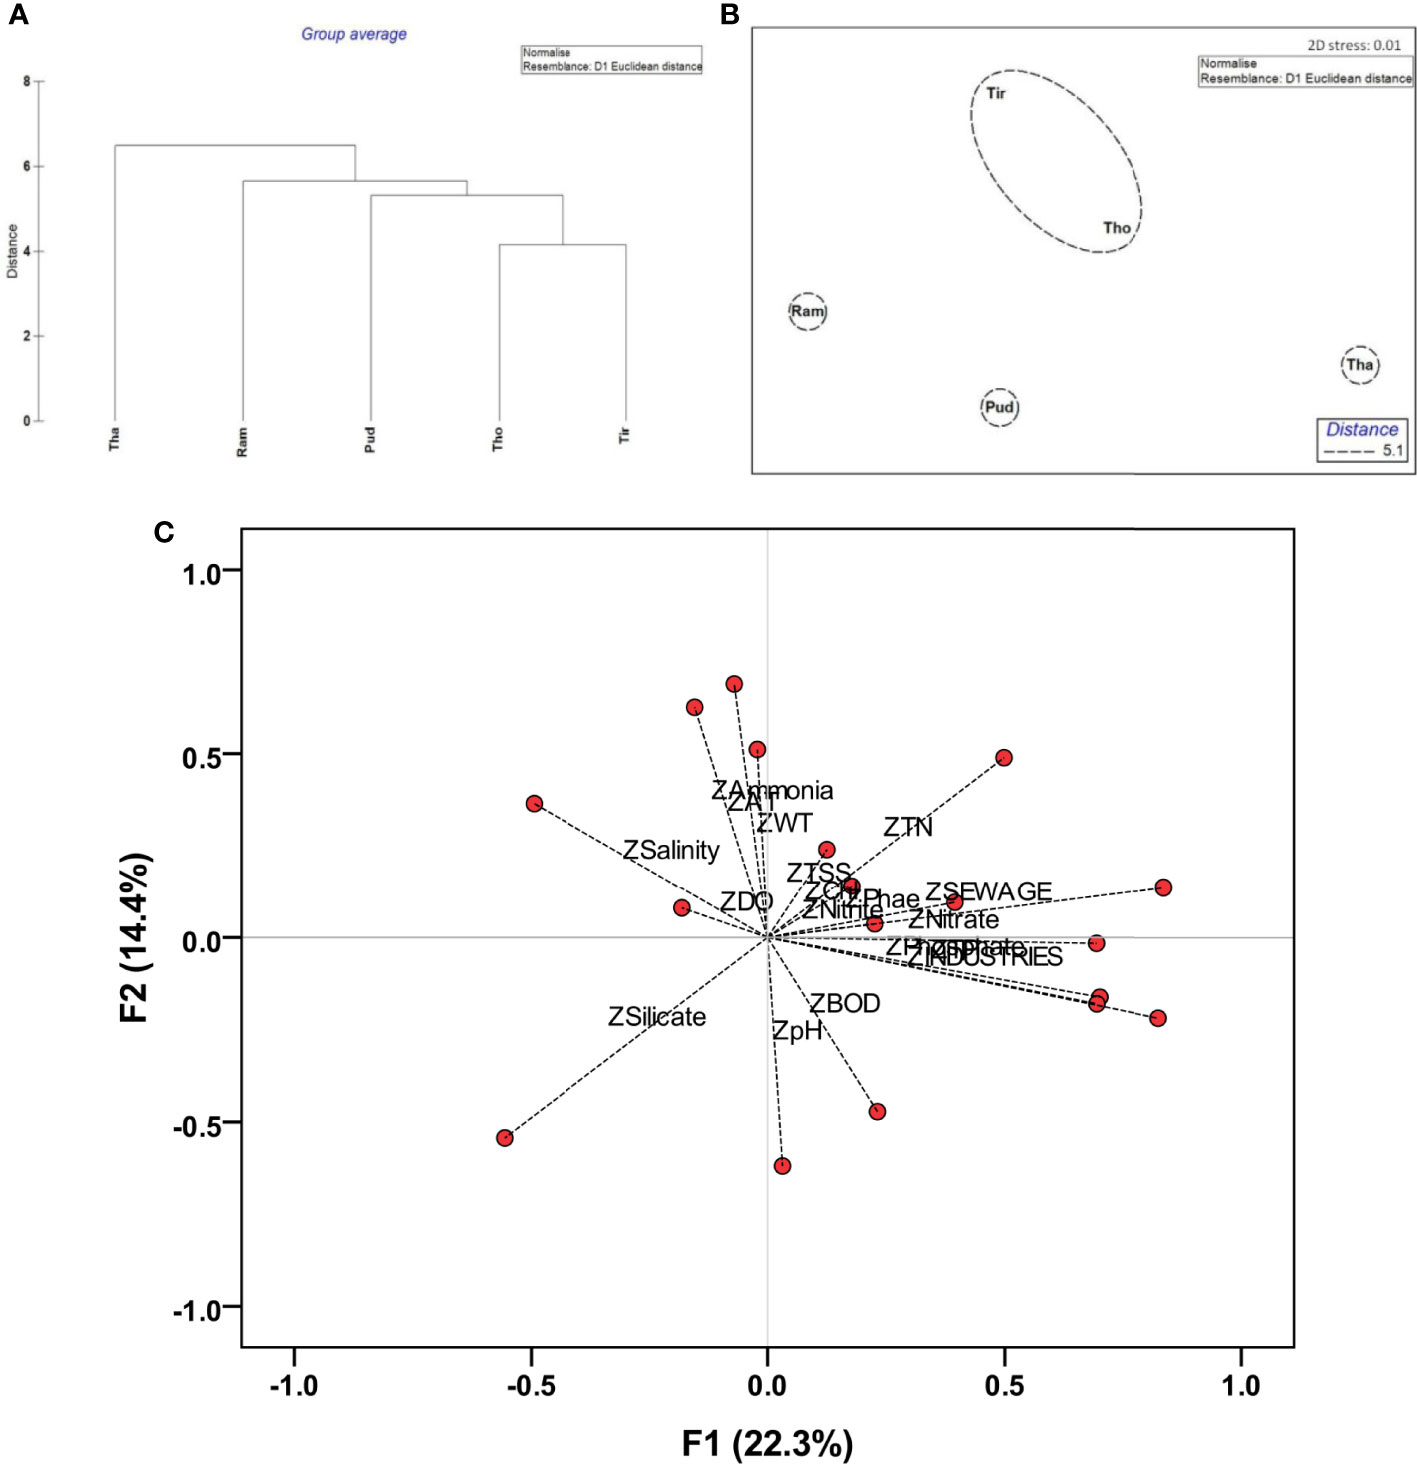
Figure 2 Cluster analysis, 2D NMDS and factor analysis; (A) dendrogram of the physiochemical variables in seawater, (B) non-metric multidimensional scaling resemblance of physiochemical variables in seawater, and (C) factor loading F1 and F2 for environmental parameters.
The KMO criterion values of 0.550 revealed that by factor analysis, a considerable diminution in the dimensionality of the data set has been obtained (Wu et al., 2010) for the Tamil Nadu coast. Through FA seven significant factors (Eigenvalue >1) were obtained which elucidating 79.83% of the total variation among the dataset along the southeast coast of India. The factor loadings and communality of environmental variables are given in Table S2 (Supplemental Material). Factor 1 elucidates 22.34% of the total variance and reveals moderate positive loading of nitrate (0.693), phosphate (0.700), total phosphorus (0.694), and moderate negative loadings of silicate (-0.556) whereas strong positive loadings of sewage discharge (0.836) and industrial units (0.825) (Figure 2C). Factor 2 elucidates 14.46% of the total variance and revealed a moderate positive loading of AT (0.625) and ammonia (0.688) whereas moderate negative loading of pH (-0.619). It might be explained by the natural co-existence of increased ammonia levels in seawater and a high pH value, owing to heavy anthropogenic input in the coastal environment.
The Redfield ratio (1934; 1958) in the present study for N/P was 3.68, 9.44, 56.29, 3.55, and 4.54 at Thanjavur, Pudukottai, Ramanathapuram, Toothukodi, and Tirunelveli, respectively. It is stated that the N/P ratio lesser than 16 specify nitrate could be a limiting factor. However, except at Ramanathapuram, the N/P ratio was lesser than 16 which revealed that nitrate was the limiting factor at all the stations except Ramanathapuram where phosphate was the limiting factor. It is reported that an undisturbed location will have phosphate limitation whereas at disturbed location nitrate will be the limiting factor (Gupta et al., 1981). Rivers and sewage channels deliver nutrients to coastal bays under certain environmental circumstances (Xu, 1989). Our observation depicted that anthropogenic impact plays a vital role in regulating the physicochemical parameters, barring the environmental parameters such as temperature and salinity, which were demonstrated through the multivariate approach in a more significant way and is comparable with the earlier scientific studies conducted in other coastal locations (Barath Kumar et al., 2018; Pandey et al., 2022). Regular monitoring will help to maintain the seawater quality, promote healthy habitats for flora and fauna, and contribute to coastal conservation and fisheries management (Vijayakumaran et al., 2005; Murugan et al., 2005; Kumar et al., 2009).
Conclusion
To evaluate, coastal water characteristics, sampling was conducted along the five coastal districts in the southeast coast of India. The results obtained through the multivariate tool indicated a good seawater quality at all the sites except near-shore sites of the Thanjavur. In Thanjavur, noticeable variations in the physicochemical parameters were observed in CA and therefore it resulted in an outlier. When the data was subjected to 2D nMDS ordinations, it showed a similar pattern to the CA. Strong factor loadings of sewage discharge (0.836) and industrial units (0.825) illustrated that the variability is due to the influence of physicochemical concentration in the coastal environment. The results revealed higher values near the coast whereas it was oligotrophic towards the offshore waters. The findings will be significant for comparing to other tropical coastal environments.
Data Availability Statement
The original contributions presented in the study are included in the article/Supplementary Material. Further inquiries can be directed to the corresponding author.
Author Contributions
DJ: Conceptualization, sampling design, data validation, multivariate analysis, and writing-original draft. VP: Collection of samples, analysis of samples, and processing of data. CM: Analysis of sample and data processing. PS: Field investigation and analysis. SV: Field survey and analysis. PJ: Coordination of field survey and reviewing the data. GD: Suggestion to review the manuscript, technical input, and project management. All authors contributed to the article and approved the submitted version.
Conflict of Interest
The authors declare that the research was conducted in the absence of any commercial or financial relationships that could be construed as a potential conflict of interest.
Publisher’s Note
All claims expressed in this article are solely those of the authors and do not necessarily represent those of their affiliated organizations, or those of the publisher, the editors and the reviewers. Any product that may be evaluated in this article, or claim that may be made by its manufacturer, is not guaranteed or endorsed by the publisher.
Acknowledgments
The authors are thankful to the Ministry of Earth Sciences, Govt. of India, for extending their support for the present study. Dr. G. A. Ramadass, Director, NIOT, Chennai, is to be thanked for his continual encouragement, support, and guidance. We are grateful to Dr. Vijaya Ravichandran, Scientist-G, NIOT, for her guidance and support for this research. We thank Dr. Pravakar Mishra, Scientist-F, NCCR for his critical review on the manuscript. We thank our colleagues Mr. S. Ragumaran, Mr. G. Nanadhagopal, and Mr. B. Ranjan Babu for their support during the survey. We also like to thank the scientific and supporting staff of NIOT’s MBT and CEE Groups in Chennai, India, for their timely help.
Supplementary Material
The Supplementary Material for this article can be found online at: https://www.frontiersin.org/articles/10.3389/fmars.2022.945495/full#supplementary-material
References
APHA (American Public Health Association) (2005). “Standard Methods for the Examination of Water and Wastewater,” in American Works Association and Water Environmental Federation, (APHA-AWWA-WEF) 21th Edition(Washington, D.C).
Barath Kumar S., Mohanty A. K., Padhi R. K., Selvanayagam M., Satpathy K. K. (2018). Coastal Water Characteristics Along Tamil Nadu, East Coast of India During Pre-Northeast Monsoon Period. Indian Jour. Geo Mar. Sci. 47 (2), 308–318.
Dheenan P. S., Jha D. K., Das A. K., Vinithkumar N. V., Prashanthi Devi M., Kirubagaran R. (2016). Geographic Information Systems and Multivariate Analysis to Evaluate Fecal Bacterial Pollution in Coastal Waters of Andaman, India, Environmental Pollution 214, 45–53. doi: 10.1016/j.envpol.2016.03.065
Dheenan P. S., Jha D. K., Vinithkumar N. V., Ponmalar A. A., Venkateshwaran P., Kirubagaran R. (2014). Spatial Variation of Physicochemical and Bacteriological Parameters Elucidation With GIS in Rangat Bay, Middle Andaman. India J. Sea Res. 85, 534–541. doi: 10.1016/j.seares.2013.09.001
Grasshoff K., Kremling K., Ehrhardt M. (1999). Methods of Seawater Analysis, Third Ed (Weinheim, Germany: Verlag Chemie).
Gupta R. S., Moraes C., George M. D., Kureishy T. W., Noronha R. J., Fondekar S. P. (1981). Chemistry & Hydrography of the Andaman Sea. Indian J. Mar. Sci. 10, 228–233.
Jha D. K., Pandey V., Santhanakumar J., Sathish Kumar P., Venkatnarayanan S., Jebakumar J. P. P., et al. (2022). Evaluation of Site Suitability for Artificial Reefs Deployment in Southeast Coast of India Using Geographical Information System as a Management Tool. Front. Mar. Sci. 8. doi: 10.3389/fmars.2021.817975
Jha D. K., Vinithkumar N. V., Sahu B. K., Das A. K., Dheenan P. S., Venkateshwaran P., et al. (2014). Multivariate Statistical Approach to Identify Significant Sources Influencing the Physic-Chemical Variables in Aerial Bay, North Andaman, India. Mar. pollut. Bull. 85, 261–267. doi: 10.1016/j.marpolbul.2014.06.007
Jha D. K., Vinithkumar N. V., Sahu B. K., Dheenan P. S., Das A. K., Mehmuna Begum, et al (2015). Multivariate and Geo-Spatial Approach for Seawater Quality of Chidiyatappu Bay, South Andaman Islands, India. Mar. pollut. Bull. 96(1–2), 463–470. doi: 10.1016/j.marpolbul.2015.05.004
Kumar T. S., Vijayakumaran M., Murugan T. S., Jha D. K., Sreeraj G., Muthukumar S. (2009). Captive Breeding and Larval Development of the Scyllarine Lobster Petrarctusrugosus , New Zealand. J. Mar. Freshw. Res. 43:1, 101–112. doi: 10.1080/00288330909509985
Liu C. W., Lin K. H., Kuo Y. M. (2003). Application of Factor Analysis in the Assessment of Groundwater Quality in a Blackfoot Disease Area in Taiwan. Sci. Total Environ. 313, 77–89. doi: 10.1016/S0048-9697(02)00683-6
Murugan T. S., Remany M. C., Mary Leema T., Jha D. K., Santhanakumar J., Vijayakumaran M., et al. (2005). Growth, Repetitive Breeding, and Aquaculture Potential of the Spiny Lobster, Panulirus Ornatus, New Zealand. J. Mar. Freshw. 39:2, 311–315. doi: 10.1080/00288330.2005.9517311
Pandey V., Jha D. K., Sathish Kumar P., Santhanakumar J., Venkatnarayanan S.J, et al. (2022). Effect of Multiple Stressors on the Functional Traits of Sub-Tidal Macrobenthic Fauna: A Case Study of the Southeast Coast of India. Mar. pollut. Bull. 175, 113355. doi: 10.1016/j.marpolbul.2022.113355
Parsons T. R., Maita Y., Lalli C. M. (1992). A Manual of Chemical and Biological Methods for Sea Water Analysis (Oxford, New York: Pergamon Press).
Ratnam K., Jha D. K., Prashanthi Devi M., Dharani G. (2022). Evaluation of Physicochemical Characteristics of Coastal Waters of Nellore, Southeast Coast of India, by a Multivariate Statistical Approach. Front. Mar. Sci. 9. doi: 10.3389/fmars.2022.857957
Redfield A. C. (1934). “On the Proportions of Organic Derivatives in the Sea Water and Their Relation to the Composition of Plankton,” in James Johnstone Memorial Volume, vol. 176–192 . Ed. Daniel R. J. (Liverpool: University Press of Liverpool).
Redfield A. C. (1958). The Biological Control of Chemical Factors in the Environment. Am. Sci. 46, 205–221.
Renjith V., Sarma K., Thresyamma D. D., Geroge G., Vethamony P. (2015). Natural Hazards. Influence of Natural and Anthropogenic Factors on the Water Quality of the Coastal Waters Around the South Andaman in the Bay of Bengal. doi: 10.1007/s11069-015-1715-9
Satheeswaran T., Yuvaraj P., Damotharan P., Karthikeyan V., Jha D. K., Dharani G., et al. (2019). Assessment of Trace Metal Contamination in the Marine Sediment, Seawater, and Bivalves of Parangipettai, Southeast Coast of India. Mar. pollut. Bull. 149, 110499.doi: 10.1016/j.marpolbul.2019.110499
Satpathy K. K., Eswaran M. S., Nair K. V. K. (1986). Distribution of Temperature in the Vicinity of Condenser Outfall in Kalpakkam Coastal Waters. J.Mar. Biol. Ass. India 28, 151–158.
Shrestha S., Kazama F. (2007). Assessment of Surface Water Quality Using Multivariate Statistical Techniques: A Case Study of the Fuji River Basin. Jpn. Environ. Model. Software 22, 464–475. doi: 10.1016/j.envsoft.2006.02.001
Van Nieuwerburgh L., Wanstrand I., Snoeijs P. (2004). Growth and C:N:P Ratios in Copepods Grazing on N- or Si-Limited Phytoplankton Blooms. Hydrobiologia 514, 57–/72. doi:10.1007/978-94-017-0920-0_5
Vega M., Pardo R., Barrado E., Deban L. (1998). Assessment of Seasonal and Polluting Effects on the Quality of River Water by Exploratory Data Analysis. Water Res. 32, 3581–3592. doi: 10.1016/S0043-1354(98)00138-9
Vijayakumaran M., Murugan T. S., Remany M. C., Mary Leema T., Jha D. K., Santhanakumar J., et al. (2005). Captive Breeding of the Spiny Lobster, Panulirus Homarus, New Zealand. J. Mar. Freshw. Res. 39:2, 325–334.
Ward J.H Jr. (1963) Hierarchical Grouping to Optimize an Objective Function. Journal of the American Statistical Association, 58:236–244doi: 10.1080/01621459.1963.10500845
Winkler L. W. (1888). Die Bestimmung Des Im Wassergelösten Sauerstoffen. Ber. Dtsche. Chem. Ges. 21, 2843–2855. doi:10.1002/cber.188802102122
Wunderlin D. A., Diaz M. P., Ame M. V., Pesce S. F., Hued A. C., Bistoni M. (2001). Pattern Recognition Techniques for the Evaluation of Spatial and Temporal Variation in Water Quality. A Case study: Suquia river basin (Cordoba Argentina). Water Res. 35, 2881–2894. doi: 10.1016/s0043-1354(00)00592-3
Wu M. L., Wang Y. S., Sun C. C., Wang H., Dong J. D., Yin J. P., et al. (2010). Identification of Coastal Water Quality by Statistical Analysis Methods in Daya Bay, South China Sea. Mar. pollut. Bull. 60, 852–860. doi: 10.1016/j.marpolbul.2010.01.007
Xu G. Z. (1989). Environments and Resources of Daya Bay (HeFei, China: Anhui Science Publishing House).
Yang Y., Zhou F., Guo H. C., Sheng H., Liu H., Dao X., et al. (2010). Analysis of Spatial and Temporal Water Pollution Patterns in Lake Dianchi Using Multivariate Statistical Methods. Environ. Monit. Assess. 170, 407–416. doi: 10.1007/s10661-009-1242-9
Keywords: environmental quality, coastal, multivariate, Principal Component Analysis, Tamil Nadu coast
Citation: Jha DK, Pandey V, Muthukumar C, Sathish Kumar P, Venkatnarayanan S, Jebakumar JPP and Dharani G (2022) Investigation of Coastal Water Characteristics Along the Southeast Coast of India: A Multivariate Approach. Front. Mar. Sci. 9:945495. doi: 10.3389/fmars.2022.945495
Received: 16 May 2022; Accepted: 08 June 2022;
Published: 18 July 2022.
Edited by:
Meilin Wu, South China Sea Institute of Oceanology (CAS), ChinaReviewed by:
Gopalakrishnan Thilagam, Pachaiyappa’s College for Men, IndiaPrashanthi Devi Marimuthu, Bharathidasan University, India
Ganesh Thiruchitrambalam, Pondicherry University, Port Blair Campus, India
Copyright © 2022 Jha, Pandey, Muthukumar, Sathish Kumar, Venkatnarayanan, Jebakumar and Dharani. This is an open-access article distributed under the terms of the Creative Commons Attribution License (CC BY). The use, distribution or reproduction in other forums is permitted, provided the original author(s) and the copyright owner(s) are credited and that the original publication in this journal is cited, in accordance with accepted academic practice. No use, distribution or reproduction is permitted which does not comply with these terms.
*Correspondence: Dilip Kumar Jha, ZGlsaXBqaGFuaW90QGdtYWlsLmNvbQ==