
94% of researchers rate our articles as excellent or good
Learn more about the work of our research integrity team to safeguard the quality of each article we publish.
Find out more
ORIGINAL RESEARCH article
Front. Mar. Sci., 25 January 2022
Sec. Marine Pollution
Volume 8 - 2021 | https://doi.org/10.3389/fmars.2021.817975
This article is part of the Research TopicCoastal Environmental and Ecological Data AnalysisView all 30 articles
 Dilip Kumar Jha1*
 Vikas Pandey1
 J. Santhanakumar1P. Sathish Kumar1S. Venkatnarayanan1J. Prince Prakash Jebakumar2G. Dharani1R. Vijaya2
A planned artificial reef (AR) deployment program as part of a fisheries enhancement might be a useful tool for managers to supplement traditional ways to utilize available space and augment local productivity. Several AR deployment initiatives have been carried out globally, but they are rarely subjected to a rigorous site selection process. We created a site selection procedure in this study that includes systematic stages including exclusion mapping, underwater visual transect, benthic composition, seawater quality, and comparative visual mapping. This research focused on restoring the fishing grounds for artisanal fishermen by deploying AR along the southeast coast of India. The results of each stage in the procedure enabled us to choose suitable locations at a target depth with low wave action, no slope, and a good substrate capable of supporting an AR. Analysis of variance (ANOVA-one way) showed significant (p < 0.05) spatial variation for depth, slope, seawater current, salinity, chlorophyll-a, benthic density, and diversity. The geographical information system (GIS) based model output showed space allocation for AR deployment. The GIS methodology for site selection was developed to be easily adaptable to the demands of diverse artificial reef programs. The integrated strategy has proven to be a successful regulatory intervention for AR deployment practices in order to facilitate coastal restoration and management.
The artificial reef (AR) is a submerged structure deliberately placed on the seabed to mimic the functions of a natural reef, such as protecting, regenerating, concentrating, and enhancing marine organism stock, and serves as a part of the natural ecosystem (FAO, 2015). The earliest recorded AR was from the 1830s, when logs from huts were used off the coast of South Carolina, United States, to improve fishing (Weisburd, 1986). The first scientifically planned reefs were deployed in 1974 off the Adriatic coast of central Italy (Fabi and Fiorentini, 1994). However, in the Indian scenario, AR was first reported on the Coromandel Coast (Hornell, 1924), whereas the first AR construction was carried out off Puthiyathura village in 1953, and further organized efforts to deploy ARs were initiated from 1980 onward (Sreekanth et al., 2019).
Despite widespread usage of AR as a mitigating tool for restoring fisheries, they are rarely subjected to a thorough site selection protocol before deployment. Though there are site selection guidelines, they primarily focus on physical factors (shipping channels, fishing, or substrate) and methods for obtaining permits (Figley, 2005). The majority of scientific effort is focused on studying AR after deployment to obtain time-series data of community dynamics (Reed et al., 2006; Thanner et al., 2006). Although these findings are important for evaluating the effectiveness of AR, they typically do not provide the required information to develop a standard protocol for reef placement, management, and mitigation plans. Poor site selection is one of the most common causes of failure of AR deployment programs (Tseng et al., 2001; Kennish et al., 2002).
Exclusion mapping (Kaiser, 2006) is one of the most commonly utilized methods for selecting suitable locations and screening out unsuitable ones. However, it does not provide the physical and biological data needed to comprehend the ecology of a prospective AR site. Seawater currents, waves, substrate stability, seawater quality, and existing benthic fauna are key factors in site selection (Spieler et al., 2001; Duzbasilar et al., 2006; Mousavi et al., 2015). It is well known that exclusion mapping may account for the majority of these features, nevertheless very few studies have been carried out (Barber et al., 2009) that combine them with physical and biological field data to determine site suitability. Site selection is a complex process in which the role of geographical information systems (GIS) is well established (Moeinaddini et al., 2010; Mousavi et al., 2015; Jha et al., 2017).
Coral reefs on the southeast coast of India (Tamil Nadu) are located in Palk Bay (PB) and in the Gulf of Mannar (GoM) (Muley et al., 2000), which accounts for 94.3 sq km in which reef flat and reef vegetation comprise 64.9 and 13.7 sq km, respectively (Department of Ocean Development and Space Application Centre, 1997). It is reported that the GoM and PB harbor about 117 species belonging to 40 genera of coral and support the fisheries production in the region (Raghuraman et al., 2013). However, in recent times, there has been a decline in traditional fishing due to which artisanal fishermen are facing severe problems such as lower catch (Vijayanand et al., 2007). In addition, factors such as trawling (James, 1994) and damage to benthic habitats (Murugan and Durgekar, 2008) have also exacerbated the decline in annual total fish catch along the southeast coast of India (Tamil Nadu). Considering the above facts, the present research focussed on systematic site selection protocols for fishery restoration and conserving the ecosystem in the southeast coast of India (Tamil Nadu). Hence, an integrated site selection method was established before the deployment to ensure long-term success of AR in supporting the local fishery. The objectives of the present study are to (1) use exclusion mapping as the first stage for selecting target locations for AR deployment; (2) develop a comprehensive record of physical and biological parameters for each location based on quantitative in situ data; and (3) in situ and satellite data comparison for selected parameters for the site suitability to develop a simple site selection protocol that could easily be adapted in other coastal environments.
Tamil Nadu has a coastline of 1,076 km and stretches along the Bay of Bengal, the Indian Ocean, and the Arabian Sea. It constitutes about 15% of the total coastal length of India, covering PB and the GoM, which is one of the major coral-rich areas located along the southeast coast of India. Five coastal districts, namely, Thanjavur (THA), Pudukottai (PUD), Ramanathapuram (RAM), Thoothukudi (THO), and Tirunelveli (TIR), were studied for the site suitability of AR deployment (Figure 1A).
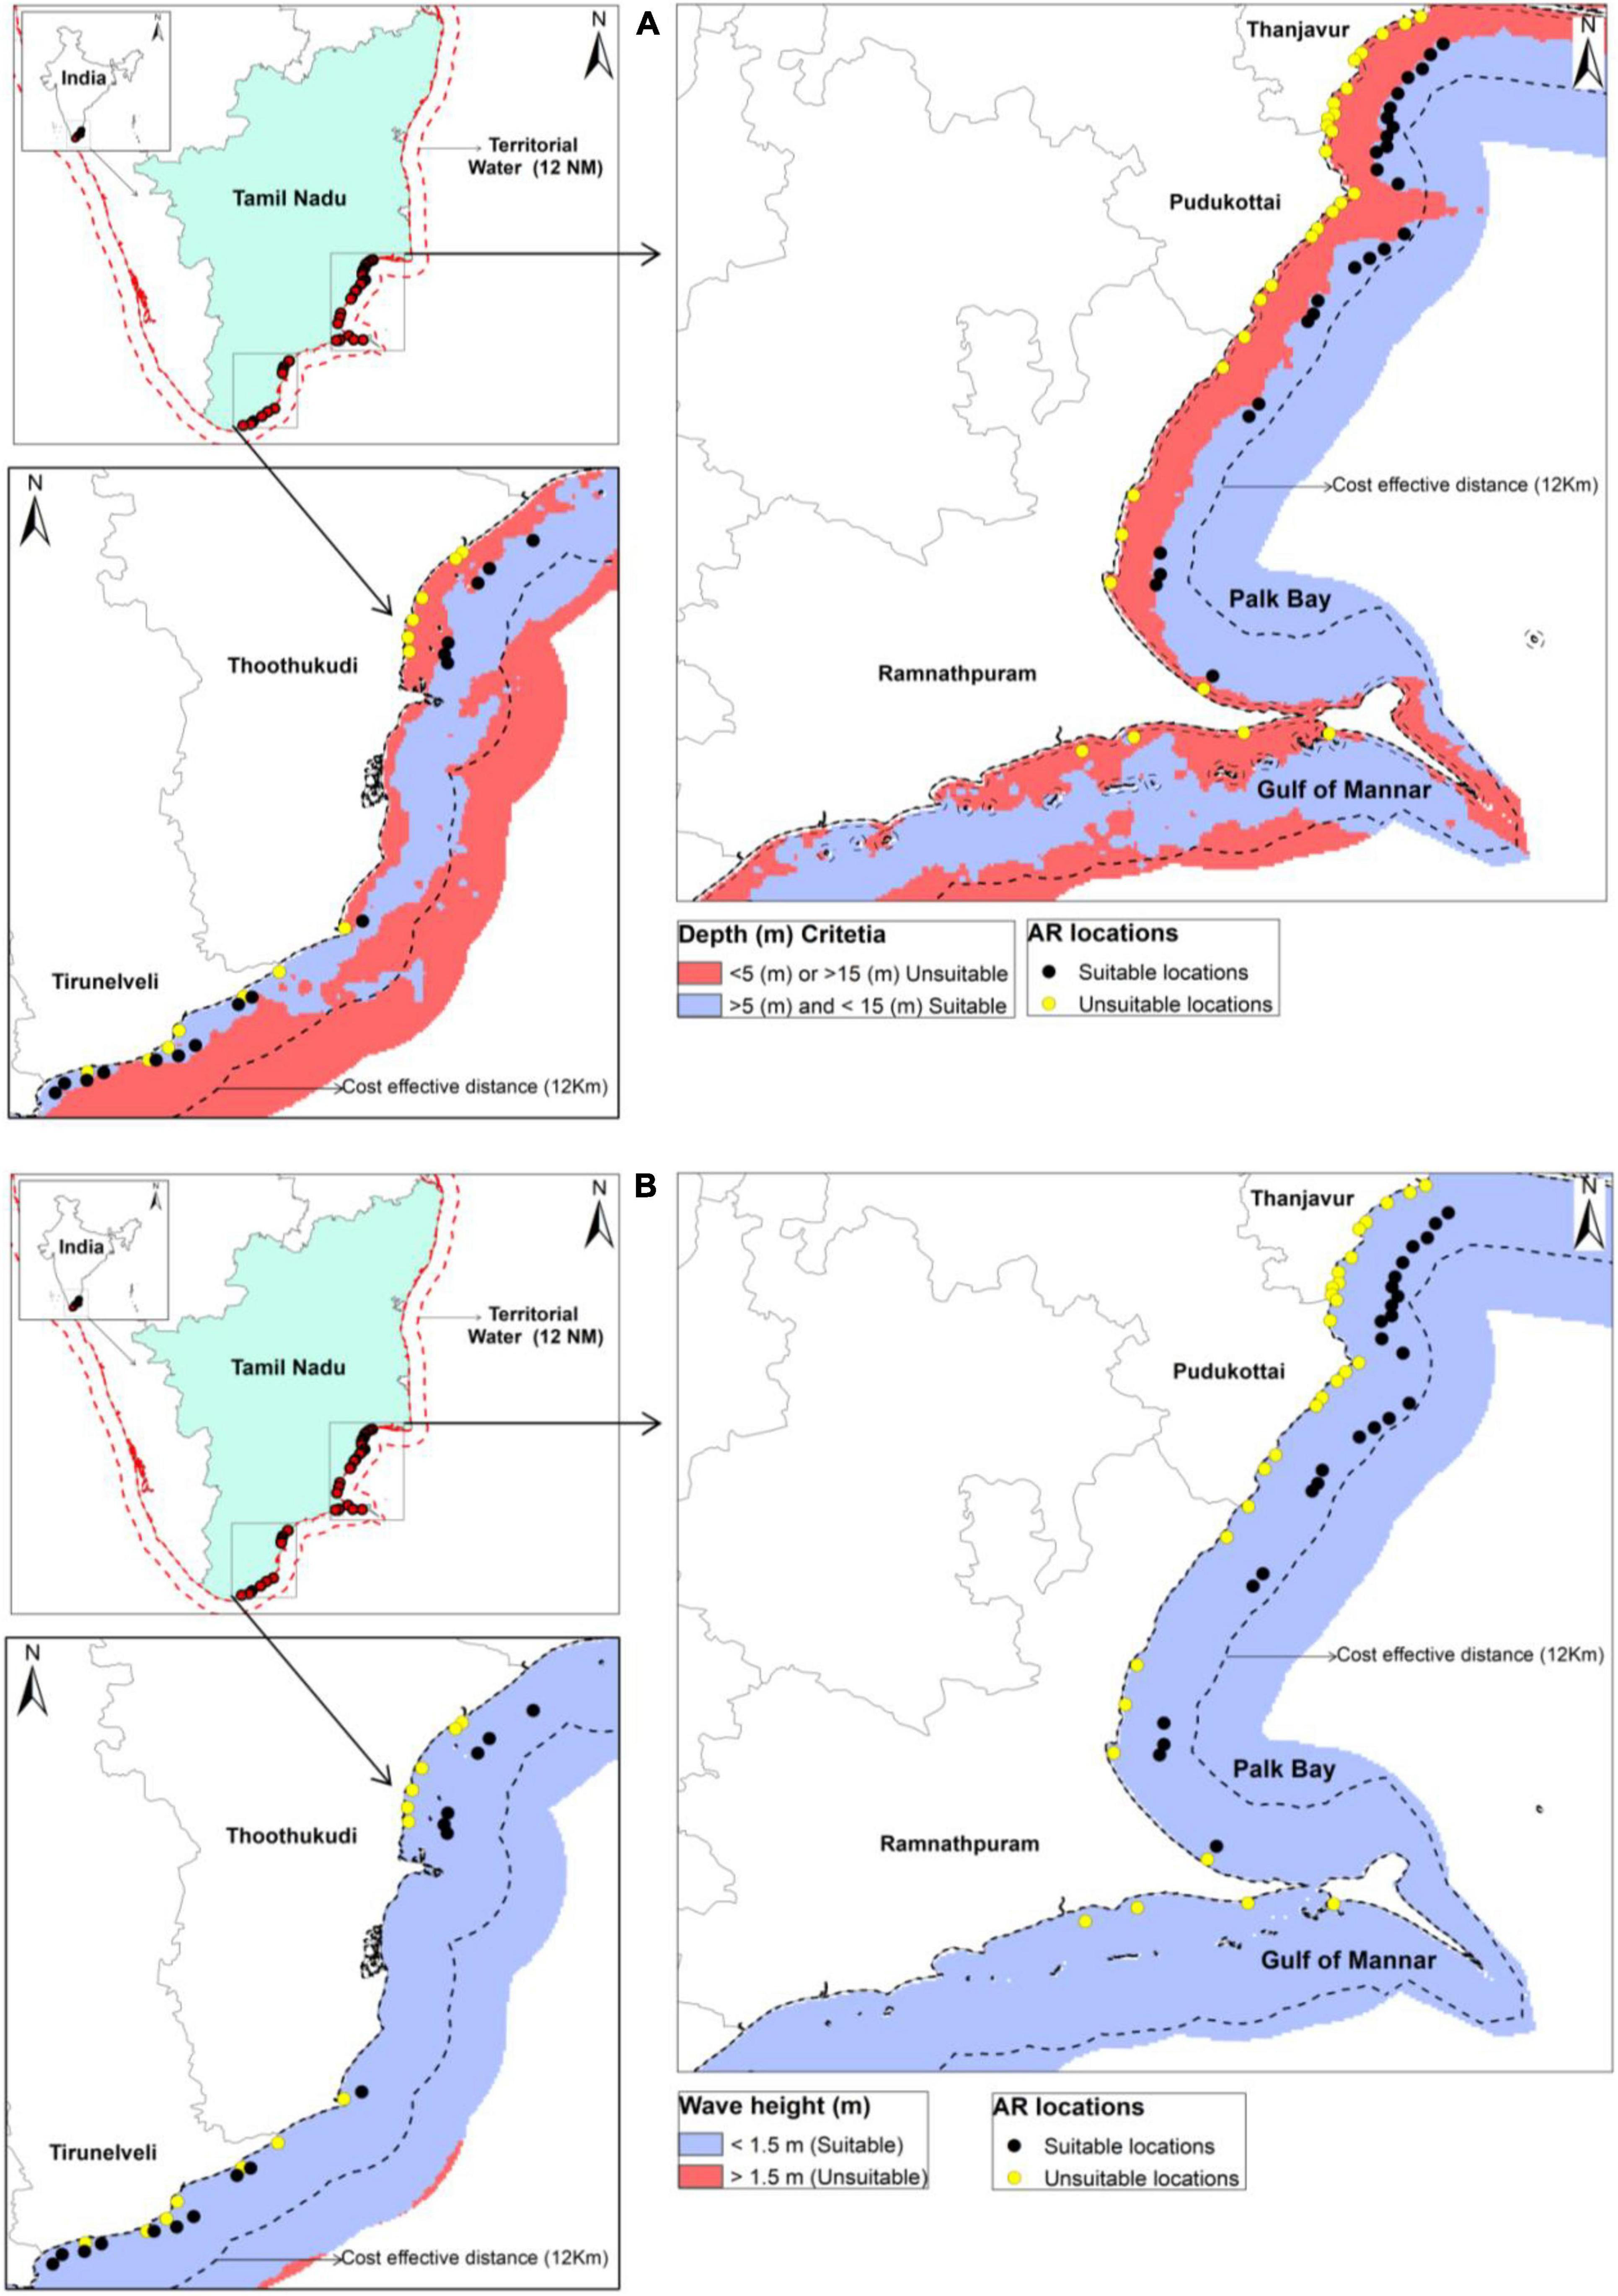
Figure 1. Exclusion mapping model for AR deployment along the Tamil Nadu coast. Data layer indicates unsuitable (red) and suitable (blue) for (A) bathymetry and (B) wave height produced through the GIS reclassification tool.
The site selection is an important step towards the AR deployment process and the restoration of fisheries in the selected coastal regions. In this study, systematic approaches were used for AR site selection: (1) Exclusion mapping (bathymetry, wave, cost-effective distances, and discharge points), (2) quantitative transect survey, and 3) constructing a GIS model (Barber et al., 2009). Sites that were too shallow or deep (<5.0 m or >15.1 m), had strong waves (>1.5 m), beyond the cost-effective distance (12 km), and within 1 km of the discharge point (i.e., shore) were eliminated from further consideration (Table 1).

Table 1. Reclassification values for bathymetry, wave height, cost-effective distance, and discharge points data used in the exclusion mapping model (adapted and modified from Barber et al., 2009).
The data for bathymetry was sourced from the General Bathymetric Chart of the Ocean (GEBCO) portal (spatial resolution of 30 Arc seconds). The average significant wave height (SWH) (spatial resolution of 0.25 degree) data was collected from the Indian National Centre for Ocean Information Services (INCOIS) over 1 year period. The depth and wave data were interpolated using the inverse distance weighted (IDW) method (Chang, 2006). We also generated buffer layers for the cost-effective distance (12 km) to incorporate that layer into the exclusion mapping model. To analyze such sites, a buffer layer of discharge locations (1 km) was also built. However, the buffer layer was not represented in the exclusion model. The criteria and sub-criteria for deploying AR are given in Table 2.
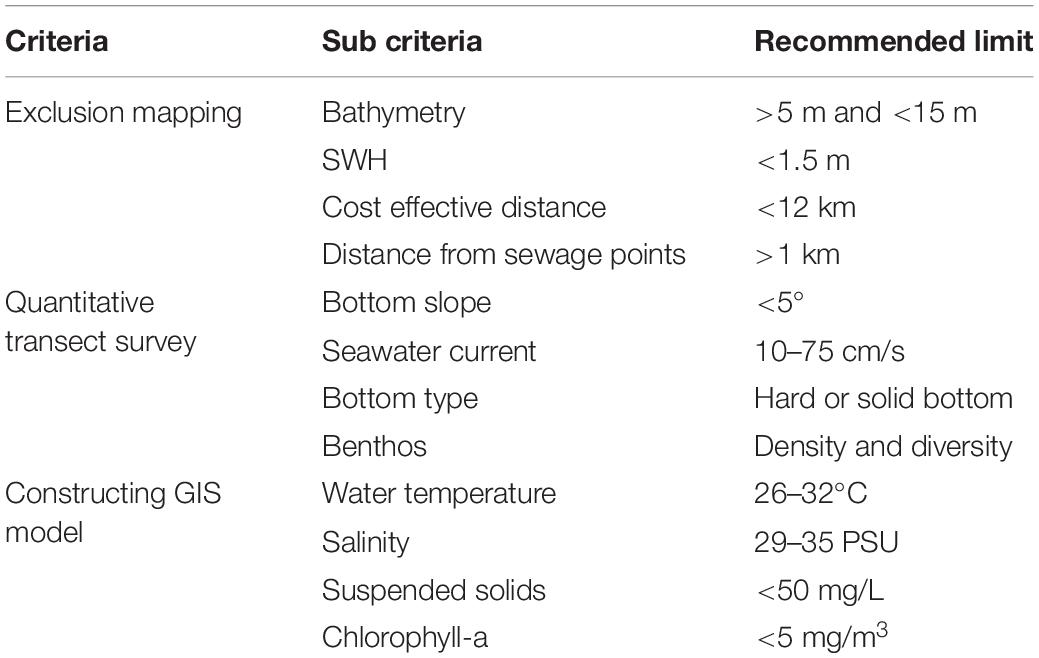
Table 2. Description of criteria and sub-criteria for artificial reef deployment (adapted and modified from Barber et al., 2009; Kapetsky et al., 2013; Mousavi et al., 2015; Jha et al., 2017).
After completing the initial site selection process using exclusion mapping (first step), the GIS model output was validated by conducting field sampling in suitable locations from January 2020 to April 2020. During the field survey, the bathymetry data of the suitable locations were measured by a multi-beam sonar system using a fishing trawler at 42 locations. Depth was corrected for tidal elevations and values were expressed with reference to chart datum (FAO, 2015). The seawater current was measured by deploying a current meter (RCM9) by following the protocols of FAO (2015). The slope was calculated based on the difference between the depths of measured points and the distance between those points. After initial exclusion, slope angles below 5° were considered for the AR deployment (Barber et al., 2009).
To determine the composition of the substrate at each site, underwater surveys using self-contained underwater breathing apparatus (SCUBA) were conducted along three 25-m transects at each site. The parallel transects were carried out at the 25 m × 25 m footprint for AR deployment. Each diver collected data on one side of the transect until the entire transect had been sampled (Barber et al., 2009). The viability of each site was discussed, and barren areas without seagrass or coral reef beds were selected for AR deployment among the sensitive ecosystem.
Sediment texture was determined in the field laboratory using the wet sieving and pipette method, and grain size fractions were obtained by dry sieving through a stack of 8 sieves ranging from 2 to 0.063 mm mesh sizes (Holme and McIntyre, 1984). To identify benthic fauna, sediment samples were collected using a Van-Veen grab having a surface area of 0.16 m2, and each sample was identified up to the lowest possible taxonomic level using standard taxonomic literature, and their density was expressed as ind/m2.
Considering the diversity of the data and the variety of scales on which all criteria can be measured, the values contained in the different thematic layers were transformed into comparable classes by following the reclassification tool of GIS (Malczewski, 2006). This data layer was used to identify suitable sites for the AR deployment. Out of 84 tentative locations, 42 locations that fell within these criteria were delineated as “suitable” locations and were further investigated. The average sea surface temperature (SST), sea surface salinity (SSS), total suspended matter (TSM), and chlorophyll-a (chl-a), data were collected (spatial resolution of 0.25 degree) from the INCOIS. In addition to that, the above parameters were also collected during the quantitative survey (in-situ) from the surface using a GOFLO sampler by a boat sampling. The sampling positions were geo-coded by using a hand-held GPS (Garmin eTrex Vista; ± 5 m). The SST and SSS were measured onboard by calibrated multi-parameter water quality instruments (Hanna HI9829). The TSS was determined by filtering 1 L of seawater through pre-dried and pre-weighed (0.45 μm Millipore GF/C) filter paper and washed with Milli-Q water to remove salt content (APHA [American Public Health Association], 2005). The chl-a was analyzed by a spectrophotometric method (Parsons et al., 1992). The TSS and chl-a samples were analyzed in the field laboratory and data were recorded after the analysis was completed. The samples were analyzed in triplicates, and quality control procedures were followed by careful standardization and blank measurements. One-way ANOVA was employed to test the spatial variations (station-wise) of physicochemical parameters. A geo-database of the above parameters was developed and imported to Arc GIS software (ver. 9.3.1). The parameters were interpolated using the IDW method (Chang, 2006). In this study, uniform class ranges and color codes were adopted for the maps generated through interpolation.
Eighty-four locations were considered for the exclusion modeling for the AR deployment; only 42 sites met the site selection criteria. These locations were within a 12 km radius of cost-effective distance and in the 5–15 m water depth range, conforming to accessibility criteria (Table 1). Similar results were also reported in which potential sites were within 11 km radius of the nearest shore, and in the 6–15 m mean water depth range at Massachusetts Bay (Barber et al., 2009). In the present study, none of the sites were located in the shipping route marked on navigational charts. A raster classification categorized depth layers into two classes (<5 m and >15 m = unsuitable, and >5 m and <15 m = suitable). Based on the threshold value of depth, the unsuitable and suitable areas have been represented in red and blue, respectively (Figure 1A). The cost-effective distance is very useful since the ARs give an excellent chance for impoverished artisanal fishermen who can’t afford a net can easily use a hook and line, to earn their livelihood by venturing to the AR areas for fishing (Kasim Mohamad et al., 2015). While, the optimal depth range helps in larval settlement on the AR structure (Duzbasilar et al., 2006). The spatial variation of depth was significant (p < 0.05, F = 59.755) in the present study. A buffer layer of 12 km was used for showing the accessible sites as per the cost-effective distance criteria, whereas a 12NM buffer was used for clipping the inaccessible territorial waters for artisanal and traditional fishermen. Further, wave height is another important technical criteria for AR deployment, because frequent high waves in the region will hamper ecosystem restoration (James and Slaski, 2006). Few areas in the offshore environment in Thoothukudi and Tirunelveli had wave heights of more than 1.5 m, as seen in Figure 1B, and those areas were eliminated from further investigation. The GIS model supported exclusion mapping and allowed us to eliminate 50% of prospective locations for the AR deployment.
The physical (slope, seawater current, and bottom type) and biological factors (benthos) played a vital role in the site selection process. In the present study, after initial screening through exclusion mapping, slope angles below 5° were considered suitable for the AR deployment. Similar results were reported in which slope angles below 5° were considered for the AR deployment at Massachusetts Bay (Barber et al., 2009). Similarly, optimum seawater current also plays a vital role in delivering nutrients and larvae to the newly deployed AR, as well as maintaining a well-oxygenated environment (Duzbasilar et al., 2006). The suggested seawater current ranges from 10 to 75 cm/s (Mousavi et al., 2015). However, in the present study, it ranged from 11 to 47 cm/s and its spatial variation was significant (p < 0.05, F = 3.317).
Hard-bottom habitat is critical to several life stages of commercially important species like lobster, crabs, marine finfish, and other species of invertebrates (Wahle and Steneck, 1992; Tupper and Boutilier, 1995; Packer et al., 1999). The bottom type in selected locations was categorized as: (1) very coarse sand, (2) coarse sand, (3) medium sand, (4) fine sand, (5) very fine sand, and (6) very coarse silt, which can support the deployment of AR. Apart from the good bottom substrate, the natural larval supply such as benthic fauna promotes the rebuilding of the newly deployed AR ecosystem (Pratt, 1994). We observed a total of 81 taxa of benthic fauna represented by a wide range of taxonomic groups namely Polychaeta, Amphipoda, Isopoda, Cumacea, Ostracoda, Nematoda, Bivalvia, Gastropoda, Echinoidea, Nemertea, and Cephalochordata (Pandey et al., 2022). The substratum heterogeneity and habitat complexity lead to higher diversity and abundance of the benthic community, which in turn supports the ecosystem formation around the ARs (Pandey et al., 2018; Pandey and Ganesh, 2019). The taxa and density of benthos varied from 15 to 45 and 1,131–3,666 ind/m2, respectively. The spatial variation of taxa (p < 0.05, F = 12.923) and density (p < 0.05, F = 6.083) was significant. The details of the selected site with its location, depth, slope angle, seawater current, bottom type, benthic taxa, and density are given in Table 3.
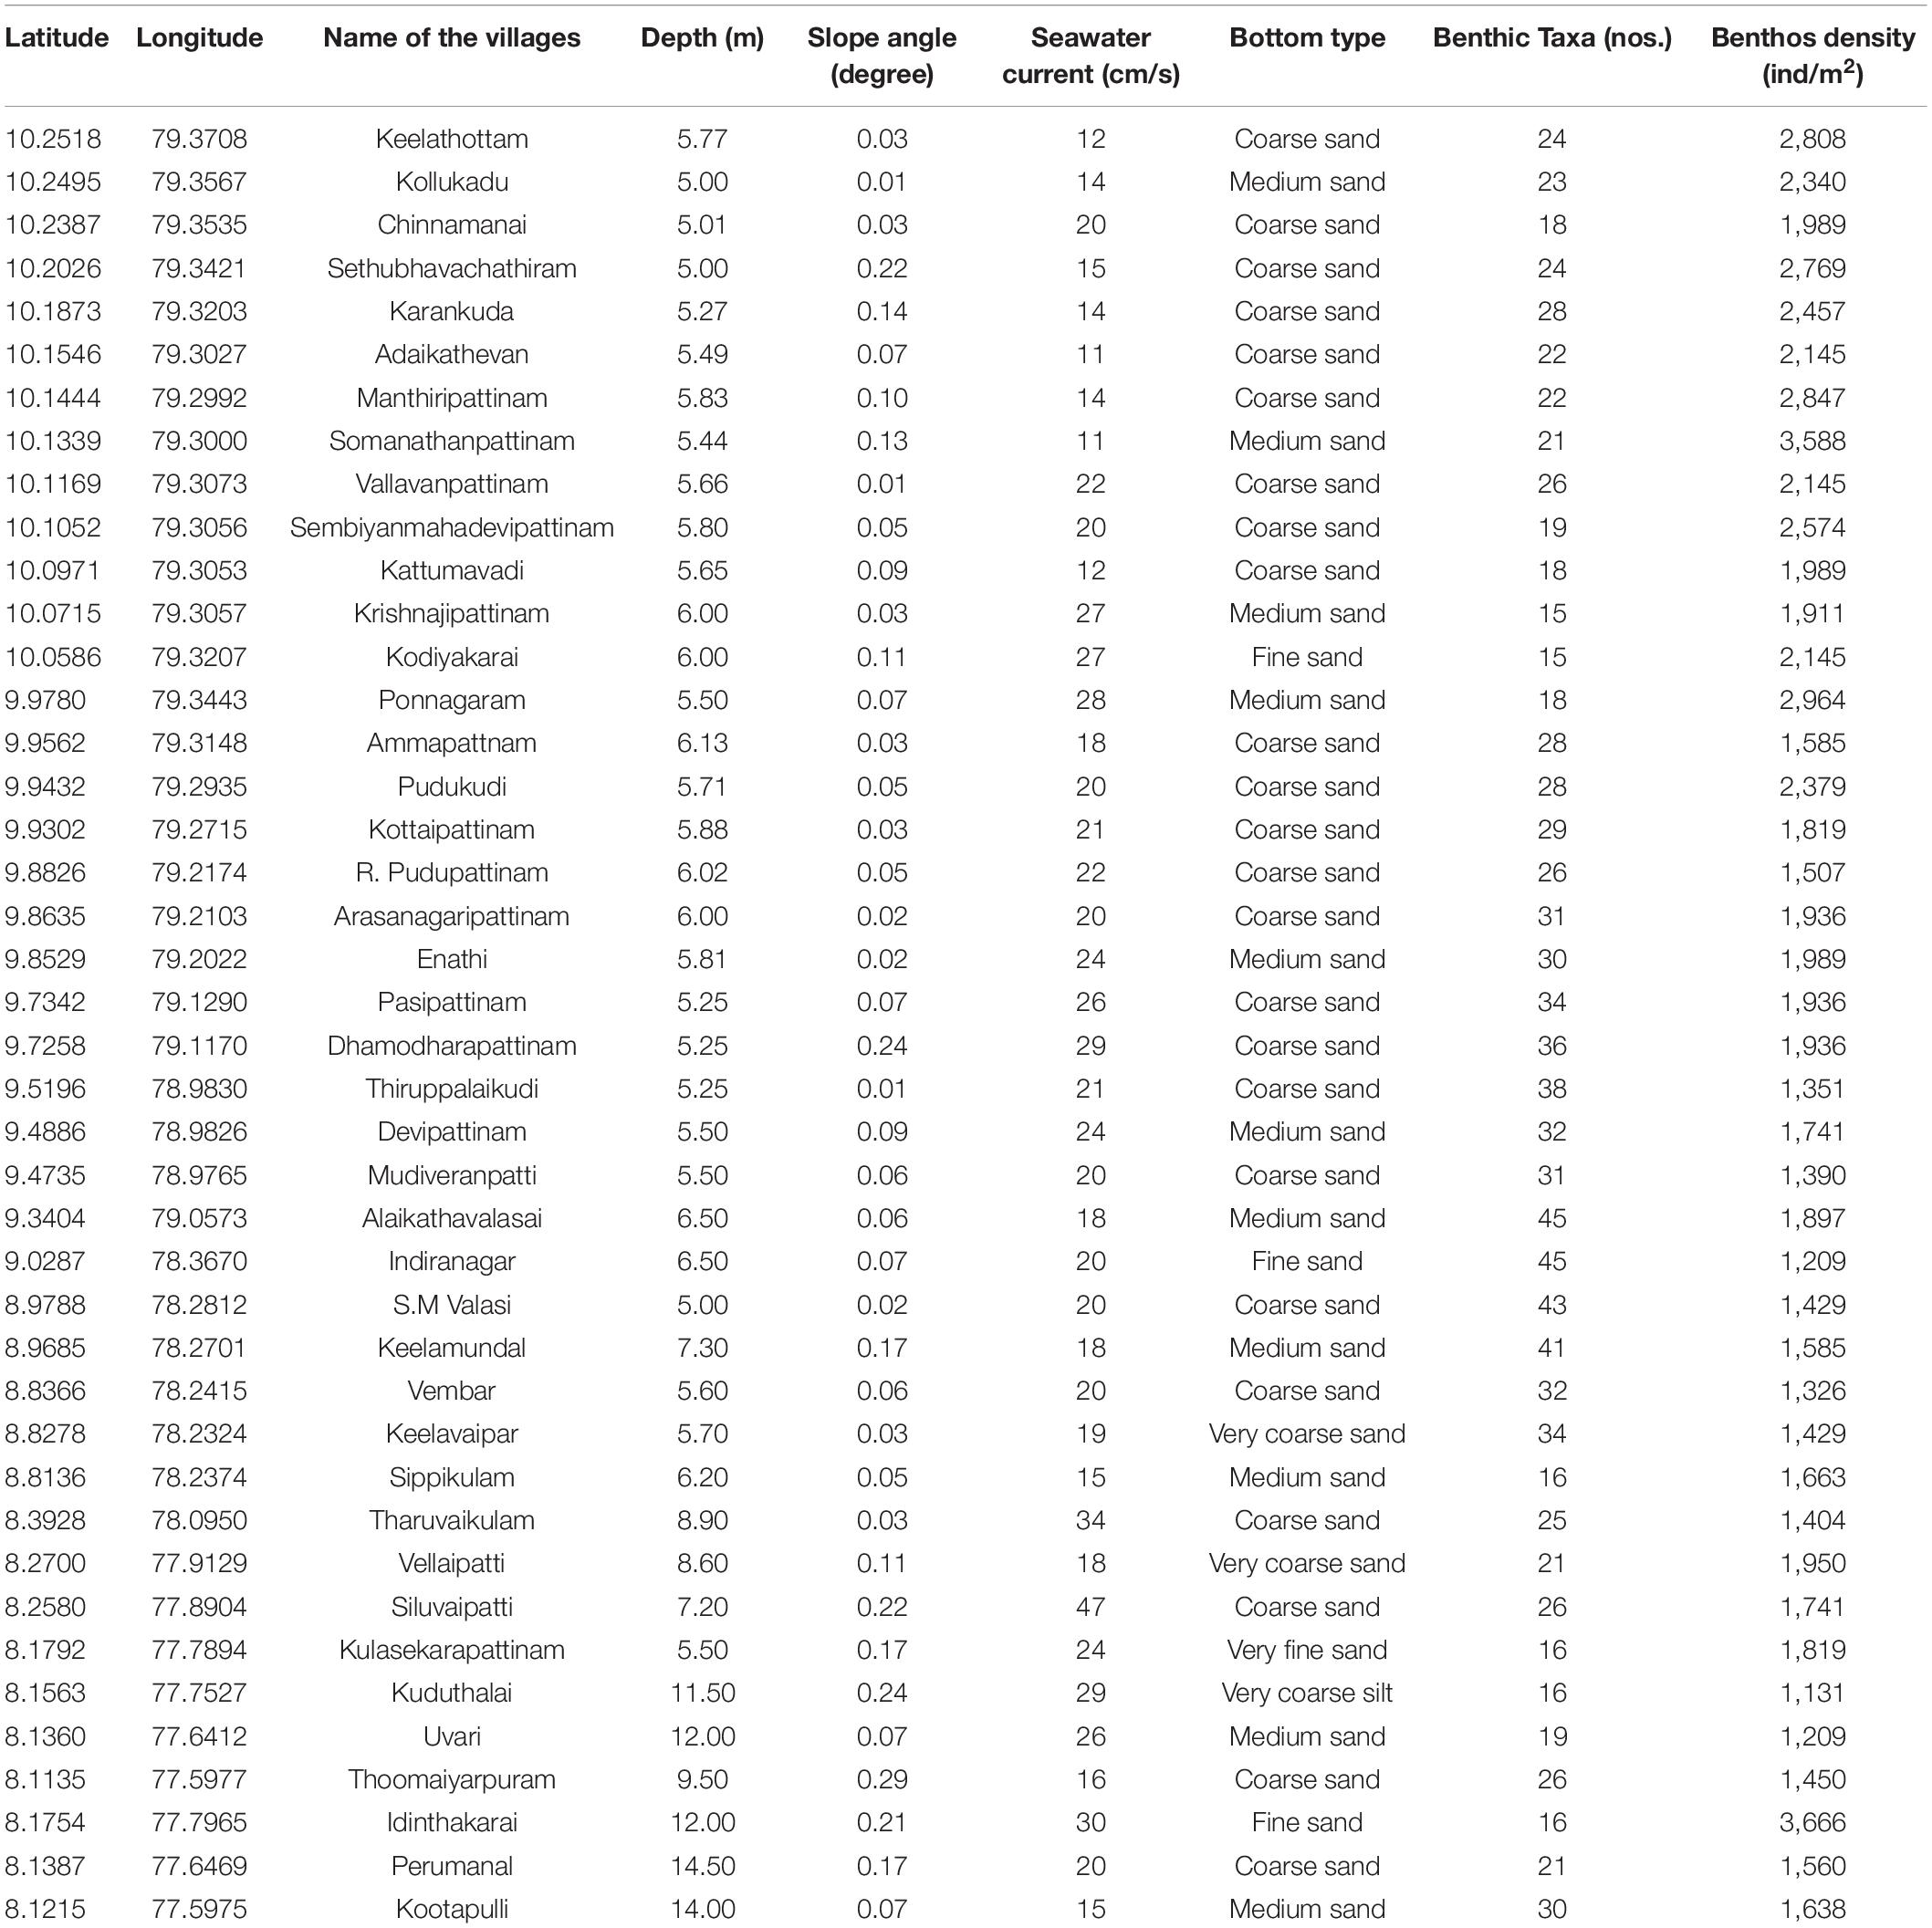
Table 3. Details of the Artificial Reefs deployed locations along the Tamil Nadu coast.
The IDW spatial interpolation technique was used to generate spatial maps (Figures 2A–H) for recommended environmental variables (TSS, SST, SSS, and Chl-a). The range of in-situ TSS concentration was 14–40 mg/L (Figure 2A), whereas (Figure 2B) satellite-derived data ranged from 2.72 to 61.69 mg/L. Similarly, SST (26.61–29.99°C) (Figure 2C), SSS (28.38–34.38 PSU) (Figure 2E), and chl-a (0.03–0.49 mg/m3) (Figure 2G) showed variation in the present study. However, the spatial variation was significant for SSS (p < 0.05, F = 8.001) and chl-a (p < 0.05, F = 4.558). Satellite derived data for SST, SSS, and chl-a, varied from 26.35 to 29.09°C (Figure 2D), 31.87–34.72 PSU (Figure 2F), and 0.24–2.07 mg/m3 (Figure 2H), respectively. The average value calculated for satellite data indicates that higher concentrations were noticed in the nearshore regions, whereas it was well within the site selection criteria at the selected locations in the offshore waters. The higher TSS could be attributed to the freshwater input from many perennial rivers (i.e., Krishna, Godavari, and Mahanadi) and several seasonal rivers (i.e., Palar, Vellar, and Coleroon) in the nearshore region (Shanthi et al., 2013). A range of values are represented by color codes for mapping the area that visualizes the concentration of specific parameters and shows the comparison. Visual interpretation is an easy method to depict and explain the dispersion pattern of environmental parameters (Lillesand and Kiefer, 1979) in a broader perspective, like AR deployment. This type of comparative study will help to select the suitable parameters that are available through satellite datasets for the better coverage and management of a long coastline. In-situ and satellite data validation is well reported for selected physicochemical parameters, e.g., chlorophyll-a, in southeast coast of India and it revealed good correlation coefficient (r2 = 0.89) (Selvavinayagam et al., 2003). Though the present study was limited to site suitability for AR deployment, earlier reports on the post-deployment study indicated a higher aggregation of juvenile fishes at the AR site along the Tamil Nadu coast.1
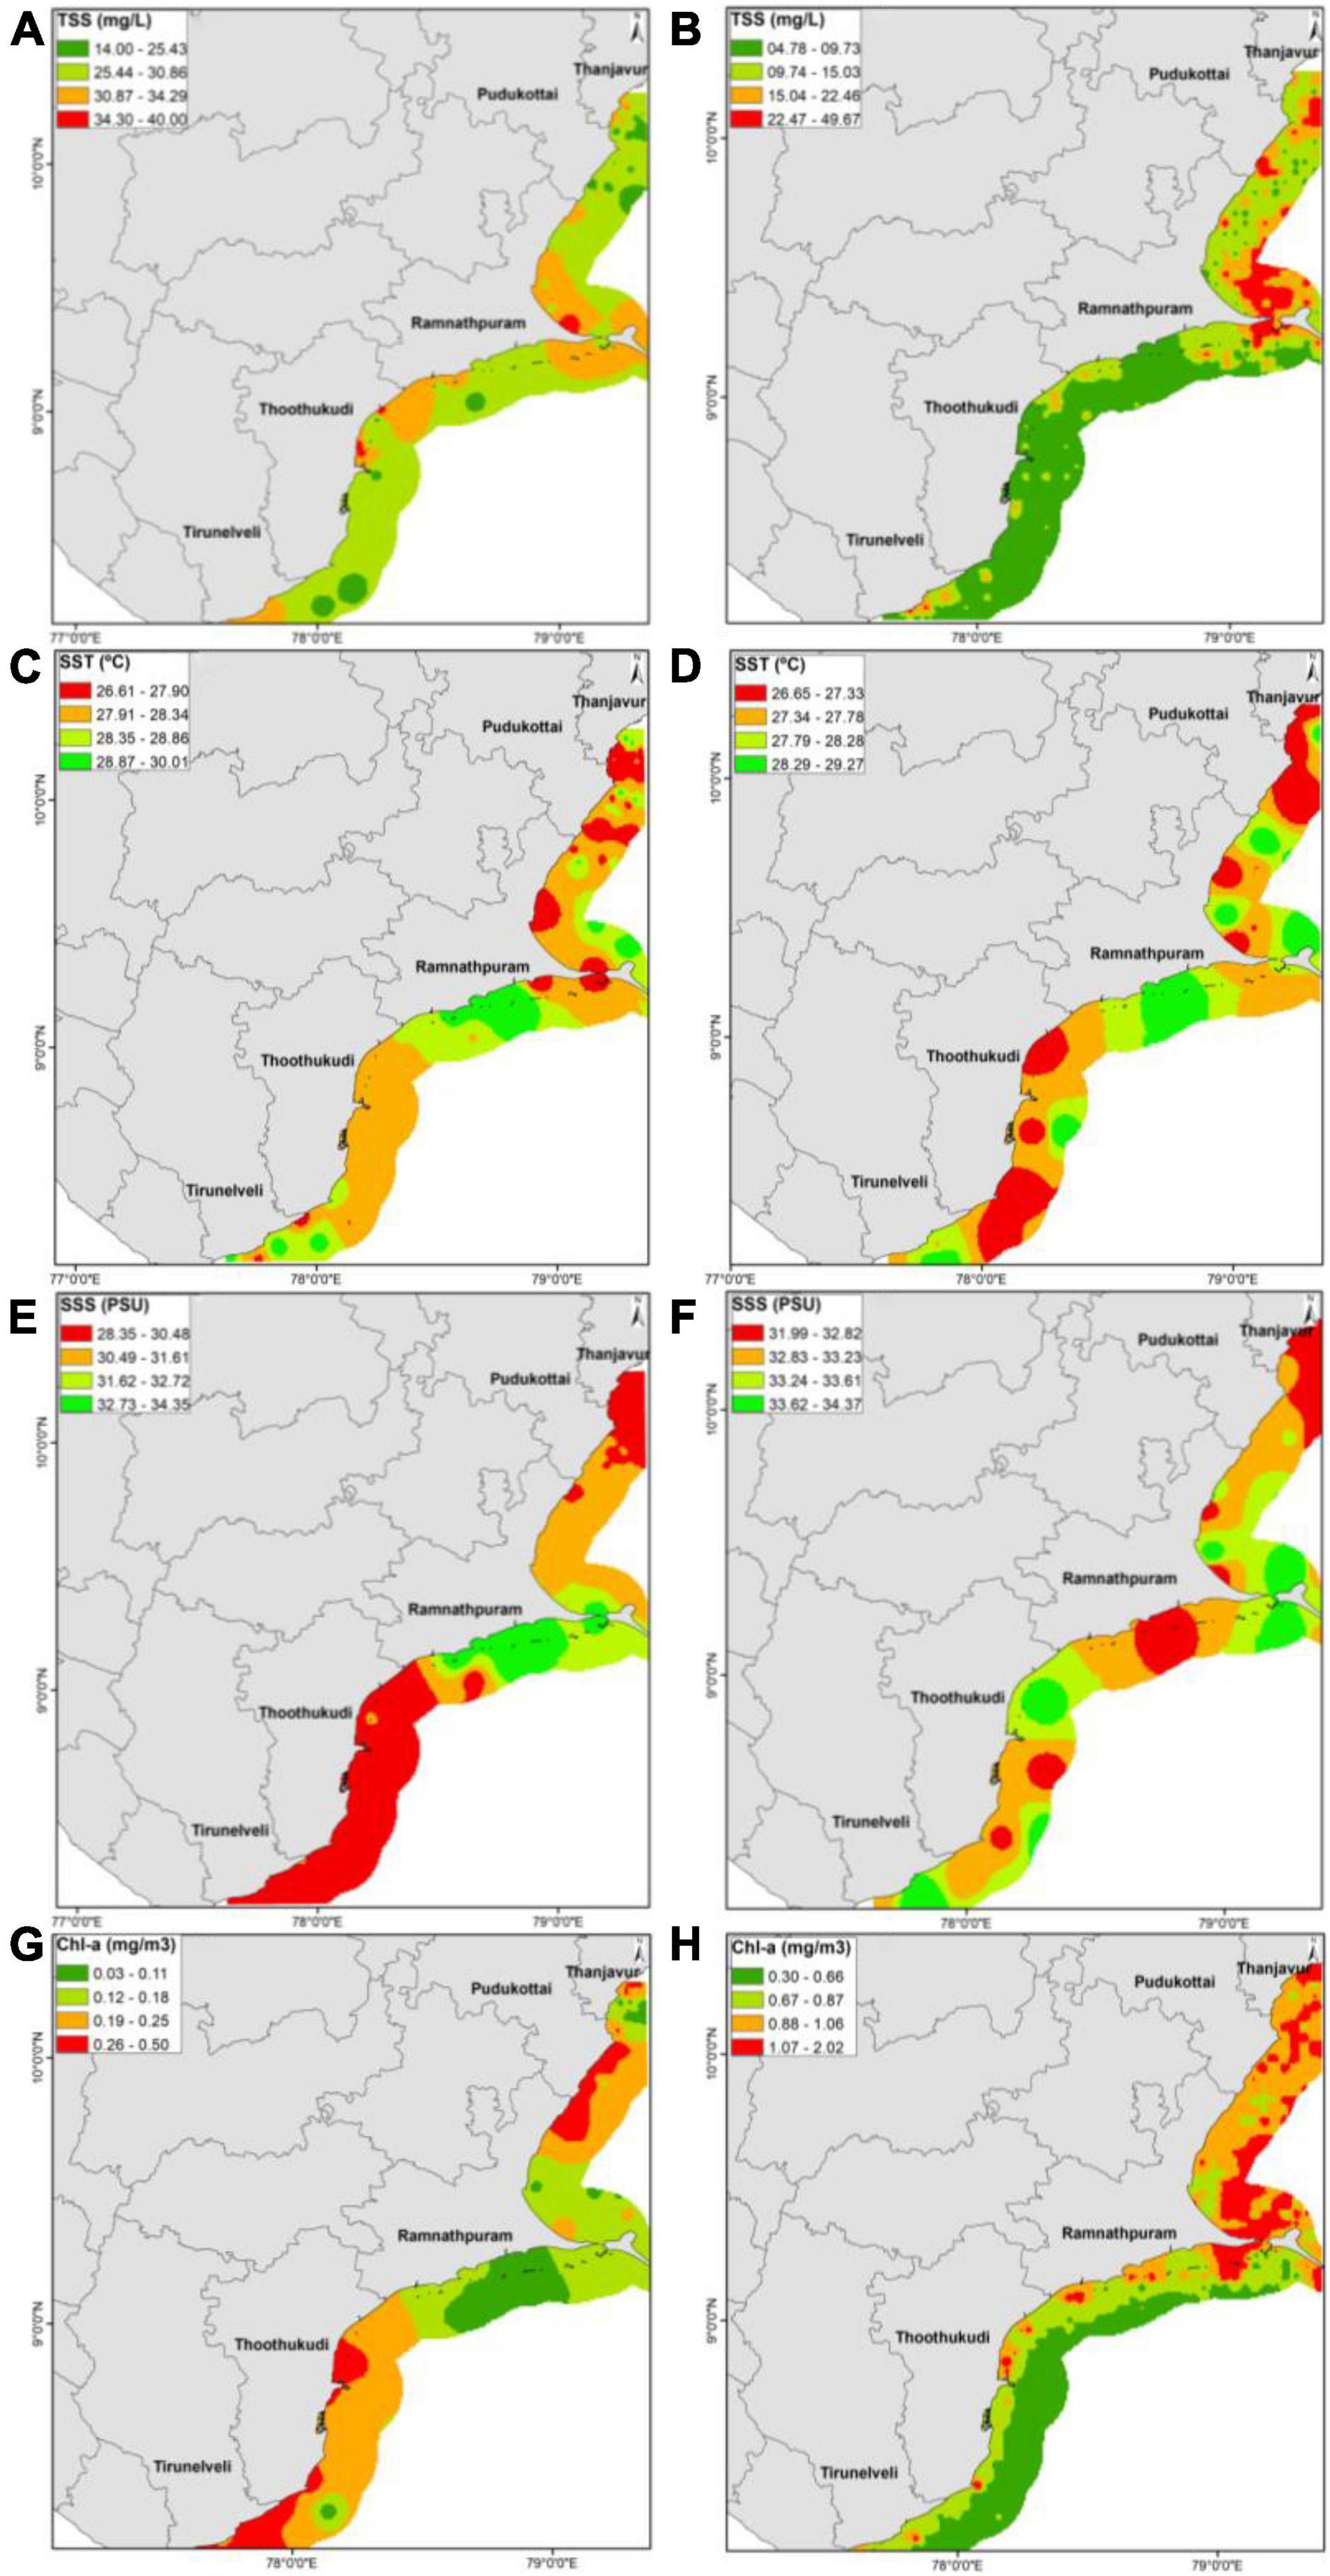
Figure 2. (A–H) In-situ (A,C,E,G) and satellite (B,D,F,H) data comparison along the Tamil Nadu coast.
A systematically planned site selection approach contributes to the development of an ecosystem around the AR, which in turn promotes sustainable rural technology highly suitable for the livelihood enhancement of artisanal and traditional coastal fishermen (Kasim Mohamad et al., 2015). It is claimed that biomass output in the ARs regions ranges between 2.5 and 5 tons per year, with biodiversity products/ecosystem services valued at USD 190,000 per year (Kasim Mohamad et al., 2015). Increase productivity by reducing fishermen’s reliance on natural coral reefs; it also promotes a healthy ornamental fish population, ecotourism, and natural resource conservation. Thorough monitoring of environmental factors is critical for the deployment of ARs in suitable sites. Yet, there is little data on the pre-deployment of ARs in India and globally. The current study will provide a good understanding of physical factors such as seawater quality, and benthic diversity at the pre-deployment stage of ARs in fisheries depleted coastal regions for promoting conservation and improving livelihoods through ecosystem services by enhancing 20% catch adjacent to ARs compared to sites away from the ARs in the Indian (Philipose, 1996) and global scenarios (Fabi and Fiorentini, 1994). The integrated approach will also aid in the development of a management strategy for site appropriateness prior to the deployment of ARs, resulting in improved outcomes and benefits to coastal society.
An integrated approach (exclusion mapping and quantitative transect survey) in combination with GIS proved to be a simple and systematic method to support AR site selection and deployment in the coastal environment. The deployment of ARs in the tropical coastal environment is critical for restoring the fisheries activities in depleted coastal areas. Finding a suitable site for AR deployment is an important step in the whole process. The study developed distinctive exclusion maps which supported screening out the non-potential sites for AR deployment. Results revealed that out of 84 tentative sites, only 50% met the site selection criteria. Considering the recent depletion in fish catch, especially for artisanal fishermen, a comprehensive plan needs to be evolved to initiate a systematic site selection approach before AR deployment. This will help to conserve the fish stock and support the fishermen in the coastal regions. Although Tamil Nadu was selected as the study area, the systematic site selection approach developed would be useful to other maritime nations, especially in the tropical regions.
The original contributions presented in the study are included in the article/supplementary material, further inquiries can be directed to the corresponding author/s.
DJ: conceptualization, sampling design, and data validation, GIS modeling, and writing – original draft. VP: sample collection, laboratory analysis, and data processing. JS: SCUBA diving and underwater data collection. PS and SV: field investigation and analysis. JJ: co-ordination of study and reviewing the data. GD: reviewing the manuscript, suggestion, and project management. RV: reviewing the manuscript, guidance, and project management. All authors contributed to the article and approved the submitted version.
The authors declare that the research was conducted in the absence of any commercial or financial relationships that could be construed as a potential conflict of interest.
All claims expressed in this article are solely those of the authors and do not necessarily represent those of their affiliated organizations, or those of the publisher, the editors and the reviewers. Any product that may be evaluated in this article, or claim that may be made by its manufacturer, is not guaranteed or endorsed by the publisher.
We are grateful to the Ministry of Earth Sciences, Government of India, for providing support to carry out the present study. We are thankful to G. A. Ramadass, Director, NIOT, Chennai, for his constant encouragement, support, and guidance. We show our gratitude to M. V. Ramana Murthy, Scientist-G, for their guidance and support for this study. We thank the Rural Development and Panchayat Raj Department, Government of Tamil Nadu, and Department of Fisheries and Fishermen Welfare, Government of Tamil Nadu for their kind support during the study. We are thankful to T. Srinivasa Kumar, Director, INCOIS, E. Pattabhi Rama Rao, Head, Data Modelling Group, INCOIS, and R. Venkat Shesu, Scientist-D, INCOIS for sharing data. We are also thankful to our colleagues S. Ragumaran, G. Nanadhagopal, and B. Ranjan Babu for their kind support during the fieldwork. Further, we extend our gratitude to the scientific and supporting staff of MBT, NIOT, Chennai, India, for their kind support during this study.
APHA [American Public Health Association] (2005). Standard Methods for the Examination of Water and Wastewater, 21th Edn. Washington, D.C: American Works Association and Water Environmental Federation.
Barber, J. S., Chosid, D. M., Glenn, R. P., and Whitmore, K. A. (2009). A systematic model for artificial reef site selection. New Zeal. J. Mar. Freshw. Res. 43, 283–297. doi: 10.1080/00288330909510001
Chang, K. T. (2006). Introduction To Geographic Information Systems, 3rd Edn. New Delhi: Tata McGraw Hill, 325–327.
Department of Ocean Development and Space Application Centre (1997). Coral Reef Maps Of India. Ahmedabad: Department of Ocean Development and Space Application Centre.
Duzbasilar, F. O., Lok, A., Ulas, A., and Metin, C. (2006). Recent developments on artificial reef applications in Turkey: hydraulic experiments. Bull. Mar. Sci. 78, 195–202.
Fabi, G., and Fiorentini, L. (1994). Comparison of an artificial reef and a control site in the Adriatic Sea. Bull. Mar. Sci. 55, 538–558.
FAO (2015). Practical Guidelines For The Use Of Artificial Reefs In The Mediterranean And The Black Sea: Studies and Reviews No.96.ISSN 1020-9549. Rome: FAO.
Figley, B. (2005). Artificial Reef Management Plan For New Jersey. Trenton, NJ: New Jersey Department of Environmental Protection, Division of Fish and Wildlife, 130.
Holme, N. A., and McIntyre, A. D. (1984). Methods For The Study Of Marine Benthos. Oxford: Blackwell Scientific Publication, 334.
James, M. A., and Slaski, R. (2006). Appraisal of the Opportunity For Offshore Aquaculture In UK waters. Report of Project FC0934 Commissioned by Defra and Sea fish from FRM Ltd., 119 pp. Available online at: www.seafish.org/media/Publications/Offshore_Aquaculture_Compiled_Final_ Report.pdf (accessed December 10, 2012).
James, P. S. B. R. (1994). “Endangered, vulnerable and rare marine fish and animals: threatened fish of India,” in Threatened Fish Of India, eds P. V. Dehadrai, P. Das, and S. R. Varma (Allahabad: NATCON),. 271–295.
Jha, D. K., Rajaprabhu, G., Kirubagaran, R., Sendhil Kumar, R., Dharani, G., Das, A. K., et al. (2017). Estimation of potential zones for offshore mariculture in the Indian Sea using geographical information system as a management tool. J. Coast. Conserv. 21, 893–902. doi: 10.1007/s11852-017-0556-y
Kaiser, M. J. (2006). The louisiana artificial reef program. Mar. Policy 30, 605–623. doi: 10.1016/j.marpol.2005.04.005
Kapetsky, J. M., Aguilar-Manjarrez, J., and Jenness, J. (2013). A Global Assessment Of The Potential For Offshore Mariculture Development From A Spatial Perspective. FAO Fisheries and Aquaculture Technical Paper No. 549. Rome: FAO, 181.
Kasim Mohamad, H., Syda Rao, G., Rajagopalan, M., Vivekanandan, E., Mohanraj, G., Kandasami, D., et al. (2015). Ecosystem Services By Artificial Reef Structures In The Marine Environment Along The Tamil Nadu Coast. Available online at: https://www.researchgate.net/publication/281117456 (accessed June 9, 2021).
Kennish, R., Wilson, K. D. P., Lo, J., Clarke, S. C., and Laister, S. (2002). Selecting sites for large-scale deployment of artificial reefs in Hong Kong: constraint mapping and prioritization techniques. ICES J. Mar. Sci. 59, S164–S170. doi: 10.1006/jmsc.2002.1209
Lillesand, T. M., and Kiefer, R. W. (1979). Remote Sensing And Image Interpretation. New York, NY: Wiley.
Malczewski, J. (2006). GIS-based multicriteria decision analysis: a survey of the literature. Int. J. Geogr. Inf. Sci. 20, 703–726. doi: 10.1080/13658810600661508
Moeinaddini, M., Khorasani, N., Danehkar, A., Darvishsefat, A. A., and Zienalyan, M. (2010). Siting MSW landfill using weighted linear combination and analytical hierarchy process (AHP) methodology in GIS environment (case study: Karaj). Waste Manag. 30, 912–920. doi: 10.1016/j.wasman.2010.01.015
Mousavi, S. H., Danehkar, A., Reza Shokri, M., Poorbagher, H., and Azhdari, D. (2015). Site selection for artificial reefs using a new combine multi-criteria decision-making (MCDM) tools for coral reefs in the Kish Island – Persian Gulf. Ocean Coast. Manag. 111, 92–102. doi: 10.1016/j.ocecoaman.2015.03.004
Muley, E. V., Subramanian, B. R., Venkataraman, K., and Wafar, M. (2000). “Status of coral reefs of India,” in Proceedings of the 9th International Coral Reef Symposium Bali, 360.
Murugan, A., and Durgekar, R. (2008). Beyond the Tsunami: Status of Fisheries in Tamil Nadu, India: A Snapshot of Present and Long-term Trends. Bangalore: UNDP/UNTRS, 75.
Packer, D. B., Cargnelli, L. M., Griesbach, S. J., and Shumway, S. E. (1999). Sea scallop, Placopecten magellanicus, Life history, and Habitat characteristics. Essential Fish Habitat Source Document, NOAA Technical Memorandum NMFS-NE-134. Washington, DC: NOAA, 30.
Pandey, V., and Ganesh, T. (2019). Spatial and temporal variability in the vertical distribution of gastropods on the rocky shores along the east coast of South Andaman Island, India. Mar. Biodivers. 49, 633–645. doi: 10.1007/s12526-017-0838-5
Pandey, V., Ganesh, T., and Satyam, K. (2018). Habitat heterogeneity determines the structural properties of intertidal gastropod assemblages in a pristine tropical Island ecosystem. Indian J. Geo Mar. Sci. 47, 846–853.
Pandey, V., Jha, D. K., Sathish Kumar, P., Santhanakumar, J., Venkatnaraynan, S., Prince Prakash Jebakumar, J., et al. (2022). Effect of multiple stressors on the functional traits of sub-tidal macrobenthic fauna: a case study of the southeast coast of India. Mar. Pollut. Bull. doi: 10.1016/j.marpolbul.2022.113355
Parsons, T. R., Maita, Y., and Lalli, C. M. (1992). A Manual of Chemical and Biological Methods for Sea Water Analysis. Oxford, NY: Pergamon Press.
Philipose, K. K. (1996). Artificial reefs habitat enhancement and increasing fisheries potential. CMFRI Bull. 48, 4–7.
Pratt, J. R. (1994). Artificial habitats and ecosystem restoration: managing for the future. Bull. Mar. Sci. 55, 268–275.
Raghuraman, R., Raghunathan, C., and Venkataraman, K. (2013). “Present status of coral reefs in india,” in Ecology and Conservation of Tropical Marine Faunal Communities, eds K. Venkataraman, C. Sivaperuman, and C. Raghunathan (Berlin: Springer). doi: 10.1007/978-3-642-38200-0_23
Reed, D. C., Schroeter, S. C., Huang, D., Andersen, T. W., and Ambrose, R. F. (2006). Quantitative assessment of different artificial reef designs in mitigating losses to kelp forest fishes. Bull. Mar. Sci. 78, 133–150.
Selvavinayagam, K., Surendran, A., and Ramachandran, S. (2003). Quantitative study on chlorophyll using IRS-P4 OCM data of Tuticorin coastal waters. J. Indian Soc. Rem. Sens 31, 227–235. doi: 10.1007/BF03030829
Shanthi, R., Poornima, D., Raja, S., Vijayabaskara Sethubathi, G., Thangaradjou, T., Balasubramanian, T., et al. (2013). Validation of OCM-2 sensor performance in retrieving chlorophyll and TSM along the southwest Bay of Bengal coast. J. Earth Syst. Sci. 122, 479–489. doi: 10.1007/s12040-013-0286-y
Spieler, R. E., Gilliam, D. S., and Sherman, R. L. (2001). Artificial substrate and coral reef restoration: what do we need to know what we need. Bull. Mar. Sci. 69, 1013–1030.
Sreekanth, G. B., Lekshmi, N. M., and Singh, N. P. (2019). Can artificial reefs enhance the inshore fishery resources along indian coast? A critical review. Proc. Natl. Acad. Sci. India Sect. B Biol. Sci. 89, 13–25. doi: 10.1007/s40011-017-0861-0
Thanner, S. E., Mclnosh, T. L., and Blair, S. M. (2006). Development of benthic and fish assemblages on artificial reef materials compared to adjacent natural reef assemblages in Miami-Dade County, Florida. Bull. Mar. Sci. 78, 57–70.
Tseng, C., Chen, S., Huang, C., and Liu, C. (2001). GIS-assisted site selection for artificial reefs. Fish. Sci. 67, 1015–1022. doi: 10.1046/j.1444-2906.2001.00356.x
Tupper, M., and Boutilier, R. G. (1995). Effects of habitat on settlement, growth, and post-settlement survival of Atlantic cod (Gadus morhua). Can. J. Fish. Aquat. Sci. 52, 1834–1841. doi: 10.1139/f95-176
Vijayanand, P., Murugan, A., Saravanakkumar, K., Ajmalkhan, S., and Rajagopal, S. (2007). Assessment of lobster resources along Kanyakumari (Southeast coast of India). J. Fish. Aquat. Sci. 2, 387–394. doi: 10.3923/jfas.2007.387.394
Wahle, R. A., and Steneck, R. S. (1992). Habitat restriction in early benthic life: experiments on habitat selection and in situ predation with the American lobster. J. Exp. Mar. Biol. Ecol. 157, 91–114. doi: 10.1016/0022-0981(92)90077-N
Keywords: artificial reef, fishery, coastal, GIS, Tamil Nadu
Citation: Jha DK, Pandey V, Santhanakumar J, Sathish Kumar P, Venkatnarayanan S, Jebakumar JPP, Dharani G and Vijaya R (2022) Evaluation of Site Suitability for Artificial Reefs Deployment in Southeast Coast of India Using Geographical Information System as a Management Tool. Front. Mar. Sci. 8:817975. doi: 10.3389/fmars.2021.817975
Received: 18 November 2021; Accepted: 15 December 2021;
Published: 25 January 2022.
Edited by:
Meilin Wu, South China Sea Institute of Oceanology, Chinese Academy of Sciences (CAS), ChinaReviewed by:
Satheeswaran Thangaraj, Incheon National University, South KoreaCopyright © 2022 Jha, Pandey, Santhanakumar, Sathish Kumar, Venkatnarayanan, Jebakumar, Dharani and Vijaya. This is an open-access article distributed under the terms of the Creative Commons Attribution License (CC BY). The use, distribution or reproduction in other forums is permitted, provided the original author(s) and the copyright owner(s) are credited and that the original publication in this journal is cited, in accordance with accepted academic practice. No use, distribution or reproduction is permitted which does not comply with these terms.
*Correspondence: Dilip Kumar Jha, ZGlsaXBqaGFuaW90QGdtYWlsLmNvbQ==
Disclaimer: All claims expressed in this article are solely those of the authors and do not necessarily represent those of their affiliated organizations, or those of the publisher, the editors and the reviewers. Any product that may be evaluated in this article or claim that may be made by its manufacturer is not guaranteed or endorsed by the publisher.
Research integrity at Frontiers
Learn more about the work of our research integrity team to safeguard the quality of each article we publish.