 Mohd Nazri Yasmin1,2Siti Fatin Mohd Razali1*Suraya Sharil1Wan Hanna Melini Wan Mohtar1Khairul Adzim Saadon2
- 1Department of Civil Engineering, Faculty of Engineering and Built Environment, Universiti Kebangsaan Malaysia, UKM Bangi, Selangor, Malaysia
- 2Department of Irrigation and Drainage, Ministry of Environment and Water, Kuala Lumpur, Malaysia
Managing floods in low-lying coastal plains are challenging because of the complexity of the underlying physical processes and the combination of factors such as high tides and, severe storm events. In Malaysia, there were concerns from local people about the construction of a tidal control gate that is believed to contribute to the causes of local flooding. The performance of tidal control gates as flood control structures was studied to determine their significance and importance. The objective of this study is to evaluate the effectiveness of tidal control gates in reducing the impact of floods during high tide with severe storm events. The methodology of the study requires the usage of the hydrodynamic model using design rainfall for three scenarios with land use changes in 2015 and 2020. Three feasible scenarios were identified and further investigated. Scenario 1: without a tidal control gate; Scenario 2: with the existing tidal control gate fully open; and Scenario 3: with the existing tidal control gate fully closed. The simulation result clearly shows that the floodplain is smaller in 2015 as compared to the land use changes in 2020 because of land use permeability. In addition, the floodplain for Scenarios 2 and 3 in 2015 and 2020 is 2%–3%, respectively, smaller than that of Scenario 1 for the 20-year average recurrence interval and 3%–8%, respectively, smaller for the 100-year average recurrence interval. The results showed the influence of heavy rainfall whereby the maximum downstream discharge increment varied from 4.06% to 4.28% during high tide. Whereas the flow level for the 100-year average recurrence interval shows an increment from 0.52% to 1.53%. If the tidal control gate is not operated properly it will cause the tidal water to flow back into the upstream areas thus exposing to an increased floodplain area ranging from 2.3% to 8.4%. Which emphasizes the importance of operational methods for tidal control gate in determining its efficiency. However, further studies should also be done on the reduction of damage value involved with the construction of tidal control gate, its value in saving lives, property and in other parts of the world having different tidal variations.
1 Introduction
Urban heat not only threatens urban ecosystems and human health, but also has significant economic and social consequences. It causes a significant increase in global temperature, leading to increases in atmospheric evapotranspiration and moisture content, as well as changes in precipitation patterns (Wang et al., 2016). These minor changes can lead to a significant increase in precipitation extremes, which become more intense and frequent as the climate warms (Shahid et al., 2016). The effects of global warming are even more catastrophic in densely populated areas, especially in coastal regions. According to (Pour et al., 2020), coastal megacities in developing countries face growing challenges such as rapid urbanization, inadequate infrastructure, and lack of basic amenities to meet the needs of growing populations. The geography of these coastal megacities makes them vulnerable to natural disasters, especially flooding.
The phenomenon of climate change is accompanied by rapid development, leading to major challenges in planning and managing urban areas (Muhammad Arshad et al., 2020). Global climate change is usually associated with global warming, which is a very complex and time-consuming process (Mohd et al., 2018). In order to meet global climate change commitments, resilient cities have gained significant attention in public policy and are critical for climate management of the 6.3 billion people who will live in cities in 2050 (Chuang et al., 2020). The goal of creating a resilient city is to reduce both vulnerabilities to flooding and exposure to hazards (Hofmann, 2021). Achieving disaster resilience and reducing risks require more than just rebuilding or recovering from a disaster, as social justice, participation, and livelihoods must also be promoted.
Widespread economic and physical development are changing the environment and putting people at a greater risk of environmental disasters. The conversion of large forest areas into cities, settlements and industry threatens the functioning of natural systems which leads to negative environmental impacts (Syed Hussin and Ismail, 2016). The catastrophic floods that have hit the world have had a profound impact on people’s lives. The World Meteorological Organisation (WMO) has confirmed that floods are the third largest natural disaster in the world (Rokiah et al., 2014), and the damage increases to more than $1 trillion every year (Liu et al., 2021). Preventing and mitigating flooding requires continuous research, numerous investment decisions and extensive expansion and reconstruction of flood protection infrastructure (Haque, 2000). Flooding occurs when an area is inundated by an amount of water that exceeds the hydraulic capacity of the catchment area, such as rivers, drainage systems and reservoirs (Hua, 2016). In 2016, Yangtze River floods in China affected more than 1.044 million people and caused economic losses of 3.45 billion yuan (Liu et al., 2021). In Malaysia, the frequency of flood is increasing every year and affects the population, especially those living in low-lying areas such as floodplains of riverine. Based on flood record, Malaysia had an inundated area of 33,298 km2, which is 10.1% of the country’s land area. A total of 5.7 million citizens are at risk from the floods, resulting in an average loss of RM36 billion per year (Department of Irrigation and Drainage Malaysia, 2020).
Previous studies show that flooding is caused by natural environmental factors as well as human activities (Ahmad and Simonovic, 2000; Chan, 2002). Furthermore, the usage of computational simulation techniques with the involvement of end user will increase the confidence of the model development to ensure a realistic outcome is attained when handling complex dynamic system (Ahmad and Simonovic, 2000). Natural environmental factors are caused by uneven spatial and temporal distribution of rainfall (Chan, 2002) or heavy and persistent rainfall (Hamzah et al., 2020), low and hilly topographic conditions near rivers including estuaries (Gasim et al., 2010), tidal influences including sea level rise due to climate change (Huong and Pathirana, 2013; Abbas et al., 2014) and the combined effect of high tide and heavy rainfall (Shen et al., 2019). Extreme rainfall, especially on steep terrain can also significantly weaken the soil and cause mudslides that damage homes, roads and property, and pose an even greater risk to human life (Samsuri et al., 2018).
Human activities that cause floods include alteration of the hydrological landscape of watersheds, such as increase in impermeable surfaces and decrease in permeable surfaces (Huong and Pathirana, 2013), insufficient capacity of drainage systems (Gao et al., 2020), maintenance of imperfect rivers and canals (Gasim et al., 2010), and construction of bridges, sewers, spillways, and sluices that affect river flow and existing drainage systems. The construction of bridges, which does not take into account future increases in rainfall, also affects flow velocity and river levels, leading to flooding upstream of the bridge (Brandimarte and Woldeyes, 2012; Costabile et al., 2015).
The influence of these two factors can lead to changes in the flow profile of rivers and drainage systems (Toriman et al., 2009). The flow profile indicates the height of the flow curve, with an increase in the height of the flow curve downstream indicating backwater. The type of discharge profile depends on the basic condition of the channel slope (Chow, 1959). Backwater occurs when the flow in hydraulic channels such as rivers and drainage systems is disturbed by natural and man-made obstructions. The influence of the tidal, natural changes in the river profile and structures such as bridges and piers (Konrad, 2003; Costabile et al., 2015) also affect the increase in flow velocity and river level and can cause backwater in the headwaters and its tributaries.
Consequently, the water level in the upper reaches of the river network increases as compared to the lower reaches and the flow velocity in the urban drainage system eventually decreases, leading to flooding (Hassan, 2005; Toriman et al., 2009).
Tidal control gates and barriers are structural methods of managing flooding due to tidal influences, particularly in agricultural and urban areas (Walsh and Miskewitz, 2013; Department of Irrigation and Drainage Malaysia, 2020). They are mainly used in estuaries and downstream areas (Wu et al., 2015). The ability of tidal control gates to provide flood protection depends on how and for how long they are in operation (Li et al., 2017; Zhang et al., 2017). In Malaysia, the Department of Irrigation and Drainage (DID) has built 1,589 tidal control gates by 2017 (Department of Irrigation and Drainage Malaysia, 2020). However, studies by (Mohamad et al., 2014) and (Muroi et al., 2021) show that the impact of tidal control gates needs to be studied to ensure the effectiveness of flood control along the river.
The effectiveness of tidal gate requires regular maintenance and management in order to maintain its longevity and performance, as it is often left alone for lengthy periods (Charland, 1997) and there is a concern in the community that the construction of the tidal gate will lead to severe flooding. The effectiveness of TCG was recently questioned on 18 December 2021 during the major flood in Taman Sri Muda, Shah Alam, Selangor, Malaysia with the operation of the gates being the reason for persistent flooding in the area (Alhadjri, 2021; Ariff and Ramachandran, 2022). Based on the guidelines of the Manual for Urban Stormwater Management in Malaysia (MSMA) by the Department of Irrigation and Drainage Malaysia, (2012), it was found that no attention is paid to the assessment and impact of backwater, instead, the focus is on the planning and design of tidal gates and flood gates (Lee and Mohamad, 2016). Conventional methods of measuring the amount of runoff entering the river system are also often questioned (Leow et al., 2009). Therefore, there is a need to clarify the importance and especially the impact of tidal gates as an option for flood control, particularly in coastal areas with large tidal phenomena.
The objectives of this study are: 1) to analyse the water level profile of Aur River during severe storm events; 2) to investigate the impact of backwater in regard to different operations of the tidal control gates to the upstream part of the Aur River, taking into account land use changes and tidal conditions; and 3) to determine the effectiveness of tidal control gates in reducing flood plain area using a hydrodynamic model.
XPSWMM is used for the modelling phase of the process as it is able to simulate flood flows within the drainage network of each catchment while providing information on inflow and details of the flood event. It can be concluded that 2D hydrodynamic modelling in the XP-SWMM package provides considerable opportunities for users to carry out in-depth analyses of urban drainage systems, waterways and floodplains (Phillips et al., 2005; Kwak et al., 2016; Hasan et al., 2019). It provides modelling capabilities for continuous simulations, various hydrograph generation methods, a combination of open and closed channels, loop networks, storage nodes, including ponds, and numerous outfalls. Essentially, the model can be used to solve the entire St. Venant equations (hydrodynamic flow) for one-dimensional, unsteady, gradually changing flows in a drainage network (Phillips et al., 2005).
The subsequent sections will cover methodology, result and discussion and lastly conclusion. The methodology will further describe the study area and explain the theories and principles for the process of land use analysis, tidal analysis and hydrodynamic modelling analysis including the model calibration and validation. Results and discussion will then highlight the findings of all the analyses involved and finally conclude the study according to the aim and objectives. This paper will also include acknowledgement and references of the study.
2 Methods
2.1 Study area
This study was conducted in the Aur River Basin in Klang District, Selangor, Malaysia (see Figure 1), one of the largest river basins in Klang District. It extends from 101.394531 T to 101.461029 T and 2.987979 U–3.000633 U on the west coast of Peninsula Malaysia. The geometry of this river has a length of 10.5 km, an average depth of 2–3 m and flows directly into the Klang Strait with a catchment area of 3,798 ha. It is frequently flooded due to the combination of natural factors and human activities, such as rainfall distribution, land use changes, low land topography, and tidal influences. In addition, the increased river flow and hydraulic obstructions have led to flash floods in recent years (Hasan et al., 2019). The TCG examined in this study is the TCG Pandamaran, located on the Aur River (see Figure 1).
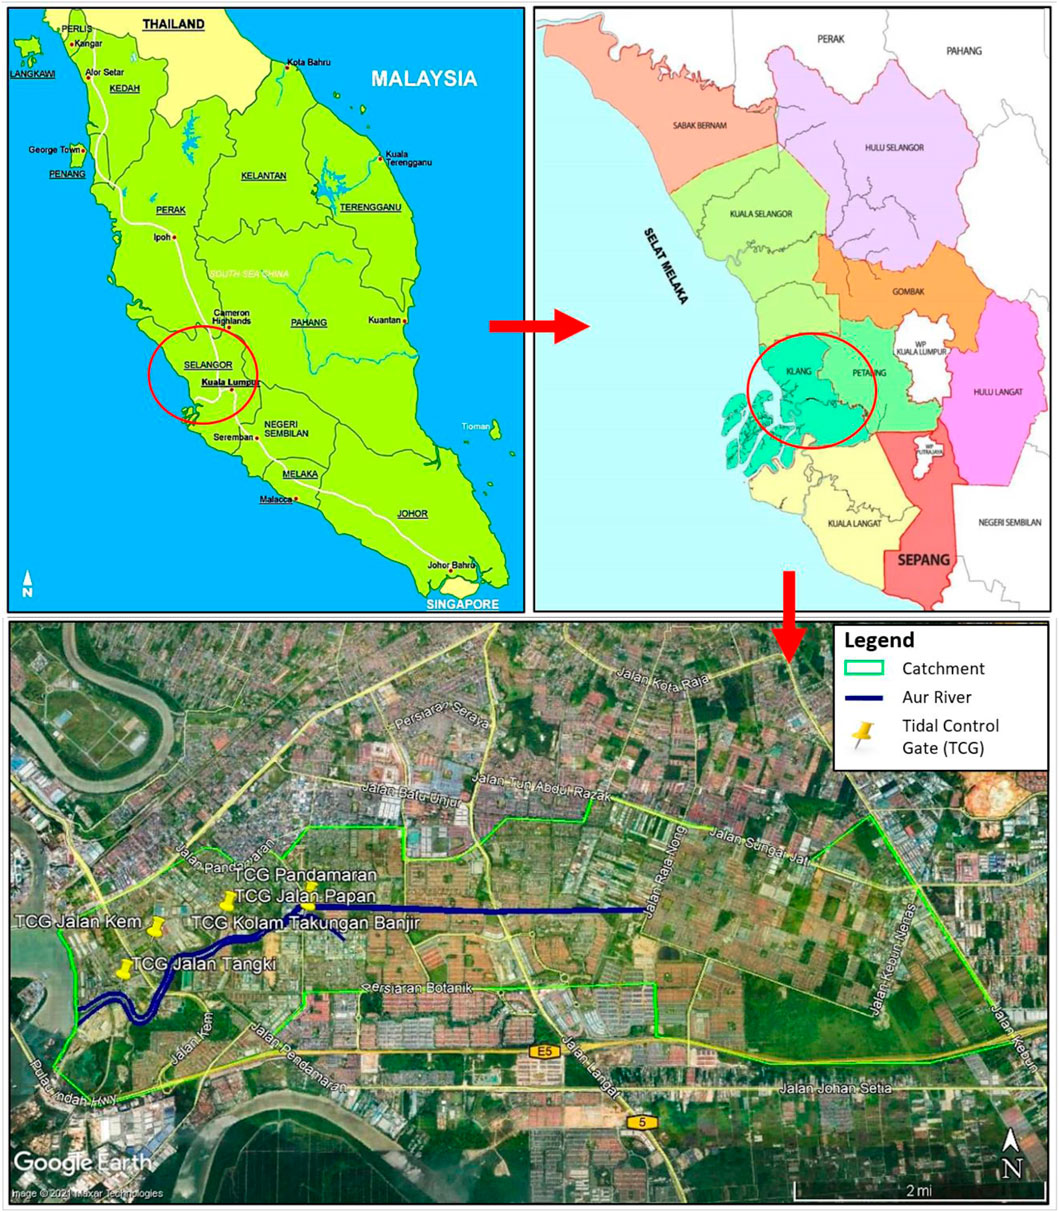
FIGURE 1. Map of the Aur River Basin, Klang District, Selangor, Malaysia. (Google Sites, 2022).
2.2 Data collection and analysis
2.1.1 Data collection
Primary data collection was carried out on site, including technical survey work and water level measurements. Water level measurements were taken only at the tidal control gate site using ultrasonic sensors and visual interfaces under the control of the Supervisory Control and Data Acquisition (SCADA) system (see Figure 2). The data collected from the SCADA system is the observed water level data at the tidal control gate based on specified intervals (daily and hourly). The purpose is to compare the observed data from SCADA with the simulated data from Sanitary, Storm and Flood Modelling Software (XPSWMM) analysis.
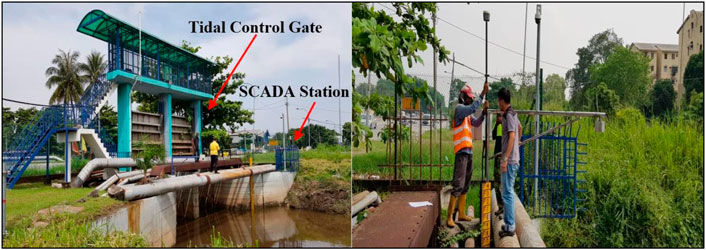
FIGURE 2. Tidal control gate and SCADA system on the Aur River. (Source: At site photos).
Secondary data collection refers to studies and data from various agencies such as rainfall data, Light Detection and Ranging (LIDAR), tidal data and land use development data for the years 2009, 2015 and 2020 (Majlis Perbandaran Klang, 2011). Data from LIDAR for Klang district provided by the Department of Survey and Mapping Malaysia was used to create digital elevation model (DEM) maps of the Aur River model as in-put to the river geometry model XPSWMM software (Amin, 2015). Hydrological and hydraulic data for the study area are used to calibrate and validate numerical hydrodynamic river models to increase the effectiveness and accuracy of predictions. The numerical hydrodynamic model of the river is used to represent the current situation and make predictions for different conditions. The use of numerical models is essential to solve the complexity of different variables (Lee, 2017).
2.1.2 Land use
The study area is developing rapidly due to increasing urbanisation in the Klang District. The land use development analysis is based on 2015 and 2020 data from the Selangor State Structure Plan 2020 and the Klang Municipal Council District Local Plan (Majlis Perbandaran Klang, 2011). This includes identifying the land use distribution in the categories of water bodies, built-up area, forest, industry, infrastructure and utilities, institutional and community facilities, residential areas, transport, commercial, agriculture, undeveloped areas, open spaces and recreational areas. Based on the land use data, the runoff coefficients were determined based on the Urban Stormwater Management Manual for Malaysia (MSMA) by the Department of Irrigation and Drainage Malaysia (2012). In addition, the analysis section also quantifies the changes from permeable to impermeable surfaces that determine surface runoff. The land use distribution for the Aur River catchment is shown in Table 1.
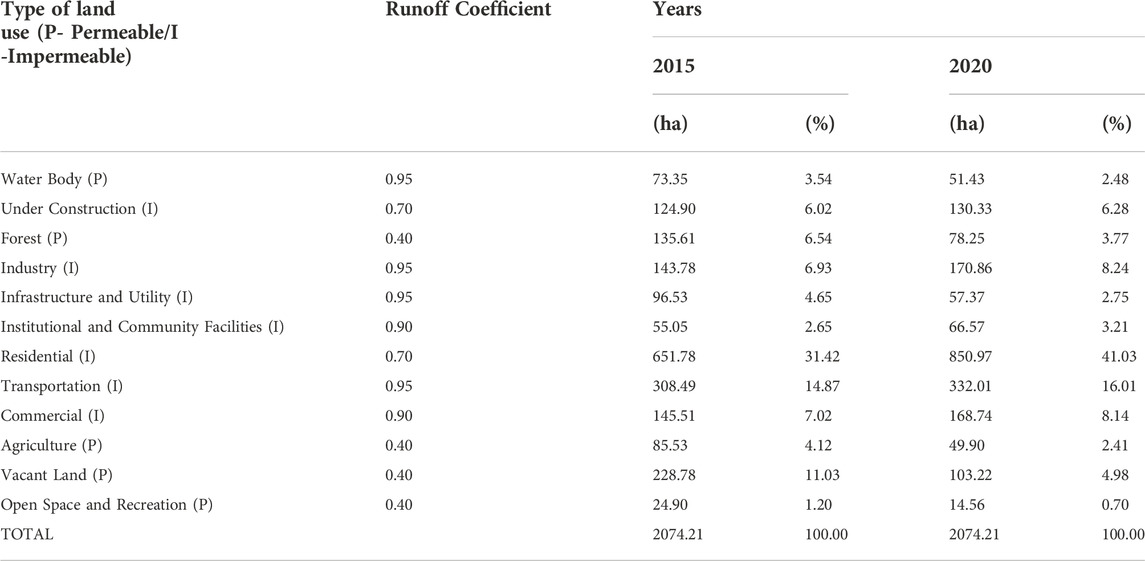
TABLE 1. Land use in the upstream area of Aur River (Runoff coefficient was taken from the Urban Stormwater Management Manual for Malaysia (MSMA).
2.1.3 Tidal data
The mouth of the Aur River is located near Port Klang Station where the semi-diurnal tides prevail. Table 2 shows the adjusted data from Admiralty Chart Datum to Land Survey Datum required for this study (Port Klang Authority, 2010).
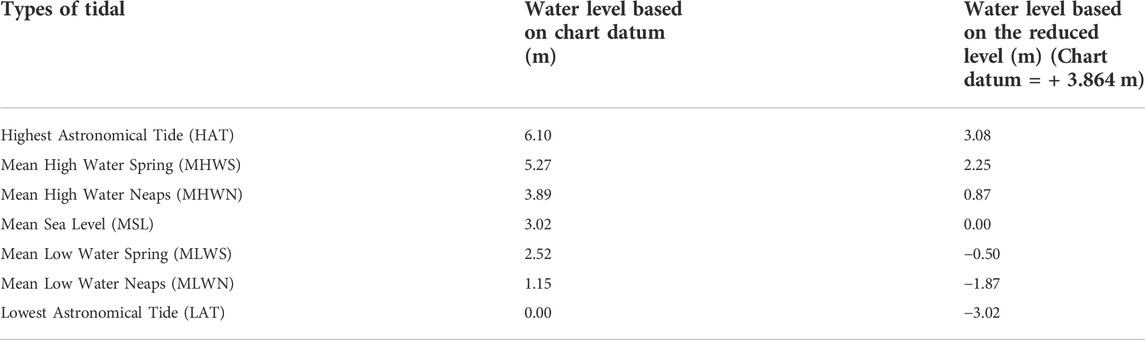
TABLE 2. Tidal levels at Port Klang station (Port Klang Authority, 2010).
2.1.4 Hydrodynamic modelling analysis
The development of hydrodynamic model for the Aur River using the 2D software XP-SWMM involves a network of 105 nodes, including 36 nodes representing sub-basin hydrological parameter inputs and 111 links representing hydraulic parameter inputs and river discharge, as shown in Figure 3. The upstream model boundary uses runoff inputs generated from design rainfall in 20-, 50- and 100-year return periods using the hydrographic unit method. The model boundary in the downstream section includes tidal control gates generated from tidal water level data.
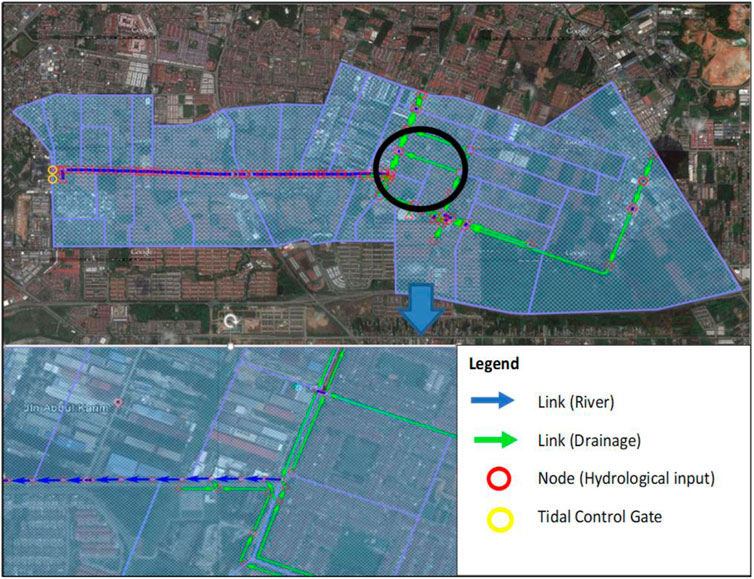
FIGURE 3. Model network of river flows and drainage systems Aur River basin and tidal control gate. (Source: XPSWMM Model Software).
The simulation approach of the model is based on the design rainfall for three scenarios on land use changes in 2015 and 2020. All scenarios refer to the simulation of the river network during heavy rainfall and high tide in the lower reaches of the river network with specific conditions for the tidal control gate (TCG). The scenarios are:
Scenario 1—No construction of a TCG. This scenario models the condition that there is no TCG, which means tidal water can flow in and out freely.
Scenario 2—The TCG is operated with an elevated sluice gate. This scenario models the condition that the TCG is present but fully open.
Scenario 3—The TCG is operated with a lowered sluice gate: This scenario models the condition that the TCG is present and fully closed.
2.1.5 Model calibration and validation
Model calibration needs to be carried out for rainfall and runoff data in the Aur River catchment. The calibration process was done by adjusting the model parameters, the Manning coefficient, and the infiltration coefficient. Once the calibration process was completed, model validation was carried out to retest the input of the adjusted model parameters and accurately simulate the performance level for the existing runoff of the study area. The comparison of data used for model validation includes rainfall observation data and gauge data in the Aur River catchment. The model evaluation method uses statistical analysis approaches such as coefficient of determination (R2), Nash-Sutcliffe coefficient of efficiency (CE), relative peak error (RPE), root mean square error (RMSE) and mean absolute error (MAE).
2.2.5.1 Nash-Sutcliffe efficiency coefficient (CE)
The Nash-Sutcliffe efficiency coefficient is a statistical analysis method for determining the efficiency between simulated and observed fields. The range of these coefficients is from a negative value of infinity to 1. A value of 0–1 means that the efficiency of the model simulation value is acceptable, and a model simulation value less than 0 means that the efficiency of the model simulation value is unacceptable. A CE value near to 1 means that the model can offer a more predictive skill (Ong, 2017). The following mathematical equation determines this efficiency coefficient:
where,
Xest = simulation level; Xobs = observation level; and Xavg.obs = average observation level.
2.2.5.2 Root mean square error (RMSE)
Statistical analysis is used to measure the accuracy of study data using the difference between model simulation values and observed values. The scale of data accuracy ranges from 0 to 1, with a model simulation value approaching 0 representing data accuracy (Ong, 2017). The following formula determines the RMSE:
where,
n = number of data of the observation period; Oi = observation value up to observation period i; and Pi = simulation value up to observation period i.
2.2.5.3 Mean absolute error (MAE)
Mean absolute error (MAE) is a method of statistical analysis used to measure the absolute error between two variables, namely the model’s simulation results and the observed values. MAE also means the average vertical distance or horizontal distance between each point and the identity line (Ong, 2017). The following mathematical equation determines MAE:
where,
xi = simulation value; yi = observation value; and n = number of data.
2.2.5.4 Relative peak error (RPE)
RPE is used in the study to measure the ability of the model to achieve the predicted flow level. An RPE value approaching 0 indicates a good value for the predicted level (Ong, 2017). The following mathematical equation determines RPE:
3 Results and discussion
3.1 Land use analysis
The land use analysis of the study area was carried out using data from the development blocks of the Klang Municipal Council District Local Plan 2020. Conversion of permeable land to impermeable land leads to a reduction in soil in-filtration rate and rainfall storage capacity on natural plants, as well as a reduction in in-filtration area (Zakaria et al., 2004). The land use distribution for the Aur River basin is shown in Table 1. The land use analysis shows that the percentage of pervious and impervious land in the Aur River watershed in 2015 is 31.08% and 68.92%, respectively and 14.34% and 85.66%, respectively, in 2020. The changes from permeable to impervious surfaces affect the infiltration rate into the soil and the rain storage capacity of natural plants, and reduce the infiltration area (Kustamar et al., 2019). These changes cause surface runoff to increase and flow faster into the existing drainage system of the Aur River, increasing the flow velocity and discharge rate of the river, which can lead to flooding (Zakaria et al., 2004; Brandimarte and Woldeyes, 2012).
3.2 Hydrology analysis
Rainfall data was collected from the DID telemetry station 3014092: Raja Lumu Secondary School, Port Klang, over a 12-year period from 2006 to 2017. Consistency tests using the double mass curve method were conducted to ensure the reliability of the data. The station recorded an average annual rainfall of about 2,177 mm per year. The accuracy of the station data is assessed using the double mass curve method which shows a correlation value of R2 of 0.9974, as shown in Figure 4 indicating that the data obtained is significant and consistent.
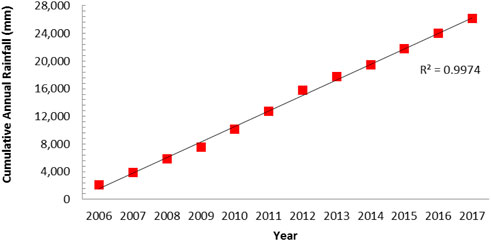
FIGURE 4. The double mass curve for rainfall station 3014092.
Rainfall intensity-duration-frequency (IDF) analyses were conducted to determine the design rainfall of the study area at a different average recurrence interval (ARI), as shown in Figure 5. The results of the frequency analysis were used as input to the hydrological modelling to determine the design rainfall for the 20- and 100-year ARIs in this study.
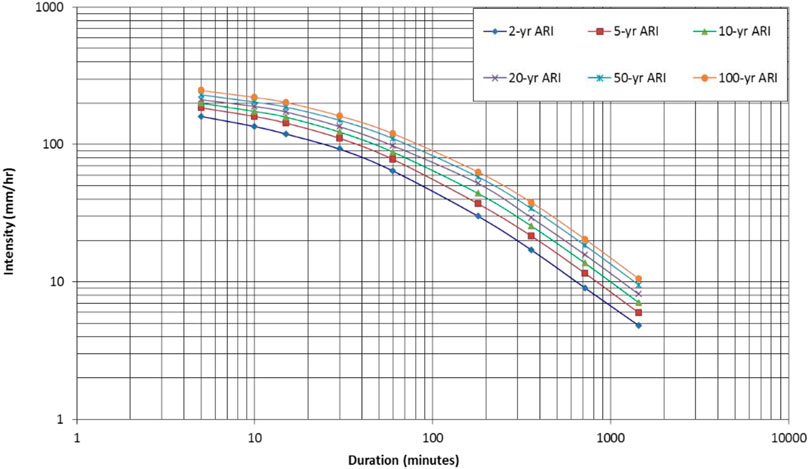
FIGURE 5. Rainfall intensity-duration-frequency (IDF) curves for rainfall station 3014092.
3.3 Hydraulic analysis
3.1.1 Calibration and validation
The calibration process of the hydrodynamic model of the Aur River was carried out by comparing the river level from the hydrodynamic model simulation with the river level observed by the SCADA station at the tidal control gate, as shown in Figure 6. Model calibration was performed using 25 rainfall and flood events that occurred from 2016 to 2017. These datasets were selected based on the operation of the SCADA station from mid-2016 and rainfall in the upper reaches of the Aur River. The results of CE, R2, RMSE, MAE, and RPE for the simulation and observed data are shown in Table 3. Model validation was conducted to retest the input of the adjusted model parameters and accurately simulate the level of performance for the existing runoff of the study area, as shown in Figure 7.
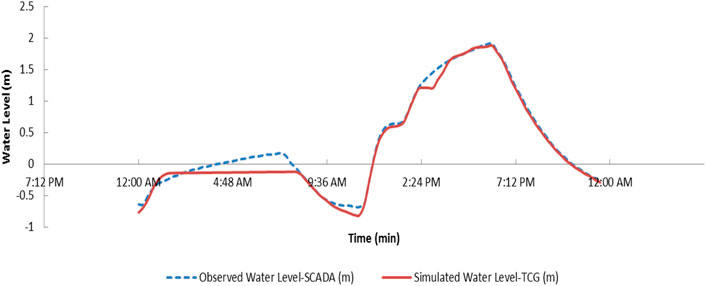
FIGURE 6. Calibration of the hydrodynamic river models. (Source: XPSWMM Model Software).
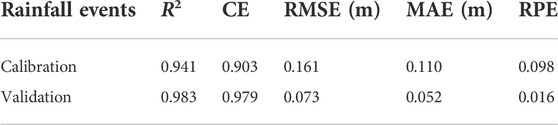
TABLE 3. Statistical analysis of the calibration of the average hydrodynamic flow model.
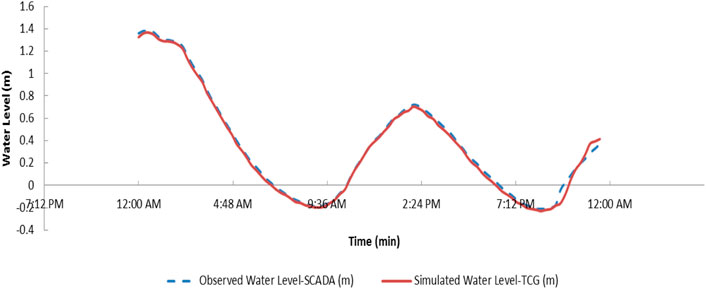
FIGURE 7. Validation of the hydrodynamic river models. (Source: XPSWMM Model Software).
3.1.2 Simulation of the Aur River hydrodynamic model
The hydrological and hydraulic analysis for the Aur River was carried out using the hydrodynamic modelling software XPSWMM. Model simulations of Scenarios 1 to 3 for the year 2015 and 2020 were carried out, including the presence and absence of tidal control gates and the influence of high tides.
3.1.2.1 Flood hydrograph
Model simulations of the hydrodynamic model for Scenarios 1 to 3 based on land uses of 2015 and 2020 were carried out and yield the maximum flow and water level of the river at the tidal control gate for 20- and 100-year ARIs, as shown in Table 4.
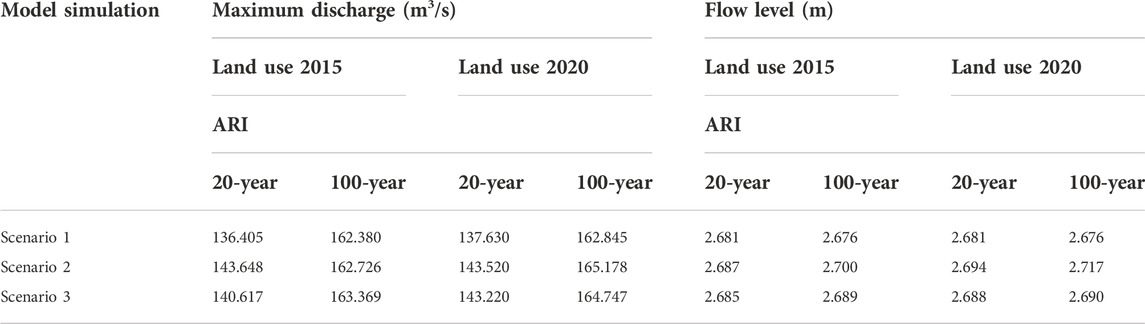
TABLE 4. Maximum discharge and flow level of the Aur River at the TCG.
The simulation results of the hydrodynamic model show that heavy rainfall affects the maximum total runoff and the highest river flow level for Scenario 1 without TCG as compared to Scenarios 2 and 3 with TCG, but with different operation. This trend is consistent for both land use changes in 2015 and 2020. Based on the results of the hydrodynamic model analysis for the year 2020 during high tide, the maximum downstream discharge for Scenarios 2 and 3 increases by 4.28% and 4.06%, respectively, as compared to Scenario 1 for the 20-year ARI. For the 100-year ARI, the maximum downstream discharge increases by 1.43% and 1.17% for Scenarios 2 and 3, respectively. A fully open TCG, as in Scenario 2, influences the inflow of high tide into the upper reaches of the Aur River and increases the maximum discharge by 0.21% (20-year ARI) and 0.26% (100-year ARI) as compared to Scenario 3. This increase in maximum discharge shows the influence of high tide on the upstream. The TCG, which is not closed during high tide, has led to flood in-flow and backflow into the upper reaches of the river.
The flow level in the downstream of the river for the same year increased by 0.48% and 0.26% for Scenarios 2 and 3, respectively, as compared to Scenario 1 for the 20-year ARI. While for the 100-year ARI, the flow level for Scenarios 2 and 3 increased by 1.53% and 0.52%, respectively. A fully open TCG as in Scenario 2 affects the inflow of high tide into the upstream of the Aur River and increases the flow level by 0.22% (20-year ARI) and 1% (100-year ARI) as compared to Scenario 3. This rise in the water level shows that the influence of high tide on the upstream of the river. The TCG, which is not closed during high tide, causes the tidal water to keep flowing back into the upstream areas. These results confirmed that the river level profile would be higher due to the increased discharge and the reversal of tidal water into the upstream area of the river as specified by (Costabile et al., 2015).
In the absence of TCG construction, the modelling simulation of Scenario 1 demonstrates that land use change in 5 years has no effect on river flow levels. However, in Scenarios 2 and 3, the land use change demonstrates an increase in river flow level with the presence of TCG. This ascertains the influence of the TCG to the river’s flow behaviour. Thus, when planning for internal drainage system of land use development must take into consideration of the TCG effect.
3.1.2.2 Flood plain analysis
The simulation of the inundation analysis was carried out through a series of hydrodynamic modelling combinations for the Aur River using XPSWMM. The inundation analysis through 2D hydrodynamic model simulations during the 20-year and 100-year ARIs showed that the built-up areas upstream of the Aur River are inundated. The simulation results show the total inundated area in Table 5 for the year 2015 and 2020 land uses, respectively. Based on the results of the hydrodynamic model analysis, the inundated area for both years was largest in Scenario 1 because there was no TCG structure controlling the inflow of tidal water upstream of the Aur River. However, due to the larger permeable area in 2015, the total inundated area is smaller than in 2020. The construction of the TCG contributed to the reduction in the inundated area as seen in Scenario 3 with a reduction of 2.3% for the 20-year ARI and 8.4% for the 100-year ARI as compared to Scenario 1 in 2020. In Scenario 3, a functioning TCG means that there is no tidal influence on the upstream area. If the TCG is closed during high tide, it can prevent tidal water from the sea from reaching upstream. However, this leads to a backwater effect in the upstream area during high tide.
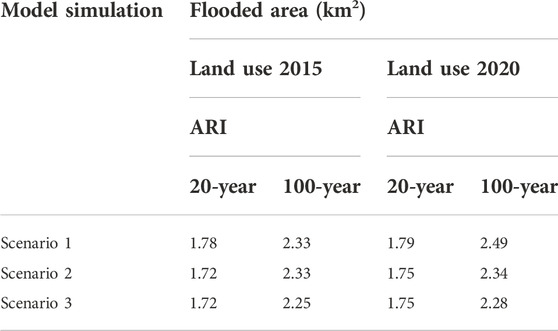
TABLE 5. Floodplains areas around Aur River for all scenarios.
When compared to Scenario 3, a fully opened TCG leads to an increase in tidal inflow into the upper stream of the Aur River, which is exposed to a higher ARI. In 2015, the floodplain increases by 3.6% for a 100-year ARI and by 2.6% in 2020. However, for the 20-year ARI, the floodplain remains constant in both years. This increase in floodplain area shows the influence of upstream flooding. Tidal control gates that are not closed during a flood always lead to inflows and backflows of tidal and flood water. The simulation results of the hydrodynamic model of the Aur River produce a flood hazard map for the 20- and 100-year ARIs for Scenario 3, as shown in Figure 8.
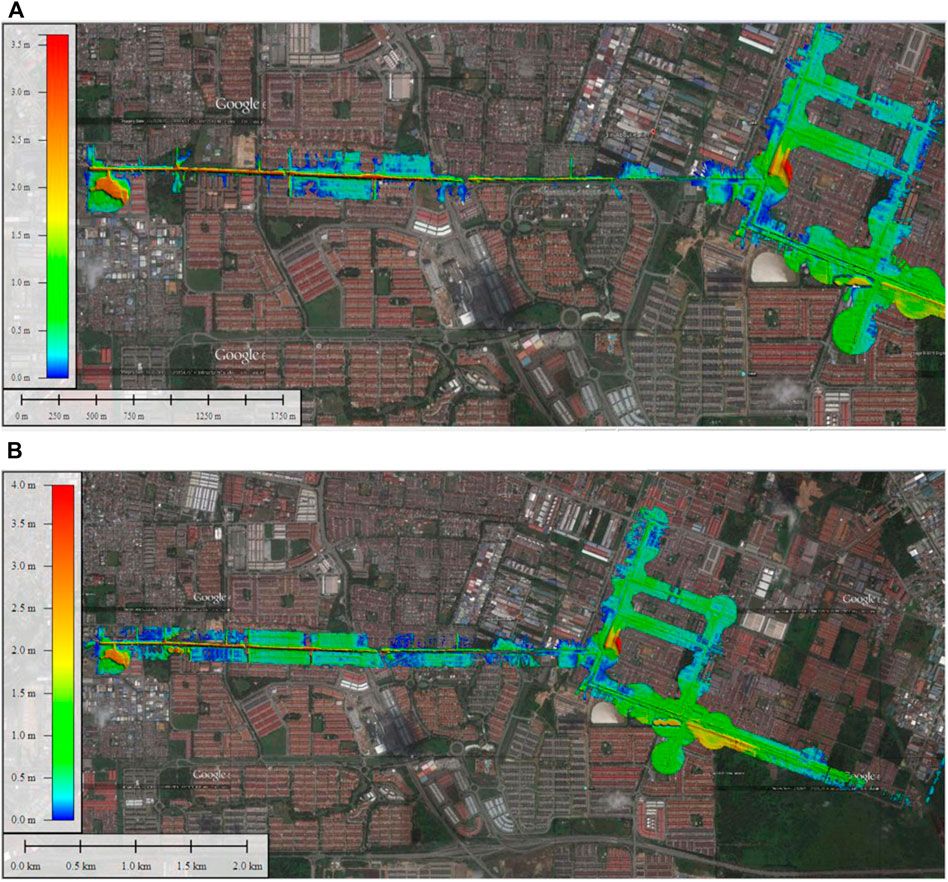
FIGURE 8. Flood hazard map for Aur River area for (A) 20-year (B) 100-year ARIs based on Scenario 3. (Source: XPSWMM Model Software).
The result of the simulation also shows that there is significant impact on the build of the TCG throughout the 5-year span in land use changes. There is a substantial increment of up to 7% for 100-ARI of the total flooded area when there is no TCG structure in the river network. However, no increment in different operations of the TCG structure to the flooded area throughout the 5-year span as modelled in Scenarios 2 and 3. This shows how effective TCG is in flood mitigation in reducing the damages that comes with it.
The results show that flooding in the Aur River development area is influenced by heavy rainfall (20- and 100-year ARIs), land use changes (permeable and impermeable land), hydraulic inadequacies of the river and existing flows and tides. Previous studies have also shown that the Aur River catchment starts to flood at two ARI due to the same factors such as rainfall, land use changes, inadequacies in the existing river and drainage (Hasan et al., 2019).
4 Conclusion
The hydrodynamic river model successfully analysed the flow velocity, river profile, area and depth of flooding occurring upstream of the Aur River during the tides. The results showed the influence of heavy rainfall whereby the maximum downstream discharge increment varied from 4.06% to 4.28% during high tide. Whereas the flow level for the 100-year ARI shows an increment from 0.52% to 1.53%. If the TCG is not operated properly it will cause the tidal water to flow back into the upstream areas thus exposing to an increase floodplain area ranging from 2.3% to 8.4%. The current flow profile of the Aur and the drainage system network cannot cope with the increase in runoff volume during heavy rainfall and it worsens if there is no tidal control gate at the mouth of the river network, as shown in Scenario 1 as compared to Scenarios 2 and 3.
Control structures such as tidal control gates are important and are part of flood management to reduce the risk of flooding. It shows a substantial reduction of up to 7% of the total flooded area when built. However, if they are not well maintained and operated, the flooding situation will worsen, especially under the influence of high tide and backwater, as shown in Scenario 2. An efficient operating system that allows effective control of the tide gates can reduce the impact of flooding up to 3.6% of the flooded area, especially during high tide, and minimise the impact of backwater that causes flooding in the upstream area of the Aur River, as shown in Scenario 3.
This highlights the importance of the tidal control gates as an option for flood protection. The presence of this flood control structure reduces destructive impacts and drastically minimises the floodplain, even if it is not operated efficiently as compared to its absence. It serves as a basis for why a tidal control gate is necessary in river networks to minimise the impact of flooding. Even when a good drainage network is in place, the impact of flooding is significantly reduced by a tidal control gate, especially in the case of backwater, and in coastal areas. Further studies should also be done on the reduction of damage value involved with the construction of TCG and its value in saving lives and property. Studies can also be done to other places that have different tidal variations to see the seriousness of the tidal effects. In summary, a fully functional tidal control gate significantly reduces the floodplain, thereby reducing damage and loss of life and property in the catchment area.
Data availability statement
The raw data supporting the conclusions of this article will be made available by the authors, without undue reservation.
Author contributions
All authors listed have made a substantial, direct, and intellectual contribution to the work and approved it for publication.
Acknowledgments
The authors would like to express gratitude to the editor for granting the opportunity to publish this journal and to all the reviewers for their time and effort in reviewing and improving the quality of this manuscript. The authors would also like to thank the Public Service Department of Malaysia for providing a scholarship to the first author to conduct this study and to the Universiti Kebangsaan Malaysia for financially supporting this study.
Conflict of interest
The authors declare that the research was conducted in the absence of any commercial or financial relationships that could be construed as a potential conflict of interest.
Publisher’s note
All claims expressed in this article are solely those of the authors and do not necessarily represent those of their affiliated organizations, or those of the publisher, the editors and the reviewers. Any product that may be evaluated in this article, or claim that may be made by its manufacturer, is not guaranteed or endorsed by the publisher.
References
Abbas, H., Hussain, A., Radojevic, B., Breil, P., and Shafique, S. (2014). “Lessons from floods of 2010 in Pakistan to help develop sustainable holistic management for the Indus River basin,” in 6th International Conference on Flood Management (ICFM). Sao Paulo, Brazil.: China Institute of Water Resources and Hydropower Research.
Ahmad, S., and Simonovic, S. P. (2000). System dynamics modeling of reservoir operations for flood management. J. Comput. Civ. Eng. 14, 190–198. doi:10.1061/(asce)0887-3801(2000)14:3(190)
Alhadjri, A. (2021). Banjir Taman Sri Muda lambat surut sebab pintu air rosak - Exco. Petaling Jaya, Malaysia: Malaysia Kini. Available at: https://www.malaysiakini.com/news/604026 (Accessed April 30, 2022).
Amin, M. B. (2015). Pemanfaatan teknologi Lidar dalam analisis genangan banjir akibat luapan sungai berdasarkan simulasi model hidrodinamik. Infoteknik 16, 21
Ariff, I., and Ramachandran, J. (2022). Bagaimana taman Sri Muda ‘tenggelam. Free Malaysia Today. Available at: https://www.freemalaysiatoday.com/category/bahasa/tempatan/2022/01/01/bagaimana-taman-sri-muda-tenggelam/ (Accessed April 30, 2022).
Brandimarte, L., and Woldeyes, M. K. (2012). Uncertainty in the estimation of backwater effects at bridge crossings. Hydrol. Process. 27, 1292–1300. doi:10.1002/hyp.9350
Chan, N. W. (2002). Pembangunan, pembandaran dan peningkatan bahaya dan bencana air di Malaysia: Isu, pengurusan dan cabaran. Penerbit USM.
Charland, J. (1997). Reconnaissance survey of tide gates in tillamook bay vicinity. Oregon, United States: Tillamook Bay National Estuary Project.
Chuang, M. T., Chen, T. L., and Lin, Z. H. (2020). A review of resilient practice based upon flood vulnerability in New Taipei City, Taiwan. Int. J. Disaster Risk Reduct. 46, 101494. doi:10.1016/j.ijdrr.2020.101494
Costabile, P., Macchione, F., Natale, L., and Petaccia, G. (2015). Comparison of scenarios with and without bridges and analysis of backwater effect in 1-D and 2-D river flood modeling. Comput. Model. Eng. Sci. 109, 81. doi:10.3970/cmes.2015.109.081
Department of Irrigation and Drainage Malaysia (2020). Kompedium data dan maklumat asas Jabatan Pengairan dan Saliran Malaysia (JPS). Kuala Lumpur, Malaysia: Department of Irrigation and Drainage Malaysia.
Department of Irrigation and Drainage Malaysia (2012). Urban stormwater management manual for Malaysia (MSMA). 2nd ed. Available at: https://www.water.gov.my/jps/resources/PDF/MSMA2ndEdition_august_2012.pdf (Accessed July 22, 2021).
Gao, Y. qin, Liu, Y. ping, Lu, X. hua, Luo, H., and Liu, Y. (2020). Change of stream network connectivity and its impact on flood control. Water Sci. Eng. 13, 253–264. doi:10.1016/j.wse.2020.12.004
Gasim, M. B., Surif, S., Mokhtar, M., Toriman, M. E. H., Rahim, S. A., and Bee, C. H. (2010). Analisis banjir Disember 2006: Tumpuan di kawasan bandar Segamat, Johor. Sains Malays 39, 353.
Google Sites (2022). Map for places in semenanjung Malaysia. Available at: https://sites.google.com/site/attractionplacesinmalaysia/map-for-places?tmpl=%2Fsystem%2Fapp%2Ftemplates%2Fprint%2F&showPrintDialog=1 (Accessed July 30, 2022).
Hamzah, F. M., Tajudin, H., Kamarudin, M. K. A., and Arbin, N. (2020). Tidal flooding frequency analysis using partial duration series approach. Int. J. Adv. Trends Comput. Sci. Eng. 9, 21–27. doi:10.30534/ijatcse/2020/0591.22020
Haque, C. E. (2000). “Risk assessment, emergency preparedness and response to hazards: The case of the 1997 Red River Valley flood, Canada,” in Natural hazards (Springer), 225.
Hasan, H. H., Razali, S. F. M., Zaki, A. Z. I. A., and Hamzah, F. M. (2019). Integrated hydrological-hydraulic model for flood simulation in tropical urban catchment. Sustain. Switz. 11, 6700–6724. doi:10.3390/su11236700
Hassan, A. J. (2005). Permodelan hidrodinamik sungai. Seri Kembangan, Malaysia: Institut Penyelidikan Hidraulik Kebangsaan Malaysia.
Hofmann, S. Z. (2021). 100 Resilient Cities program and the role of the Sendai framework and disaster risk reduction for resilient cities. Prog. Disaster Sci. 11, 100189. doi:10.1016/j.pdisas.2021.100189
Hua, A. K. (2016). Persepsi masyarakat terhadap bencana banjir monsun di Malaysia: Kajian kes Kota Bharu, Kelantan. Malays. J. Soc. Space 9. doi:10.6084/m9.figshare.3803544.v1
Huong, H. T. L., and Pathirana, A. (2013). Urbanization and climate change impacts on future urban flooding in Can Tho city, Vietnam. Hydrol. Earth Syst. Sci. 17, 379–394. doi:10.5194/hess-17-379-2013
Konrad, C. P. (2003). Effects of urban development on floods. Tacoma, United States: U.S. Geological Survey. USGS Fact Sheet FS-076-03.
Kustamar, K., Susanawati, L. D., Nainggolan, T. H., Witjaksono, A., and Ajiza, M. (2019). “Performance analysis of long storage and tidal controlling gate on the flood of Kemuning River,” in Journal of physics (Malang, Indonesia: Conference Series).
Kwak, D., Kim, H., and Han, M. (2016). Runoff control potential for design types of low impact development in small developing area using XPSWMM. Procedia Eng. 154, 1324–1332. doi:10.1016/j.proeng.2016.07.483
Lee, H. L. (2017). Kajian permodelan pergerakan longitudinal air masin bagi Muara Sungai Terengganu. Bangi, Malaysia: Universiti Kebangsaan Malaysia. PhD Thesis.
Lee, W.-K., and Mohamad, I. N. (2016). “An idealized model of meandering tidal river,” in Regional Conference on Science, Technology and Social Sciences (Cameron Highlands, Pahang, Malaysia: RCSTSS), 113
Leow, C. S., Abdullah, R., Zakaria, N. A., Ghani, A. A., and Chang, C. K. (2009). “Modelling urban River catchment: A case study in Malaysia,” in Proceedings of the Institution of Civil Engineers-Water Management. London, United Kingdom, 25.
Li, Y., Zhang, Q., Werner, A. D., Yao, J., and Ye, X. (2017). The influence of river-to-lake backflow on the hydrodynamics of a large floodplain lake system (Poyang Lake, China). Hydrol. Process. 31, 117–132. doi:10.1002/hyp.10979
Liu, X., Yang, S., Ye, T., An, R., and Chen, C. (2021). A new approach to estimating flood-affected populations by combining mobility patterns with multi-source data: A case study of wuhan, China. Int. J. Disaster Risk Reduct. 55, 102106. doi:10.1016/j.ijdrr.2021.102106
Majlis Perbandaran Klang (2011). Draf rancangan tempatan majlis perbandaran Klang (pengubahan 1) 2020. Klang, Malaysia: Jabatan Perancangan Bandar dan Desa Semenanjung Malaysia.
Mohamad, M. F., Samion, M. K. H., and Hamzah, S. B. (2014). “Physical modelling for flood evaluation of Selangor River under tidal influence,” in International Conference Data Mining, Civil and Mechanical Engineering (Bali, Indonesia: ICDMCME 2014), 102–106.
Mohd, F. A., Abdul Maulud, K. N., Karim, O. A., Ibrahim, M. A., Benson, Y. A., and Wahab, A. K. Abd. (2018). Integration of geospatial method and hydrodynamic modelling to study the impact of sea level rise on the coastal area. J. Kejuruter. 30, 65–75. doi:10.17576/jkukm-2018-30(1)-09
Muhammad Arshad, S. H., Ishak, A. M., Muhamad, N., and Pereira, J. J. (2020). Penilaian keberkesanan terowong SMART Kuala Lumpur dalam menghalang banjir kilat. Malays. J. Soc. Space 16, 184–200. doi:10.17576/geo-2020-1603-14
Muroi, H., Mine, K., and Eguchi, Y. (2021). Scenario analysis of sluice gate operations for evaluating inland flood damage. Kawasaki, Japan: Fuji Technology Press.
Ong, H. L. (2017). Hydrological impacts of land use change on streamflow quantity in a sub-catchment of Klang basin.
Phillips, B. C., Yu, S., Thompson, G. R., and de Silva, N. (2005). 1D and 2D modelling of urban drainage systems using XP-SWMM and TUFLOW. Copenhagen, Denmark: 10th International Conference on Urban Drainage, 21.
Port Klang Authority (2010). Port Klang Malaysia marine information handbook 1. Port Klang, Malaysia: Port Klang Authority.
Pour, S. H., Wahab, A. K. A., Shahid, S., Asaduzzaman, M., and Dewan, A. (2020). Low impact development techniques to mitigate the impacts of climate-change-induced urban floods: Current trends, issues and challenges. Sustain. Cities Soc. 62, 102373. doi:10.1016/J.SCS.2020.102373
Rokiah, T. P., Hussain, S., Ismail, B., and Ismail, H. (2014). “Kesediaan kognitif menghadapi banjir bagi meminimumkan kemusnahan dan kehilangan nyawa,” in Persidangan kebangsaan ekonomi Malaysia ke-9. Kuala Terengganu, Terengganu, Malaysia: Universiti Utara Malaysia. (PERKEM ke-9).
Samsuri, N., Abu Bakar, R., and Unjah, T. (2018). Flash flood impact in Kuala Lumpur – approach review and way forward. Int. J. Malay World Civilisation 6, 69–76. doi:10.17576/jatma-2018-06SI1-10
Shahid, S., Wang, X. J., Harun, S. Bin, Ismail, T., and Minhans, A. (2016). Climate variability and changes in the major cities of Bangladesh: Observations, possible impacts and adaptation. Reg. Environ. Change 16, 459–471. doi:10.1007/s10113-015-0757-6
Shen, Y., Morsy, M. M., Huxley, C., Tahvildari, N., and Goodall, J. L. (2019). Flood risk assessment and increased resilience for coastal urban watersheds under the combined impact of storm tide and heavy rainfall. J. Hydrology 579, 124159. doi:10.1016/j.jhydrol.2019.124159
Syed Hussin, T. P. R., and Ismail, H. (2016). Perubahan gunatanah dan kejadian banjir di lembangan saliran Kelantan. Malays. J. Soc. Space 12, 118
Toriman, M. E., Kamarudin, M. K. A., Abd Aziz, N. A., Gasim, M. B., Idris, M. H., and Jamil, N. R. (2009). Pemodelan hidrologi-hidraulik aliran air songsang dan analisis saiz partikel sedimen Sungai Chini, Pahang. J. e-BANGI 4, 14.
Walsh, S., and Miskewitz, R. (2013). Impact of sea level rise on tide gate function. J. Environ. Sci. Health, Part A 48, 453–463. doi:10.1080/10934529.2013.729924
Wang, X., Zhang, J., Shahid, S., Guan, E., Wu, Y., Gao, J., et al. (2016). Adaptation to climate change impacts on water demand. Mitig. Adapt. Strateg. Glob. Chang. 21, 81–99. doi:10.1007/s11027-014-9571-6
Wu, G., Pan, L., Wei, Q., and Guo, L. (2015). Decreased mobility of heavy metals in Haihe River sediments: The possible role of tide gate. J. Geochem. Explor. 157, 92–99. doi:10.1016/j.gexplo.2015.06.002
Zakaria, N. A., Ghani, A. A., Abdullah, R., Sidek, L. M., Kassim, A. H., and Ainan, A. (2004). “MSMA - a new urban stormwater management manual for Malaysia,” in International Conference on HydroEngineering. Brisbane, Australia: University of Mississippi.
Zhang, H., Liu, S., Ye, J., and Yeh, P. J.-F. (2017). Model simulations of potential contribution of the proposed Huangpu Gate to flood control in the Lake Taihu basin of China. Hydrol. Earth Syst. Sci. 21, 5339–5355. doi:10.5194/hess-21-5339-2017
Nomenclature
Abbreviations
DID Department of Irrigation and Drainage
SCADA Supervisory Control and Data Acquisition
XPSWMM Sanitary, Storm and Flood Modelling Software
LIDAR Light Detection and Ranging
DEM Digital elevation model
TCG Tidal control gate
MAE Mean absolute error
RPE Relative Peak Error
R2 Coefficient of determination
CE Nash-Sutcliffe coefficient of efficiency
RMSE Root mean square error
IDF Rainfall intensity-duration-frequency
ARI Average recurrence interval
Keywords: flood prediction, flood-prone area, backwater, tidal phenomena, tidal control gate, stormwater management
Citation: Yasmin MN, Mohd Razali SF, Sharil S, Wan Mohtar WHM and Saadon KA (2022) Effectiveness of tidal control gates in flood-prone areas during high tide appearances. Front. Environ. Sci. 10:919704. doi: 10.3389/fenvs.2022.919704
Received: 13 April 2022; Accepted: 11 November 2022;
Published: 24 November 2022.
Edited by:
Martin Siegert, University of Exeter, United KingdomReviewed by:
S Suresh, Sona College of Technology, IndiaMir Jafar Sadegh Safari, Yaşar University, Turkey
Claudio Fabian Szlafsztein, Federal University of Pará, Brazil
Pennan Chinnasamy, Indian Institute of Technology Bombay, India
Copyright © 2022 Yasmin, Mohd Razali, Sharil, Wan Mohtar and Saadon. This is an open-access article distributed under the terms of the Creative Commons Attribution License (CC BY). The use, distribution or reproduction in other forums is permitted, provided the original author(s) and the copyright owner(s) are credited and that the original publication in this journal is cited, in accordance with accepted academic practice. No use, distribution or reproduction is permitted which does not comply with these terms.
*Correspondence: Siti Fatin Mohd Razali, fatinrazali@ukm.edu.my