 Li Shen
 Yiyu Wen
- State Grid Southwest Branch Corporation, State Grid Corporation of China, Chengdu, China
Improving energy efficiency is crucial for China’s power industry to meet global energy conservation and emission reduction goals. The rapid development of photovoltaic (PV) and hydropower has greatly assisted in the construction of China’s novel power system. The stochastic characteristics of PV power generation pose significant challenges to the reliable and economical scheduling of power systems. In fact, the cascade hydropower station can effectively address the issue. To fully utilize the advantages of hydropower, this paper proposes a bi-layer scheduling optimization model for the cascade hydro-PV complementary system considering power market. The upper-layer model simultaneously maximizes the benefit and minimizes the output volatility of the complementary system. The lower-layer model carries out market clearing with the objective of social cost. Besides, PV uncertainty and market price volatility are considered in the decision-making process for power market transactions. To solve the bi-layer model, a novel meta-heuristic algorithm (geometric mean optimizer) is applied, demonstrating excellent performance compared to similar methods. For the complementary system, the results show that its total power output can be improved, and its output volatility can be effectively alleviated.
1 Introduction
In recent years, due to climate change and the goal of building novel power systems, the development of renewable energy represented by photovoltaics has been excessive (Ming et al., 2018; Yin et al., 2019). However, the strong uncertainty in solar resources and large-scale access will increase the power fluctuation of the grid, thus threatening the safe and stable operation of the grid (Zhu et al., 2018). By utilizing the flexibility of hydropower and natural resource complementarity, renewable energy consumption can be effectively promoted. (Xu et al., 2019; Chen et al.,2016; Huang et al., 2021). Hydropower-PV complementary system is a vital operation mode to promote grid-connected PV consumption. The key to smoothing the variability of PV is to utilize the regulation ability of hydropower stations, allowing PV to support the power grid effectively.
Research on optimizing multi-energy complementarity of renewable sources like hydropower and PV is focused on planning, design, and operation scheduling. (Li and Qiu, 2016; Zhang et al., 2019; Yang et al., 2021). Ming et al. (2019) established the connection between short-term and long-term scheduling models based on the PV loss function. They proposed a self-adaptive operation rule for the hydro-PV complementary system. An et al. (2015) established a computational model of hydropower/PV complementary operation based on the Longyangxia project, showing that hydropower can improve the power quality of PV in short-term dispatch, and hydropower shortage can make up for PV in medium- and long-term dispatch. Kougias et al. (2016) quantitatively analyzed the water-PV complementary performance, and their research results are of great significance to the joint scheduling of multiple power stations. Wang et al. (2019a) and Wang et al. (2018) discussed the principle of complementary operation of multi-energy power generation systems and the coordinated operation modes and strategies to maximize the new energy consumption and promote carbon emission reduction. Tan et al. (2021) considered the hydraulic coupling between the upstream and downstream of the stepped hydropower plant, optimized the stepped hydropower power generation plan to maximize the total day-ahead power generation, and constructed an intraday hydropower regulation method considering the risk of the hydropower plant due to the stepped hydropower providing regulation for PV. Lu et al. (2021) used kernel density estimation to simulate the probability distribution of PV output by generating a large number of PV output scenarios and a representative uncertainty set of PV through K-means clustering. It is helpful to study the stochastic optimal scheduling method of hydro-wind-solar complementation to maximize the revenue of the co-generation system. Liu et al. (2020) constructed a chance constraint model based on PV probability distribution for hydro-wind-solar complementary operation. None of the above literature considers the decision-making behavior of the hydro-PV complementary system in the power market transaction, which is not conducive to the long-term economic and stable development of hydropower plants.
The types of objective functions in the optimization model of water-PV complementary systems mainly include maximizing power generation output and benefit, minimizing output fluctuation, and improving energy efficiency. The generation output type models include maximizing the generation capacity of the complementary system and PV output (Wang et al., 2018; Wang et al., 2019b). On the other hand, (Ming et al., 2019), proposed an energy-efficient model by maximizing hydropower storage or minimizing the abandoned power. (Zhang et al., 2017; Lu et al., 2021). presented an efficiency-optimal model to maximize the power generation revenue and reduce the system operation cost. Based on the above research, this paper combines these four types to establish a decision optimization model for the cascade hydro-PV complementary system in the power market. The model is a bi-layer model. In the upper layer, a multi-objective function model is proposed to maximize the return and minimize the volatility of the complementary system. In the lower layer, the power market clearing model is presented. The bi-layer model fully considers the reservoir capacity constraints, water flow constraints, and power constraints of the cascade hydropower, PV, and other units. The mixed-integer linear programming is usually used to solve this type problem (Yuan et al., 2021). To solve the problem, the bi-layer model should be converted into a single-layer model and the nonlinear terms of the lower-layer model should be linearized. This significantly increases the algorithm’s complexity. This work utilizes a combination of linear programming and intelligent optimization algorithms to solve this bi-layer model. The upper-level model is solved by using a linear programming approach and the lower level is solved by an intelligent optimization algorithm. During the solving process, the upper layer model needs to pass the market decision of the solved complementary system to the lower-layer model. The lower-layer model solves on the basis of the upper layer model and passes the solved market clearing result back to the upper layer. Convergence is achieved by iterating through this cycle to produce the final result. The lower layer model is solved by the geometric mean optimizer (GMO) (Rezaei et al., 2023), which does not require pre-set parameter values and has a strong ability to detach from the local solution during the solving process. The algorithm is used to solve the lower layer model. The rationality of the model and the feasibility of GMOs are verified by a case study. The main contributions of this paper are as follows.
(1) A multi-objective model is proposed for a hydro-PV cascade system. The model takes into account market demand and price fluctuations to optimize scheduling decisions for maximum economic efficiency and minimum volatility.
(2) GMO and linear programming methods are used to solve a bi-layer optimization model with considering nonlinear elements.
(3) Based on the cascade hydropower-PV complementary system model, the benefits of hydropower plants in the Southwest China region are evaluated.
The rest of this paper is organized as follows: Section 2 introduces the output model for each unit participating in the market transaction. Section 3 introduces the bi-layer model and the constraints; Section 4 introduces the solution methodology and the solution steps.; Section 5 illustrates the case study and discusses the results; Section 6 concludes this paper and suggests future work.
2 Power generation models of the units
2.1 PV power generation model
PV output has a strong uncertainty, positively correlated with the light intensity and the surrounding temperature in different scenarios. The PV power output is:
where
The power output constraint of PV is as follows
where
2.2 Cascade hydropower power generation model
The cascade hydropower plant needs to consider the power generation flow relationship between the upper and lower levels of the plant, the time lag relationship of the water flow, the natural water inflow, and the constraints of the reservoir level. The water resources available for hydropower plants in the entire cascade basin are limited, so the scheduling of hydropower plants is interrelated at various times. The scheduling plan of the higher-level hydropower plant affects the available water resources of its lower-level hydropower plant and affects the whole scheduling plan. The output of hydropower plants is generally modelled as follows:
where g is a constant. This paper takes the value of 9.8.
Hydropower plant capacity constraint is bounded. The equation of the constraint is as follows:
where
The constraint of water flow in cascade hydropower generation is as follows:
where
The power generation output constraint of the cascade hydropower plant is as follows:
where
Water balance constraint for cascade hydropower plants is as follows:
where
2.3 Thermal power generation model
In the process of power generation, the main costs of thermal power units are fixed costs and fuel costs. Therefore, the cost function of thermal power units can be written in the form of a quadratic function, as shown in the following formula (8). The marginal cost of thermal power units is shown in formula (9).
where
The generation constraints of thermal power units are as follows:
where
3 Cascade hydro—photovoltaic complementary optimal scheduling model
This paper proposes a model for optimizing the scheduling of cascaded hydropower and PV, using a bi-layer approach. The cascade hydro-photovoltaic complementary system is shown in Figure 1. The upper layer of the model is the decision trading model for the cascaded hydropower and PV, with the objective of maximizing income while minimizing fluctuations in power generation to ensure the stability and security of the power grid transmission. The upper layer constitutes a multi-objective function. The lower model, on the other hand, is the market clearing model, aimed at maximizing social welfare and minimizing social transaction costs. The relationship between the upper and lower models is illustrated in Figure 2.
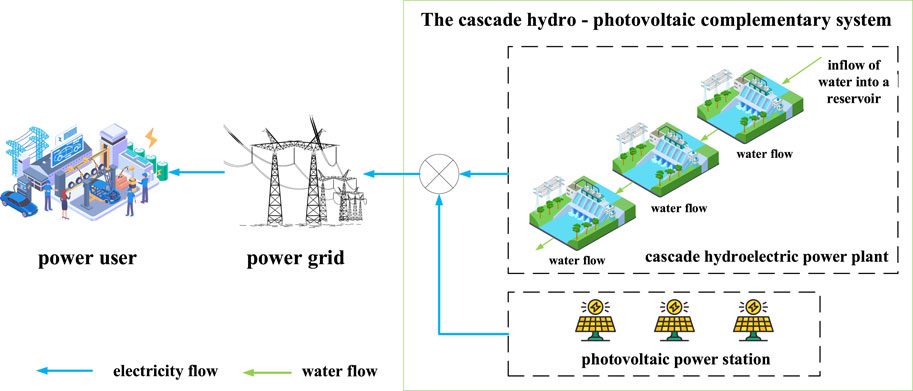
FIGURE 1. The cascade hydropower-PV complementary system.
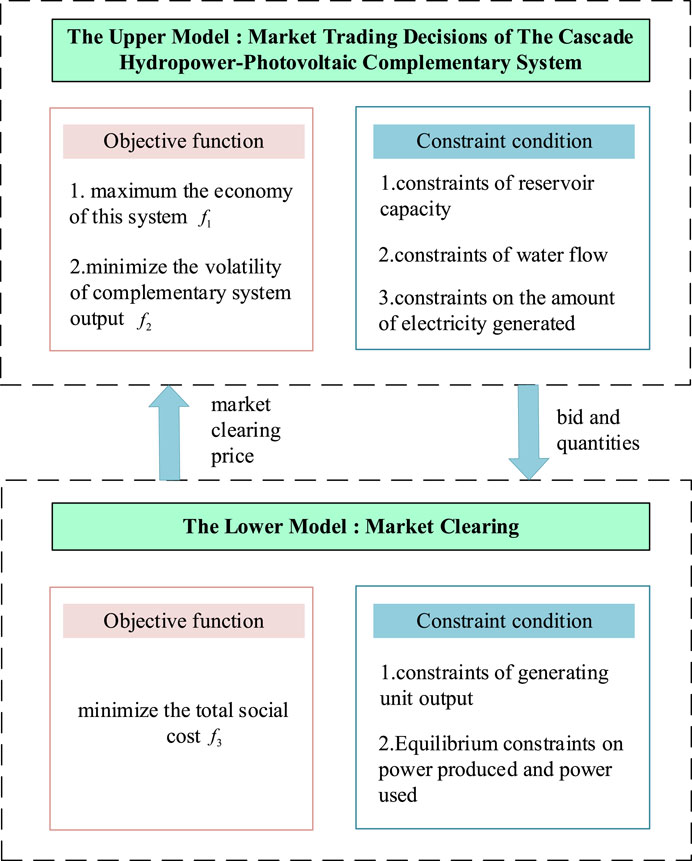
FIGURE 2. The relationship between the upper and lower models.
3.1 The upper model: market trading decisions of the cascade hydropower-photovoltaic complementary system
The cascade hydropower-PV complementary system can inhibit the fluctuation of PV with the advantage of strong adjustability of hydropower station and improve the usage rate of renewable energy. Therefore, in order to guarantee the reliable and economic operation of the system, this paper comprehensively considers the economy of system operation and the fluctuation of water-PV output, and proposes the optimal scheduling of multi-objective function. Formula (11) is the objective function. Formula (12) represents the output of the complementary system. The benefits of complementary systems is shown in formula (13).
where
The function that aims to minimum volatility is:
where
The constraints of the upper model are formula (5) to formula (7).
3.2 The lower model: market clearing
This paper discusses the process of generator bidding in the market. The generator is required to provide the quotation and quantity of each unit. The trading center then collects the price of each unit in descending order and clears them. As a price taker, the user only quotes the quantity and not the price during the day-ahead market transaction. The daily market clearing model is then optimized to minimize the total social cost using the following formulas.
where
The constraints of the lower model are as follows:
where
The other constraints are formula (6) and formula (10).
4 Model solution
4.1 Uncertainty analysis of PV output
PV power generation is highly uncertain. Therefore, describing uncertainty through probabilistic forecasting is better suited for decision-making in uncertain environments. In this paper, PV power generation is treated as obeying a normal distribution as
where
In this paper, PV scenarios are generated using the Monte Carlo method, which is a random simulation technique. If the probability distribution of the data is known, random samples can be obtained by sampling, and the characteristics can be analyzed. PV has certain regularity, and PV scenarios are similar. In order to ensure operational speed, simulation accuracy, and scenario typicality, initial scenarios should be classified. According to the law that the prediction error of PV output follows normal distribution, 100 scenarios are initially generated by Monte Carlo method. The array formed by the predicted values of illumination and other days is normalized as a whole, and the reduction method considering Kantorovich distance is used for scenario processing, and finally 10 typical scenarios are obtained.
4.2 Multi-objective function solution analysis
In this paper, we adopt the adaptive variable weighting method to transform the two objective functions into a single objective function, and adaptively adjust the weight coefficients of the two sub-objectives according to the operation of the cascade hydropower-PV complementary system. Due to the different magnitudes of the two sub-objective functions, they need to be normalized. The objective function is shown in formula (21). Formula (22) and formula (23) are represented as normalising formula (11) and formula (14), respectively.
where
4.3 The method of solving Bi-Level model
In this paper, the upper model obtains the biding amount of the combined power generation by calculating the value of the multiple objective functions, and passes it to the lower model. The lower model determines the market clearing price by calculating the objective function and passes it to the upper model. The upper model changes its strategy according to the market clearing price. In this way, the optimal solution can be obtained. Considering that the upper model is linear and the lower model has a nonlinear part, the objective function is solved using the solver Cplex for the upper model and GMO for the lower model.
GMO is a new meta-heuristic algorithm. It simulates the unique properties of geometric average operators in mathematics. The operator can simultaneously evaluate the fitness and diversity of search individuals in the search space. In GMO, when solving an optimization problem, the geometric mean of the scale target values of an individual’s opposite is assigned as its weight, representing its overall qualification to guide other individuals in the search process. Therefore, the algorithm does not need to set parameters according to the form of the objective function, which greatly improves the universality and calculation speed of the algorithm. The results were published in Soft computing in 2023 by scholars such as Farshad Rezaei. The flow chart of solving the bi-level model is shown in Figure 3.
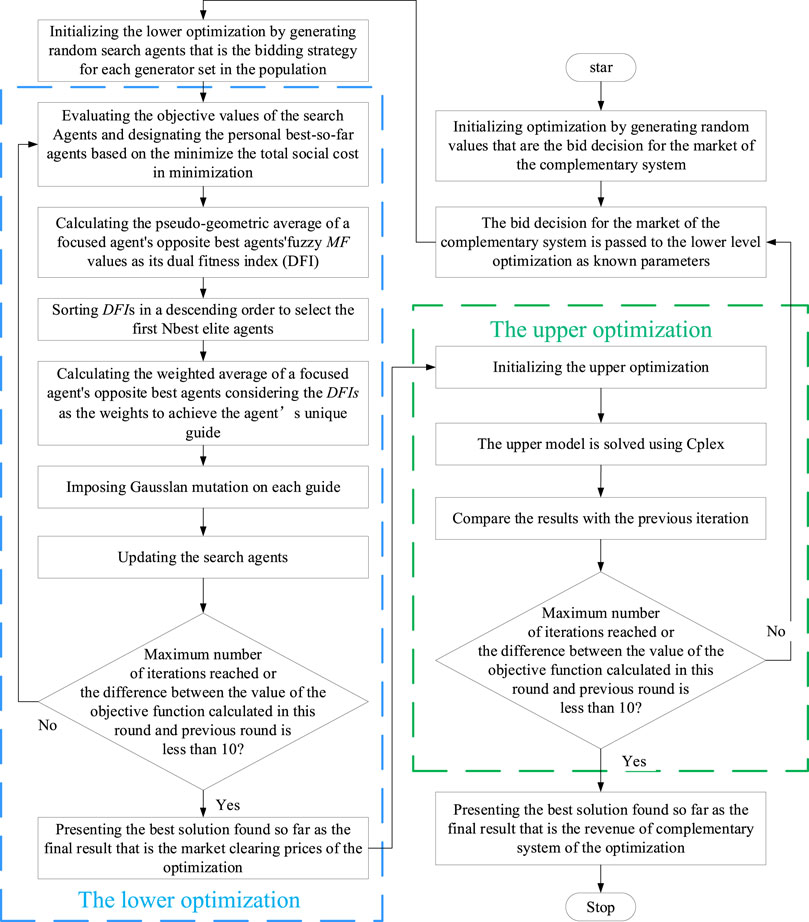
FIGURE 3. Flowchart of the bi-layer optimization model solution.
5 Case study
In this paper, the bi-level optimization model established above is validated and analyzed using GMO and Cplex with a cascade hydro–PV complementary system in a basin in Southwest China as an arithmetic example.
5.1 Data
According to statistics, The PV generation data and electrical load data for a typical day are shown in Figure 4. The data of cascade hydropower stations is shown in Table 1, and all three hydropower stations have daily regulation capacity. Both the initial population number and the maximum number of iterations for GMO are set to 100.
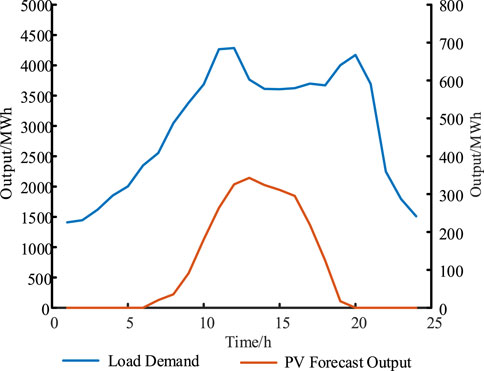
FIGURE 4. The PV generation data and electrical load data.
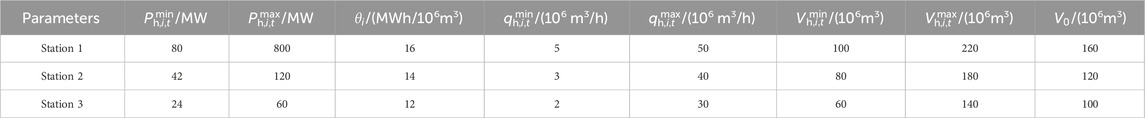
TABLE 1. The initial data of three cascade hydropower stations.
5.2 Results analysis
Due to the strong randomness of natural resources such as light, this paper reduces the error of scheduling results by selecting typical PV power scenarios. Figure 5 shows the scenario reduction results of PV output in 24 h.
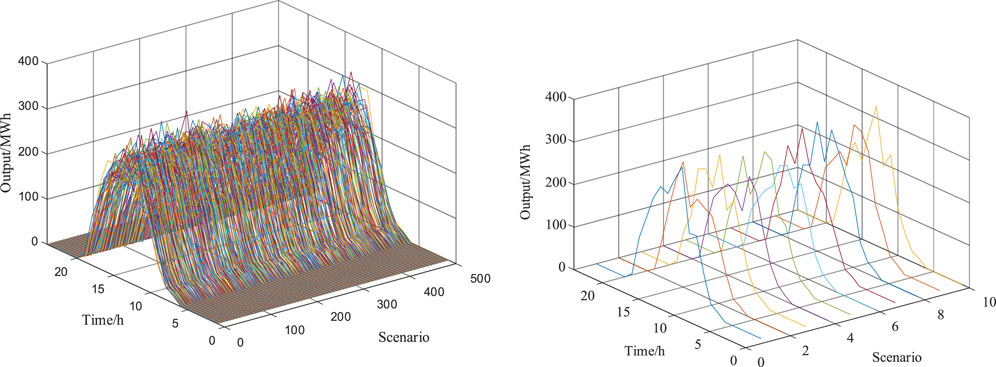
FIGURE 5. Scenario generation and scenario reduction for PV generation.
Figure 6 shows the results of the joint participation of the cascade hydro-PV in electricity market trading. Figure 7 shows the results of the complementary system participating in electricity market trading when volatility is not considered. Therefore, Figure 7 is the results of the separate participation of the cascade hydro-PV in electricity market trading.
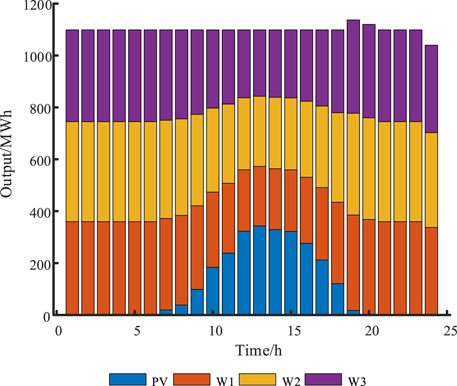
FIGURE 6. The output of each unit in the cascade hydropower-PV complementary system.
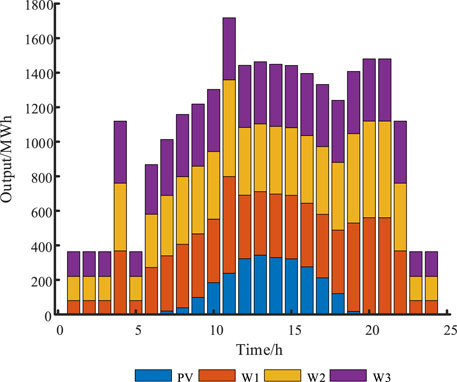
FIGURE 7. Electricity traded in electricity markets by cascade hydro-PV complementary systems without considering volatility.
In Figure 6, the total power generation of the complementary system of the cascade hydro-PV after participating in the market trading is 28,896 MWh. Among them, the power generation of terraced hydropower units 1, 2 and 3 is 7,680, 8,400 and 7,776 MWh respectively, which accounts for 26.58%, 29.07% and 26.91% of the total power generation, respectively. Photovoltaic power generation amounted to 2,520 MWh, accounting for 8.72% of the total power generation.
The total benefit of the complementary system is 9,554,994 yuan and the volatility of output is 15.03, of which 8,586,751 yuan is generated by the cascading hydropower. However, the total return from the separate market participation of the cascade hydro-PV is 9,739,344 yuan and the volatility of the output is 445.94, of which 8,835,948 yuan for the cascade hydropower. Comparison of Figures 6, 7 shows that the return of the complementary system is reduced, but its volatility is much higher. For the cascade hydropower, the return is reduced by 2.8%, but the volatility is much lower, which greatly improves the stability of the unit’s output. The low volatility is more favorable, both from the point of view of the security of grid operation and from the point of view of the lifetime of the unit generation. At the same time, the revenue of the PV units in the complementary system was increased by 64,846 yuan, reducing the abandonment rate and volatility costs.
Therefore, the complementary system improves the stability of the system power generation and the stability of the grid power supply while reducing the part of the revenue of the cascade hydropower. Such measures can be taken when there is a high demand for power supply stability in some areas.
Table 2 shows the maximum generation, minimum generation, average generation, volatility, and returns per hour when the complementary system participates in the market under different a. From the data in the table, it can be seen that as a gets larger, the average generation of the complementary system is more, but the willingness to pay and the volatility are less. With the same amount of incoming water, more average generation means less water abandonment and higher resource utilization. With the shortage of renewable resources, the high utilization of water resources is more in line with the current concept of energy utilization.
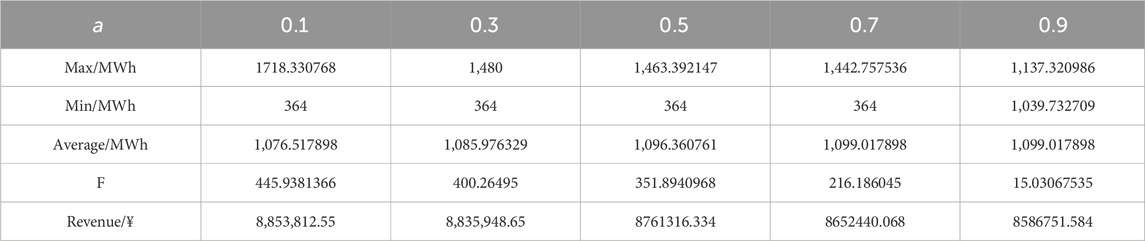
TABLE 2. System failure rates corresponding to different impact indicators in a specific region.
5.3 Comparative analysis of GMO and PSO
In this paper, GMO is used to solve the objective function. In order to show the advantage of GMO, PSO is additionally used to solve the objective function in this paper as a comparison. The initialization program sets the PSO parameters w to 0.8, c1 to 1.5, and c2 to 1.5. The results show that PSO has fewer steps in the time scale of the solution, so the solution time will be shorter. PSO and GMO run for 1.04877 and 1.38686 s, respectively. However, PSO needs to set the values of parameters w, c1 and c2 in advance, and it consumes a lot of time to adjust them with the results of the computation. GMO does not need to set the parameters and adapts automatically with the solved function. In the final calculation result, GMO and PSO have about the same data. However, in this paper, the number of particles that need to be solved is large, which causes PSO to often fall into localized solutions when solving, while GMO does not. As can be seen from Table 3, when the number of calculations is 10 times, PSO has a 60% probability of falling into a localized solution, while GMO does not appear to fall into a localized solution. When the number of populations increases, the PSO’s trapped local solutions decrease, but the running time increases. The results of one of the best PSO and GMO runs were selected for comparison, as shown in Figure 8. The results show that GMO is able to converge in a very short number of iterations, while PSO takes longer to find the correct result. It can be concluded that GMO has better algorithmic accuracy.
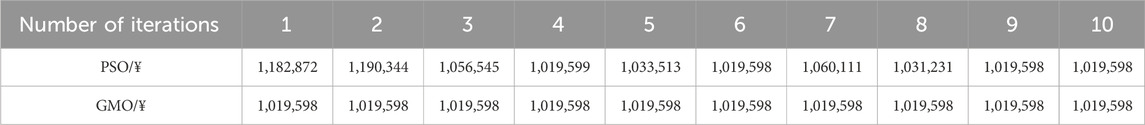
TABLE 3. Results from ten iterations of PSO and GMO.
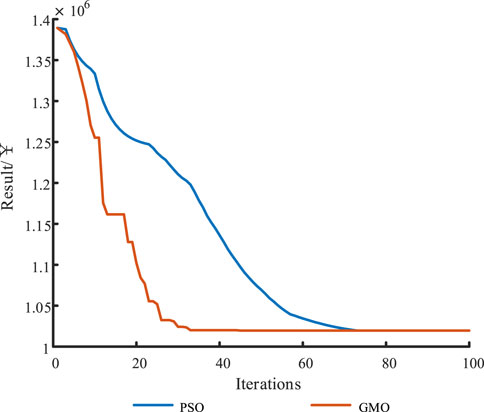
FIGURE 8. Comparison of PSO and GMO operating results.
6 Conclusion and future work
The proportion of installed capacity of renewable energy sources, such as PV, will continue to rise in China’s efforts to build a new power system. Hydropower, with the largest adjustable clean power capacity in China, must fulfill the dual purpose of supporting grid power supply and regulating new energy. Based on this, a scheduling decision-making model is constructed for optimizing the cascade hydropower-PV complementary system. This model provides decision support for safe and economic operation. The bi-layer model consists of two layers, with the upper layer optimizing multiple objectives that include maximizing returns and minimizing volatility for the complementary system. The lower layer deals with the clearing of various types of generating units to facilitate market transactions. A bi-level GMO is used to solve the model. The results show that the volatility of complementary systems is much lower than that of systems without joint market participation. Moreover, the revenue of PV in the complementary system is increased, and the resource curtailment rate of the cascade hydro-PV is reduced, which greatly improves the utilization of renewable energy. Low generation volatility is more favorable for the safe and stable operation of the grid. It has been verified that utilizing GMO as the solution algorithm for solving the bi-level optimization model is simpler and more stable compared to PSO.
The paper focuses on the participation of thermal units and complementary units in electricity market trading. However, the impact of other units on market trading and the participation of thermal units in carbon market trading are not considered. Additionally, the impact of the difference in PV output and incoming water during the rainy and dry seasons on the complementary system is also not considered. Future work will investigate the impact of the participation of complementary systems in market transactions during different seasons and the impact of carbon market development on power market clearing.
Data availability statement
The original contributions presented in the study are included in the article/Supplementary material, further inquiries can be directed to the corresponding author.
Author contributions
LS: Writing–original draft. YW: Writing–original draft. QW: Writing–review and editing, Writing–original draft. PZ: Writing–review and editing, Writing–original draft.
Funding
The author(s) declare financial support was received for the research, authorship, and/or publication of this article. This work was supported by the Southwest Branch of State Grid Corporation of China (SGSW0000FGJS2310063). The funder was not involved in the study design, collection, analysis, interpretation of data, the writing of this article, or the decision to submit it for publication.
Conflict of interest
Authors LS, YW, QW, and PZ were employed by State Grid Corporation of China.
Publisher’s note
All claims expressed in this article are solely those of the authors and do not necessarily represent those of their affiliated organizations, or those of the publisher, the editors and the reviewers. Any product that may be evaluated in this article, or claim that may be made by its manufacturer, is not guaranteed or endorsed by the publisher.
References
An, Y., Fang, W., Ming, B., and Huang, Q. (2015). Theories and methodology of complementary hydro/photovoltaic operation: applications to short-term scheduling. J. Renew. Sustain. Energy 7, 063133. doi:10.1063/1.4939056
Chen, Y., Wei, W., Liu, F., and Mei, S. (2016). Distributionally robust hydro-thermal-wind economic dispatch. Appl. Energy 173, 511–519. doi:10.1016/j.apenergy.2016.04.060
Huang, K., Liu, P., Ming, B., Kim, J., and Gong, Y. (2021). Economic operation of a wind-solar-hydro complementary system considering risks of output shortage, power curtailment and spilled water. Appl. Energy 290, 116805. doi:10.1016/j.apenergy.2021.116805
Kougias, I., Szabo, S., Monforti-Ferrario, F., Huld, T., and Bodis, K. (2016). A methodology for optimization of the complementarity between small-hydropower plants and solar PV systems. Renew. Energy 87, 1023–1030. doi:10.1016/j.renene.2015.09.073
Li, F., and Qiu, J. (2016). Multi-objective optimization for integrated hydro-photovoltaic power system. Appl. Energy 167, 377–384. doi:10.1016/j.apenergy.2015.09.018
Liu, B., Lund, J., Liao, S., Jin, X., Liu, L., and Cheng, C. (2020). Optimal power peak shaving using hydropower to complement wind and solar power uncertainty. Energy Convers. Manag. 209, 112628. doi:10.1016/j.enconman.2020.112628
Lu, L., Yuan, W., Su, C., Wang, P., Cheng, C., Yan, D., et al. (2021). Optimization model for the short-term joint operation of a grid-connected wind-photovoltaic-hydro hybrid energy system with cascade hydropower plants. Energy Convers. Manag. 236, 114055. doi:10.1016/j.enconman.2021.114055
Ming, B., Liu, P., Cheng, L., Zhou, Y., and Wang, X. (2018). Optimal daily generation scheduling of large hydro–photovoltaic hybrid power plants. Energy Convers. Manag. 171, 528–540. doi:10.1016/j.enconman.2018.06.001
Ming, B., Liu, P., Guo, S., Cheng, L., and Zhang, J. (2019). Hydropower reservoir reoperation to adapt to large-scale photovoltaic power generation. Energy 179, 268–279. doi:10.1016/j.energy.2019.04.209
Rezaei, F., Safavi, H., Abd Elaziz, M., and Mirjalili, S. (2023). GMO: geometric mean optimizer for solving engineering problems. Soft Comput. 27, 10571–10606. doi:10.1007/s00500-023-08202-z
Tan, Q., Wen, X., Sun, Y., Lei, X., Wang, Z., and Qin, G. (2021). Evaluation of the risk and benefit of the complementary operation of the large wind-photovoltaic-hydropower system considering forecast uncertainty. Appl. Energy 285, 116442. doi:10.1016/j.apenergy.2021.116442
Wang, X., Chang, J., Meng, X., and Wang, Y. (2018). Short-term hydro-thermal-wind-photovoltaic complementary operation of interconnected power systems. Appl. Energy 229, 945–962. doi:10.1016/j.apenergy.2018.08.034
Wang, X., Virguez, E., Kern, J., Chen, L., Mei, Y., Patino-Echeverri, D., et al. (2019b). Integrating wind, photovoltaic, and large hydropower during the reservoir refilling period. Energy Convers. Manag. 198, 111778. doi:10.1016/j.enconman.2019.111778
Wang, Y., Zhao, M., Chang, J., Wang, X., and Tian, Y. (2019a). Study on the combined operation of a hydro-thermal-wind hybrid power system based on hydro-wind power compensating principles. Energy Convers. Manag. 194, 94–111. doi:10.1016/j.enconman.2019.04.040
Xu, B., Zhu, F., Zhong, P., Chen, J., Liu, W., Ma, Y., et al. (2019). Identifying long-term effects of using hydropower to complement wind power uncertainty through stochastic programming. Appl. Energy 253, 113535. doi:10.1016/j.apenergy.2019.113535
Yang, Z., Liu, P., Cheng, L., Liu, D., Ming, B., Li, H., et al. (2021). Sizing utility-scale photovoltaic power generation for integration into A hydropower plant considering the effects of climate change: a case study in the Longyangxia of China. Energy 236, 121519. doi:10.1016/j.energy.2021.121519
Yin, Y., Liu, T., and He, C. (2019). Day-ahead stochastic coordinated scheduling for thermal-hydro-wind-photovoltaic systems. Energy 187, 115944. doi:10.1016/j.energy.2019.115944
Yuan, W., Wang, X., Su, C., Cheng, C., Liu, Z., and Wu, Z. (2021). Stochastic optimization model for the short-term joint operation of photovoltaic power and hydropower plants based on chance-constrained programming. Energy 222, 119996. doi:10.1016/j.energy.2021.119996
Zhang, Q., Wang, X., Yang, T., and Liang, J. (2017). Research on scheduling optimisation for an integrated system of wind-photovoltaic-hydro-pumped storage. J. Eng. 13, 1210–1214. doi:10.1049/joe.2017.0521
Zhang, Y., Ma, C., Lian, J., Pang, X., Qiao, Y., and Chaima, E. (2019). Optimal photovoltaic capacity of large-scale hydro-photovoltaic complementary systems considering electricity delivery demand and reservoir characteristics. Energy Convers. Manag. 195, 597–608. doi:10.1016/j.enconman.2019.05.036
Keywords: cascaded hydropower station, hydropower-PV system, bi-layer scheduling strategy, meta-heuristic algorithm, power market
Citation: Shen L, Wen Y, Wang Q and Zhang P (2024) Enhanced bi-layer scheduling strategies for the cascade hydropower-photovoltaic complementary system using a novel meta-heuristic algorithm. Front. Energy Res. 11:1335683. doi: 10.3389/fenrg.2023.1335683
Received: 09 November 2023; Accepted: 21 December 2023;
Published: 08 January 2024.
Edited by:
Youbo Liu, Sichuan University, ChinaReviewed by:
Jun Wang, Henan University of Technology, ChinaGuozhou Zhang, Southwest University, China
Bi Liu, Sichuan Agricultural University, China
Copyright © 2024 Shen, Wen, Wang and Zhang. This is an open-access article distributed under the terms of the Creative Commons Attribution License (CC BY). The use, distribution or reproduction in other forums is permitted, provided the original author(s) and the copyright owner(s) are credited and that the original publication in this journal is cited, in accordance with accepted academic practice. No use, distribution or reproduction is permitted which does not comply with these terms.
*Correspondence: Yiyu Wen, MTkxNzA0MzgzNEBxcS5jb20=