 LiangSong Guo
 LeiLei Lv
- Hetian Power Supply Branch of State Grid Xinjiang Power Co., LTD, Hetian, China
To address the challenges posed by the fast-charging demand of electric vehicles, causing feeder load and voltage imbalances during operation, this paper introduces a spatio-temporal pricing strategy tailored to enhance feeder operation equilibrium. This approach facilitates the spatio-temporal guidance of fast-charging loads for electric vehicles in operation. This paper begins by formulating a spatio-temporal distribution model for electric vehicle fast-charging loads, considering owners’ preferences. It further develops a behavioral model for the travel choices of electric vehicles, illustrating the impact of spatio-temporal electricity pricing at fast-charging stations on load distribution. Next, it proposes a multi-objective spatio-temporal pricing model and its solution method specifically designed for feeder-balance-oriented fast-charging stations. This model targets the minimization of the spatio-temporal imbalance in feeder voltage and load. It takes a comprehensive approach, considering the constraints of the spatio-temporal load distribution model and optimal power flow model. The resulting spatio-temporal pricing model for fast-charging stations is effectively solved using the extended Pareto evolutionary algorithm. To validate the effectiveness of the proposed method in achieving feeder balancing, this paper analyzes two examples: a self-built 29-node road network and a 9-node distribution network, as well as a 66-node road network and a 33-node distribution network in the Xinjiang region. The results show that the proposed method can effectively guide the charging of electric vehicles and make the load distribution more balanced.
1 Introduction
With the advancement of low-carbon economy construction, electric vehicles (EVs) are rapidly replacing gasoline vehicles. According to the statistics of the Ministry of Industry and Information Technology of China, the number of pure EVs in China has exceeded 1,310 units by the end of 2022 (The Central People’s Government of the People’s Republic of China, 2023). Large-scale EV appear to the distribution network has become an inevitable trend that can be predicted in the short term. The huge charging demand of EVs will lead to a rapid and unbalanced growth of regional loads in a short period, which will have a significant impact on the safe and economic operation of the distribution network (Chen et al., 2018; Lei et al., 2020; Mei et al., 2020). Under the uncontrolled access of EVs, the distribution network often needs to carry out super-redundant capacity expansion and reconstruction of some distribution substations to ensure the peak charging demand of EVs. However, due to urban road construction and other reasons, the distribution of EV charging loads shows serious uneven characteristics, which results in the inefficient phenomenon of redundant construction of some stations and incomplete capacity utilization of some stations (Liu et al., 2012; Cao et al., 2021; CUI et al., 2021).
Therefore, the optimization of EV charging loads has become a hot topic in the current distribution network research. Many studies have obtained information such as the start and end time of charging, state of charging, and expected power of EVs through the statistical analysis of the historical travel pattern of EVs (Kang et al., 2004; Yao et al., 2007; WANG et al., 2019). Then, the adjustable boundaries of EVs were determined and used as constraints to optimize the EV charging power (ChenPan and Yu, 2019; Pan et al., 2019). These studies have considered only the temporal tunability of EV charging loads and neglected their spatial flexibility. In addition, these works require the EV dwell time to be longer than the minimum charging time for charging to the desired power level, which is more suitable for slow-charging scenarios such as homes or commercial buildings. In fact, the impact of EV charging loads on the distribution network comes more from operating vehicles, which frequently have fast-charging needs. Operational vehicles are usually expected to complete charging in a short period, and their charging options are highly autonomous, with large power impacts and little adjustable space. However, due to its profitability, this type of vehicle usually considers the charging price and geographical location when choosing a charging station, which is highly flexible in both time and space dimensions. Therefore, knowing how to rationally consider the spatial location of fast-charging stations and the temporal characteristics of grid loads to effectively set price and realize the guidance of temporal and spatial flexibility of operating vehicles is important to reduce the load imbalance phenomenon in the transformer stations.
Among them, time flexibility has been discussed by the engineering and academic communities for a long time. In engineering, the current charging price composition of mainstream service providers such as “Special Calls” and “XiaoJu Charging” is composed of time-of-use electricity prices and service fees, and the time guidance for EV access is realized through the electricity price setting of three periods of peaks and valleys. However, in the actual research, it is found that these service providers have greater autonomy in setting the price and have not been effectively regulated. The service charge depends on the price of urban lots, which, to some extent, realizes the guidance of EV spatial flexibility, but it fails to consider the load distribution of the grid and may instead exacerbate phenomena such as the imbalance of the transformer stations. In the academic community, a wide range of scholars have discussed the development of time-of-use charging price for various scenarios (LI et al., 2022; WANG Jun et al., 2023; WANG Yifei et al., 2023). LI et al. (2022) used time-of-use electricity prices to guide EV charging in residential areas for a long time to reduce the peak-to-valley difference. WANG Jun et al. (2023) took the carbon price into account and designed the transfer response function of EV charging load, to optimize the EV charging cost and the carbon emission cost of power generation at the same time. On the other hand, WANG Yifei et al. (2023) designed a game model for distribution network operators and charging service aggregators to simplify the EV charging selection process using virtual energy storage for time-of-use price development. It can be seen that the above studies are generally for EV charging loads with long access times, and the simplified expression of the EV charging load transfer process as a supply and demand function is only applicable to non-fast-charging demand scenarios such as home-based charging piles.
Spatial flexibility has gradually become a hot topic of academic discussion in recent years with the deepening of the coupling of the transportation network and the power grid. The current research can be further divided into two directions: marginal pricing (Li et al., 2013; Liu et al., 2016; Xie et al., 2021) and integrated pricing. The former uses the distribution locational marginal power price (DLMP) as the basis price (Li et al., 2013), which solves the distribution optimal power flow (DOPF) to determine the constraint multipliers and serves as the shadow price to realize spatial pricing (ALIZADEH et al., 2016; Wei et al., 2018). This approach is a good representation of the marginal cost of node charging when blockage occurs in the distribution network (ALIZADEH et al., 2016). Furthermore, at the present stage when the distribution network is operated in a radial shape and the phenomenon of large-scale current reversal does not appear widely, the blockage phenomenon of the distribution network can usually be solved by the expansion and reconstruction project. At this time, the method can only reflect the marginal network loss cost brought by each node and cannot play a role in promoting regional load balance. As for integrated pricing (Cai et al., 2022; XIE et al., 2022), pricing is discussed to be achieved through an interactive and iterative pricing approach of traffic and power simulation systems, led by integrated grid demands such as peak–valley differentials and economic dispatch. Unlike slow-charging scenarios for EVs in households or commercial buildings, the charging behavior of operating vehicles with fast-charging loads is influenced by a combination of factors such as the current location of the EV, charging station fees, EV user charging preferences, and road congestion. Therefore, the prediction of the EV charging behavior needs to be based on the coupling of distribution network–road network–EVs (Shao et al., 2017). On the one hand, the travel and charging behavior of EVs are influenced by road traffic flow and charging costs. On the other hand, the travel and charging behavior of EVs also have a reverse effect on changes in road traffic flow and distribution network trends. Reasonable guidance methods can improve the trend of road and distribution grids (Li et al., 2023). Therefore, it is crucial to accurately characterize EV travel behavior, predict changes in road traffic flow, and propose reasonable guidance methods. In existing studies, the elasticity matrix (Cai et al., 2022), static traffic equilibrium model (XIE et al., 2022), and semi-dynamic traffic equilibrium model have been used to portray the EV charging load-shifting process under the guidance of price, achieve the evaluation of price, and carry out iterative optimization. Most of these studies still focus on simulating the interaction of non-dynamic traffic flows in fixed scenarios, which, to some extent, ignores the stochastic nature of EV traveling. In addition, these studies usually take the traditional distribution system as the object of discussion, ignoring the active support capability of distributed resources in distribution networks.
Therefore, in Section 2, this article first constructs a spatio-temporal pricing framework based on the interaction process between the transportation system and the power system. In Section 3, the EV driving path and its fast-charging station selection process are simulated dynamically by constructing a spatio-temporal distribution model for fast-charging loads considering the owner’s preference. Then, in Section 4, the distribution optimal power flow model considering the energy resource is introduced to realize the calculation of the voltage and load ratio imbalance under the price-guided EV charging. Furthermore, a fast-charging station pricing method oriented to the load balance is further proposed to realize the spatio-temporal power pricing and reduce the load ratio imbalance of transformer stations. Specifically, it is based on the improved Strength Pareto Evolutionary Algorithm (SPEA2) (Shao et al., 2017), which accomplishes the interaction between the spatio-temporal distribution model for fast-charging loads and the optimal power flow model to realize the iterative search of spatio-temporal prices. Finally, in Section 5, the validity and laudability of the proposed methodology are verified on a self-built small-scale test case and a real road network case in a region of Xinjiang.
2 A spatio-temporal pricing framework for fast-charging stations
The spatio-temporal pricing problem for fast-charging stations, which is essentially a power system optimization problem based on dynamic traffic flow, can be decomposed into the power system pricing optimization problem at the upper level and the traffic flow solving problem considering the impact of electricity price at the lower level, whose relationship is shown in Figure 1. At the lower layer, the traffic flow model is introduced to portray the EV traveling path cost. The subjectivity of EV traveling path selection is described by the owner’s preference model, to incorporate the pricing strategy into the traffic flow solving problem. Furthermore, the randomness of EV traveling choice is ensured using the stochastic Monte Carlo probability sampling method, and the shortest circuit method is used to solve the traveling paths of the final EV monoliths, which form the spatio-temporal fast-charging loads of EV in the day ahead. In the upper layer, the distribution network operator relies on the SPEA2 to generate the spatio-temporal pricing population to be sent down to the lower layer of the problem. After obtaining the corresponding charging loads, the optimal power flow is solved by using the second-order conical planning, and the overall spatio-temporal imbalance of the voltage and load for the transformer station is then calculated. The price population is updated according to the obtained results. The above process is repeated until acceptable spatio-temporal price results are obtained.
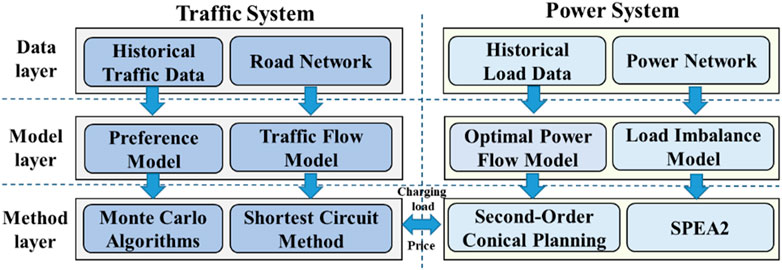
Figure 1. Spatio-temporal pricing framework.
3 The spatio-temporal distribution model for fast-charging loads considering EV owners’ preferences
To reflect the dynamic impact of different prices on the spatio-temporal distribution of EV loads, the preference of vehicle owners for road access time and price is modeled to simulate the driving behavior choices of EV owners. Thus, it indirectly reacts to the influence of price on road flow and power grid currents and assists in accomplishing the spatio-temporal pricing for charging stations. The road network is a typical graph structure, which can be represented as
3.1 EV travel patterns and speed modeling methods
In the urban road network, there are mainly two types of vehicles: private vehicles and operating vehicles. First, to simulate the traveling pattern and dynamic driving process of EVs, EV travel-return probability distribution, EV destination dynamic selection, and EV dynamic speed calculation models are constructed.
In terms of the probability distribution of EV travel-return trip, according to the statistical fitting of the traveling pattern, the EV driving traveling time approximately obeys the normal distribution, and its return time approximately obeys the Cauchy distribution. The corresponding distribution of the probability density function is shown as Eqs (1)–(3):
where the demand for commuting trips by a private vehicle is obtained from the probability distribution of
In addition, for the dynamic selection of EV destinations, it is necessary to determine the origin–destination (O–D) of EVs at different moments (Zhang et al., 2017). In fact, there are significant functional differences between different areas of the urban road network. According to the functional classification in the government control plan, urban areas can be roughly divided into three types: residential areas, work areas, and commercial areas. Different EV traveling directions are closely related to the functions of the areas. Private cars usually travel in the direction of “residential area–work area” during commuting time. Operational vehicles are more flexible as they usually undertake multiple consecutive trips, but their choice of traveling area also has a typical temporal distribution. In order to realize the simulation of EV trips and charging loads of operating vehicles, it is necessary to determine the function of the area to which the nodes belong. Therefore, the residential area node set
where
After specifying the EV travel options, the speed of road network traveling also needs to be considered to dynamically simulate the EV travel. The EV traveling speed is affected by the road class and traffic volume of the road section, which can be portrayed using the speed-flow utility model (Shao et al., 2017) as follows:
where
3.2 EV owner path selection preference model
The path selection of operational EVs is usually affected by several aspects, which can be divided into the following: 1) when the power is sufficient, the path communication time is usually the most concerned factor for operational vehicles; 2) when the power is insufficient, the vehicle owner needs to recharge the vehicle as quickly as possible to continue the operation at the lowest possible price, in which case the access time and the cost of recharging together become the most important factors affecting their decision.
It can be seen that for the simulation of operating vehicle path selection, the influencing factors can be summarized into two aspects: path travel time and charging cost. The path traveling time is decomposed into the traveling time of the multiple road sections passed through, which, in turn, depends on the length of the road sections and the traveling speed of the road sections. The length of the road section is characterized by
For each fully charged EV owner, the route selection is dynamically adjusted at each moment according to the real-time traffic flow and roadway passing time. At this point, the O–D pair and delay matrix
where
where Eqs 14–15 indicate the radial constraint of the path; i.e., any node can only be used as a starting and ending point once. Equation 16 indicates the connectivity of the intermediate segment selection of a non-starting node. Equations 17–18 indicate that the starting node must be passed once as the starting and ending points.
Notably, this problem belongs to the integer programming problem, which will be difficult to solve under larger road networks. Therefore, Dijkstra’s algorithm, which is widely used in graph theory (Zhang et al., 2017), is used here to solve it, and the path selection with sufficient power can be obtained.
As for EVs with charging needs, they need to target several nearby fast-charging stations for destination selection. In this case, the EV’s path selection needs to solve the globally shortest path problem for several O–D pairs and calculate its traveling time and charging cost. An example of a fast-charging station c located at node
First, according to Eqs 13–18, the traveling time
Based on the results obtained, the cost of its charging is further calculated as follows:
where
Considering the different sensitivities of different EV owners to time and electricity price, this paper sets the distance loss weight
where
3.3 Simulation of the spatio-temporal distribution of fast-charging loads based on the Monte Carlo method
After completing the construction of the relevant model for the dynamic simulation of EV travel, the stochastic simulation of the electricity price’s guidance on the spatio-temporal distribution of regional fast-charging loads is realized based on the Monte Carlo method, the steps of which can be summarized as follows:
Step 1: The time is initialized to 0, and each EV is assigned an initial location
Step 2: The state of each EV is iterated at time t, and O–D pairs are formed according to the EV type. For the private car, it has a fixed O–D pair and only needs to determine whether its time is
Step 3: If the O–D pair of the EV is confirmed, its path selection is dynamically updated at the moment t. Equations 13–18 and 19–26 are solved to develop optimal traveling paths for different EVs with sufficient power and charging demand for EVs, respectively.
Step 4: At the same time, we iterate over all EVs and combine the velocity-flow model (10–11) to calculate and update the state of each EV at moment t.
Step 5: We determine whether the moment t reaches the simulation maximum moment. If not, we update t = t+1 and re-enter Step 2; if yes, we end the computation and output the driving behavior of each EV at the simulation moment, as well as output the spatio-temporal distribution of fast-charging loads according to each fast-charging station accessing the distribution network node.
4 The spatio-temporal pricing model of fast-charging stations for load balance
4.1 Spatio-temporal pricing model construction
Large-scale demand for fast-charging loads will exacerbate the degree of load imbalance among transformer stations and consequently bring about serious redundancy in grid investment and construction. Distribution network operators should endeavor to set reasonable spatio-temporal price for fast-charging stations to effectively guide the orderly access of fast-charging loads by stimulating vehicle owners’ preferences. The necessity of spatio-temporal guidance is illustrated in the previous section. In a single time section under the effect of time-guided signaling such as time-of-day price, the load balance of each station is difficult to be taken into account. The charging price is generally determined by combining the time-of-use electricity price and charging service fee, which is determined by the location of the charging station. To a certain extent, it is possible to guide the selection of charging sites for EVs, but in the pricing mechanism of spatial service fees, time is directly decoupled, and insufficient consideration is given to the short-term impact of distribution system loads. Therefore, the article simultaneously calculates the price from two perspectives, time and space, to achieve balanced operation of transformer stations in the spatio-temporal dimension.
The power distribution system can be represented as a strong connection graph
where H represents the number of scheduling intervals;
In fact, the spatio-temporal tariff will affect the load spatio-temporal distribution. Representing the spatio-temporal tariff vector by a matrix
In the formula, the parameters determined by random sampling, such as the starting point of EVs in the charging load distribution model, are defined as vector
The spatio-temporal tariff affects the loads and then changes the current distribution, causing a change in the voltage spatio-temporal distribution. Among them, considering the economic requirements of the distribution system operation, the node voltage is formulated to rely on the DOPF calculation. The DistFlow model (DIJKSTRA, 1959), which is the most widely used model in distribution systems, is used here, and based on the second-order cone to achieve convexity, the DOPF can be expressed as follows as the solution to the following optimization problem:
where
Combining Eqs 27–32, the optimization problem for the spatio-temporal price can be formulated as the solution process of the following equation:
4.2 Spatio-temporal pricing model solution
Notably, Eq. 31 couples the EV travel simulation model in Section 3, possessing stochasticity and non-linearity. There are many recent studies that have thoroughly discussed the EV travel simulation model and tried to equate it to a mathematical planning model. However, due to its nature being the same as the traveler problem, which belongs to the same NP-hard problem, the computational efficiency of these studies cannot be effectively guaranteed when the network size becomes larger. Therefore, in order to obtain an acceptable suboptimal solution in an efficient time, this article still uses a heuristic algorithm in conjunction with the simulation model in Section 3.
At the same time, considering that the voltage balance is not equivalent to the balance of loads, problem 41 cannot be simply transformed into a single-objective problem to be solved. Therefore, the classical multi-objective optimization algorithm SPEA2 is chosen here to solve the problem iteratively. The solution process is shown below (mainly for the determination of the day-ahead spatio-temporal price).
Step 1: The road network information and topology information of the power system of the regional transportation system before the day is imported, and the spatio-temporal electricity price population before the day is initialized.
Step 2: This step involves entering the traffic system simulation link. The start and end points and state of charge of EVs are randomly generated according to the probability, and the spatio-temporal electricity price information in the population is imported into the spatio-temporal distribution simulation model of EV load considering the preference of vehicle owners so as to obtain the nodal load distribution under the current spatio-temporal electricity price.
Step 3: This step involves entering the optimal power flow solution of the power system. The nodal load corresponding to each spatio-temporal electricity price in the current population is taken as the input of DOPF in Eq. 32, and the power flow distribution of each electricity price is calculated separately.
Step 4: This step involves entering the calculation of the imbalance in the station area. Based on the power flow results of each spatio-temporal price, Eqs 27–30 are used to obtain the voltage balance degree and the spatio-temporal load balance degree under each electricity price.
Step 5: The Pareto surface is updated according to the obtained results, and it is determined whether the maximum number of iterations has been reached. If so, the spatio-temporal electricity price with the smallest sum of the two targets in the current Pareto surface is selected as the output, and if not, the SPEA2 will update the population and enter a new iteration, repeating Step 2–Step 5.
It should be noted that the solution of the proposed framework can be based on similar multi-objective heuristic optimization algorithms, and only SPEA2, which performs consistently in the example, is chosen for the analysis.
5 Case studies
5.1 Experimental environment
All the algorithms in this article were written in Python 3.9 on a personal computer with a CPU configuration of Intel® Core (TM) i7-10700F CPU@ 2.90 GHz and 16 GB of RAM and were simulated using the Spyder compilation platform. The mathematical optimization problems involved in the algorithms are all solved based on the Gurobi 9.5.2 solver.
5.2 Case settings
To verify the effectiveness of the proposed fast-charging station spatio-temporal price on the load and voltage balance aspects of the station, simulation cases are set up as follows:
Case 1: Based on the proposed method and DLMP method, the spatio-temporal pricing results of fast-charging stations are calculated in the self-built 9-node distribution power network and 29-node road network, and the total load, load voltage distribution, and electricity price distribution are compared and analyzed.
Case 2: Based on the proposed method and DLMP method, the spatio-temporal pricing results of fast-charging stations are calculated in the self-built 33-node distribution network and the real 66-node road network system in a certain region of Xinjiang, and the total load, load voltage distribution, and electricity price distribution are compared and analyzed.
5.3 Case analysis
5.3.1 Analysis results in case 1
Case 1 compares the proposed pricing algorithm with the DLMP algorithm. It consists of a 29 node road network and a 9 node power network, as shown in Figure 2. The area type of each road node is shown in Table 1. Road nodes 5, 14, and 28 are equipped with fast-charging stations, which are connected to nodes 2, 6, and 8 of the power network, respectively.
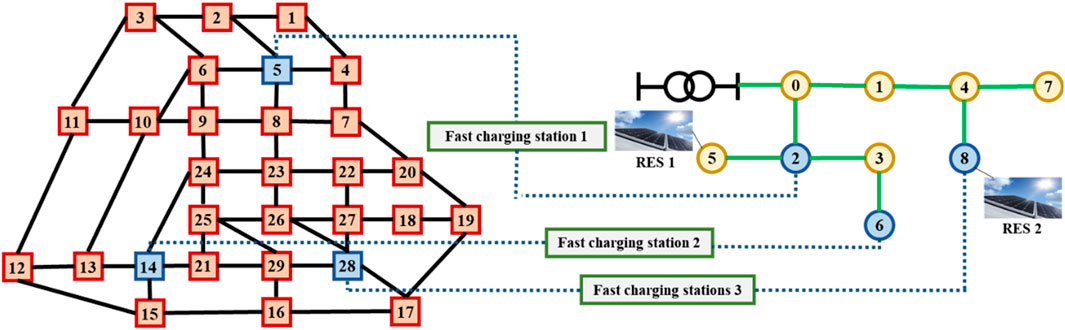
Figure 2. Test case 1: 9-node distribution network topology and 29-node road network.
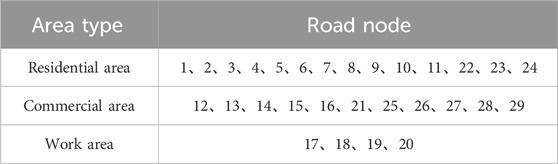
Table 1. Area type of each road network node in the self-constructed example.
Considering the power purchase cost of the grid-connected nodes considered in the DLMP follows the setting of the time-of-use (TOU) tariff of the upper grid, TOU prices are set here as shown in Table 2.
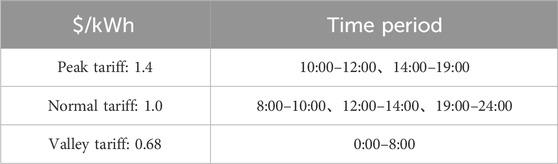
Table 2. Peak, normal, and valley tariff settings.
5.3.1.1 Comparative analysis of EV with different charging preferences for case 1
To verify the different sensitivities of different EV users to charging costs and time costs, which lead to changes in the road network traffic flow, we now simulate the changes in the traffic flow under different charging strategies for two types of charging users. Two roads near the charging station in the commercial area are randomly selected for display. Assuming that all charging users are time-sensitive, the changes in the road traffic flow are shown in Figure 3A. Assuming that all charging users are price-sensitive, the changes in the road traffic flow are shown in Figure 3B. Comparing the difference in the traffic flow between the two charging strategies, it can be seen that compared to price-sensitive users, time-sensitive users have a significant reduction in their traffic flow curves. During the period from 17:00 to 20:00, there is a significant peak in the traffic flow. For time-sensitive charging users, they will choose to avoid this section of the road and choose charging stations that are far away but require less time for charging, resulting in a reduction in the traffic flow on that road.
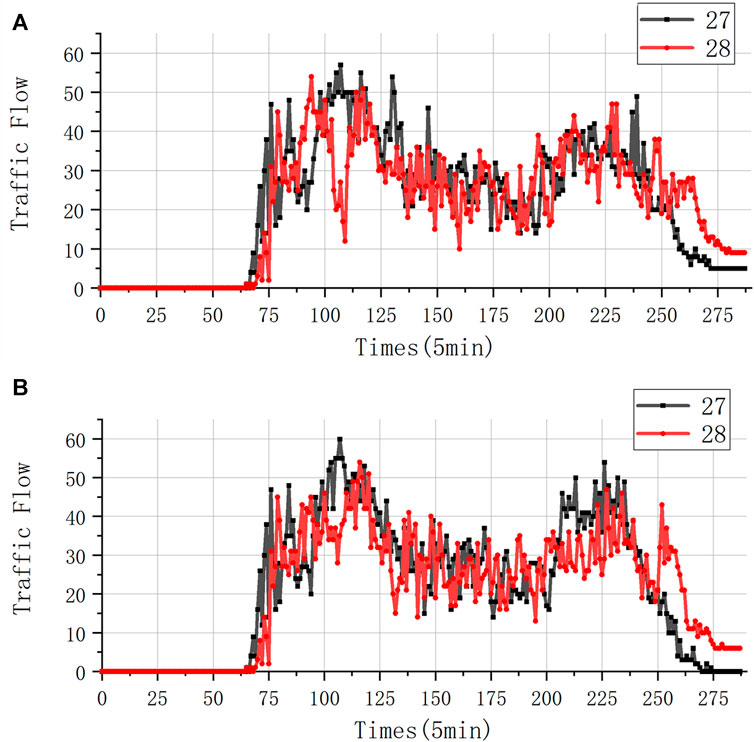
Figure 3. Traffic flow for different charging users. (A) Traffic flow for time-sensitive users. (B) Traffic flow for time price users.
5.3.1.2 Comparative analysis of the total distribution network load for case 1
The total loads of the proposed method with DLMP and uncontrolled charging are demonstrated in Figure 4. It can be seen that both tariff setting methods have limited effects on peak shaving and valley filling of the fast-charging load for EVs. The reason is that the distance between different fast-charging stations on the mini road network is small, and EVs with fast-charging needs do not have a huge difference in access time when choosing different fast-charging stations, so their overall time-adjustable margin is small.

Figure 4. Total distribution network load under different methods (case 1).
5.3.1.3 Comparative analysis of load and voltage distribution in the distribution network of case 1
The load distribution of each node of the DLMP algorithm and the method proposed in this paper is calculated as shown in Figure 5. It can be seen that, compared with the DLMP method, the method proposed in this paper can reduce the heavy-load problem at end node 8 to a certain extent and transfer the fast-charging load of EVs to node 6, which has a lower load, so as to achieve a certain degree of balancing the uneven spatial distribution of the load of the power grid.
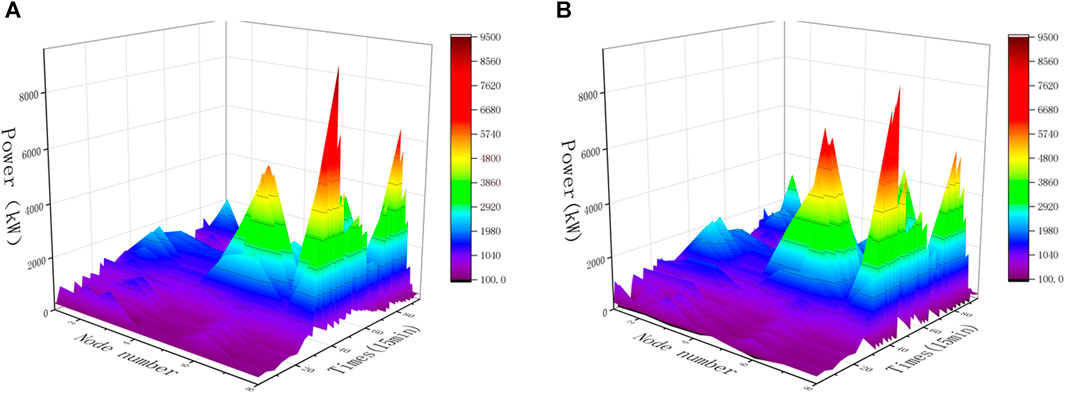
Figure 5. Load distribution in distribution networks under different pricing methods (case 1). (A) Load distribution in distribution networks under the DLMP. (B) Load distribution in distribution networks under the proposed method.
In terms of voltage, the voltage distribution at each node of the DLMP algorithm and the proposed method is shown in Figure 6. It can be seen that the proposed method is slightly better than the DLMP method in improving the voltage at the end node (node 8) and the overall voltage spatio-temporal average. However, due to the small topology of the distribution network in case 1, the overall solution space is limited, and there is no significant difference in the voltage distribution under the two methods, and the advantage of the proposed method is not reflected. In fact, this advantage will be exploited on a larger-scale network, which is also proven by the subsequent analyses in case 2.
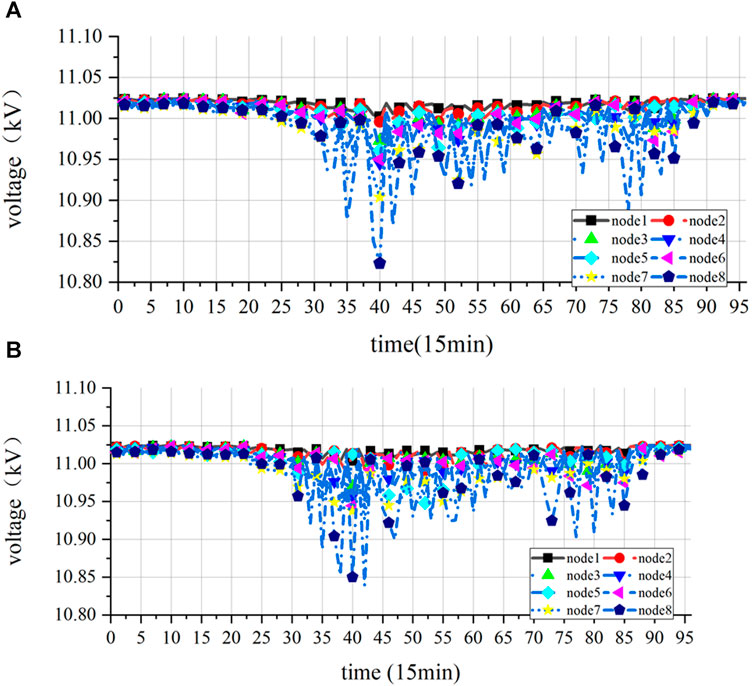
Figure 6. Distribution network voltage distribution under different pricing methods (case 1). (A) Distribution network voltage distribution under the DLMP. (B) Distribution network voltage distribution under the proposed method.
Furthermore, end nodes 6–8 of the network during the peak load hours 7:30–15:00 are selected to be analyzed to compare the voltage distribution of the proposed spatio-temporal tariff method with the DLMP, and the results are shown in Figure 7. It can be seen that although voltage security can be ensured under both methods, the proposed method enhances the voltage magnitude when the load is heaviest and is able to attenuate the voltage fluctuation over a short period of time. This shows the effectiveness of the proposed method in the spatial balancing of voltage in the station area.
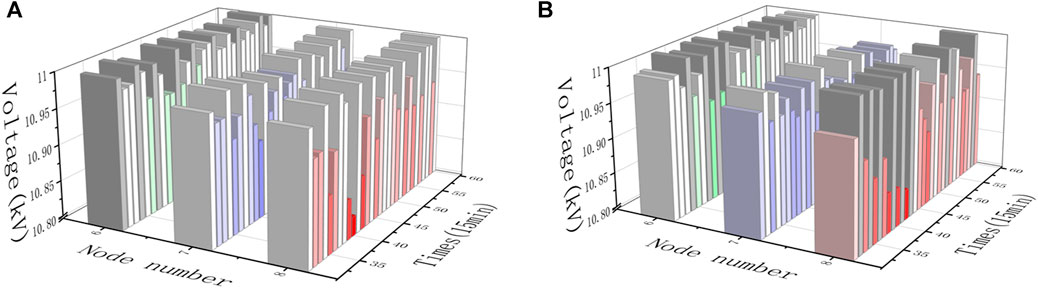
Figure 7. Voltage distribution at end nodes under different pricing methods (case 1, 7:30–15:00). (A) Voltage distribution at end nodes under the DLMP. (B) Voltage distribution at end nodes under the proposed methodology.
5.3.1.4 Comparative analysis of the spatio-temporal price in the distribution network for case 1
The finalized prices of cases 1 and 2 are displayed in the form of heat maps, as shown in Figures 8, 9. As shown in Figure 8, the proposed method can effectively achieve differential pricing in terms of spatio-temporal pricing. In terms of time, the pricing during the peak load period is generally higher than the tariff performance during the load valley period. In terms of space, there is a significant difference in the price of electricity at different fast-charging stations within the same time period. Combined with Figure 5 and its analysis results, it can be seen that the spatio-temporal pricing results of the proposed method have a significant positive correlation with the spatial loads, and the results obtained by the proposed method can effectively realize the guidance of EVs. Specifically, the load of fast-charging station 1 located at node 2 is generally lower, and its tariff results are significantly lower than those of fast-charging stations located at nodes 6 and 8. In addition, the tariff of node 5, where a new energy generator set is deployed, is significantly lower than that of the other nodes. This suggests that the proposed pricing methodology, in the medium-to-long-term application, can guide the siting of new fast-charging stations toward the nodes with new energy generating sets to a certain extent.
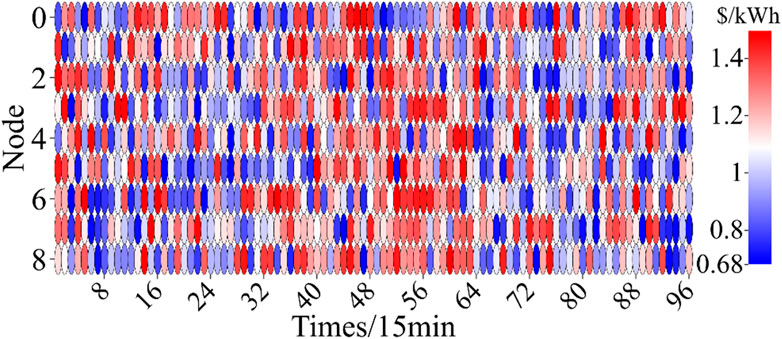
Figure 8. Spatio-temporal pricing results of the proposed method (case 1).

Figure 9. DLMP pricing results (case 1).
In contrast, the pricing of DLMP shown in Figure 9 relies on the time-of-day pricing setting for temporal flexibility, while the spatial aspect is largely ineffective. In fact, the DLMP algorithm is composed of a marginal power purchase cost and a network loss cost when there is no network congestion. Of these, the network loss cost is usually small. Therefore, in the absence of network congestion, there is usually no significant difference in the spatial pricing differences of the DLMP. On the other hand, in time, the DLMP relies on time-of-day tariff settings (the marginal cost of purchasing and selling electricity from the upper grid). Specifically, time-of-day pricing is usually set based on the trend of the unified load, which makes it difficult to provide good peak shaving and valley filling in local distribution network areas. As a result, the price obtained by the DLMP has a significant gap in spatial and temporal guidance compared to the proposed methodology and is difficult to be used to guide the work of balancing in the station area.
5.3.2 Analysis results in case 2
In order to verify the scalability and applicability of the proposed method in the actual system, a larger scale of the arithmetic example is selected for verification. In this case, the traffic road network is modeled according to the 66-node actual road network in a region of Xinjiang shown in Figure 10 and associated with the IEEE 33-node network, as shown in Figure 11. Among them, the whole system is set up with eight fast-charging stations, whose road network and power grid locations are detailed in Figure 11.

Figure 10. Map display of a region in Xinjiang.
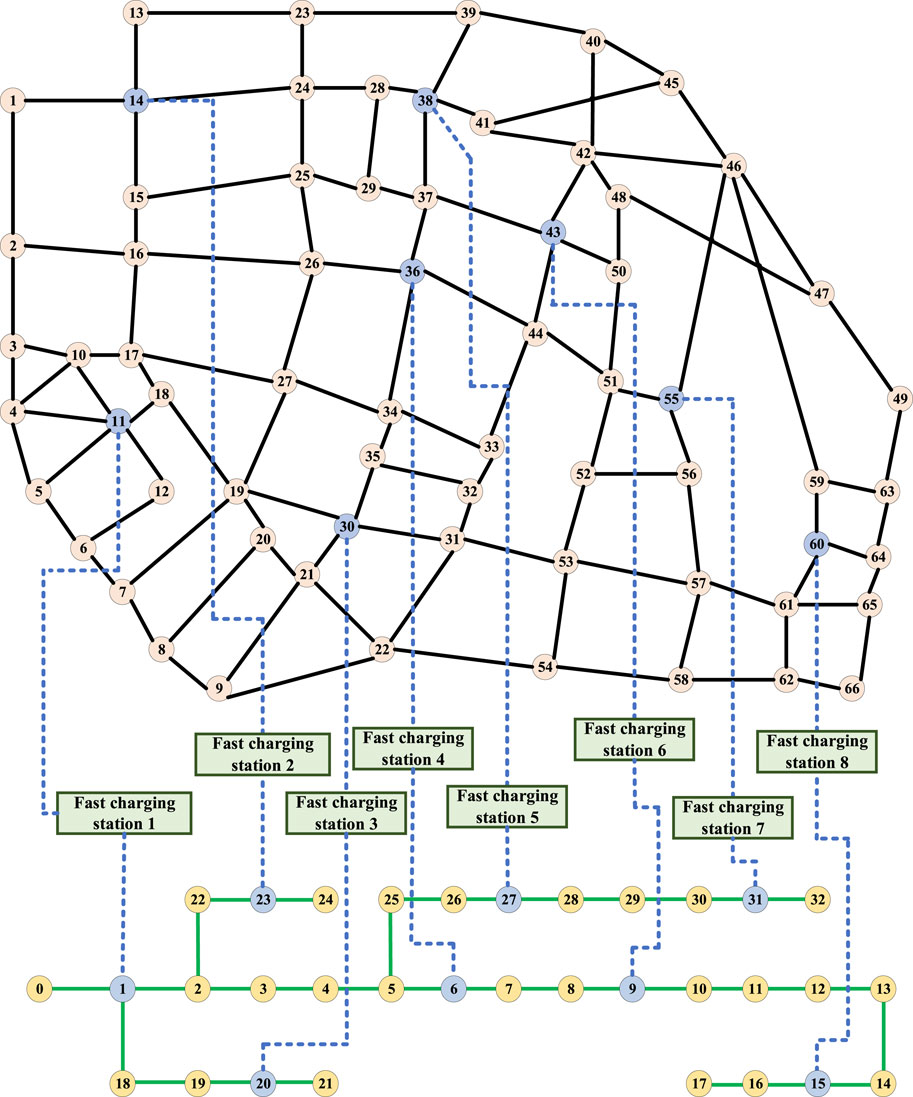
Figure 11. Test case 2: 33-node distribution network and 66-node road network.
5.3.2.1 Comparative analysis of the total distribution network load in case 2
The results of the total load of the distribution network under different pricing methods are shown in Figure 12. The results show that the proposed spatio-temporal tariff method is significantly better than the DLMP pricing method in smoothing out the peak-to-valley difference of the total load in a larger-scale system. The spatio-temporal tariff developed using the proposed methodology enables the steering of EV charging loads in terms of timing flexibility and effectively shifts the loads from peak distribution network loads to off-peak hours.
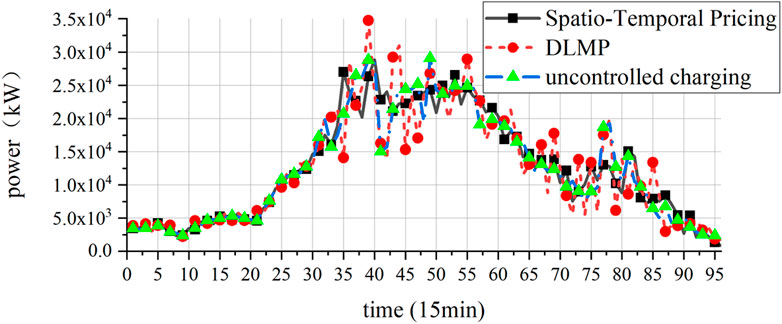
Figure 12. Total distribution network load under different methods (case 2).
5.3.2.2 Comparative analysis of load and voltage distribution in the distribution network in case 2
As shown in Figure 13, the load profile of each node of the distribution network is analyzed. It can be found that compared to the original DLMP algorithm, the proposed method cuts the three load spikes present in the most heavily loaded grid node into one and allocates the load to another charging station with a lighter load, while there is a time lag in this part of the shifted load due to the fact that the charging station chosen by the EV after responding to the spatio-temporal tariff will be farther away from the charging station than the charging station chosen in case of non-response. This again explains the source of the temporal flexibility of the fast-charging load.
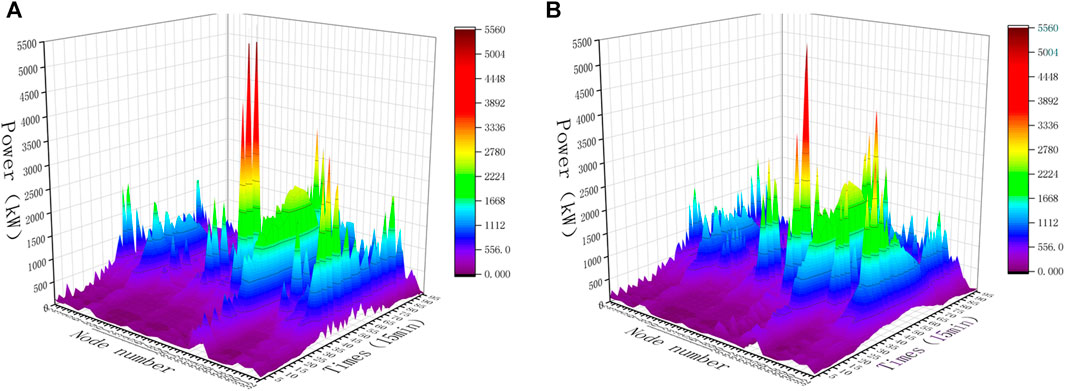
Figure 13. Load distribution in distribution networks under different pricing methods (case 2). (A) Load distribution in distribution networks under the DLMP. (B) Load distribution in distribution networks under the proposed method.
Furthermore, the nodal voltage distribution on the trunk lines (nodes 0–17) in the distribution network is calculated, and the results are shown in Figure 14. As in the case of experiment 1, the voltage drops and is more pronounced in experiment 2 during peak loads. Compared with the notable voltage drop at the end nodes (nodes 15–17) in the DLMP algorithm, the proposed method is still able to effectively reduce the degree of low voltage at peak load, which fully reflects the ability of the proposed method to guarantee the voltage support.
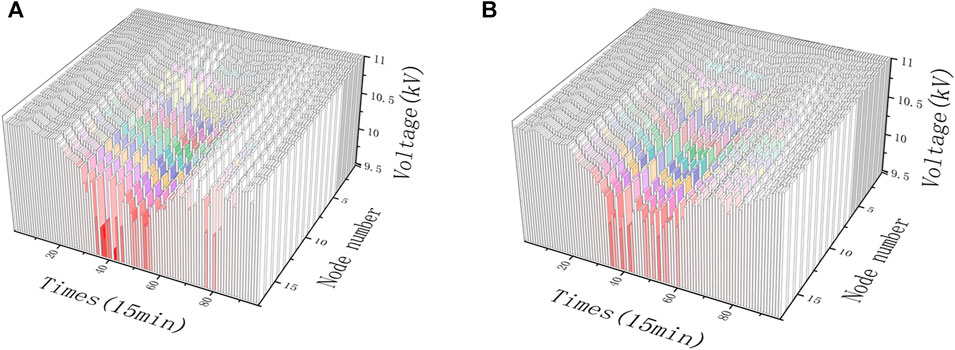
Figure 14. Trunk node voltage distribution under different pricing methods (case 2). (A) Trunk node voltage distribution under the DLMP. (B) Trunk node voltage distribution under the proposed methodology.
5.3.2.3 Comparative analysis of the road traffic flow of case 2
Figures 15A, B illustrates the traffic flow on selected roads, comparing the outcomes between the DLMP and the proposed method. Notably, these selected roads represent the highest traffic volumes in the Case 2. It can be seen that during the peak electricity consumption period, road 150 presents a peak, and road 150 happens to be the road leading to fast-charging station 3. The power grid node connected to fast-charging station 3 is node 20, and the branch node where node 20 is located has fewer branch nodes, resulting in lower energy supply demand. By guiding EVs to charge toward fast-charging station 3, the power supply pressure of other branches can be reduced, thereby increasing the voltage at the end nodes of other branches in order to achieve the goal of balancing the voltage in the substation area. Therefore, the spatio-temporal electricity pricing method proposed in this article can effectively balance the substation voltage of the power grid by guiding the selection of charging stations for EVs.
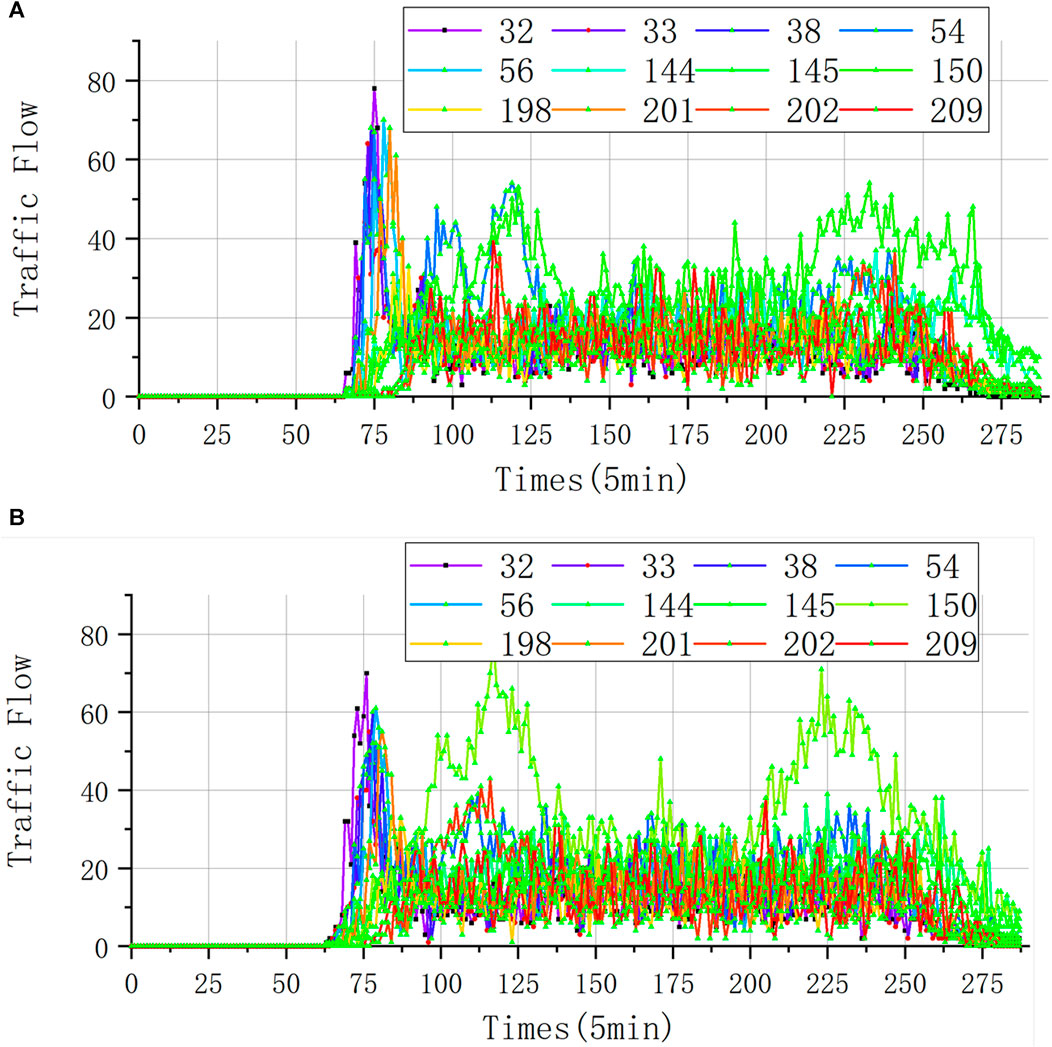
Figure 15. Traffic flow under different pricing methods (case 2). (A) Traffic flow under the DLMP. (B) Traffic flow under the proposed methodology.
5.3.3 Results of station balance analyses for cases 1 and 2
To further quantitatively compare the effectiveness of the proposed method and DLMP in terms of a station balancing degree, the node power and voltage variance under experiments 1 and 2 are calculated according to Eqs 27–28, as shown in Table 3. The results show that the proposed methods all achieve effective improvement in the balance degree, and the improvement effect is more notable on larger-scale arithmetic cases. In summary, the spatio-temporal pricing approach described in this paper well takes into account the spatial sensitivity of fast-charging loads, effectively optimizes the peak-to-valley difference of the grid by guiding the selection of EV charging stations, attenuates the problem of notable voltage reduction at the end grid nodes during the peak loads, and effectively brings into play the voltage-supporting capability of fast-charging EVs.
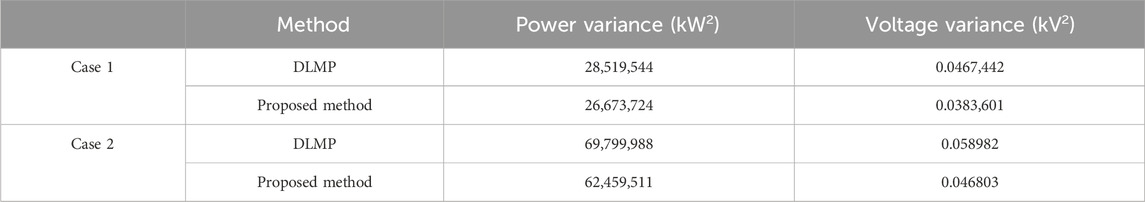
Table 3. Nodal voltage and power variance under the proposed method with the DLMP.
Furthermore, a comprehensive comparison of different algorithms, including SPEA2, NSGA-II (Deb et al., 2002), R-NSGA-II (Kalyanmoy and Sundar, 2006), U-NSGA-III (Seada and Deb, 2016), and AGE-MOEA (Panichella, 2019), is performed using case 1 as the target. Specifically, we chose as the optimal outcome the individual with the largest average value of each objective on the Pareto surface. As shown in Table 4, the SPEA2 outperforms the other algorithms and shows its superiority in our problem setting.
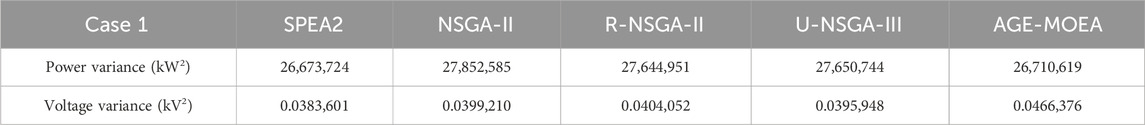
Table 4. Nodal voltage and power variance under the different methods in case 1.
It is crucial to highlight that, while SPEA2 exhibited better performance, the differences in the results’ order of magnitude among algorithms were not substantial. This underscores our work does not hinge on the intricacies of complex algorithms.
6 Conclusion
In this paper, a fast-charging pricing strategy considering load spatio-temporal equilibrium and elastic response is proposed, and the conclusions obtained are as follows:
(1) A spatio-temporal distribution model of EV fast-charging load considering the vehicle owner’s preference is designed. The EV travel law and speed modeling method and EV owner path selection preference model are constructed to form a mapping of the dynamic impact of electricity price on EV charging loads.
(2) A multi-objective spatio-temporal pricing model for fast-charging stations oriented toward station balancing is proposed. The two objectives of voltage balance and load balance are considered comprehensively, and the impact of price on the dynamics of EV charging loads is mapped in the form of constraints so that the obtained tariff results have a guiding effect on EV fast-charging loads.
(3) An enhanced Pareto evolutionary algorithm is used to solve the model efficiently, and the results show that the proposed method has stronger spatio-temporal guidance compared to the DLMP pricing method and is more effective when applied to large-scale systems.
However, it should be noted that the larger the system scale, the longer the simulation time of the spatio-temporal distribution model of the fast-charging load of EVs, and the cost of solving will increase. Therefore, how to simplify the fast-charging load distribution model and realize the fast calculation of large-scale applications in the future is an important extension of this research in the future. Indeed, we hold the conviction that adopting a data-driven approach serves as a crucial method to strike a balance between the accuracy and speed of traffic flow simulation. This represents one of our key priorities moving forward.
Data availability statement
The original contributions presented in the study are included in the article/Supplementary Material; further inquiries can be directed to the corresponding author.
Author contributions
LG: writing–original draft. MJ: writing–review and editing. BJ: writing–review and editing. LL: methodology and writing–review and editing. MG: writing–review and editing. HD: writing–review and editing. JZ: writing–review and editing. JW: writing–review and editing.
Funding
The authors declare that financial support was received for the research, authorship, and/or publication of this article. This work was supported by the Science and Technology Project of State Grid Xinjiang Power Co., Ltd., “Research on interactive correlation technology for electric vehicle network and power network” (5230HD220002).
Conflict of interest
Authors LG, MJ, BJ, LL, MG, HD, JZ, and JW were employed by Hetian Power Supply Branch of State Grid Xinjiang Power Co., Ltd.
The authors declare that this study received funding from State Grid Xinjiang Power Co., Ltd. The funder had the following involvement in the study: data collection and analysis.
Publisher’s note
All claims expressed in this article are solely those of the authors and do not necessarily represent those of their affiliated organizations, or those of the publisher, the editors, and the reviewers. Any product that may be evaluated in this article, or claim that may be made by its manufacturer, is not guaranteed or endorsed by the publisher.
References
Alizadeh, M., Wai, H. T., Chowdhury, M., Goldsmith, A., Scaglione, A., and Javidi, T. (2016). Optimal pricing to manage electric vehicles in coupled power and transportation networks. IEEE Trans. control Netw. Syst. 4 (4), 863–875. doi:10.1109/TCNS.2016.2590259
Cai, X., Yang, J., and Liao, K. (2022). Fast charging pricing strategy for electric vehicles considering space-time equilibrium and elastic response of load. Electr. Power Autom. Equip. 38 (1), 783–795. doi:10.16081/j.epae.202303038
Cao, F., Li, S., and Zhang, Y. (2021). Temporal and spatial distribution simulation of EV charging load considering charging station attractiveness. Power Syst. Technol. 45 (1), 75–85. doi:10.13335/j.1000-3673.pst.2020.0165
Chen, L., Zhang, Y., and Figueiredo, A. (2018). Charging load forecasting of electric vehicles based on multi-source information fusion and its influence on distribution network. Electr. Power Autom. Equip. 38 (12), 1–10. doi:10.16081/j.issn.1006-6047.2018.12.001
ChenPan, L. Z., and Yu, T. (2019). Real-time optimal dispatch for large-scale electric vehicles based on dynamic non-cooperative game theory. Automation Electr. Power Syst. 43 (24), 32–40. doi:10.7500/AEPS20181116007
Cui, Y., Hu, Z., and Duan, X. (2021). Optimal Pricing of public electric vehicle charging stations considering operations of coupled transportation and power systems. IEEE Trans. Smart Grid 12 (4), 3278–3288. doi:10.1109/TSG.2021.3053026
Deb, K., Pratap, A., Agarwal, S., and Meyarivan, T. (2002). A fast and elitist multiobjective genetic algorithm: nsga-II. IEEE Trans. Evol. Comput. 6 (2), 182–197. doi:10.1109/4235.996017
Dijkstra, E. W. (1959). A note on two problems in connexion with graphs. Numer. Math. 1 (1), 269–271. doi:10.1007/bf01386390
Farivar, M., and Low, S. H. (2013). Branch flow model: relaxations and convexification—Part I. IEEE Trans. Power Syst. 28 (3), 2554–2564. doi:10.1109/TPWRS.2013.2255317
Kalyanmoy, D., and Sundar, J. (December 2006). “Reference point based multi-objective optimization using evolutionary algorithms,” in Proceedings of the 8th annual conference on genetic and evolutionary computation (New York, NY, USA), 635–642. doi:10.1145/1143997.1144112
Kang, C., Xia, Q., and Zhang, B. (2004). Review of power system load forecasting and its development. Automation Electr. Power Syst. 28 (17), 1–11. doi:10.3321/j.issn:1000-1026.2004.17.001
Lei, Li, Zhao, X., and Li, X. (2020). Electric vehicle charging demand prediction model based on dynamic traffic information and its impacts on distribution networks. Power Syst. Clean Energy 36 (3), 107–118. doi:10.16081/j.issn.1006-6047.2018.12.001
Li, J., Zhang, L., and Qian, G. (2023). Load balancing method for flexible distribution network feeders under the integration of large-scale electric vehicles. Proc. CSU-EPSA 35 (09), 53–61. doi:10.19635/j.cnki.csu-epsa.001277
Li, R., Wu, Q., and ShmuelOren, S. (2013). Distribution locational marginal pricing for optimal electric vehicle charging management. IEEE Trans. Power Syst. 29 (1), 203–211. doi:10.1109/TPWRS.2013.2278952
Li, T., Wang, H., and Dong, L. (2022). Research on coordinated charging strategy considering load and cost of electric vehicles in a residential quarter. ZHEJIANG Electr. POWER 41 (05), 8–13. doi:10.19585/j.zjdl.202205002
Liu, X., Zhang, Q., and Cui, S. (2012). Review of electric vehicle V2G technology. Trans. China Electrotech. Soc. 27 (2), 121–127. doi:10.19595/j.cnki.1000-6753.tces.2012.02.018
Liu, Z., Wu, Q., Oren, S. S., Huang, S., Li, R., and Cheng, L. (2016). Distribution locational marginal pricing for optimal electric vehicle charging through chance constrained mixed-integer programming. IEEE Trans. Smart Grid 9 (2), 644–654. doi:10.1109/TSG.2016.2559579
Mei, Z., Zhan, H., and Yang, X., (2020). Optimal operating strategy of distribution network based on coordination of electric vehicle and distributed energy resource considering current protection. Electr. Power Autom. Equip. 40 (2), 89–102. doi:10.16081/j.epae.202001020
Pan, Z., Yu, T., and Wang, K. (2019). Decentralized coordinated dispatch for real-time optimization of massive electric vehicles considering various interests. Proc. CSEE 39 (12), 3528–3541. doi:10.1016/j.ijepes.2017.11.036
Panichella, A. (December 2019). “An adaptive evolutionary algorithm based on non-euclidean geometry for many-objective optimization,” in proceedings of the genetic and evolutionary computation conference (New York, NY, USA), 595–603. doi:10.1145/3321707.3321839
Seada, H., and Deb, K. (2016). A unified evolutionary optimization procedure for single, multiple, and many objectives. IEEE Trans. Evol. Comput. 20 (3), 358–369. doi:10.1109/TEVC.2015.2459718
Shao, Y., Mu, Y., and Yu, X. (2017). A spatial-temporal charging load forecast and impact analysis method for distribution network using EVs-traffic-distribution model. Proc. CSEE 37 (18), 5207–5219. doi:10.13334/j.0258-8013.pcsee.161470
CGPRC (2023). The number of electric vehicles in China has reached 13.1 million, showing a rapid growth trend. https://www.gov.cn/xinwen/2023-01/11/content_5736281.htm.
Wang, J., Huang, K., and Xiao, X. U. (2023a). Ordered charging of electric vehicles based on ladder-type carbon price and adaptive time-of-use electricity price. Automation Electr. Power Syst. 15, 1–12. doi:10.16081/j.epae.202304012
Wang, Yi, Chen, Q., Hong, T., and Kang, C. (2019). Review of smart meter data analytics: applications, methodologies, and challenges. IEEE Trans. Smart Grid 10 (3), 3125–3148. doi:10.1109/TSG.2018.2818167
Wang, Y., Wang, X., and Huang, J. (2023b). Congestion management model for competitive charging of electric vehicles under dynamic electricity price mechanism. Automation Electr. Power Syst. 47 (12), 103–110. doi:10.7500/AEPS20220507006
Wei, W. E. I., Wu, L., Wang, J., and Mei, S. (2018). Network equilibrium of coupled transportation and power distribution systems. IEEE Trans. Smart Grid 9, 6764–6779. doi:10.1109/tsg.2017.2723016
Xie, S., Hu, Z., and Wang, J. (2021). Dynamic flow equilibrium of urban power and transportation networks considering the coupling in time and space. Proc. CSEE 41 (24), 8408–8424. doi:10.16157/j.issn.0258-7998.234280
Xie, S., Wu, Q., Hatziargyriou, N., Zhang, M., Zhang, Y., and Xu, Y. (2022). Collaborative pricing in a power-transportation coupled network: a variational inequality approach. IEEE Trans. Power Syst. 38 (1), 783–795. doi:10.1109/TPWRS.2022.3162861
Yao, L., Liu, X., and Wu, Li (2007). Mid-&long-term load forecast based on GRNN. Electr. Power Autom. Equip. 27 (8), 26–29. doi:10.3969/j.issn.1006-6047.2007.08.006
Keywords: electric vehicles, spatio-temporal pricing, load balancing, multi-objective optimization, improved Strength Pareto Evolutionary Algorithm
Citation: Guo L, Jin M, Jing B, Lv L, Guo M, Ding H, Zhang J and Wang J (2024) A multi-objective spatio-temporal pricing method for fast-charging stations oriented to transformer load balancing. Front. Energy Res. 12:1362343. doi: 10.3389/fenrg.2024.1362343
Received: 28 December 2023; Accepted: 31 January 2024;
Published: 03 April 2024.
Edited by:
Kaiping Qu, China University of Mining and Technology, ChinaReviewed by:
Qiang Xing, Nanjing University of Posts and Telecommunications, ChinaZhenning Pan, South China University of Technology, China
Copyright © 2024 Guo, Jin, Jing, Lv, Guo, Ding, Zhang and Wang. This is an open-access article distributed under the terms of the Creative Commons Attribution License (CC BY). The use, distribution or reproduction in other forums is permitted, provided the original author(s) and the copyright owner(s) are credited and that the original publication in this journal is cited, in accordance with accepted academic practice. No use, distribution or reproduction is permitted which does not comply with these terms.
*Correspondence: LeiLei Lv, MzY0MzI1NDI0NEBxcS5jb20=