 Marvin Henrich
- Department of Biology, Bioscience Education and Zoo Biology, Goethe University, Frankfurt, Germany
The success of the increasing use of technology in education is highly dependent on learner acceptance. Although the Technology Acceptance Model (TAM) is dominant in research for surveying acceptance of technology, it does not allow the prediction of a successful first time use of technology. The successful first time use can be determined with the survey of technology affinity, as it corresponds to the expression of certain personality traits of users and is thus detached from the specific technology. Since there are no measurement instruments for the educational sector so far and existing instruments for measuring technology affinity do not meet the specific requirements for use in the educational context (e.g., limited time for questioning), we present the single item Inclusion of Technology Affinity in Self-Scale (ITAS). In study 1 we provide evidence of convergent and discriminant validity within the general population so that a generalization of its applicability is possible. In study 2 we subsequently tested ITAS in the actual target group, the educational sector. The high correlations of the ITAS with the ATI and the control instrument TA-EG (ranging from rs = 0.679 to rs = 0.440) show that ITAS is suitable for use in research. Furthermore, the newly developed instrument convinces with its low complexity, the graphical component, which requires little text understanding and the high time saving. This research thus can contribute to the investigation of technology affinity in the educational sector helping educators to conduct technical activities with their learning group, to predict possible difficulties and adjust their planning accordingly.
Introduction
Technology in its various forms is an omnipresent component of modern societies. In turn, these societies are not only significantly shaped by existing and functioning technologies, but also, with regard to their future development, decisively influenced by emerging technologies (Deguchi et al., 2020). The education sector is also increasingly integrating new technologies into the classroom and increasing interaction between learners and technology. Among educational technologies, video streaming services as well as productivity and presentation tools are the most commonly used (Vega and Robb, 2019). In addition to technology teaching, science classes are particularly suitable for the use of various technologies (Dani and Koenig, 2008; Lewis, 2014; Kramer et al., 2019). One example of the complementary use of technologies to conventional methods in science classes is virtual microscopy (Greßler, 2019). Another example is the computer-based approach of neurosimulations without which teaching neurobiology (e.g., electrophysiology) would be difficult due to limited resources in the educational sector (Chinn and Malhotra, 2002; Hofstein and Lunetta, 2004; Lewis, 2014). However, learners will not benefit from the many technologies available and their advantages if they do not choose to actually use them (Estriégana et al., 2019). Accordingly, the successful implementation of specific technologies in the education sector is highly dependent on the learners’ acceptance and the factors influencing their acceptance (Ritter, 2017; Granić and Marangunić, 2019). For example, in the case of neurosimulations, Formella-Zimmermann et al. (2022). showed a positive perception by learners and Diwakar et al. (2014) even demonstrated that learners rated the technologically supported learning environment as a relative advantage over traditional instruction.
Technology acceptance
In order to survey acceptance toward technology, the “Technology Acceptance Model” (TAM) dominates in research (Taherdoost, 2018). Originally developed by Davis (1985), Perceived Usefullness (PU) and Perceived Ease of Use (PEOU) form the two central components for predicting whether technology will be intentionally used or rejected. The TAM then assumes that an individual’s behavioral intention determines the actual use of a technology. On these central components, the influence of a variety of potential factors was investigated (Abdullah and Ward, 2016). The findings of Granić and Marangunić (2019) show that the TAM is also the most widely used model in the education sector, e.g., in the area of e-learning (Šumak et al., 2011). According to King and He (2006), the dominance of the TAM can be explained by its comprehensibility, simplicity, and the high reliability of its influence variables. However, in most studies in the education sector, the samples are composed of university students. Especially in school education (high school students), the TAM is used rather rarely (Granić and Marangunić, 2019). One possible explanation is the fact that the TAM requires the one-time use of a particular technology and then predicts the intention to actually use that technology again. However, specific technologies, such as neurosimulations, are often used only once by learners, because by then new topics in the curriculum are already being addressed. Consequently, the measure of success of the subsequent uses is possible, while the first use of a technology cannot be predicted with the TAM. One could argue that the achieved acceptance for a specific technology in one learning group is transferable to another learning group. However, this is contradicted by the high heterogeneity in education and the individuality of each learner (Nelson et al., 2011; Markic and Abels, 2014; Vock and Gronostai, 2017). In order to predict the success of the first-time implementation of a technology a different approach is required.
Technology affinity
While technology acceptance reflects an attitude toward a specific technology and is thus situational as well as object-related, the so called “technology affinity” corresponds to the manifestation of certain personality traits of users. Franke et al. (2019) define technology affinity as the way people approach technology and cite that it manifests itself in whether people actively seek interaction with technology (high affinity for technology) or tend to avoid it (low affinity for technology). Likewise, Jin and Divitini (2020) argue that people who exhibit higher levels of technology affinity tend to embrace technology and are positive about interacting with technology. Whereas Franke et al. (2019) and Jin and Divitini (2020) focus on the type of interaction, Güdel et al. (2020) define technology affinity as a person’s relationship with technology, which is influenced by general attitudes toward technologies, among other factors. Edison and Geissler (2003) also establish a link between technology affinity and attitudes toward general technology, finding that technology affinity translates into positive attitudes toward general technology. This relationship between technology affinity and attitudes toward technology is also established by Karrer et al. (2009), who additionally find that technology affinity has a positive influence on the knowledge about and experience with technology. It is also particularly important that technology affinity has a positive effect on the intention to use a technology (Wong et al., 2020). Technology affinity and technology acceptance are thus two closely related constructs, both linked by the intention to use a technology (Hesse et al., 2020; Wong et al., 2020; Yang et al., 2021). The described relationships are shown in Figure 1. However, characterizing technology affinity as a distinct personality trait that influences users’ interaction style with technology allows for a conclusion that is detached from the specific technology used. This makes it possible to address the issue of the TAM, as it allows to predict the potential success of a technology implementation before it is used for the first time.
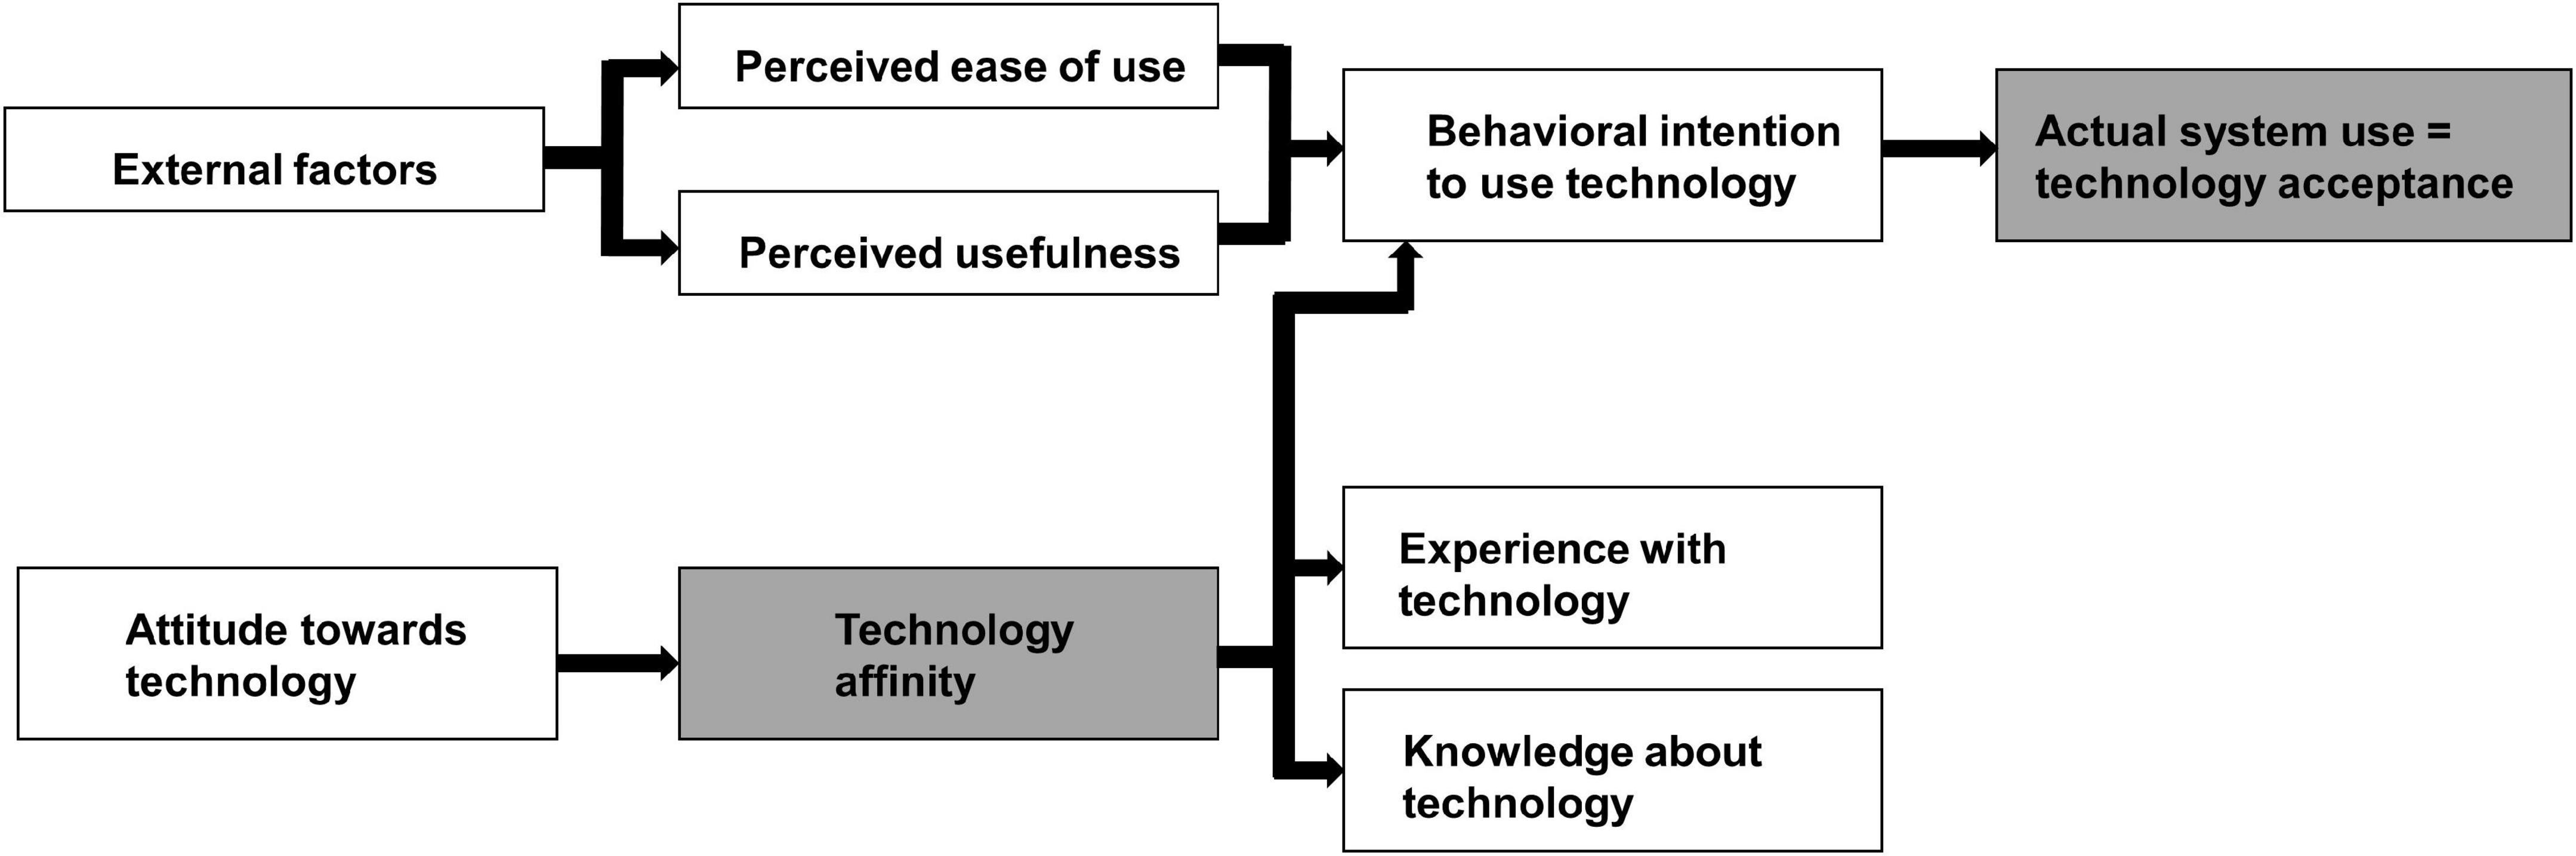
Figure 1. Relationships between technology affinity and technology acceptance.
The relevance of students’ successful use of technology cannot be underestimated, as they will be the ones entering a world of work that is technologized to a special degree (Bughin et al., 2019; Cam et al., 2020). In this context, fostering a high affinity must be one of the goals of technology education, as students who have a positive attitude toward technology are more likely to pursue careers in the field (Maltese and Tai, 2011). In this regard, students generally do not show difficulty in transitioning to a more technological mode of instruction (Kamarianos et al., 2020). Furthermore, a significant correlation was found between technology affinity and willingness to learn about technology, whereby students with high affinity for technology showed a higher willingness to learn than students with low affinity for technology (Jin and Divitini, 2020). It is also particularly interesting to note that learners with a high affinity for technology perform significantly worse in traditional forms of instruction such as a lecture than in technology-enhanced instruction (Backhaus et al., 2019). At the same time, Friedl et al. (2006) and Backhaus et al. (2019) showed that learners who are not categorized as technology-affine would not suffer any disadvantages in more technology-enhanced instruction. Ideally, instruction would be differentiated based on the learners’ respective affinity for technology, with the accompanying opportunity for choice.
The survey of technology affinity
In order to survey technology affinity, various scales have been developed in recent years (e.g., Karrer et al., 2009; Fleming and Artis, 2010; Schmettow and Drees, 2014; Franke et al., 2019). However, not all these scales meet the specific requirements for the use in educational context, which include, above all, limited time (for questioning in class) and high heterogeneity (within learning groups or across age levels). Moreover, Fleming and Artis’ 2010 scale, for example, refers to a third-party assessment of technology affinity rather than a required self-assessment. As mentioned above, the efficient use of time and thus the number of items in the measurement instrument is essential and, for instance, a reason for not using the 19-item TA-EG by Karrer et al. (2009) in an educational context. The 15-item GEX by Schmettow and Drees (2014) is not suitable either, as it refers to rather intense forms of technology affinity (e.g., computer enthusiasm) and thus does not do justice to the heterogeneity of classes. The Affinity for Technology Interaction scale (ATI) by Franke et al. (2019) with its nine items offers better conditions with regard to the factors time and heterogeneity and seems to be the best option of the available scales when planning to survey technology affinity in an educational context. Nevertheless, the authors of the ATI state that the length of the scale, although reduced to nine items, can be the limiting factor for use in combination with other scales in larger surveys (Franke et al., 2019). In addition, the nine items presuppose a certain competence regarding text comprehension, which makes the application of the ATI-scale difficult, especially to students of younger age groups. The text comprehension of learners can also be influenced by other native languages or a migration background (Marx et al., 2015). Moreover, verbal scales may be perplexing for people in general who are unfamiliar with the alphabetical system due to different reasons (Jackson et al., 2006; Holmqvist Olander et al., 2017; Vonk et al., 2017). While a shortened version of the ATI, the ATI-S, has begun to address the problem of the length of the scale (Wessel et al., 2019), there is not yet a version of the scale for participants with a lower level of text comprehension.
Pictorial scales
Graphical representations can simplify the content of texts by helping respondents to make a visual connection to the presented information, and thus contribute to better comprehension (Tietjens et al., 2018; Weigelt et al., 2022). In the context of scientific research, pictorial scales are suitable as a graphical form of implementation. They are already used in other contexts, such as to assess pain (Jackson et al., 2006), anxiety (Shetty et al., 2015), connectedness to nature (Kleespies et al., 2021), physical self-concept (Tietjens et al., 2018), energetic activation (Weigelt et al., 2022) and STEM (Science, Technology, Engineering, and Mathematics) identity (McDonald et al., 2019). Crovari et al. (2020) state that in their study participants were found to prefer pictorial items over typical verbal items. In addition to better comprehension, this can be explained as the use of pictorial scales drastically reduces the demands on cognitive processes (e.g., minimal visual and cognitive workload) and thus additionally allows to a quick completion of the scale (Weigelt et al., 2022). Furthermore, Stark and Krosnick (2017) state that the use of pictorial scales leads to increased respondents’ enjoyment of the questionnaire. Therefore, in this study, a very short and low text-heavy instrument supported by a graphical illustration is developed, tested, and compared to already established instruments for surveying technology affinity. The aim of this study is not to replace the ATI, but rather to usefully supplement it with a graphical form of survey, which can be used as a time-saving tool for scientific research, especially in educational contexts.
In study 1, the new measurement instrument Inclusion of Technology Affinity in Self scale (ITAS) will be tested specifically on a, in terms of age and gender, heterogeneous group of individuals so that a generalization of its applicability is possible (Karrer et al., 2009). If the new instrument shows high construct validity, the instrument can subsequently be tested in the actual target group, the educational sector (study 2).
Study 1
In study 1, the newly developed ITAS measurement instrument is tested on individuals largely representing the general population and examined regarding its correlation to already established instruments for measuring technology affinity. The aim of this study is to supplement the already existing instruments with a pictorial form of survey. The type of graphical illustration used in the ITAS follows the example of already existing and often cited studies in other research areas (Aron et al., 1992; Schultz, 2002; McDonald et al., 2019; Kleespies et al., 2021).
Materials and methods
To test whether the ITAS measures technology affinity in an analogous way to already established instruments, a heterogeneous population (sample 1) was questioned with the ITAS and the ATI. In addition, as a control instrument, participants were also surveyed using the TA-EG, as the ATI has been shown to correlate positively with it (Franke et al., 2019). Regarding the discriminant validity, the Inclusion of Nature in Self scale (INS) by Schultz (2002) was used. Following data collection, the reliability of ITAS was estimated. Subsequent, the correlation coefficient was used to determine how close the connection is between the newly developed ITAS and the existing instruments. In addition, we explored our data using Principal axis factoring (PAF) and also examined whether all answer options were used in the sample, to make sure that heterogeneous cohorts were covered.
Participants
The data collection took place in January 2022 over a period of four weeks and was conducted by means of an online survey. The questionnaires were sent via a Germany-wide email distribution list to people interested in research, who could participate in the survey on a voluntary basis and without compensation. Both, the emails and the questionnaire were distributed in German. It was ensured that the participants were over 25 years of age at the time of the survey and were not currently studying, in order to clearly differentiate the sample from study 2. Thus, at the time of the study, all respondents were of legal age. Sample 1 included a total of 524 respondents. While the genders are almost evenly distributed and the achieved percentage of women only slightly outweighs men, the proportion of 35–64-year-olds in the sample clearly predominates, as can be seen from Table 1.

Table 1. Gender and age distribution of sample 1.
Instruments
Affinity for technology interaction scale
The 9-item ATI-scale (Franke et al., 2019) was developed as an economic, unidimensional alternative to existing instruments for surveying technology affinity. The scale has been officially translated into three languages and its reliability and validity have already been confirmed (Franke et al., 2019; Lezhnina and Kismihók, 2020; Heilala et al., 2022). Further unofficial translations can be found on the website of the authors of the ATI (University of Lübeck, 2022). In addition to the ATI-scale, there is also a shortened version of it (ATI-S), which consists of only four items (Wessel et al., 2019). For this study, however, the 9-item scale was used, as recommended by the authors since four items do not cover the affinity construct in such a differentiated way as nine items do. Participants are asked to answer the German version of the ATI on a Likert scale of 1 (completely disagree) to 5 (completely agree). The term “technical systems” consequently used in the items is defined in the introductory part of the questionnaire as “apps and other software applications as well as complete digital devices (e.g., cell phones, computers, televisions, car navigation)” following the example of Franke et al. (2019).
TA-EG
The TA-EG by Karrer et al. (2009) includes 19 items covering four subscales (TA-EGA = enthusiasm for technology, TA-EGB = competence in dealing with technology, TA-EGC = positive consequences of technology, TA-EGD = negative consequences of technology) that participants are asked to answer on a Likert scale of 1 (completely disagree) to 5 (completely agree). It was designed to measure technology affinity as a personality trait expressed in a positive attitude toward technology. In order to be able to make a comparison with the instrument in its entirety and to avoid considering only a subscale of the TA-EG in the questionnaire, all four subscales (19 items) were included in the survey. However, in order to match and increase comparability with (Franke et al., 2019), the focus of the data analysis was on subscale TA-EGA. The authors of the ATI use only the subscale TA-EGA to prove their correlations and justify this by stating that it is most strongly related to technology affinity. In the original TA-EG scale, technology affinity was assessed specifically toward electronic devices. For the analysis of the present study and the desired comparability with the other test instruments, this term was replaced with “technical systems.”
Inclusion of technology affinity in self scale
The INS is a one-dimensional, graphical survey tool by Schultz (2002), whose type of illustration can be traced back to an earlier study by Aron et al. (1992). In the original study, the authors examined the aspect of closeness between “other” and “self.” The author of the INS adapted the scale and designed it to measure the cognitive component of nature connectedness by also using seven pairs of circles that overlap each other to varying degrees. The INS was included in the questionnaire in order to show discriminant validity of it with ITAS in the analysis of the data.
Inclusion of technology affinity in self scale
The newly developed instrument is based on the graphical implementation of the INS. Schultz (2002) justifies the survey of one’s closeness to nature by the fact that all humans are part of nature and have been from birth. At the same time, he establishes the concept of technology as something that separates humans from nature. Accordingly, technology is described as something that competes with nature, as something “[that] can fill the role of nature” (Schultz, 2002, p. 73). In 2022, 20 years after Schultz’s article was published, additional consideration must be given to the time spent in virtual environments (video games, social media) and how people become part of these environments by uploading images and information. Therefore, we consider the approach of a survey of one’s closeness to technology expressed through differently overlapping pairs of circles as legitimate. Consequently, the degree of self-perceived overlap with technology rather than nature is represented. However, for better comparability with other test instruments, we use the term “technical systems” rather than technology. In this manner, ITAS can be used to determine the relationship to the other instruments used to survey technology affinity. ITAS consists of seven pairs of circles and ranges from two separate circles to two completely merging circles (Figure 2). Participants must choose the pair of circles that best describes their affinity for technical systems.
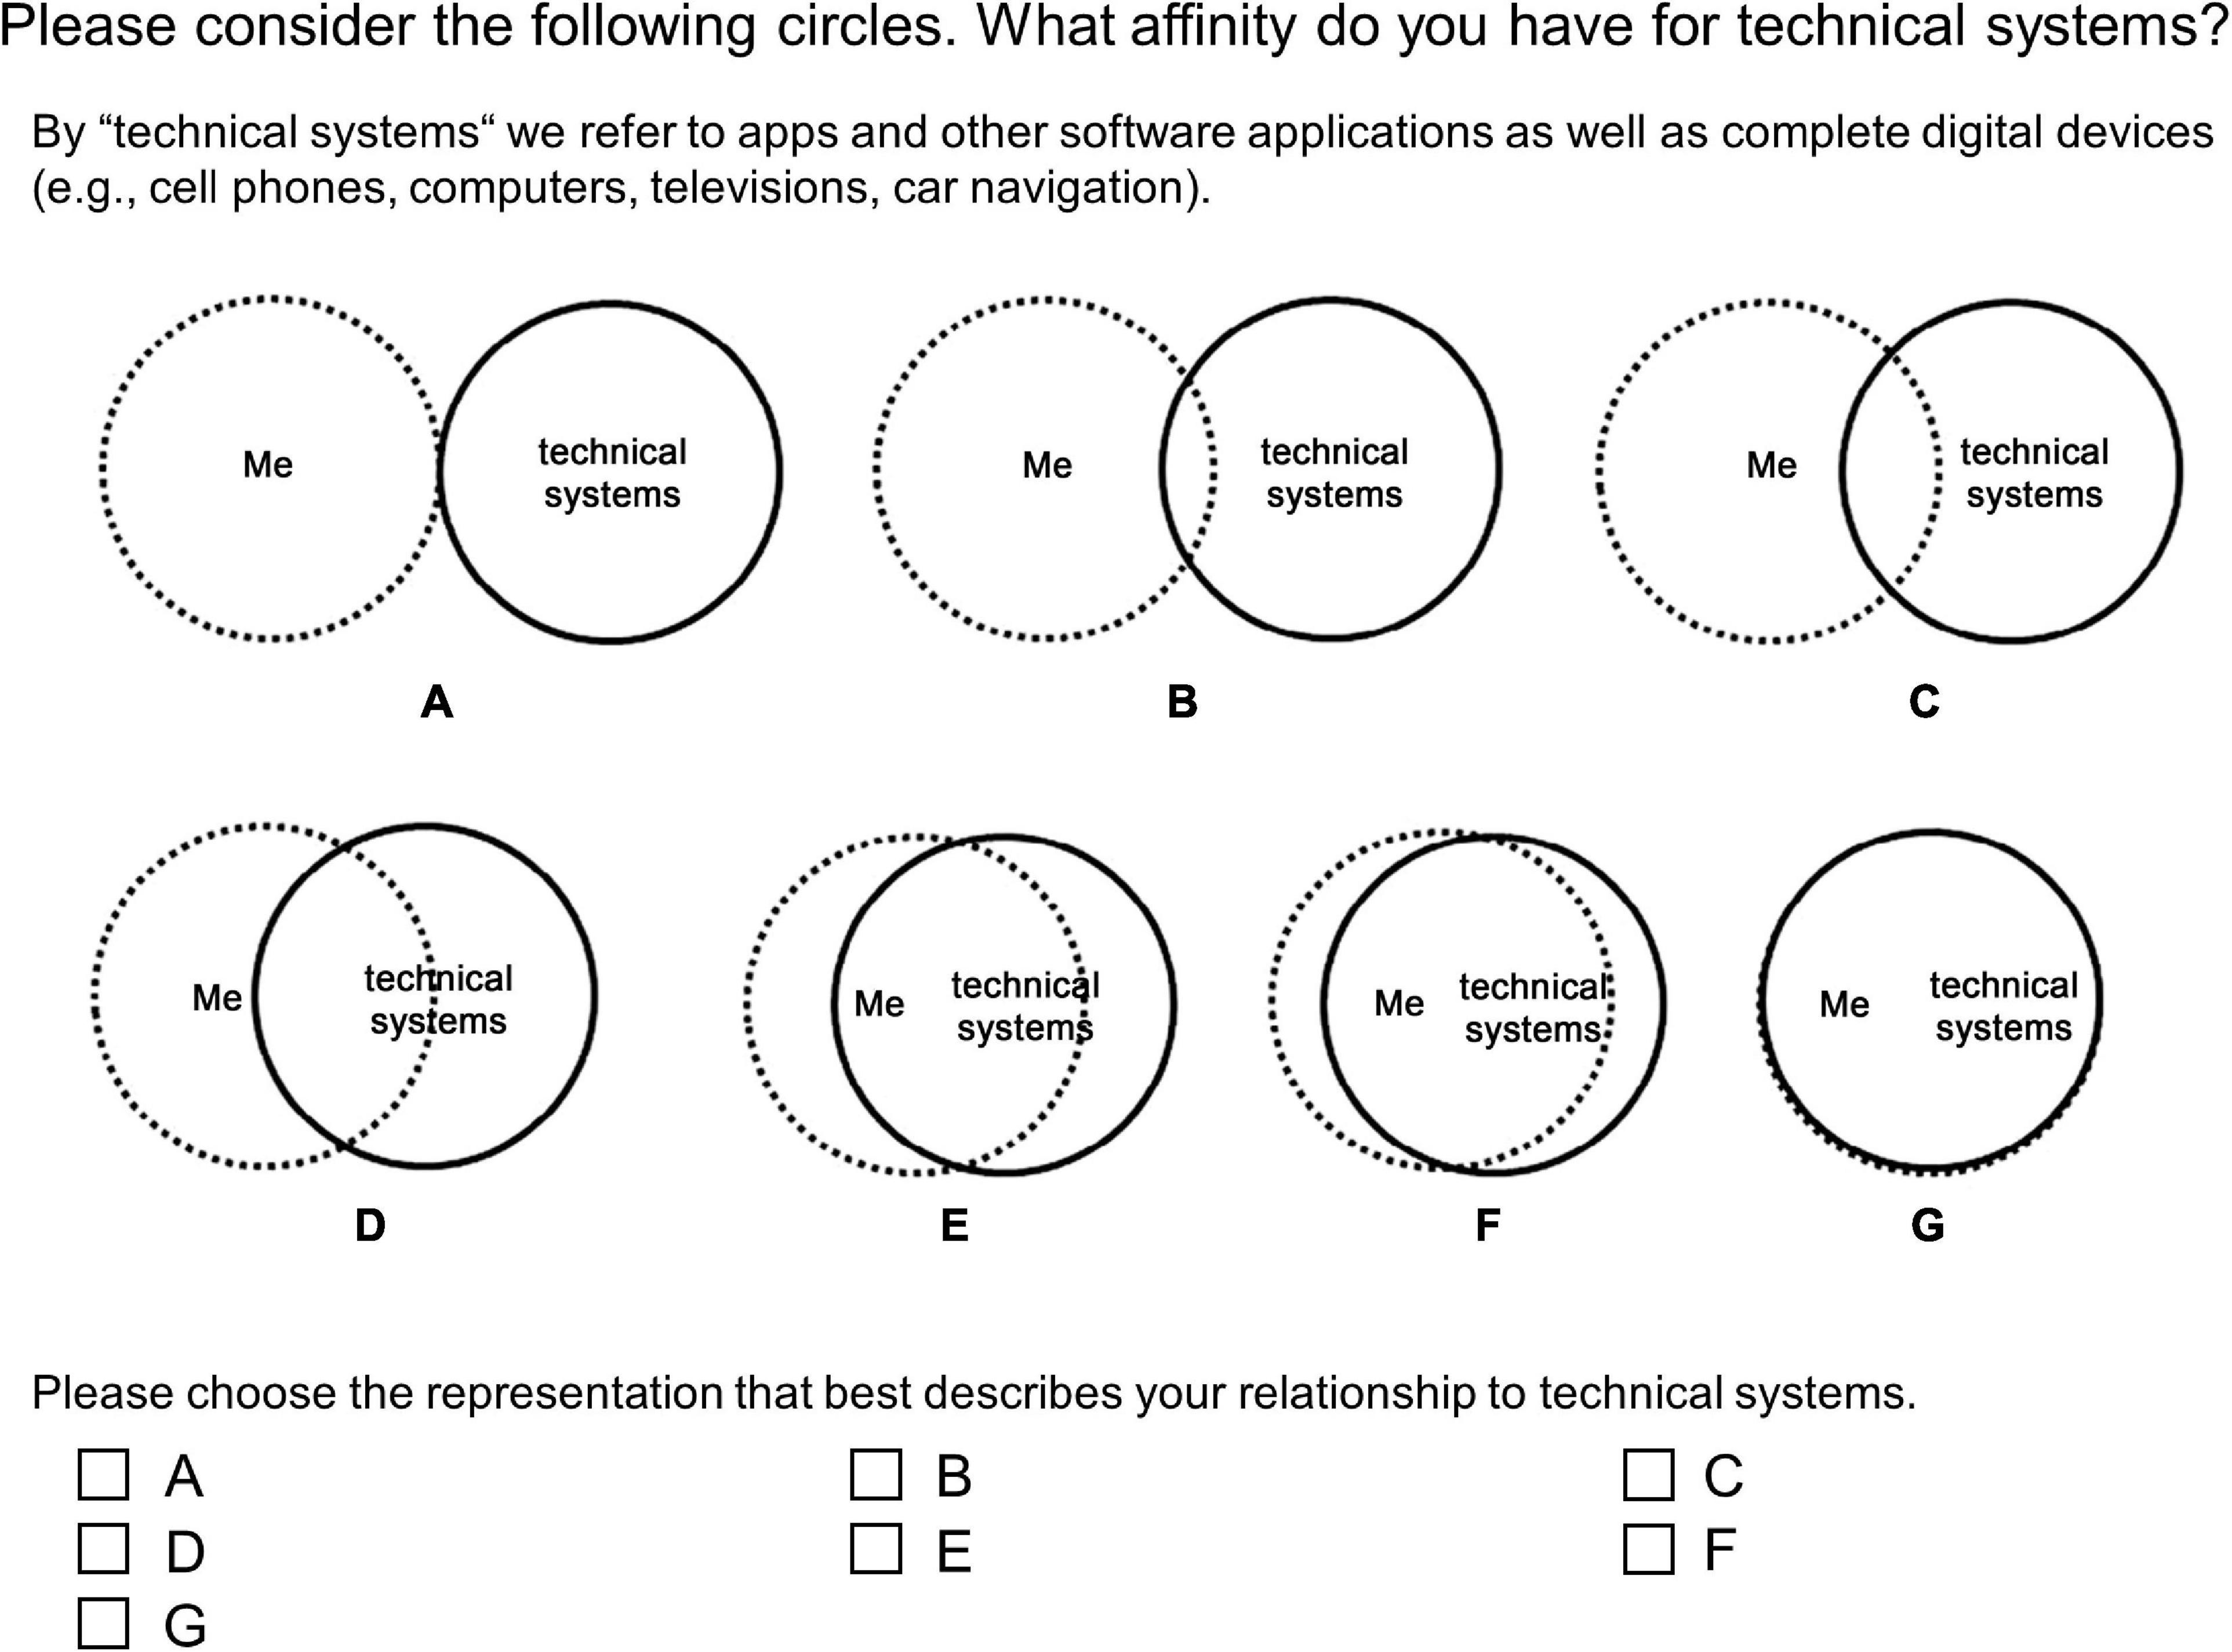
Figure 2. The newly developed instrument for measuring technology affinity: Inclusion of Technology Affinity in Self scale (ITAS).
In addition, the questionnaire included an open question about artificial intelligence. It asks: “What do you associate with the term artificial intelligence? Give three examples.” However, the answers were irrelevant to the content of this study and will therefore not be discussed further.
Analysis
For the statistical analysis of the collected data, IBM SPSS 28 was used. As a first step, a PAF of the nine ATI items using varimax rotation was conducted to explore the single-factor structure of the ATI-data in our specific sample. To verify whether the items used are applicable for factor analysis, the Bartlett test and the Kaiser-Meyer-Olkin (KMO) test were previously performed. Additionally, Cronbach’s alpha was calculated to evaluate the reliability of the ATI and interpreted according to Cripps, 2017, p. 109: unacceptable (0.5 > α), acceptable (0.8 > α ≥ 0.7), excellent (α ≥ 0.9). Because of its single-item-structure, the reliability of ITAS was estimated using a method first introduced by Wanous et al. (1997). By altering the formula of correction for attenuation it is possible to estimate the reliability of a variable(ryy) if an assumed true underlying correlation (rx’y’) and an observed correlation (rxy) are given. Furthermore, one needs to know the reliability values for another variable measuring the same construct (rxx). The corresponding formula for correction for attenuation equals: rx′y′=rxy√rxx×ryy.
In this study, we have adopted the approach performed by the authors, where rx’y’ is assumed to be 0.9.
Normal distribution was tested using the Kolmogorov-Smirnov test and the Shapiro-Wilk test. As both showed a significant result for all data (p < 0.05), a normal distribution cannot be assumed. Therefore, Spearman’s rank correlation was used to determine the correlation between ITAS and the three other instruments included in the questionnaire (TA-EG; ATI; INS). All correlation values were interpreted according to Cohen (1992): small (0.1), medium (0.3), large (0.5). Missing data were deleted listwise in case of PAF and pairwise in case of correlations. For the consideration of the total scale of the multidimensional TA-EG, the mean value of the individual subscales was calculated first, and from this the mean value for the overall construct. Since one of the subscales has a lower number of items, this is to avoid that this component is underweighted and the total value of the construct is represented correctly.
Results
For the nine ATI items, the Bartlett test was highly significant (p < 0.001) and the KMO test approved the sampling adequacy (KMO = 0.924), therefore meeting the requirements for factor analysis (Dziuban and Shirkey, 1974). All items showed high loading (>0.5) on a single factor, which explained 58% of the variance (Table 2). Due to the one-factor structure, the solution could not be rotated. The Cronbach alpha value was 0.921 and thus in a very good range. We used the observed value for Cronbach alpha from our study as well as the nine values from Franke et al. (2019) to calculate a mean value of reliability for the ATI variable (rxx = 0.895). The value for rxy corresponds to the observed correlation between ITAS and the ATI (rxy = 0.679). This leads to the following equation for the reliability of ITAS (ryy):
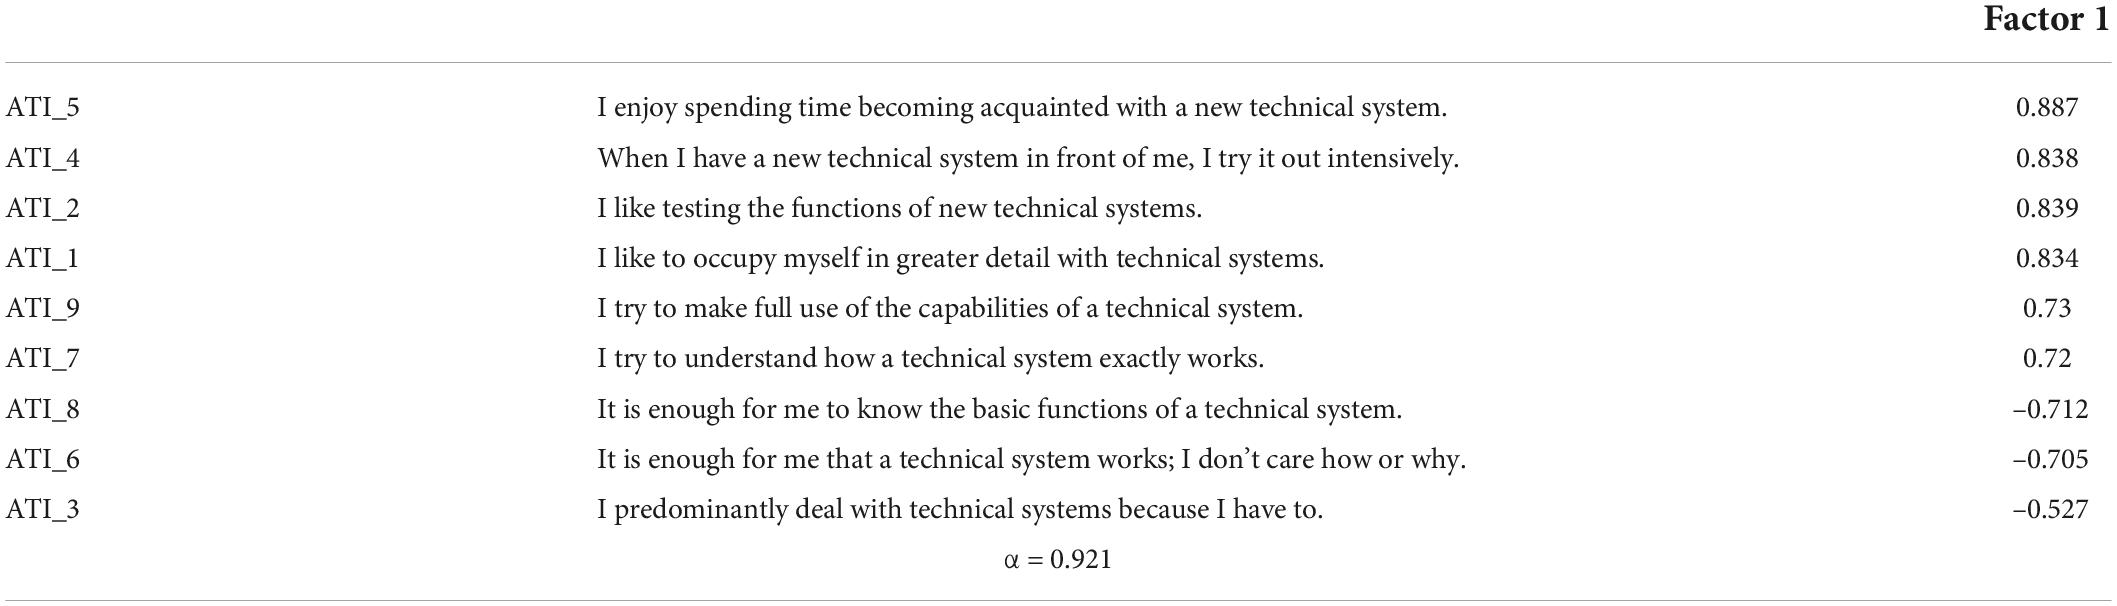
Table 2. Results of the principal axis factoring (PAF) with the items of the ATI and the related factor loadings.
0.9=0.679√0.895×ryy, resulting in a minimum estimated reliability for ITAS of ryy=0.636.
The r-values of Spearman’s rank correlation between the new test instrument ITAS and the other two instruments (ATI and TA-EGA) for affinity to technology are strongly positive (>0.601) with a significant level p < 0.01 (Figure 3). Considering the entire TA-EG scale, the value is slightly lower with rs = 0.577 (p < 0.01). The correlation between ITAS and INS was rs = 0.144 (p < 0.01). Furthermore, between the ATI and the TA-EGA a strongly positive correlation could be obtained (rs = 0.840, p < 0.01).
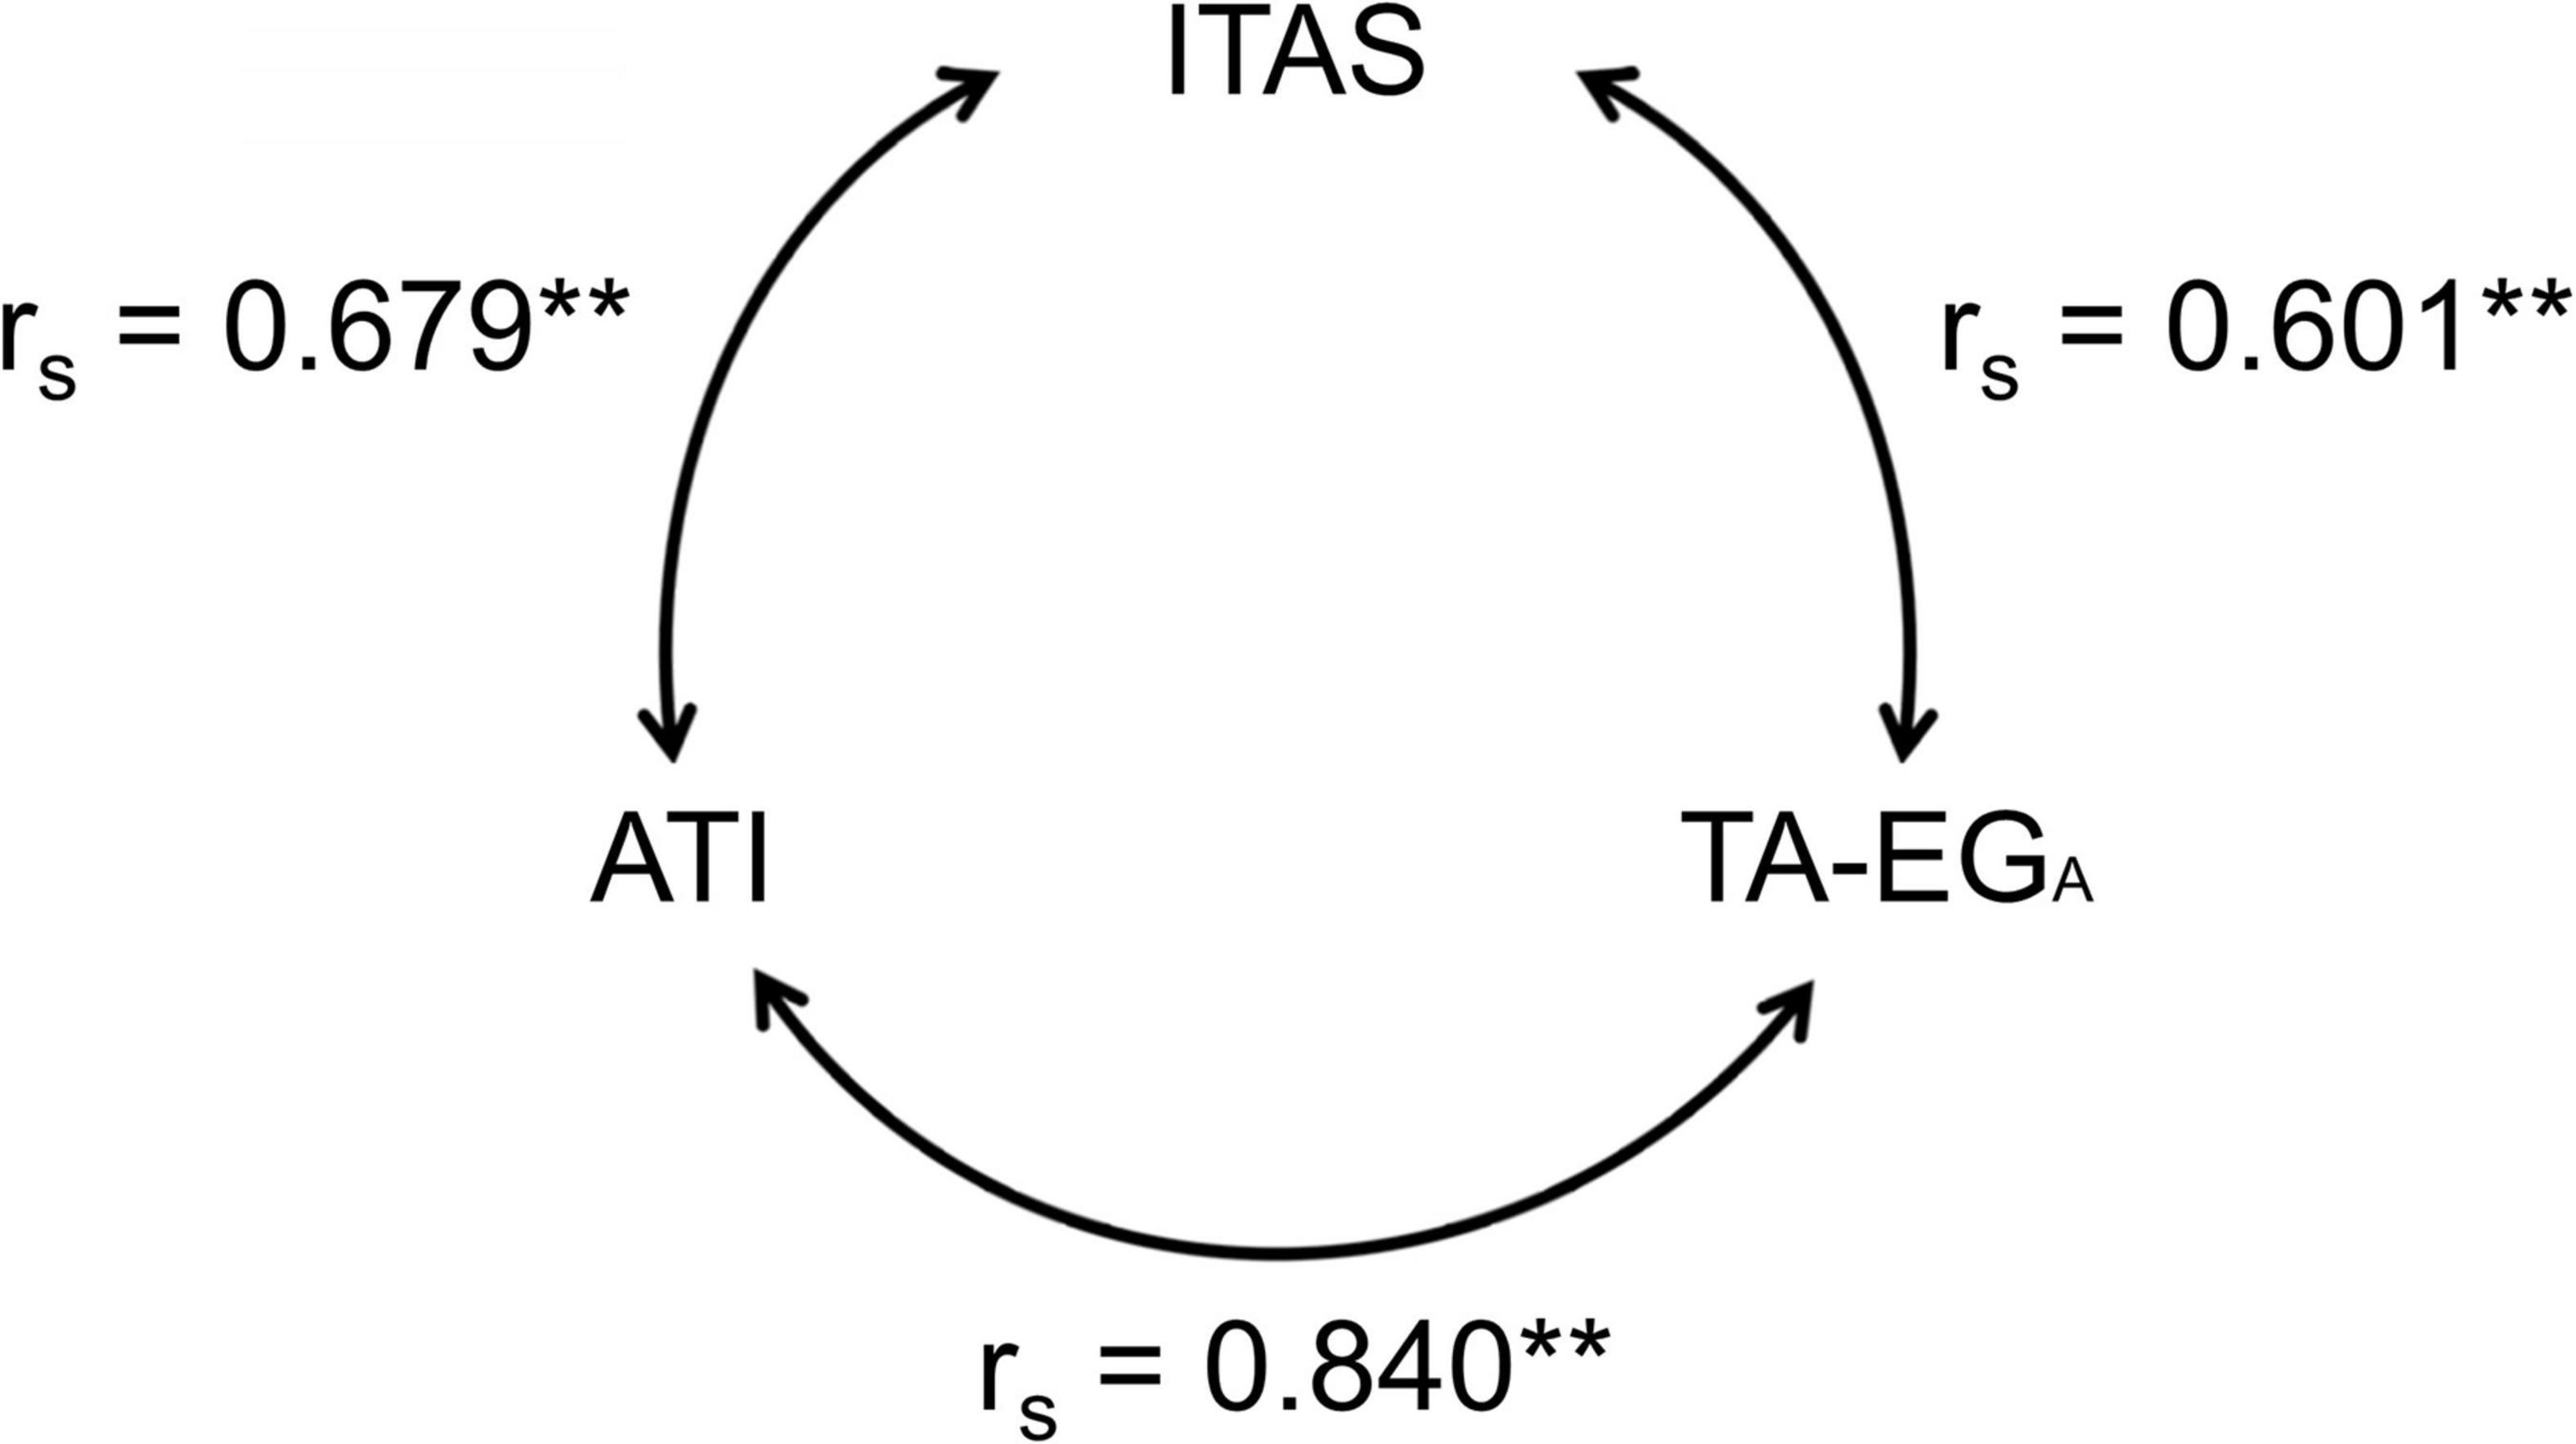
Figure 3. Correlations according to Spearman’s rank correlation (rs) between the technology affinity scales (ATI; TA-EGA; ITAS) used in study 1. **Significant at the level p < 0.01.
Figure 4 presents the percentage distribution of participants across the 7-level ITAS. The percentage of cases at the two extremes is the lowest. For answer choice 1, it is 2.1%, while 5.34% choose answer 7. Answer option 4 was chosen the most with 31.49%. With a mean value of 4.2, the standard deviation is 1.38. In summary, it can be stated that all response options of the instrument were used in sample 1.
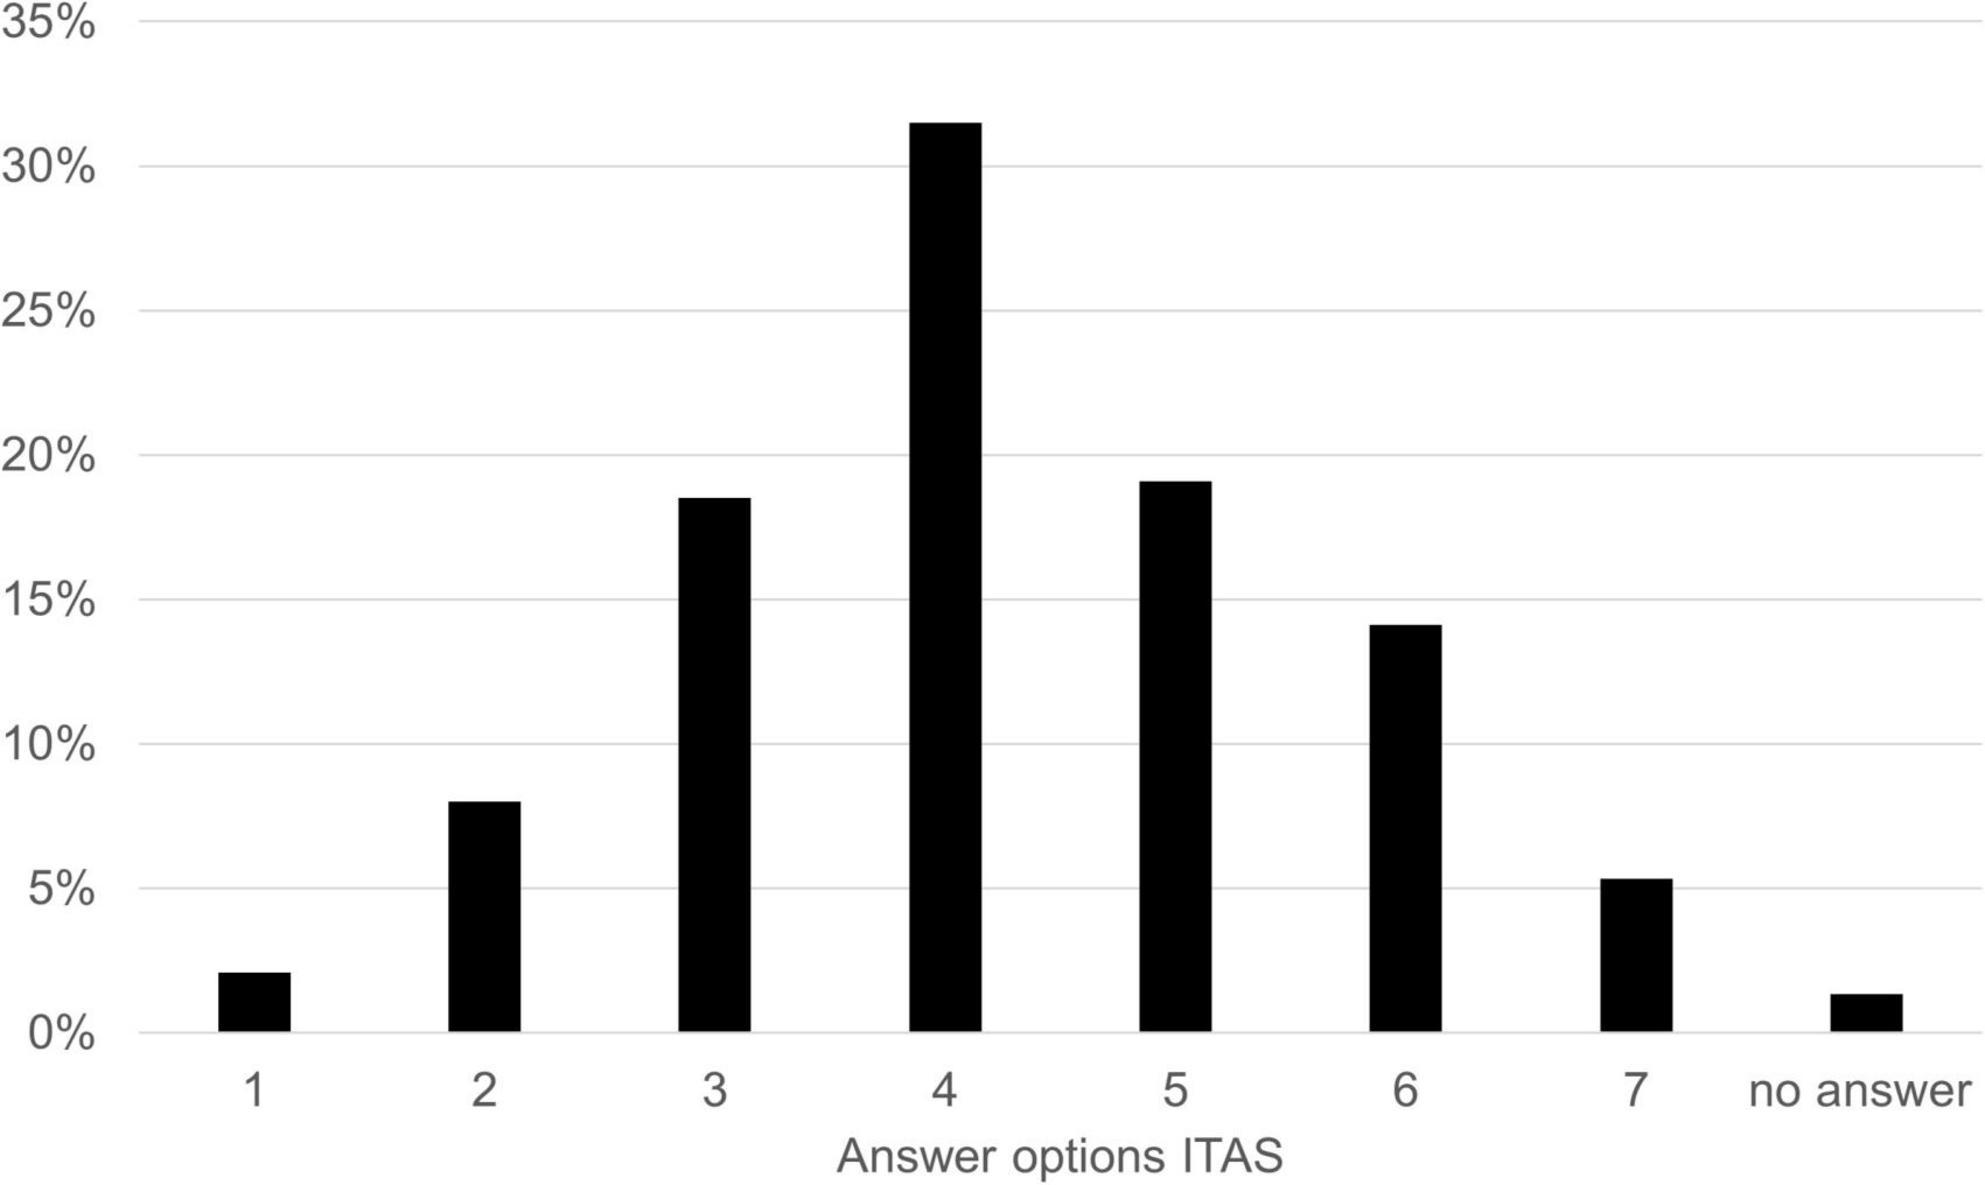
Figure 4. Percentage distribution of sample 1 responses given across the 7-level ITAS.
Discussion
The factor loadings and single-factor structure as well as the Cronbach alpha of our study are comparable to the findings of previous studies on the ATI. For example, the α-values in the samples of Franke et al. (2019) ranged from 0.83 to 0.90 and Lezhnina and Kismihók (2020) reported a reliability value of 0.90 for the ATI scale. Compared to the literature findings, we interpret the data of our sample as suitable for further analysis.
The distribution of given answers for ITAS shown in Figure 4 allows to conclude that the heterogeneity of the participants in terms of their affinity for technology could be covered across its entire range. To check whether the newly developed ITAS measures the technology affinity in the same way as established instruments, it is important to confirm the convergent and discriminant validity of the scale.
To do this, we first had to estimate the reliability of ITAS. With our value of ryy = 0.636 we almost reach a reliability value of 0.7. It should be noted, however, that these estimates represent the minimum reliability. Actual reliability could be higher, but it cannot be lower, nor can it be estimated with greater precision (Wanous et al., 1997). The results suggest that we consider our estimated reliability of the ITAS to be sufficient to assess convergent and discriminant validity.
Convergent validity is typically assessed by correlations between the scores on the instrument under study and scores on existing instruments for measuring similar constructs. Furthermore, discriminant validity is assessed by the scores on the instrument under study and scores on existing instruments for conceptually different constructs (Boateng et al., 2018).
The results of the Spearman’s rank correlation add evidence for the convergent validity of the ITAS in comparison with the ATI, achieving a strongly positive correlation (rs = 0.679). Furthermore, the results also show a high correlation of the ITAS with the subscale TA-EGA (rs = 0.601) and the total scale of the TA-EG (rs = 0.577). Thus, our data are in line with the request of Carlson and Herdman (2012) to avoid values under 0.5, if possible. With the correlation between ITAS and ATI we even almost reach their recommended value of at least 0.7. However, their results also demonstrate that even relatively modest departures from perfect convergent validity create the possibility for substantial differences in research findings (Carlson and Herdman, 2012).
To confirm the discriminant validity, the correlation with divergent measuring instruments should be noticeably lower than the correlation with convergent measuring instruments (Hubley, 2014). The discriminant validity of the ITAS was to be confirmed based on the comparison with the INS. This is particularly relevant since the type of illustration used is the same in both instruments. The obtained low correlation of rs = 0.144 (p > 0.01) adds evidence for the discriminant validity.
The correlation between the already established instrument ATI and the subscale TA-EGA has already been confirmed in the literature. For example, Franke et al. (2019) found values ranged from r = 0.480 to r = 0.620 depending on the respective sample. In our study we achieved a correlation of rs = 0.840, which even exceeds the literature findings.
In summary, the rs-values of Spearman’s rank correlation between ITAS and ATI exceed the highest correlation that could be achieved between the ATI itself and the TA-EGA in the development of the ATI scale. The correlations of the ATI to the GEX of Schmettow and Drees (2014) were also exceeded with the exception of the US American participants from sample 4 (Franke et al., 2019). However, it must be mentioned that the respective samples within the studies differed from each other in terms of their composition. Our sample is mainly set up by 34–65-year old participants. Franke et al. (2019), on the other hand, achieve the highest correlation to TA-EG with a student group that is on average 25 years old. A comparison to a group of the ATI dataset similar to us would be the US American participants (sample 4) or the pedestrians in various German cities (sample 5). However, the authors do not report any values for the correlation between ATI and TA-EGA in these samples. Although this has to be taken into account when comparing the correlations, we generally consider our values for convergent and divergent validity as promising and believe that ITAS can be used as a reasonable supplement to measure technology affinity.
Study 2
After study 1 demonstrated promising construct validity of the instrument, in study 2 the ITAS was tested in the actual target group, the education sector.
Materials and methods
Participants
Prior to the study, in case of the public schools, the parents were informed about the aims of the study, its voluntary nature as well as the data protection and were asked for written consent. Part of that process was also the approval of the principals of the respective public schools. In case of legal age, the written consent form was filled out by the students themselves. All data were collected anonymously and for research purposes only. For this study a total of 547 persons from an educational context were questioned using the three instruments for measuring technology affinity (TA-EG; ATI; ITAS) as well as the INS. The participants include university students of the Goethe University of Frankfurt, or more precisely teacher trainees in biology (n = 157), and high school students from six different public schools (n = 390). The public school students surveyed were 16.8 years old on average. This age group was chosen deliberately in order to mostly ensure the text comprehension required for the ATI and TA-EG. The gender distribution for sample 2 can be taken from Table 3.
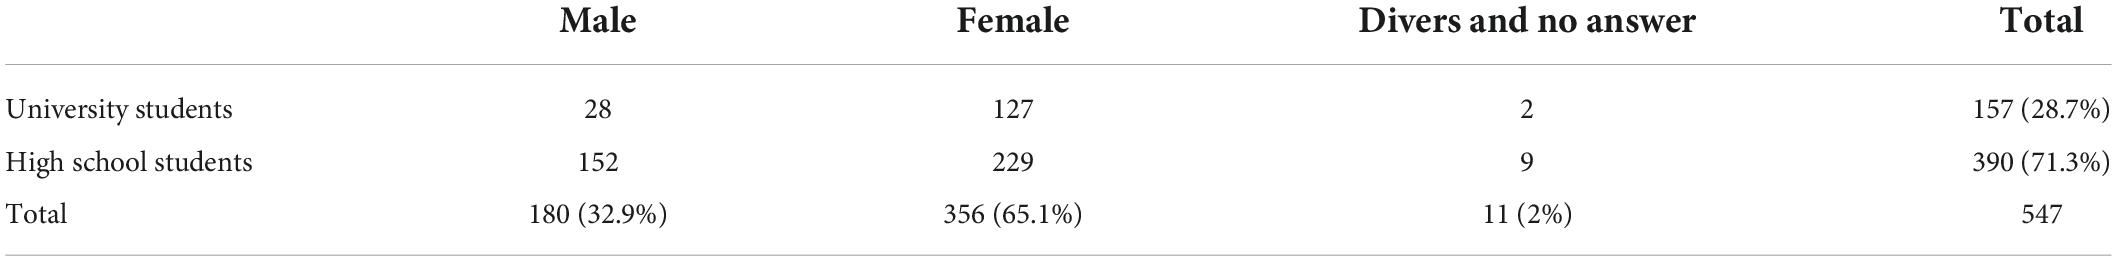
Table 3. Gender distribution of sample 2.
Instruments
The same instruments were used as in study 1.
Analysis
Since the single factor structure of the ATI scale was explored in study 1 and has already been confirmed in the literature (Franke et al., 2019; Lezhnina and Kismihók, 2020), no further PAF was performed in study 2.
As in study 1, the data were tested toward normal distribution by using the Kolmogorov-Smirnov test and the Shapiro-Wilk test. Normal distribution cannot be assumed, as both tests showed a significant result (p < 0.05). Therefore, the correlation between the ITAS and the other instruments (TA-EG; ATI; INS) was determined using Spearman’s rank correlation and interpreted according to Cohen (1992): small (0.1), medium (0.3), large (0.5). Missing data were deleted pairwise in case of correlations.
Results
For sample 2, the rs-values of Spearman’s rank correlation between the new test instrument ITAS and the other two instruments (ATI and TA-EGA) for technology affinity are almost strongly positive (ranging from 0.474 to 0.440) with a significant level p < 0.01 (Figure 5). Considering the entire TA-EG scale, the value is slightly higher with rs = 0.454 (p < 0.01). The correlation between ITAS and INS within sample 2 was rs = –0.108 (p < 0.05). Furthermore, a strongly positive correlation between the ATI and the TA-EGA could be obtained (rs = 0.684, p < 0.01).

Figure 5. Correlations according to Spearman’s rank correlation (rs) between the technology affinity scales (ATI; TA-EGA; ITAS) used in study 2. **Significant at the level p < 0.01.
Regarding the distribution of the answers (Figure 6), in sample 2 the most frequently indicated values correspond to answer option 4 with 27.6% and 5 with 28.3% (MV = 4.6; SD = 1.26). Considering the two extremes, answer option 7 clearly exceeds answer option 1. The distribution of sample 2 shows slightly higher values than sample 1 (MV = 4.2; SD = 1.38). As in study 1, all possible response options of ITAS were covered.

Figure 6. Percentage distribution of sample 2 responses given across the 7-level ITAS.
Discussion
The construct validity of the newly developed ITAS instrument already shown in study 1 could also be demonstrated in the target group, the education sector. However, it must be considered that our sample only represents a small part of the whole educational sector. While the high school sector is already represented diversely, data on younger school classes are missing. The university students are only representative of their respective course of study, which corresponds to the didactics of biology. While this cohort is particularly interesting as the participants will form the next generation of biology teachers, more diversity should be represented here in the future. The area of adult education could also be taken into account. Looking at the convergent validity results, almost strongly positive correlation between ITAS and the ATI is reached (rs = 0.474). When compared to McDonald et al. (2019), who also validated a single item instrument of overlapping circles in the educational sector, our correlations are higher than their values (ranging between r = 0.30 and 0.40). However, the particularly high values from study 1 and the minimum for convergent validity specified by Carlson and Herdman (2012) could not be reached. This is also the case with the correlation values between ITAS and the subscale TA-EGA as well as between ITAS and the total scale of the TA-EG. One possible explanation is that the two instruments (ATI and TA-EG) were not explicitly developed for use in the educational sector resulting in difficulties for the students to fully understand the items of the instruments. One can reach to this conclusion because the authors refer to very heterogeneous population groups as their target group, address a possible use for economic concerns, and only a small part of their sample can be considered as belonging to the educational sector (Karrer et al., 2009; Franke et al., 2019). Comparing the values with the corresponding student sample (sample 3) from the study by Franke et al. (2019), it is noticeable that similar values are obtained in their correlation between ATI and TA-EGA (r = 0.48). This value also corresponds to a lower achieved correlation in the education sector. Since younger participants are found in the educational sector, an influence of age could be another possibility for the lower correlation (participants of study 1 > 25 years).
Regarding discriminant validity, study 2 confirms that there is only a minimal correlation between ITAS and the INS (rs = –0.108). As in study 1, this is particularly important since the type of illustration used is the same in both instruments.
The distribution of responses given for the ITAS within sample 2 confirms the existing heterogeneity in the education sector (Markic and Abels, 2014; Vock and Gronostai, 2017). The seven response options of the ITAS circles allow a differentiated recording of this heterogeneity. It is important to identify students who show particularly high and low technology affinity in order to identify potential difficulties and promote special skills.
In summary, ITAS is once again clearly distinguished from an instrument (INS) that measures a different construct. In addition, it is also able to measure technology affinity in the target group of the education sector in a similar way to the ATI. It should be noted, however, that our sample does not cover the education sector in its entirety and that the correlations could be affected by the circumstance that the ATI is not specifically intended for the education sector.
General discussion
Technology plays a central role in today’s generation of students as it is increasingly used in schools. This has been further reinforced by the need for online instruction in recent years due to the Corona pandemic (Kamarianos et al., 2020; Winter et al., 2021). To date, most research in education has focused on technology acceptance in the context of successful technology implementation (Diwakar et al., 2014; Formella-Zimmermann et al., 2022). However, in order to be able to predict the success of the first-time use of a technology, a different approach is needed, since the survey of technology acceptance with the TAM instrument presupposes that the technology has already been used. The main difference between technology affinity and technology acceptance is that it can be assessed prior to the first application, since it is characterized as a distinct personality trait and is thus detached from the specific technology.
The need of a survey of technology affinity and its potential use
Technology affinity becomes of special relevance in the education sector as it allows to predict the successful use of technology (Hesse et al., 2020; Wong et al., 2020; Yang et al., 2021). If there is little affinity within the learning group or among individuals, this is not a definitive reason to not use technology. Rather, it should be ensured that individual students are offered support in using the technology at an early stage. To make this possible, a survey of affinity for technology as some form of pretest is needed that should not take up much time and allows teachers to evaluate the status quo of the learning group without much effort. Despite this need, current research in education still lacks a suitable measurement tool as shown in the introduction. Therefore, we present the ITAS as a low text-heavy tool for quickly quantifying the technology affinity in the education sector.
In future research, ITAS can be used, for example, before teachers conduct technical activities with their learning group, to predict possible difficulties and adjust their planning accordingly. Depending on the results, it can be decided to what extent the use of technical tools is worthwhile or whether highly technological topics such as artificial intelligence can be addressed. In addition, a survey before and after the lesson can be used to evaluate and improve the learning content in terms of its capability to promote student’s affinity for technology. Since ITAS also provides valid results for older subjects (study 1), long-term studies are also conceivable in which the development of technology affinity from childhood to adulthood can be surveyed. In this way, for example, the point in time at which possible aversions develop can be precisely recorded. Another advantage of the validity of ITAS for older subjects is the possible survey of teachers and teacher trainees as conducted in case of the university students of sample 2. Knowledge about teacher’s affinity for technology is important as teachers with high affinity for technology were shown to have more positive attitudes toward using digital support software (Küppers and Schroeder, 2020). This is supported by the findings of Project Tomorrow (2017), in which technology leaders indicate that the biggest challenge to expanding technology use in education is motivating teachers to change their traditional approach to teaching and use technology more meaningfully with students.
Single item structure
ITAS is designed as a single-item instrument. Although the use of single-item measures is often debated, there are several constructs that have been successfully assessed with single-item measures, including job satisfaction (Wanous et al., 1997), teaching effectiveness (Wanous and Hudy, 2001), STEM identity (McDonald et al., 2019) and connectedness to nature (Kleespies et al., 2021). The latter two are particularly noteworthy because they also use overlapping pairs of circles as pictorial scale. Wanous et al. (1997) found that the observed correlation values between individual items and scales averaged r = 0.63, from which they deduced that measuring scales with only one item is acceptable. We were able to obtain similar results in our study, although our item was newly developed and not taken from an existing scale. An advantage of single-item measurements is that they allow to save time and reduce the perceived burden (Fisher et al., 2016; Weigelt et al., 2022), which has a positive effect on response rates (Crawford et al., 2001). However, we would like to emphasize here that, despite the above arguments, there are still good reasons to prefer scales over single items. For example, a single item cannot provide as differentiated insights as a scale measurement (Weigelt et al., 2022). Furthermore, single items are more prone to transfer response patterns because they cannot compensate for transfer effects as well as scales (Diamantopoulos et al., 2012). Fuchs and Diamantopoulos (2009) suggest that single-item measures are acceptable when the constructs being measured are concrete and unidimensional, the desired precision is low, and the sample population is limited. These points apply to ITAS since the goal is to obtain an initial assessment of a heterogeneous learning group limited by class size. As we only want to achieve a first prediction, the desired precision is low. Regarding the unidimensionality, we consider this to be true for technology affinity as well. The unidimensionality of the construct is proven by Franke et al. (2019) and Schmettow and Drees (2014) in their studies. Furthermore, we agree with the authors of the ATI that while the overall scale of the TA-EG tries to survey technology affinity as a multidimensional construct, only subscale TA-EGA actually serves respective items to survey technology affinity. The Subscales B, C and D rather correspond to the domain of attitude.
Limitations
Although the study was carefully conducted, some limitations have to be considered. While the construct validity of the instrument could be successfully demonstrated, other types of validity such as criterion validity could not yet be included in the research. However, future research will try to demonstrate criterion validity of the ITAS by showing its correlation with the actually achieved acceptance of technology surveyed via TAM. While the single-item structure positively influences the time that is needed to answer the instrument, it covers the construct of technology affinity in a reduced form without subscales as e.g., the TA-EG by Karrer et al. (2009). It should also be noted that participants have different conceptions of the term “technical systems.” Therefore, the preceding definition of the term in the questionnaire is particularly important. While it has been demonstrated that ITAS can successfully survey technology affinity in the education sector, it is important to note that the instrument has so far only been tested on participants in high school or university. Future research should therefore address the use of ITAS in younger age groups and more diverse university subjects. Additionally, it remains to be seen whether the existence of a suitable test instrument will actually lead to a desired increase in surveys of technology affinity in education.
Open science approach
For our studies, we considered all questionnaires and responses received. Only an open question on the perception of artificial intelligence, additionally included in the questionnaire, was irrelevant for the presented studies and therefore, was not considered in the analysis. Data were assigned to either sample 1 or sample 2 and coded accordingly. While a sample size of 200 is recommended for the most basic psychometric analyses (Frost et al., 2007), 400 participants should be targeted for reliability and validity studies (Charter, 1999). Therefore, we set a target size of at least 400 participants for both samples, explicitly excluding college and high school students for sample 1 in order to achieve a higher differentiation of sample 2. After reaching the specified number, we continued to include data until the end of the planned survey period (January 2022). The measurements which are relevant for this study are described in detail in section “Instruments.” The measurements that are not included in figures or tables can be accessed in Supplementary Table 1 and Supplementary Figure 1. By reporting how “[…] we determined our sample size, all data exclusions (if any), all manipulations and all measurements in the study,” we follow the recommendation of (Simmons et al., 2012).
Conclusion
The aim of this study to provide evidence of the convergent and discriminant validity of the ITAS as an instrument in the research field that is less text-heavy and supported by a visual illustration can be regarded as successful. Our empirical study shows correlation of the ITAS with the ATI and the control instrument TA-EG. In the field of education, ITAS can be used as a supplement to ATI or other technology affinity scales or, if the setting requires, as an alternative to them. ITAS convinces with the low complexity of the instrument, the graphical component, which requires little text understanding, the high time saving as well as the high construct validity. In addition, a translation into other languages would be very easy.
Up to now, there have been relatively few studies dealing with the technology affinity of students, both in universities and public schools. Due to the ITAS now available, it will be possible to accompany research approaches with regard to technology affinity, even if there is little time available or participants do not yet have a particularly well-developed text comprehension. In future studies, the target group should be covered even more diversely by data and should include both learning groups and teachers, as they are the final decision makers on the design of instruction and consequently the increased integration of technology in the classroom.
Data availability statement
The raw data supporting the conclusions of this article will be made available by the authors, without undue reservation.
Ethics statement
The studies involving human participants were reviewed and approved by the Ethics Committee of the Science Didactic Institutes and Departments (FB 13, 14, 15) of the Goethe University Frankfurt am Main. Written informed consent to participate in this study was provided by the participants’ legal guardian/next of kin.
Author contributions
MH, SF-Z, and PD: conceptualization. MH: data collection and writing—original. MH, MK, SF-Z, and PD: methodology, writing—review and editing, and visualization. MH, SF-Z, and MK: validation, formal analysis, and investigation. PD: funding acquisition. SF-Z and PD: supervision. All authors contributed to the article and approved the submitted version.
Funding
This study was financially supported by the Klaus Tschira Stiftung gGmbH (project funding no. 3815020005).
Acknowledgments
We would like to thank the Klaus Tschira gGmbH, which contributed to the success of the project through its financial support.
Conflict of interest
The authors declare that the research was conducted in the absence of any commercial or financial relationships that could be construed as a potential conflict of interest.
Publisher’s note
All claims expressed in this article are solely those of the authors and do not necessarily represent those of their affiliated organizations, or those of the publisher, the editors and the reviewers. Any product that may be evaluated in this article, or claim that may be made by its manufacturer, is not guaranteed or endorsed by the publisher.
Supplementary material
The Supplementary Material for this article can be found online at: https://www.frontiersin.org/articles/10.3389/feduc.2022.970212/full#supplementary-material
References
Abdullah, F., and Ward, R. (2016). Developing a general extended technology acceptance model for e-learning (GETAMEL) by analysing commonly used external factors. Comput. Hum. Behav. 56, 238–256. doi: 10.1016/j.chb.2015.11.036
Aron, A., Aron, E. N., and Smollan, D. (1992). Inclusion of other in the self scale and the structure of interpersonal closeness. J. Pers. Soc. Psychol. 63, 596–612. doi: 10.1037/0022-3514.63.4.596
Backhaus, J., Huth, K., Entwistle, A., Homayounfar, K., and Koenig, S. (2019). Digital affinity in medical students influences learning outcome: A cluster analytical design comparing vodcast with traditional lecture. J. Surg. Educ. 76, 711–719. doi: 10.1016/j.jsurg.2018.12.001
Boateng, G. O., Neilands, T. B., Frongillo, E. A., Melgar-Quiñonez, H. R., and Young, S. L. (2018). Best practices for developing and validating scales for health, social, and behavioral research: A primer. Front. Public Health 6:149. doi: 10.3389/fpubh.2018.00149
Bughin, J., Seong, J., Manyika, J., Hämäläinen, L., Windhagen, E., and Hazan, E. (2019). Notes from the AI frontier: Tackling Europe’s gap in digital and AI.: Discussion paper. Washington, DC: McKinsey Global Institute.
Cam, A., Chui, M., and Hall, B. (2020). Global AI survey. AI proves its worth, but few scale impact. Washington, DC: McKinsey Global Institute.
Carlson, K. D., and Herdman, A. O. (2012). Understanding the impact of convergent validity on research results. Organ. Res. Methods 15, 17–32. doi: 10.1177/1094428110392383
Charter, R. A. (1999). Sample size requirements for precise estimates of reliability, generalizability, and validity coefficients. J. Clin. Exp. Neuropsychol. 21, 559–566. doi: 10.1076/jcen.21.4.559.889
Chinn, C. A., and Malhotra, B. A. (2002). Epistemologically authentic inquiry in schools: A theoretical framework for evaluating inquiry tasks. Sci. Educ. 86, 175–218. doi: 10.1002/sce.10001
Crawford, S. D., Couper, M. P., and Lamias, M. J. (2001). Web surveys. Perceptions of burden. Soc. Sci. Comput. Rev. 19, 146–162. doi: 10.1177/089443930101900202
Cripps, B. (2017). Psychometric testing: Critical perspectives. BPS textbooks in psychology. Hoboken, NJ: John Wiley & Sons Incorporated.
Crovari, P., Catania, F., Spitale, M., and Garzotto, F. (2020). “Ecological momentary assessment tools: Lessons learned from an HCI perspective,” in Human-computer interaction. Design and user experience. HCII 2020. Lecture notes in computer science, Vol. 12181, ed. M. Kurosu (Cham: Springer), 387–403. doi: 10.1007/978-3-030-49059-1_28
Dani, D. E., and Koenig, K. M. (2008). Technology and reform-based science education. Theory Pract. 47, 204–211. doi: 10.1155/2022/8169938
Davis, F. D. (1985). Technology acceptance model for empirically testing new end-user information systems.: Theory and results [Thesis]. Cambridge, MA: Sloan School of Management.
Deguchi, A., Hirai, C., Matsuoka, H., Nakano, T., Oshima, K., Tai, M., et al. (2020). What is society 5.0? Singapore: Springer. doi: 10.1007/978-981-15-2989-4_1
Diamantopoulos, A., Sarstedt, M., Fuchs, C., Wilczynski, P., and Kaiser, S. (2012). Guidelines for choosing between multi-item and single-item scales for construct measurement: A predictive validity perspective. J. Acad. Mark. Sci. 40, 434–449. doi: 10.1007/s11747-011-0300-3
Diwakar, S., Parasuram, H., Medini, C., Raman, R., Nedungadi, P., Wiertelak, E., et al. (2014). Complementing neurophysiology education for developing countries via cost-effective virtual labs: Case studies and classroom scenarios. J. Undergrad. Neurosci. Educ. 12, A130–A139.
Dziuban, C. D., and Shirkey, E. C. (1974). When is a correlation matrix appropriate for factor analysis? Some decision rules. Psychol. Bull. 81, 358–361. doi: 10.1037/h0036316
Edison, S. W., and Geissler, G. L. (2003). Measuring attitudes towards general technology: Antecedents, hypotheses and scale development. J. Target. Meas. Anal. Mark. 12, 137–156. doi: 10.1057/palgrave.jt.5740104
Estriégana, R. V., Medina-Merodio, J. A., and Barchino, R. (2019). Student acceptance of virtual laboratory and practical work: An extension of the technology acceptance model. Comput. Educ. 135, 1–14.
Fisher, G. G., Matthews, R. A., and Gibbons, A. M. (2016). Developing and investigating the use of single-item measures in organizational research. J. Occup. Health Psychol. 21, 3–23. doi: 10.1037/a0039139
Fleming, D. E., and Artis, A. B. (2010). Measuring corporate affinity for technology: A scale for customers and employees. J. Pers. Selling Sales Manage. 30, 167–179. doi: 10.2753/PSS0885-3134300207
Formella-Zimmermann, S., Kleespies, M. W., and Dierkes, P. W. (2022). Motivation and technology acceptance in a neuroscience student lab—An empirical comparison between virtual experiments with and without hands-on elements. Front. Educ. 7:817598. doi: 10.3389/feduc.2022.817598
Franke, T., Attig, C., and Wessel, D. (2019). A personal resource for technology interaction: Development and validation of the Affinity for Technology Interaction (ATI) scale. Int. J. Hum. Comput. Interact. 35, 456–467. doi: 10.1080/10447318.2018.1456150
Friedl, R., Höppler, H., Ecard, K., Scholz, W., Hannekum, A., Ochsner, W., et al. (2006). Multimedia-driven teaching significantly improves students’ performance when compared with a print medium. Ann. Thorac. Surg. 81, 1760–1766. doi: 10.1016/j.athoracsur.2005.09.048
Frost, M. H., Reeve, B. B., Liepa, A. M., Stauffer, J. W., and Hays, R. D. (2007). What is sufficient evidence for the reliability and validity of patient-reported outcome measures? Value Health 10 Suppl 2, S94–S105. doi: 10.1111/j.1524-4733.2007.00272.x
Fuchs, C., and Diamantopoulos, A. (2009). Using single item measures for construct measurement in management research. Die Betriebswirtsch. 69, 195–210.
Granić, A., and Marangunić, N. (2019). Technology acceptance model in educational context: A systematic literature review. Br. J. Educ. Technol. 50, 2572–2593. doi: 10.1111/bjet.12864
Greßler, A. (2019). Eine qualitative und quantitative studie zum einsatz der virtuellen mikroskopie in der schule [Thesis]. Frankfurt: Goethe University.
Güdel, K., Heitzmann, A., and Müller, A. (2020). “Affinity for technology of girls and boys of lower secondary school level,” in The impact of technology education: International insights, Vol. 3, eds M. de Vries, S. Fletcher, S. Kruse, P. Labudde, M. Lang, I. Mammes, et al. (Essen: Center of Excellence for Technology Education (CETE), Waxmann), 49–61.
Heilala, V., Kelly, R., Saarela, M., Jääskelä, P., and Kärkkäinen, T. (2022). The finnish version of the affinity for technology interaction (ATI) scale: Psychometric properties and an examination of gender differences. Int. J. Hum. Comput. Interact. 1–19. doi: 10.1080/10447318.2022.2049142 [Epub ahead of print].
Hesse, L. S., Walter, G., and Tietze, S. (2020). “Influence of personality, affinity for technology and risk awareness on technology acceptance using the example of voice control,” in Proceedings of the Mensch und Computer 2020 (MuC’20), eds F. Alt, S. Schneegass, and E. Hornecker (Chairs) (Magdeburg: Association for Computing Machinery).
Hofstein, A., and Lunetta, V. N. (2004). The laboratory in science education: Foundations for the twenty-first century. Sci. Educ. 88, 28–54. doi: 10.1002/sce.10106
Holmqvist Olander, M., Wennås Brante, E., and Nyström, M. (2017). The effect of illustration on improving text comprehension in dyslexic adults. Dyslexia 23, 42–65. doi: 10.1002/dys.1545
Hubley, A. M. (2014). “Dicriminante validity,” in Encyclopedia of quality of life and well-being research, ed. A. C. Michalos (Berlin: Springer).
Jackson, D., Horn, S., Kersten, P., and Turner-Stokes, L. (2006). Development of a pictorial scale of pain intensity for patients with communication impairments: Initial validation in a general population. Clin. Med. 6, 580–585. doi: 10.7861/clinmedicine.6-6-580
Jin, F., and Divitini, M. (2020). “Affinity for technology and teenagers’ learning intentions,” in Proceedings of the International Computing (ICER’20) (New York, NY: Association for Computing Machinery), 48–55. doi: 10.1145/3372782.3406269
Kamarianos, I., Adamopoulou, A., Lambropoulos, H., and Stamelos, G. (2020). Towards an understanding of university students’ response in times of pandemic crisis (Covid-19). Eur. J. Educ. Stud. 7, 20–40. doi: 10.46827/ejes.v7i7.3149
Karrer, K., Glaser, C., Clemens, C., and Bruder, C. (2009). “Technikaffinität erfassen–der fragebogen TA-EG [Measuring affinity to technology–The questionnaire TA-EG],” in Der mensch im mittelpunkt technischer systeme, eds A. Lichtenstein, C. St—”oßel, and C. Clemens (Berlin: Berliner Werkstatt Mensch-Maschine-Systeme), 8.
King, W. R., and He, J. (2006). A meta-analysis of the technology acceptance model. Inf. Manage. 43, 740–755. doi: 10.1016/j.im.2006.05.003
Kleespies, M. W., Braun, T., Dierkes, P. W., and Wenzel, V. (2021). Measuring connection to nature—A illustrated extension of the inclusion of nature in self scale. Sustainability 13:1761. doi: 10.3390/su13041761
Kramer, M., Förtsch, C., Aufleger, M., and Neuhaus, B. J. (2019). Der einsatz digitaler medien im gymnasialen biologieunterricht. Z. Didaktik Der Naturwissenschaften 25, 131–160. doi: 10.1007/s40573-019-00096-5
Küppers, B., and Schroeder, U. (2020). “Teacher’s perspective on e-assessment: A case study from Germany,” in Proceedings of the 12th International Conference on Computer Supported Education (Setúbal: Science and Technology Publications, Lda), 503–509. doi: 10.5220/0009578105030509
Lewis, D. I. (2014). The pedagogical benefits and pitfalls of virtual tools for teaching and learning laboratory practices in the biological sciences. Heslington: The Higher Education Academy.
Lezhnina, O., and Kismihók, G. (2020). A multi-method psychometric assessment of the affinity for technology interaction (ATI) scale. Comput. Hum. Behav. Rep. 1:100004. doi: 10.1016/j.chbr.2020.100004
Maltese, A. V., and Tai, R. H. (2011). Pipeline persistence: Examining the association of educational experiences with earned degrees in STEM among U.S. students. Sci. Educ. 95, 877–907. doi: 10.1002/sce.20441
Markic, S., and Abels, S. (2014). Heterogeneity and diversity: A growing challenge or enrichment for science education in German schools? EURASIA J. Math. Sci. Technol. Educ. 10, 271–283. doi: 10.12973/eurasia.2014.1082a
Marx, A., Stanat, P., Roick, T., Segerer, R., Marx, P., and Schneider, W. (2015). Components of reading comprehension in adolescent first-language and second-language students from low-track schools. Read. Writ. 28, 891–914. doi: 10.1007/s11145-015-9554-3
McDonald, M. M., Zeigler-Hill, V., Vrabel, J. K., and Escobar, M. (2019). A single-item measure for assessing STEM identity. Front. Educ. 4:78. doi: 10.3389/feduc.2019.00078
Nelson, K., Courier, M., and Joseph, G. W. (2011). An investigation of digital literacy needs of students. J. Inf. Syst. Educ. 22, 95–110.
Project Tomorrow (2017). Trends in digital learning: Building teachers’ capacity and competency to create new learning experiences for students. Washington, DC: Blackboard Inc.
Ritter, N. L. (2017). Technology acceptance model of online learning management systems in higher education: A meta-analytic structural equation mode. Int. J. Learn. Manage. Syst. 5, 1–15. doi: 10.18576/ijlms/050101
Schmettow, M., and Drees, M. (2014). “What drives the geeks? Linking computer enthusiasm to achievement goals,” in BCS-HCI ’14, Proceedings of the 28th International BCS Human Computer Interaction Conference on HCI 2014–Sand, Sea and Sky–Holiday HCI, eds D. Fitton, M. Horton, and J. Read (Glendale: BCS), 234–239. doi: 10.14236/ewic/hci2014.29
Schultz, P. W. (2002). “Inclusion with nature: The psychology of human-nature relations,” in Psychology of sustainable development, eds P. Schmuck and W. P. Schultz (Berlin: Springer).
Shetty, R. M., Khandelwal, M., and Rath, S. (2015). Rms pictorial scale (RMS-PS): An innovative scale for the assessment of child’s dental anxiety. J. Indian Soc. Pedod. Prev. Dent. 33, 48–52. doi: 10.4103/0970-4388.149006
Simmons, J. P., Nelson, L. D., and Simonsohn, U. (2012). A 21 word solution. Dialogue 2, 4–7. doi: 10.2139/ssrn.2160588
Stark, T. H., and Krosnick, J. A. (2017). GENSI: A new graphical tool to collect ego-centered network data. Soc. Netw. 48, 36–45. doi: 10.1016/j.socnet.2016.07.007
Šumak, B., Heričko, M., and Pušnik, M. (2011). A meta-analysis of e-learning technology acceptance: The role of user types and e-learning technology types. Comput. Hum. Behav. 27, 2067–2077. doi: 10.1016/j.chb.2011.08.005
Taherdoost, H. (2018). A review of technology acceptance and adoption models and theories. Procedia Manuf. 22, 960–967. doi: 10.1016/j.promfg.2018.03.137
Tietjens, M., Dreiskaemper, D., Utesch, T., Schott, N., Barnett, L. M., and Hinkley, T. (2018). Pictorial scale of physical self-concept for younger children (P-PSC-C): A feasibility study. J. Motor Learn. Dev. 6(s2), S391–S402. doi: 10.1123/jmld.2016-0088
University of Lübeck (2022). ATI Scale. Available online at: https://ati-scale.org/ (accessed June 10, 2022).
Vega, V., and Robb, M. B. (2019). The common sense census: Inside the 21st-century classroom. San Franciso, CA: Common Sense Media.
Vock, M., and Gronostai, A. (2017). Umgang mit heterogenität in schule und unterricht. Berlin: Friedrich-Ebert-Stiftung Abt. Studienforderung.
Vonk, J. M. J., Higby, E., and Obler, L. K. (2017). “Comprehension in older adult populations,” in The handbook of psycholinguistics, eds E. M. Fernández and H. S. Cairns (Hoboken, NJ: Wiley & Sons, Inc), 411–437. doi: 10.1002/9781118829516.ch18
Wanous, J. P., and Hudy, M. J. (2001). Single-item reliability: A replication and extension. Organ. Res. Methods 4, 361–375. doi: 10.1177/109442810144003
Wanous, J. P., Reichers, A. E., Wanous, J. P., and Hudy, M. J. (1997). Overall job satisfaction: How good are single-item measures? J. Appl. Psychol. 82, 247–252. doi: 10.1037/0021-9010.82.2.247
Weigelt, O., Gierer, P., Prem, R., Fellmann, M., Lambusch, F., Siestrup, K., et al. (2022). Time to recharge batteries-Development and validation of a pictorial scale of human energy. Eur. J. Work Organ. Psychol. 1–18. doi: 10.1080/1359432X.2022.2050218 [Epub ahead of print].
Wessel, D., Attig, C., and Franke, T. (2019). “ATI-S-An ultra-short scale for assessing affinity for technology interaction in user studies,” in Proceedings of the mensch und computer 2019 (MuC’19), eds F. Alt, A. Bulling, and T. Döring (New York, NY: Association for Computing Machinery), 147–154. doi: 10.1145/3340764.3340766
Winter, E., Costello, A., O’Brien, M., and Hickey, G. (2021). Teachers’ use of technology and the impact of Covid-19. Ir. Educ. Stud. 40, 235–246. doi: 10.1080/03323315.2021.1916559
Wong, L. -W., Tan, G. W. -H., Lee, V. -H., Ooi, K. -B., and Sohal, A. (2020). Unearthing the determinants of Blockchain adoption in supply chain management. Int. J. Prod. Res. 58, 2100–2123. doi: 10.1080/00207543.2020.1730463
Yang, L., Bian, Y., Zhao, X., Liu, X., and Yao, X. (2021). Drivers’ acceptance of mobile navigation applications: An extended technology acceptance model considering drivers’ sense of direction, navigation application affinity and distraction perception. Int. J. Hum. Comput. Stud. 145:102507. doi: 10.1016/j.ijhcs.2020.102507
Keywords: inclusion of technology affinity in self-scale (ITAS), technology affinity, single item measurement, pictorial scale, technology acceptance, technology in education
Citation: Henrich M, Kleespies MW, Dierkes PW and Formella-Zimmermann S (2022) Inclusion of technology affinity in self scale–Development and evaluation of a single item measurement instrument for technology affinity. Front. Educ. 7:970212. doi: 10.3389/feduc.2022.970212
Received: 15 June 2022; Accepted: 24 August 2022;
Published: 13 September 2022.
Edited by:
Robbert Smit, St. Gallen University of Teacher Education, SwitzerlandReviewed by:
Ville Heilala, University of Jyväskylä, FinlandAnja Strobel, Chemnitz University of Technology, Germany
Copyright © 2022 Henrich, Kleespies, Dierkes and Formella-Zimmermann. This is an open-access article distributed under the terms of the Creative Commons Attribution License (CC BY). The use, distribution or reproduction in other forums is permitted, provided the original author(s) and the copyright owner(s) are credited and that the original publication in this journal is cited, in accordance with accepted academic practice. No use, distribution or reproduction is permitted which does not comply with these terms.
*Correspondence: Marvin Henrich, Henrich@bio.uni-frankfurt.de