 Marvin Henrich
 Sandra Formella-Zimmermann
 Jennifer Gübert
 Paul W. Dierkes
94% of researchers rate our articles as excellent or good
Learn more about the work of our research integrity team to safeguard the quality of each article we publish.
Find out more
ORIGINAL RESEARCH article
Front. Educ., 10 August 2023
Sec. Digital Education
Volume 8 - 2023 | https://doi.org/10.3389/feduc.2023.1216318
Behavioral biology is a field that students find fascinating. To get the most out of the various benefits of teaching it, a practical approach should be followed. One way to do this is to use video recordings of animals which are analyzed using various software. However, learners will only benefit from this approach if they choose to actually use the provided technology. Therefore, it is critical to survey learners’ acceptance towards the use of software in the field of behavioral biology. For this purpose, 171 students were questioned at an out-of-school student lab called “KILab.” By applying the Technology Acceptance Model (TAM), we investigated students’ acceptance of authentic behavior evaluation software and possible factors influencing it. In addition, potential effects of the student lab on attitudes toward artificial intelligence and technology affinity were examined. The results show a high technology acceptance toward the used software and a dependence of this on the factors technology affinity and acceptance toward artificial intelligence. Furthermore, the use of the software has a positive impact on the self-assessed technology affinity and attitude toward artificial intelligence.The study thus shows that the use of video recordings and software for behavior analysis is generally suitable for educational use and can be a possible extension of the practical implementation of behavioral science education.
Despite being a relatively young field of research, dating back to the work of Konrad Lorenz in the 1930s (Mench, 1988), behavioral biology has become a crucial part of the biology curriculum at educational institutions. Thus, teaching behavioral theories and methods is an integral part of schools and universities biology education. But also in modern zoos and aquariums, the teaching of knowledge about animal behavior is an essential task (Kleespies et al., 2020; Cozens-Keeble et al., 2021).
Animal behavior is an area that many students find fascinating (Littman and Moore, 2016) and learning about the observation of animal behavior and its methods has shown to have positive impacts in various contexts. For example, educational programs have been found to reduce negative behaviors toward animals among zoo visitors (Collins et al., 2019). Furthermore, learning about animal behavior can foster personal connections to nature, especially for urban students who are less familiar with it (Myers et al., 2009; Kleespies et al., 2020), which has been shown to motivate people to protect the environment and behave accordingly (Nisbet et al., 2009). Most importantly, the study of animal behavior provides a practical research experience and offers an excellent opportunity to learn about the scientific process and its methods (McCleery et al., 2005; Grove, 2011). Other study results indicate that using ethological techniques promotes greater content understanding and increases learners’ confidence in their scientific skills. It also helps develop skills such as attention to detail and pattern recognition, which are essential for scientific literacy (Ambrosino and Rivera, 2022). Ethograms, in particular, are an effective ethological teaching tool that can be easily integrated into students’ observational investigations (Curran et al., 2016).
However, some students encounter problems related to animal observation and struggle with adequately describing behavior, often confusing the distinction between describing and interpreting behavior (Margulis et al., 2001; Voss and Cooper, 2010). Additionally, students tend to anthropomorphize animals and use emotional terms to characterize observed behavior based on their own experiences (Voss and Cooper, 2010; Grove, 2011). Furthermore, they are often surprised by the number of behaviors that can occur in a short period of time, making it difficult to capture behavior holistically (Margulis et al., 2001). To overcome those challenges and to benefit from the positive effects, learners primarily need to gain experience in recognizing and accurately describing behavior. Therefore, the teaching of behavioral biology should embrace a practical approach that provides students with repeated opportunities to practice recognizing and describing behavior, thereby reducing errors when creating ethograms.
There are several ways to take a hands-on approach with students such as visiting out-of-school learning sites like zoos or working with animals in the classroom. In school, commonly used animals are mice, fish, crickets, or earth worms (Rop, 2008; Hummel and Randler, 2012). However, working with live animals directly in the classroom has been limited for many years due to housing possibilities, associated time and costs, as well as ethical concerns (Reiss and Beaney, 1992; Balcombe, 2000; Rault et al., 2013). The use of invertebrate animals, which are easier to house, can also lead to problems (Grove, 2011). Among other things, a certain disgust on the part of learners can play a role (Randler et al., 2013).
The positive effect of visits to out-of-school learning locations is explicitly mentioned by some authors and has already been shown to have a positive impact on learners’ attitudes (Gillie and Bizub, 2012; Miller et al., 2020; Kleespies et al., 2022). However, there are also certain limitations regarding out-of-school learning locations. Observing animals on site is initially associated with logistical effort and costs for potential admission fees. Furthermore, the observation itself is very time-consuming and limited to the animals in human custody (Littman and Moore, 2016; Hardin and Schlupp, 2022). Last but not least, the presence of visitors can influence the behaviors exhibited and some animals are only observable in specific situations (Rault et al., 2013; Schütz et al., 2022).
Another way to implement a practical approach into the classroom is the use of video recordings obtained from cameras installed in natural habitats or zoos (Rault et al., 2013). There are several advantages to this approach. First, as a non-invasive and inexpensive technology, video recordings provide uninterrupted recordings of animal behavior (Skibins and Sharp, 2019; Schütz et al., 2022), making it a valuable tool for the classroom and allowing teachers to take their students on “digital field trips” (Eichhorst, 2018). According to Wu et al. (2016), lessons incorporating camera traps provide an excellent opportunity for students to analyze data. In addition, the ability to pause the video recordings limits observations to static, non-dynamic descriptions of behavior, which is easier for beginners (Voss and Cooper, 2010). Furthermore, digital video recordings make it possible to conduct both zoo and field studies with animals selected according to interest, which would not be possible in a conventional setup (Rault et al., 2013). Besides, there is no need to transport the students, as would be necessary for an actual field trip. In summary, the use of video recordings in biology lessons is based on current research methods, is easier for beginners, and is less time and cost-intensive. As a result, it is not surprising that a number of educational programs already utilize software for video recordings (Margulis et al., 2001; Wu et al., 2016; Ambrosino and Rivera, 2022) and audio recordings (Betancourt and McLinn, 2012) in teaching behavioral biology. There are also existing databases that offer such recordings (Hughes et al., 2021).
While it is important for learners to start by conducting manual behavior observations, another benefit of using digital methods is the possibility to use artificial intelligence (AI) to address tasks such as classifying species, individuals, vocalizations, or behaviors within complex data sets (Valletta et al., 2017). Nowadays, AI is a common method to automate the analysis of image and audio data, and is increasingly used in current research studies (Kabra et al., 2013; Gübert et al., 2022; Hardin and Schlupp, 2022; Schütz et al., 2022). Rault et al. (2013) and Valletta et al. (2017) point out that automated evaluation is especially suitable for animals that are hard to observe directly, such as nocturnal and aquatic species. In case of classifying behavior, AI can be used for the automated evaluation of image material using both, an object detection network as well as an action classification network (Gübert et al., 2022). In general, this approach is mainly cost- and timesaving as there is a fewer need of live observation or manual video analysis by humans (Valletta et al., 2017; Schütz et al., 2022).
The implementation of automated behavior analysis of animal recordings in education corresponds to the demand to integrate current and authentic research methods from the specialized fields into the education sector. While AI in education is often associated with intelligent tutoring systems or adaptive learning systems (Douali et al., 2022; Ninaus and Sailer, 2022), its use in behavioral biology courses may instead involve teaching its basic structure and allowing learners to perform certain sub-steps of an AI application independently. This approach incorporates the concept of AI literacy, which is considered a subgroup of digital literacy and is defined as knowing and understanding the basic functions of AI and how to use them in specific applications (Rodríguez-García et al., 2020; Ng et al., 2021).
Using software to observe video recordings of animal behavior in a digital learning setup, or even using artificial intelligence to automatically observe animal behavior, combines different advantages. However, learners will not benefit from the many technologies available and their advantages if they do not choose to actually use them (Estriégana et al., 2019). This makes it of critical importance to assess learners’ acceptance of software in the field of behavioral biology and to declare possible factors influencing this acceptance. The “Technology Acceptance Model” (TAM) is the dominant tool for surveying technology acceptance in research, as stated by Taherdoost (2018). This model, originally created by Davis (1985), focuses on two core components: Perceived Usefulness (PU) and Perceived Ease of Use (PEOU), which are used to predict whether technology will be adopted or rejected. Thereby, PU is defined as the degree to which someone believes that using a particular system will improve their work performance and PEOU is defined as the degree to which someone believes that using a particular system is free from physical and mental efforts and difficulties (e.g., Davis, 1989; Venkatesh and Bala, 2008). PU and PEOU in turn have an impact on the attitude toward using a technology (ATT), which in the TAM determines the behavioral intention to actually use a technology (Davis, 1987; Davis et al., 1989). Additionally, many potential explanatory factors that impact PU and PEOU have been studied, as noted by Abdullah and Ward (2016) and Rosli et al. (2022). One of the most commonly used is Perceived Enjoyment (PE), which is the degree to which an activity using a technology is perceived as enjoyable or pleasurable to itself, making it an intrinsic explanatory factor (Davis et al., 1992). Another potentially influencing external factor is technology affinity, which Franke et al. (2019) define as the way people approach technology, i.e., whether they actively seek interaction with it or tend to avoid it. Students’ self-reported technology affinity can be associated as a form of self-efficacy, which is also stated to be a common external factor by Abdullah and Ward (2016). A potential influence of technology affinity on behavioral intention to use a technology has been shown previously by Wong et al. (2020). While in the TAM the attitude toward the respective technologies used serves as an affective response component, there is a scale by Sindermann et al. (2021) that explicitly measures the attitude toward artificial intelligence (ATAI). The scale distinguishes between a fear factor and an acceptance factor. Sindermann et al. (2021) use this scale to investigate the influence of ATAI on the willingness to use different technologies that work with AI, such as self-driving cars or voice assistants, and can demonstrate a correlation. Therefore, ATAI can also be classified as a potential influencing factor on technology acceptance in the context of AI applications.
The findings of Granić and Marangunić (2019) show that the TAM is the most widely used model for the survey of technology acceptance in the education sector. Various acceptance studies in this field have investigated the suitability of TAM for different learning technologies, such as mobile learning (Almaiah et al., 2016), e-learning (Šumak et al., 2011), or learning management systems in general (Eraslan Yalcin and Kutlu, 2019). However, the overwhelming majority of studies focus on learners in universities rather than schools (Granić and Marangunić, 2019). Also, to our knowledge, the TAM has not yet been used to study software acceptance in the context of behavioral biology and digital animal observation. Therefore, this study investigated students’ technology acceptance of authentic behavior evaluation software at an out-of-school student lab and the possible factors influencing this technology acceptance. In addition, potential effects of the student lab on attitudes toward artificial intelligence and technology affinity were examined.
The study was conducted as part of a behavioral biology laboratory day for students at the Goethe University Frankfurt am Main. The so called “KILab” is an extracurricular student lab where learners can experience behavioral biology research methods in a practical approach. The contents of the student lab are designed to fit the curriculum and can be linked to regular school lessons. The focus of the lab is on the analysis of behavioral data and the creation of ethograms. In addition, artificial intelligence is introduced as a current method for automating data analysis within behavioral biology. Thus, for the behavior analysis of the lab day different technologies were used.
Behavioral observation and the filling of ethograms was conducted using BORIS software (Friard and Gamba, 2016). Thus, learners use software that is suitable for use in educational settings due to its short learning curve (van der Marel et al., 2022) and that is frequently used in actual studies of behavioral biology (Wing et al., 2021; Burkhardt et al., 2022; Seyrling et al., 2022). For the lab day setting, video recordings of the common eland antelope (Tragelaphus oryx) were used. The videos were recorded by scientists as part of current research at Opel-Zoo Kronberg (Gübert et al., 2022), which should be emphasized in terms of the resulting authenticity of the data. The videos show the nocturnal behavior of individual animals over a period of 14 h. The behaviors to be described are limited to lying, standing, and sleeping. Sample images of the behaviors can be found in Supplementary Figure 2.
The student-friendly user interface Deep Learning of Behavior (DLoB) was specially developed to enable learners with no prior knowledge of programming to follow the individual steps of an automated data analysis of behavior recordings. DLoB offers the possibility to train networks for object recognition as well as to evaluate existing networks.
The student’s first work through steps of automated object recognition by using the Prepare, Train, and Evaluate function of the DLoB software as well as a third-party software called LabelIMG (Tzutalin, 2015). The Prepare function extracts image files from the video recordings, which are then manually annotated in LabelIMG (Figure 1). The image files and the corresponding annotations can subsequently be used in the Train step for the generation of object detection networks. Afterward, the Evaluate function offers the possibility to estimate the quality of the developed networks (Figure 2). Finally, the software Behavioral Observations by Videos and Images using Deep-Learning Software (BOVIDS) by Gübert et al. (2022) is integrated in DLoB. The processes of BOVIDS based on object detection and action classification networks are reproduced and visualized in DLoB. The learners can use BOVIDS through DLoB to automatically evaluate video recordings of an animal and then download the corresponding ethogram.
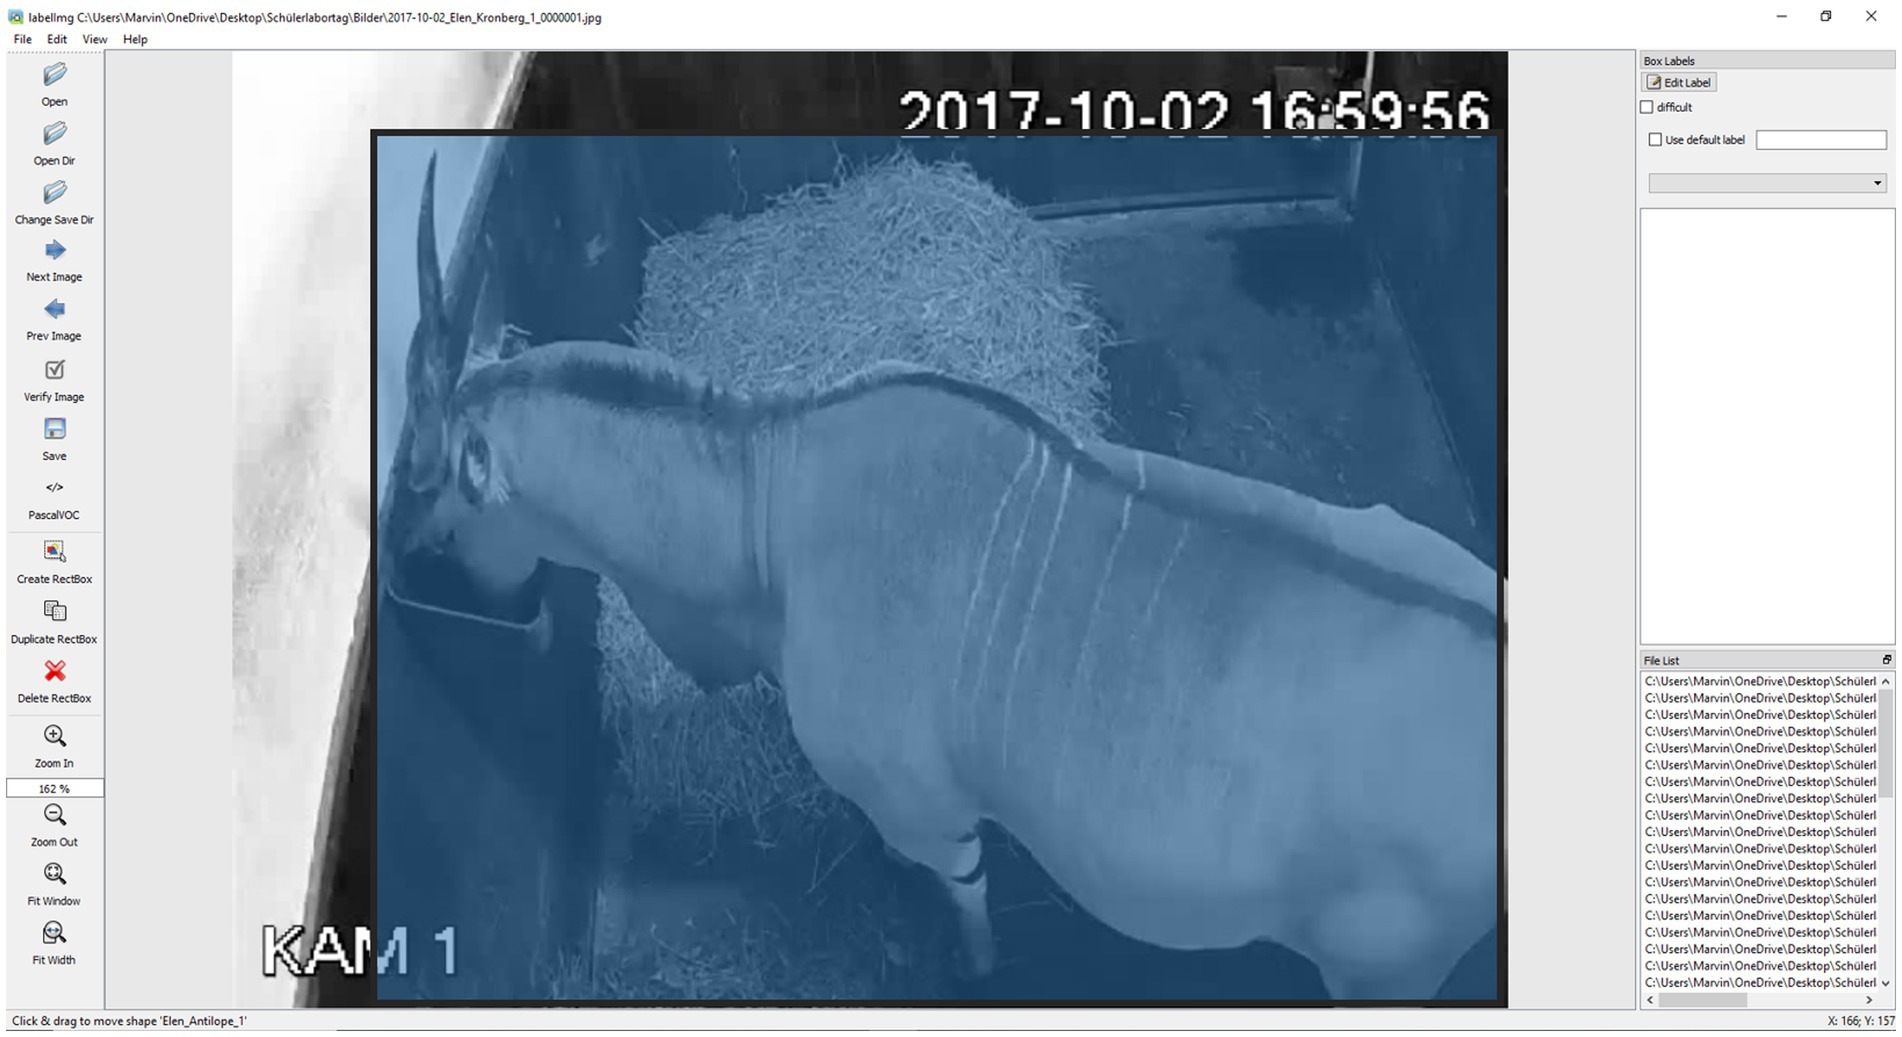
Figure 1. The graphical user interface (GUI) of LabelIMG (Tzutalin, 2015), which accesses image files of the common eland antelope. The annotation (blue square) is manually drawn in and saved including a default label.
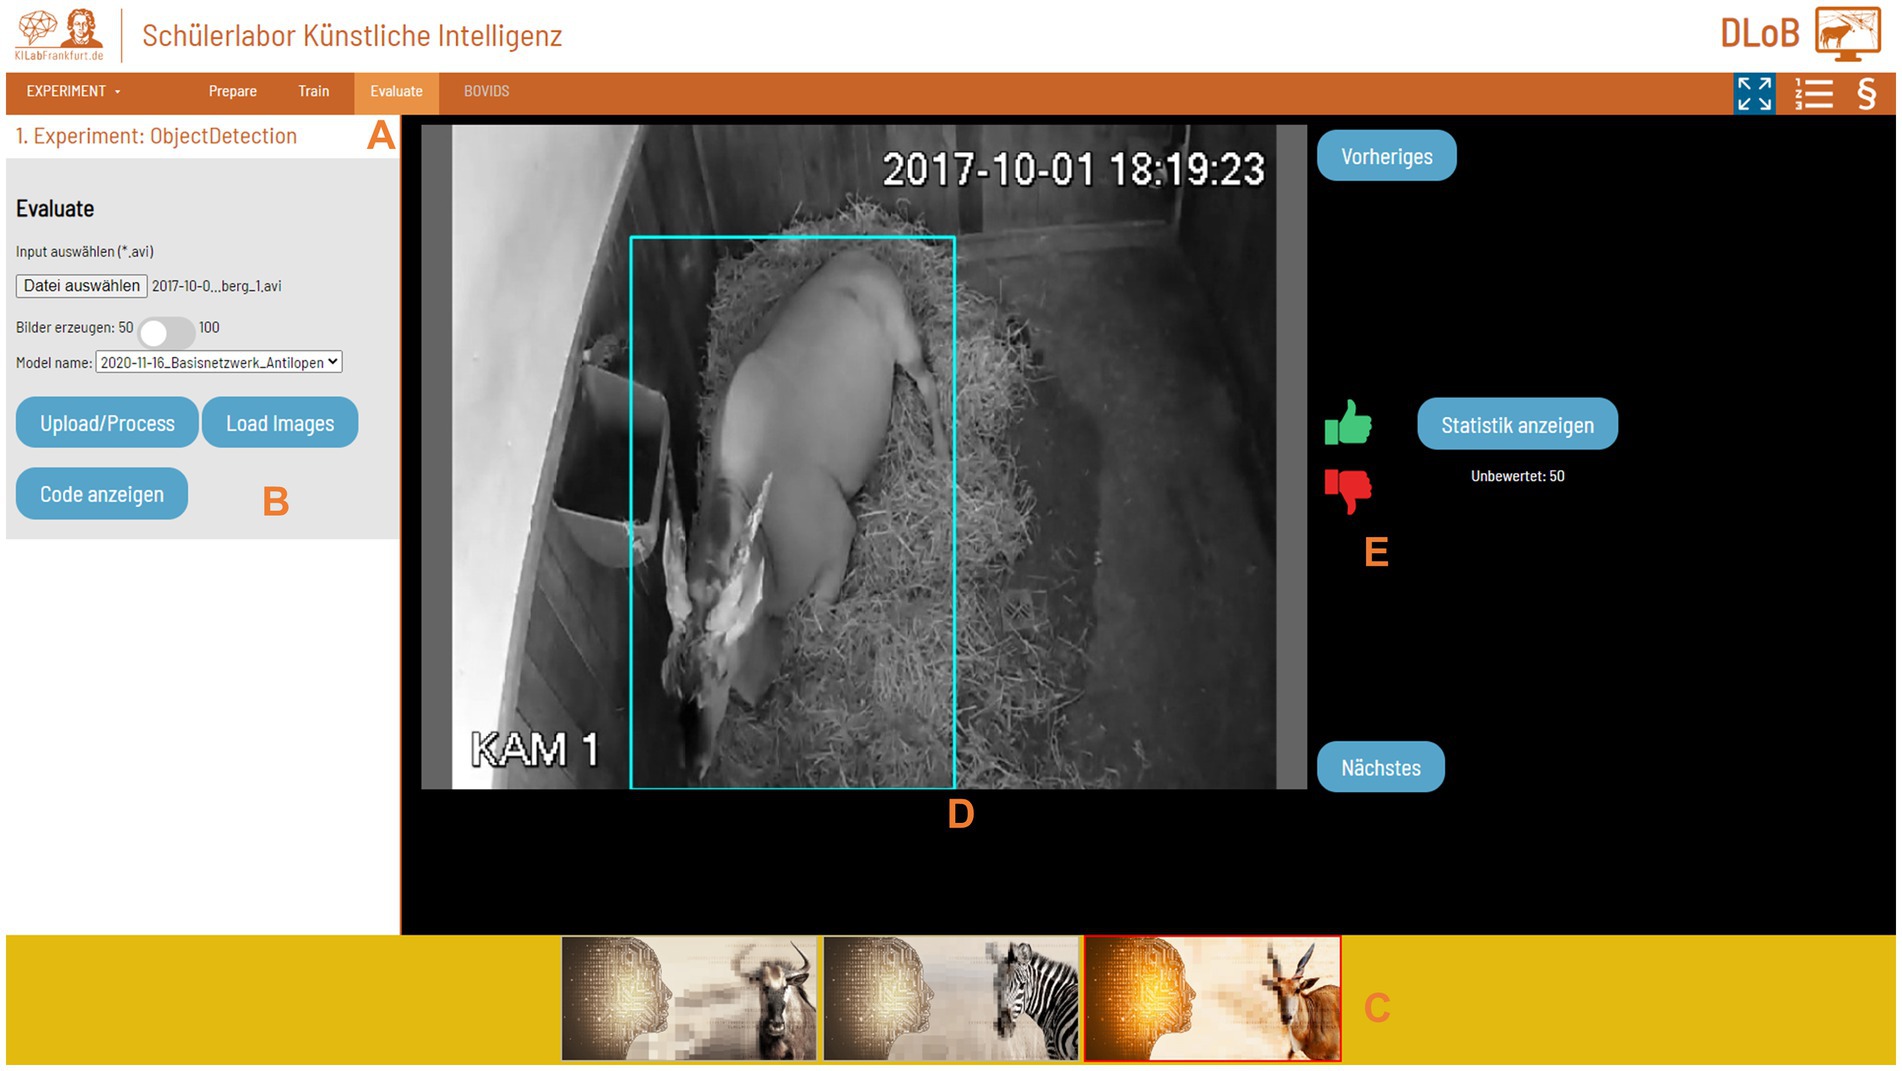
Figure 2. The graphical user interface (GUI) of the evaluation function in DLoB. The GUI includes: (A) a toolbar to select the desired function in of DLoB, (B) buttons to upload a video and select an object detection network to be evaluated, (C) a sidebar to select the animal that can be seen in the video, (D) an area that displays images of the selected video including the automatically generated annotation (blue square), and (E) buttons to evaluate the quality of the annotation and select the next or previous image.
The lab day starts with a collaborative introduction where the students observe a video sequence of giraffes as example animals and then describe their behavior. Afterwards, typical errors in the operator “describing behavior” are addressed, such as premature interpretations of behavior or anthropomorphic description (Margulis et al., 2001; Grove, 2011). Basic principles of behavioral biology, scientific methods, and the approach of hypothesis formation are also taught. For the first part of the day, an introduction to the BORIS software is provided. The duration of the video recording from the used research animal (eland antelope) is 14 h, which is why the video is divided into seven sections of 2 h each and analyzed by groups of two. The results of the groups are then consolidated and critically evaluated in terms of the total duration of the observation, the number of observed individuals and the experience of the observers (students).
The second part of the lab day presents the method of artificial intelligence for automated behavior observation. With the help of DLoB, the students work out the individual steps of automated data evaluation in order to finally be able to evaluate behavioral recordings of a common eland antelope with artificial intelligence. Subsequently, the advantages and disadvantages of using artificial intelligence are discussed and the automated data evaluation process is compared to the evaluation with BORIS.
For the study, a total of 171 students (36.8% male; 62.6% female; 0.6% diverse) were surveyed during their visit to the out-of-school student lab day at the Goethe-University Frankfurt. The students were German high school students with an age distribution from 17 to 21. Participation was advertised via the kilabfrankfurt.de website and was aimed at interested school classes with biology as a subject. Prior to participation, all participants, and additionally their parents in the case of minors, were informed in writing about the purpose of the study, the voluntary nature of participation and the anonymity of the questionnaire. Students who were already of legal age could fill out the consent form themselves. In case of a participation in the evaluations, a reduction of the participation fee for the student lab day took place. The reduction was applied to all participants, even if individuals did not participate in the evaluations. The survey took place from April 2022 to February 2023.
The Technology Acceptance Model (TAM) was applied to assess acceptance of the technologies used immediately after the student lab day (T2). In order to examine potential influencing factors on technology acceptance, the Attitude toward Artificial Intelligence scale (ATAI) and the Inclusion of Technology Affinity in Self scale (ITAS) were also collected. With regard to a potential influence of the student lab day on the students’ attitude toward AI and the students’ technology affinity, the scales were surveyed at two measurement points immediately before (T1) and after (T2) the student lab day via paper and pencil questionnaire. All scales can be found Supplementary Table 1 and Supplementary Figure 1.
For the survey on acceptance, a questionnaire aligned to the TAM was developed. For this purpose, items applicable to the used software were selected from four published studies and linguistically modified to fit the educational context (Davis, 1989; Venkatesh et al., 2003; Venkatesh and Bala, 2008; Sprenger and Schwaninger, 2021). In addition to the usual key components Perceived Usefulness (PU), Perceived Ease of Use (PEOU), and Attitude (ATT), the commonly used component Perceived Enjoyment (PE) was also evaluated (Abdullah and Ward, 2016). The overall scale used consists of 14 items rated on a five-point Likert scale.
Inclusion of Technology Affinity in Self scale is a graphical one-item measurement instrument to capture technology affinity developed by Henrich et al. (2022). Participants have to indicate on a scale of 1–7 which two differently overlapping circles best represent their technology affinity. In the studies by Hesse et al. (2020), Wong et al. (2020), and Yang et al. (2021), technology affinity and technology acceptance have already been linked through the interface of intended usage.
The five-item ATAI scale was developed by Sindermann et al. (2021) with the goal to investigate the influence of attitude toward artificial intelligence on the willingness to use different technologies that work with AI, such as self-driving cars and voice assistants. It comprises two factors, labeled fear toward artificial intelligence (ATAIF) and acceptance toward artificial intelligence (ATAIA). Participants rate each item on a Likert scale, ranging from 1 (strongly disagree) to 5 (strongly agree).
IBM SPSS 28 and IBM SPSS AMOS 28 were used for the statistical analysis of the collected data. Since the construct of technology acceptance has been operationalized as well as evaluated several times in the literature and, moreover, well-established items and components were used in this work (Davis, 1989; Venkatesh et al., 2003; Venkatesh and Bala, 2008; Sprenger and Schwaninger, 2021), a confirmatory factor analysis (CFA) was performed to examine the factor structure of the TAM. The CFA was conducted using the core model of the TAM (Davis, 1985) with the components Perceived Usefulness, Perceived Ease of Use, and Attitude Toward Using as well as the external factor Perceived Enjoyment.
A CFA was also performed to confirm the factor structure of the ATAI data in our sample, using the two-factor solution presented by Sindermann et al. (2021). In both CFA, the maximum likelihood method was used as estimation method. In terms of general model fit, Kline (2015) as well as Beauducel and Wittmann (2005) recommend that at least the following indices should be reported: the model chi-squared, root-mean-squared error of approximation (RMSEA), comparative fit index (CFI), and standardized root-mean-residual (SRMR). Additionally, Cronbach’s alpha was calculated for the separated factors of TAM and ATAI and interpreted according to Cripps (2017, p. 109): unacceptable (0.5 > α) and excellent (α ≥ 0.9).
Normal distribution was tested using the Kolmogorov–Smirnov test and the Shapiro–Wilk test. Both showed a significant result for all data (p < 0.001), leading to the conclusion that a normal distribution cannot be assumed. Therefore, the Wilcoxon test was used to examine potential differences between survey time points T1 and T2 for ITAS and ATAI. For a more detailed examination of the results, the data of the learners were subsequently divided into three classifications within the respective variable ITAS, ATAIF, and ATAIA based on their reported scores for T1 (Table 1).
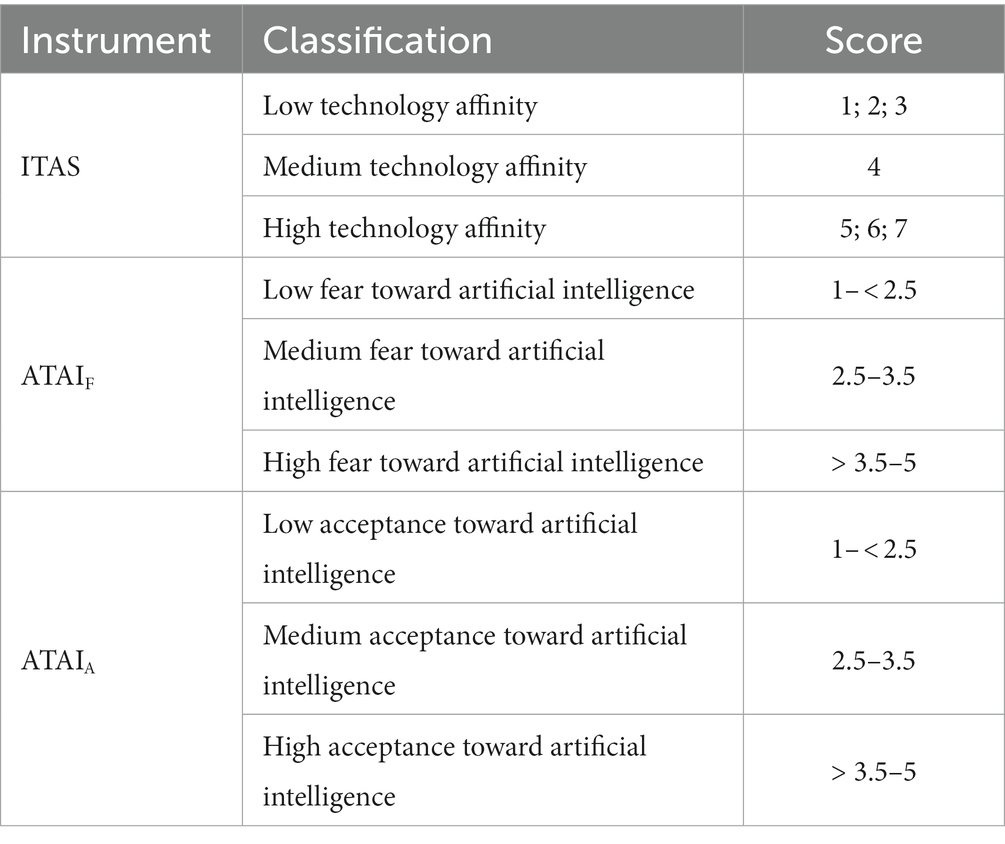
Table 1. Classifications within the respective variable ITAS, ATAIF, and ATAIA based on the reported scores.
To investigate potential influences of ITAS and ATAI on the TAM components, the Kruskal-Wallis test with post hoc comparison and Bonferroni correction was applied. For this purpose, the described classification, as shown in Table 1, was also adopted, but based on survey time point T2, given that this corresponds to the survey of TAM. For all significant results, the effect size was calculated using the formula (Fritz et al., 2012).
For the CFA, the TAM and the ATAI were analyzed with respect to their model fit. Table 2 shows the fit values of the calculation and the defined cut-off values. The fit values are in the mediocre to predominantly acceptable range. Thus, the models can be considered plausible and the results of the CFA can be analyzed.
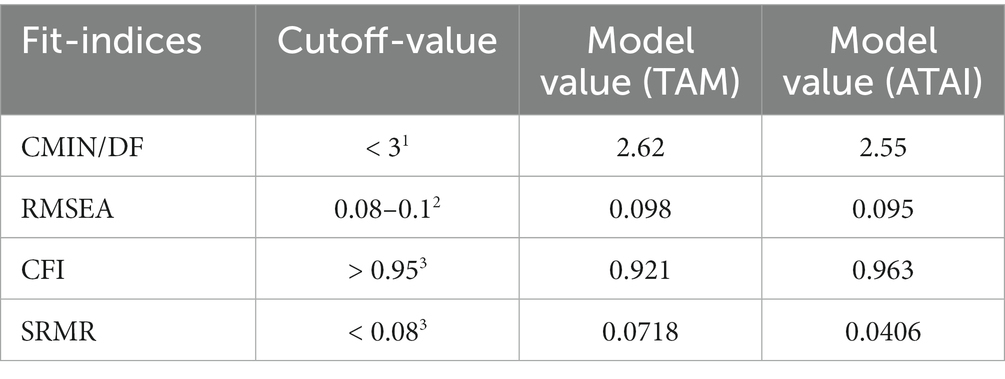
Table 2. Cut-off-values according to (1) Carmines and McIver (1983), (2) MacCallum et al. (1996), and (3) Hu and Bentler (1999).
The results of the CFA within the SEM for TAM show very good loadings of the individual items to the respective component (>0.63) and confirm the assumed factor structure. This also applies for the items of the ATAI (> 0.58) with the exception of one item (0.49). The exact factor loadings, the mean (M), and standard deviation (SD) of all items as well as the Cronbach alpha values (α) of the factors can be found in Table 3.
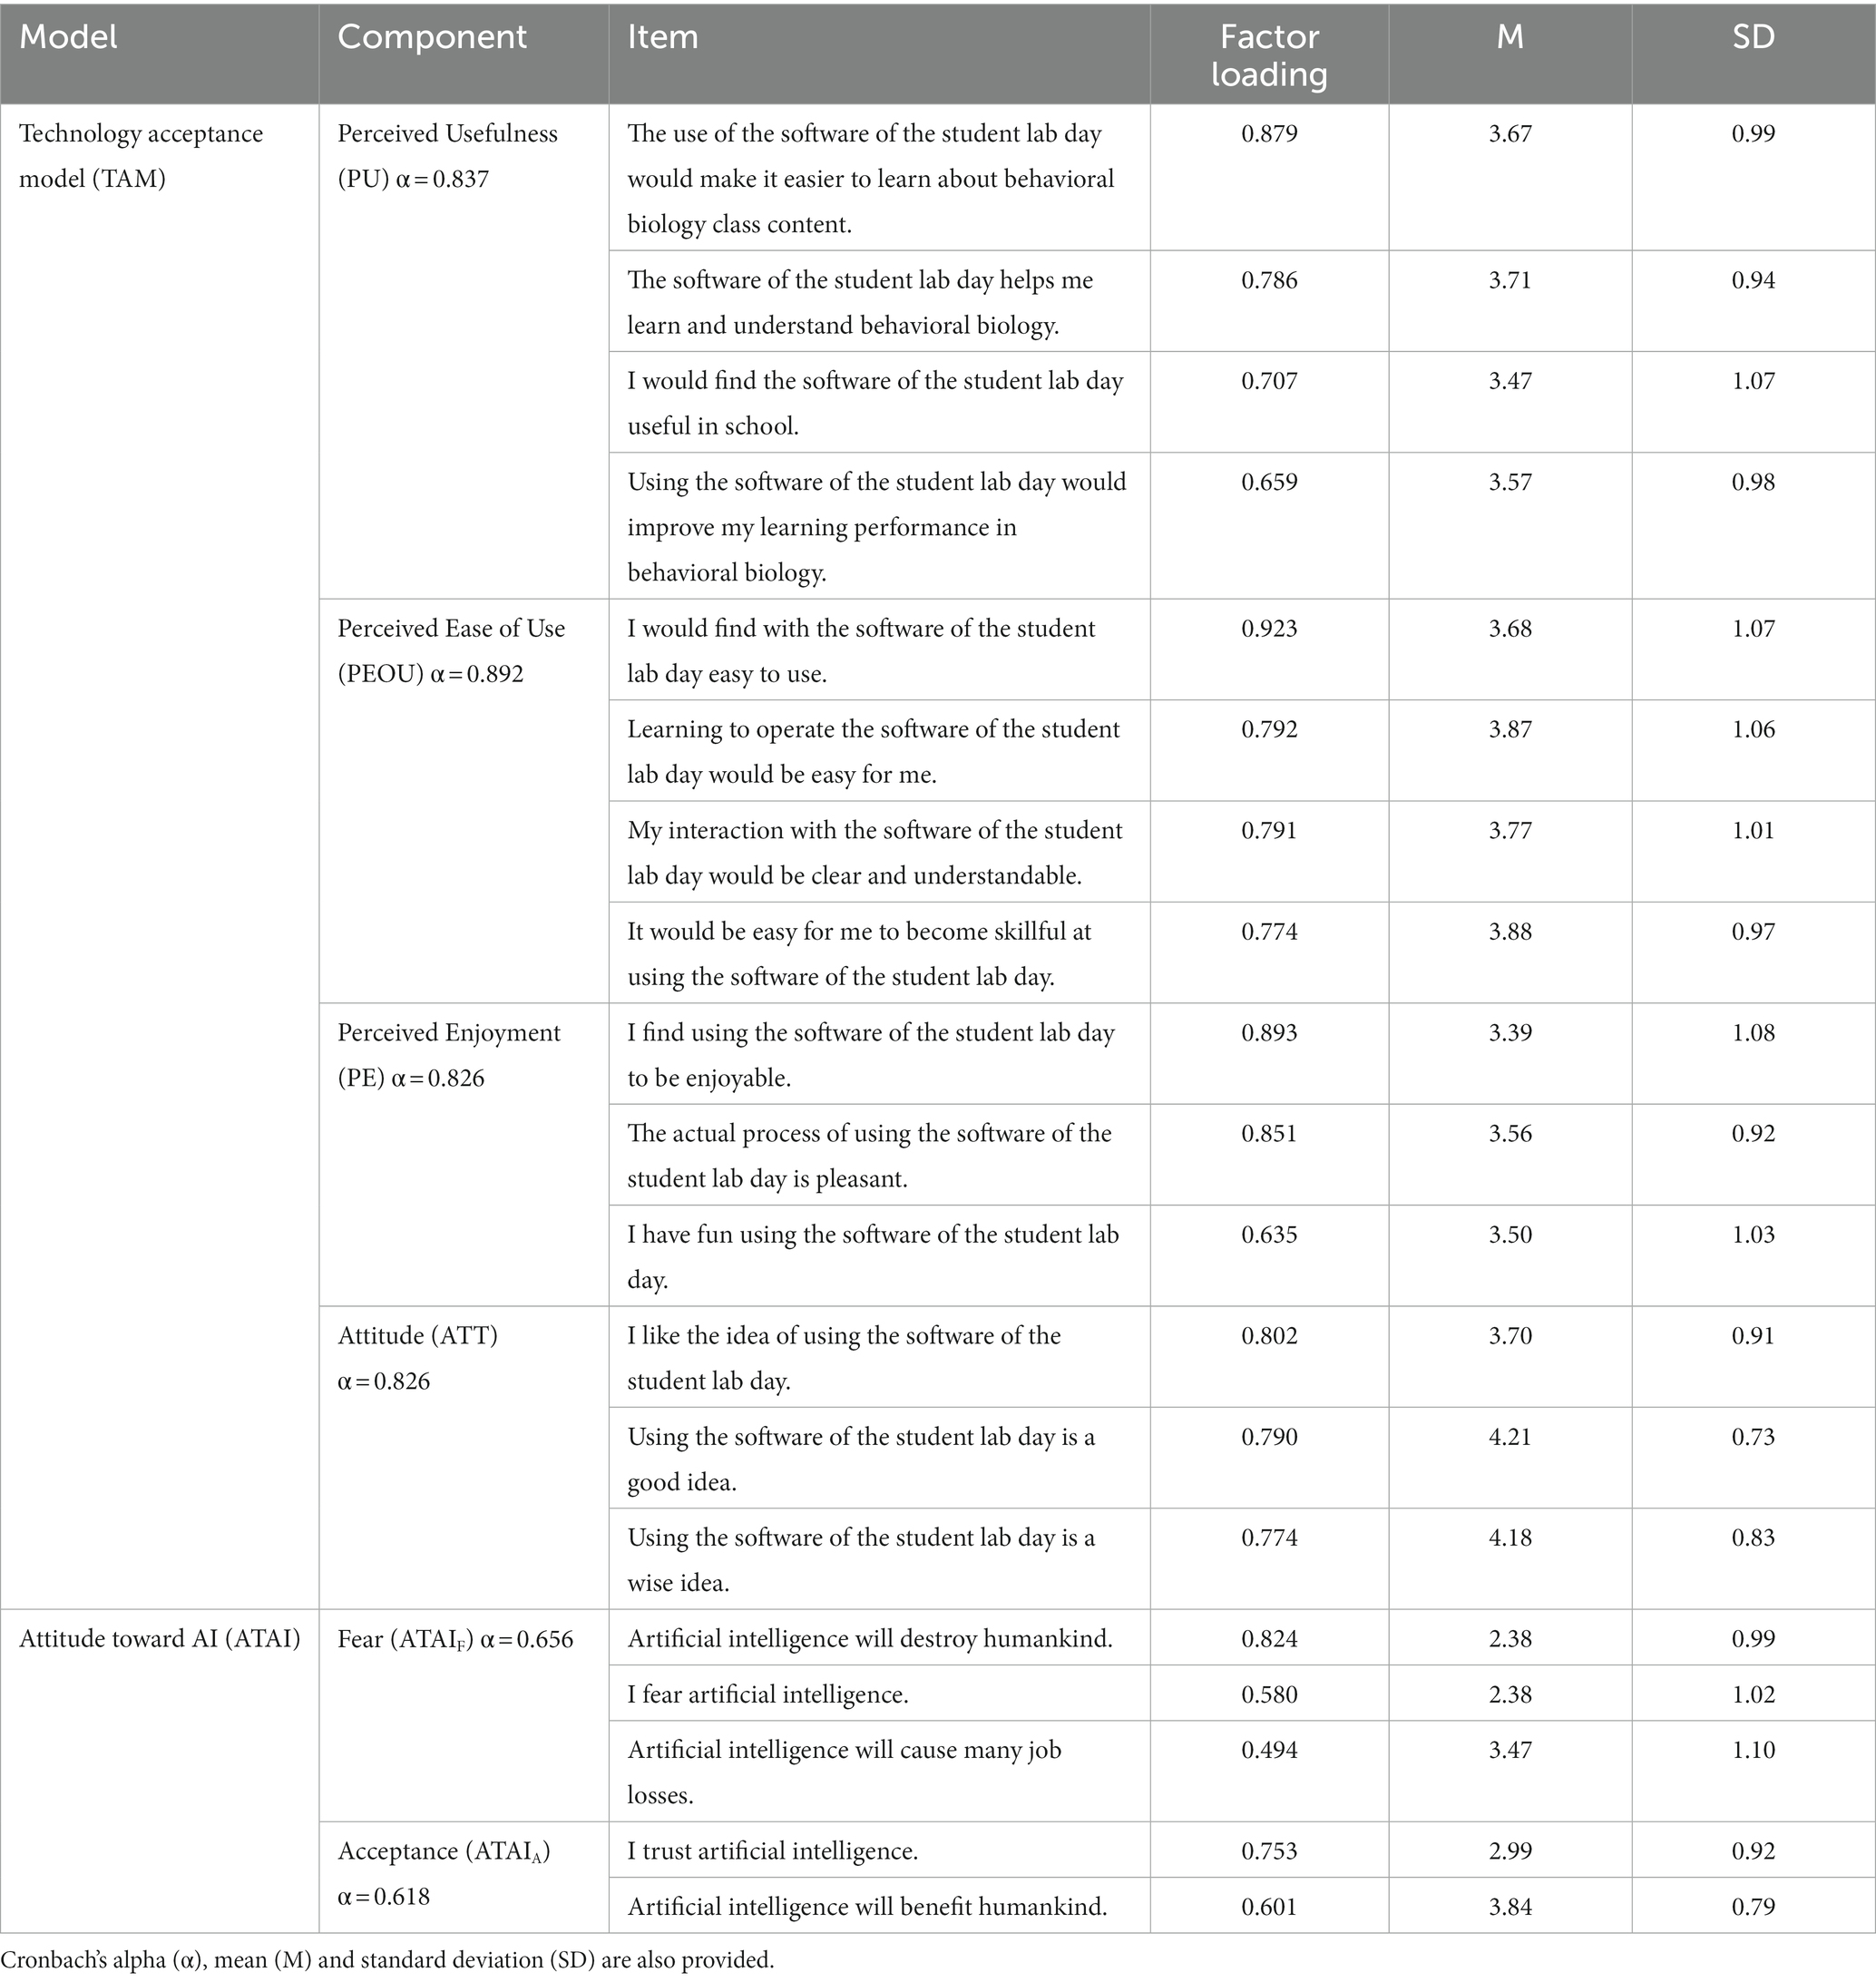
Table 3. Results of confirmatory factor analysis of the 14 items of Technology Acceptance Model (TAM) and the five items of the Attitude toward AI scale.
Regarding the comparison of the survey time points T1 and T2, Figure 3 shows that significant differences could be found for ITAS (p = 0.009; r = 0.2) as well as for ATAIF (p < 0.001; r = 0.28) and ATAIA (p < 0.001; r = 0.36). On the one hand, for ITAS, there is a decrease (∆ = −0.19) from T1 (M = 4.51; SD = 1.08) to T2 (M = 4.32; SD = 1.17). On the other hand, there is a decrease (∆ = −0.18) from T1 (M = 2.92; SD = 0.76) to T2 (M = 2.74; SD = 0.80) for ATAIF and an increase (∆ = 0.25) from T1 (M = 3.17; SD = 0.70) to T2 (M = 3.42; SD = 0.73) for ATAIA.
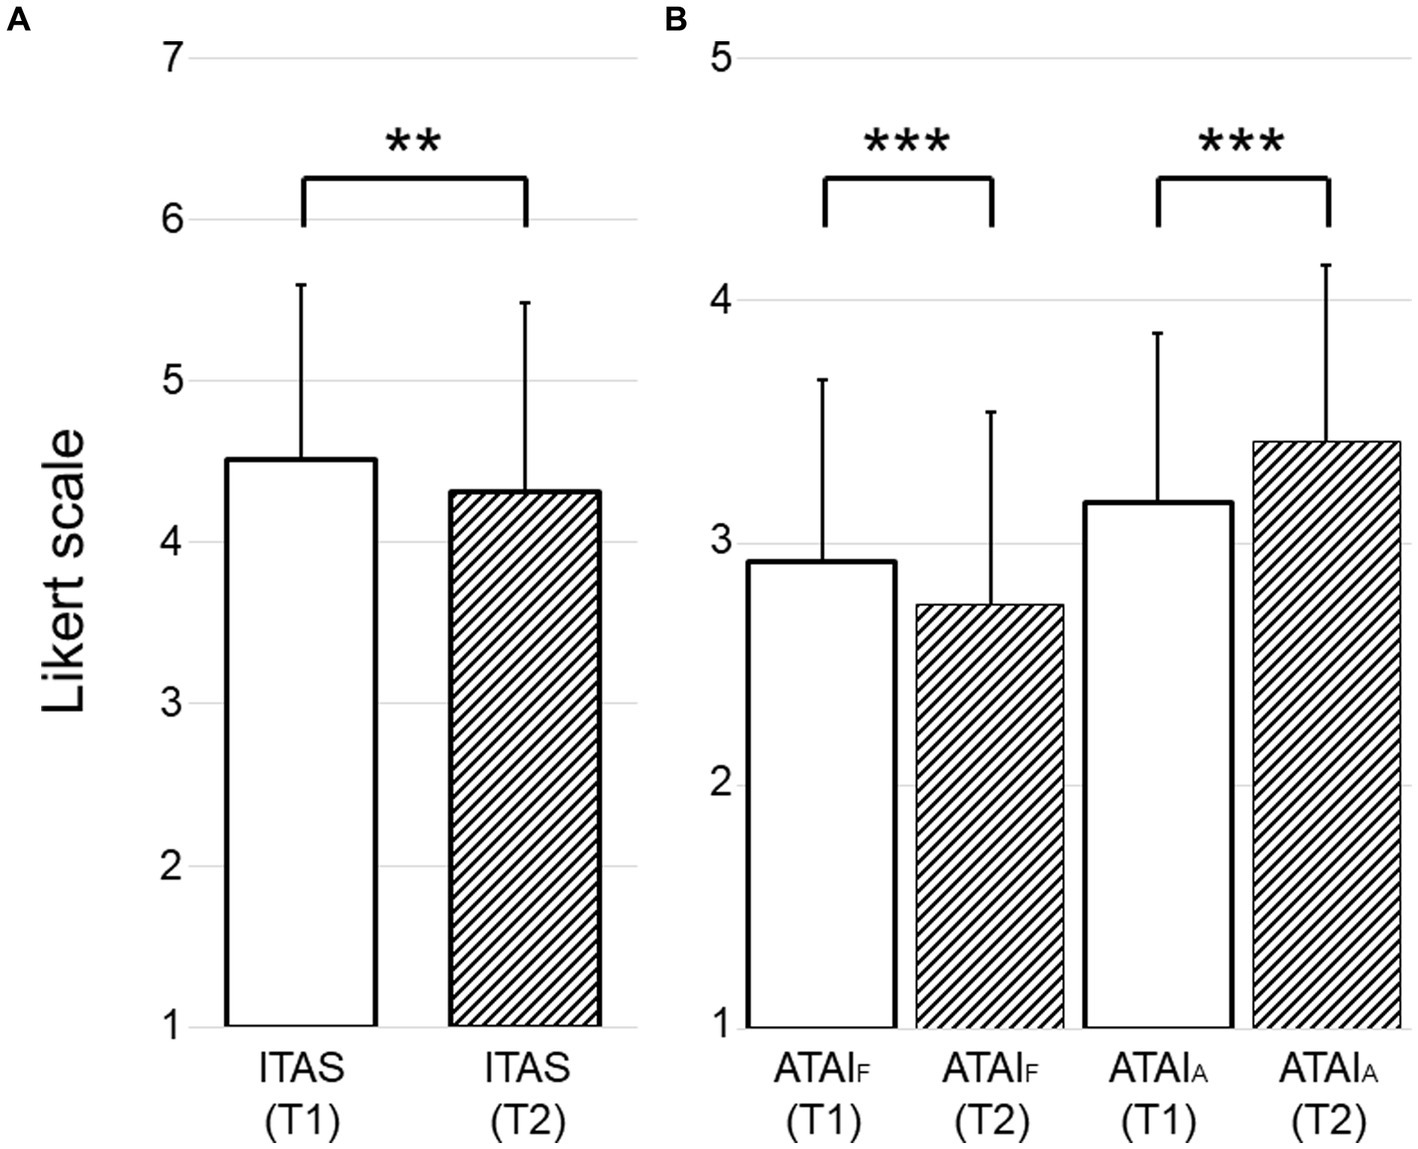
Figure 3. Mean comparisons of the survey before (T1, filled bars) and after (T2, shaded bars) the student lab day in relation to (A) ITAS and (B) ATAIF and ATAIA. Significance levels: **p < 0.01; ***p < 0.001 (Wilcoxon test).
Considering the data classified into three groups based on the T1 value (Table 1) allows a more differentiated statement. Figure 4 shows the groups and their changes in the case of ITAS (Figure 4A), ATAIF (Figure 4B), and ATAIA (Figure 4C).
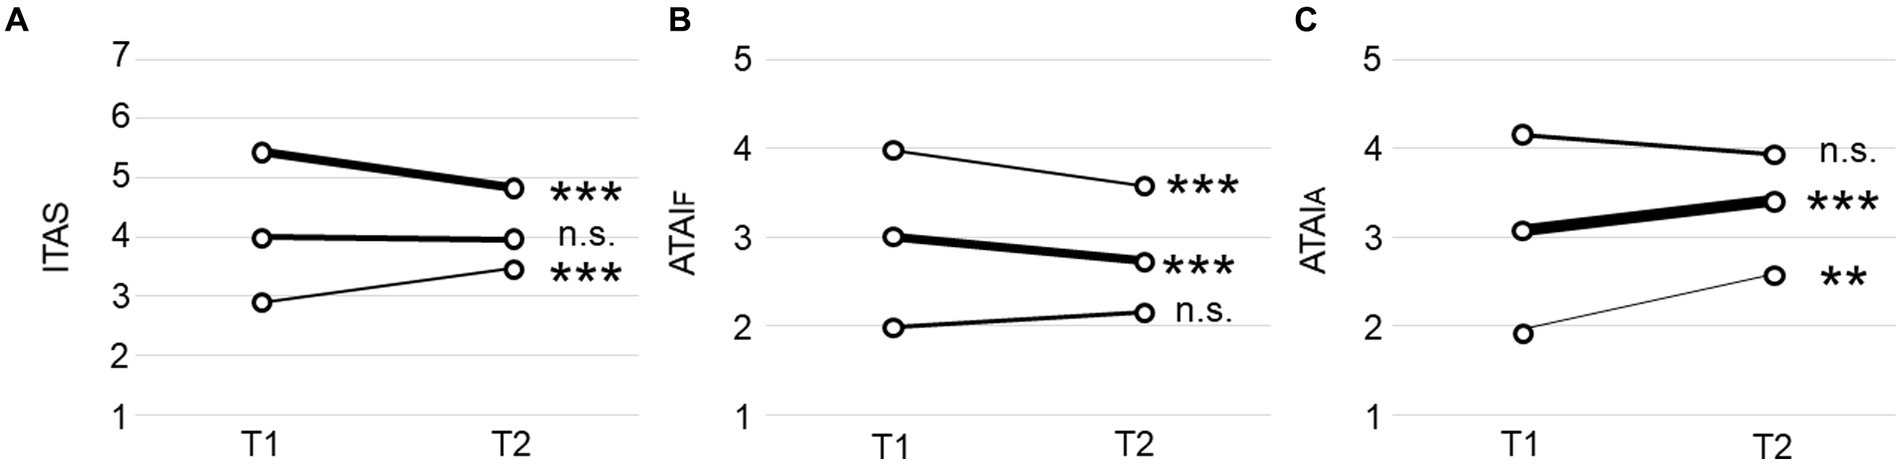
Figure 4. Change in (A) technology affinity (ITAS), (B) fear of AI (ATAIF), and (C) acceptance of AI (ATAIA) between survey time T1–T2 depending on the reported scores for T1. Significance levels: **p < 0.01; ***p < 0.001 (Wilcoxon test). The line thickness of the graphs was normalized for each instrument based on the number of participants being represented in the subgroups.
Regarding ITAS, students with low technology affinity at the beginning of the student lab day show a significant mean increase of ∆ = 0.57. The opposite can be observed for students with high self-assessed technology affinity at the beginning of the lab day, as here a decrease of ∆ = −0.59 occurs. Students belonging to the medium technology affinity group at baseline show no significant changes between the two assessment time points (Figure 4A).
In the case of fear toward artificial intelligence (ATAIF), Figure 4B shows that both, students with initial medium fear and high fear show a significant decrease of ∆ = −0.28 and ∆ = −0.4. The small observable increase within students with low fear of artificial intelligence is not significant.
Regarding the changes in acceptance toward AI (ATAIA), it can be observed in Figure 4C that students with low acceptance toward artificial intelligence (ATAIA) show a significant mean increase of ∆ = 0.63. The same applies for students with medium acceptance of artificial intelligence with an increase of ∆ = 0.32. The small observable decrease within students with high acceptance of artificial intelligence is not significant. The respective means, standard deviations, and effect sizes are included in Supplementary Table 2.
In the ungrouped expression of the four TAM components PU, PEOU, PE, and ATT, all medians are >3.5 and the low quartile is ≥3 for all components. The ATT component has the highest mean value (M = 4.03) and, together with PEOU, the highest median (MD = 4). Looking at the grouped distribution, TAM shows significant dependencies in all components for ITAS (Figure 5A) as well as ATAIA (Figure 5C). Regarding potential dependence on ATAIF, the distributions of PU (p = 0.215), PEOU (p = 0.617), PE (p = 0.278), and ATT (p = 0.293) are not significantly different in any case (Figure 5B).
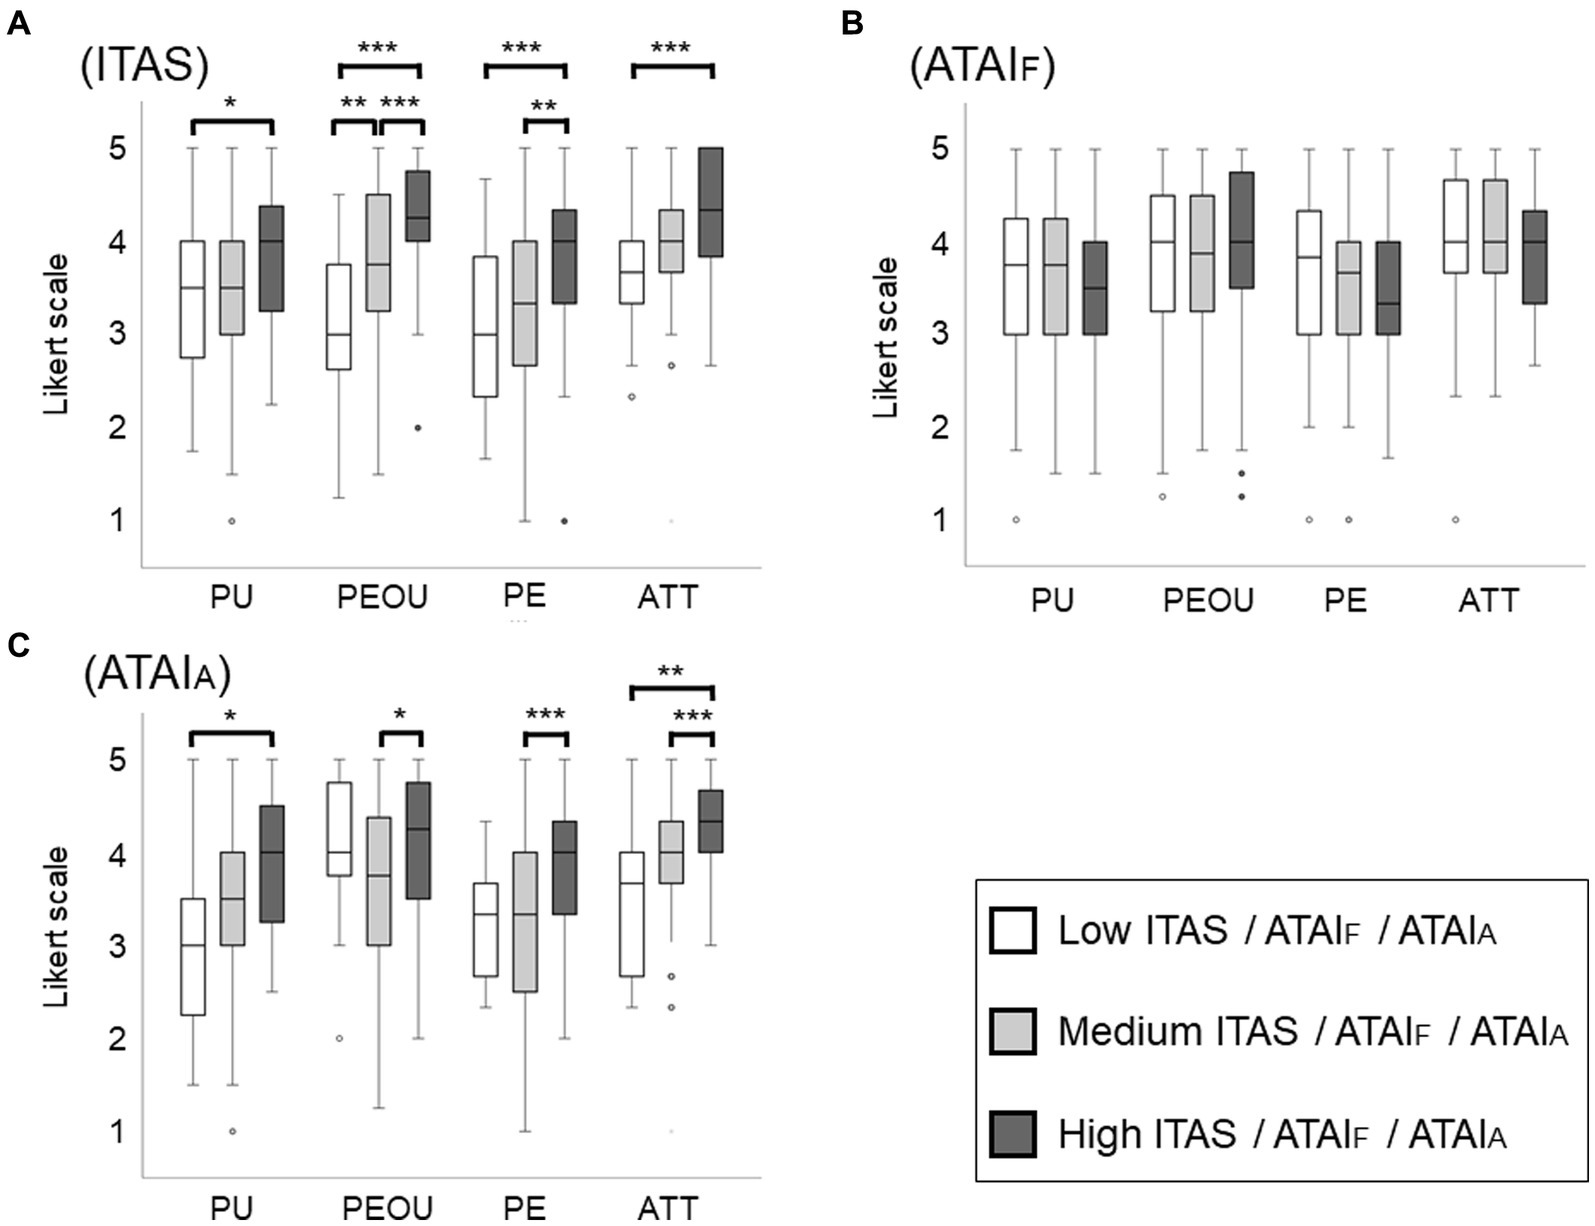
Figure 5. Evaluation of the TAM components Perceived Usefulness (PU), Perceived Ease of Use (PEOU), Perceived Enjoyment (PE), and Attitude (ATT) depending on the reported scores of (A) technology affinity (ITAS), (B) fear toward artificial intelligence (ATAIF), (C) acceptance of artificial intelligence (ATAIA) at survey time T2. Significance levels: *p < 0.05; **p < 0.01; ***p < 0.001 (Kruskal-Wallis-test with post-hoc comparison and Bonferroni correction).
The highly technologically affine students show higher values than the students with low technology affinity in the case of PU (p = 0.018; r = 0.21), PEOU (p < 0.001; r = 0.5), PE (p < 0.001; r = 0.34), and ATT (p < 0.001; r = 0.3). Regarding PEOU, there are additional significant differences between students with low and medium technology affinity (p = 0.003; r = 0.26) and between students with medium and high technology affinity (p < 0.001; r = 0.3). The latter can also be observed for PE (p = 0.008; r = 0.23). When grouping the students according to their attained acceptance toward AI, the differences turn out to be somewhat smaller. While within the components PEOU (p = 0.029; r = 0.2), PE (p < 0.001; r = 0.3), and ATT (p < 0.001; r = 0.32) differences occur between students with medium and high acceptance toward AI, within the component PU (p = 0.014; r = 0.22), a significant difference is found when comparing students with low and high acceptance toward AI. This is additionally observable for the component ATT (p = 0.002; r = 0.27).
Conducting digital behavioral observations with the help of video recordings or webcam observations is a practical approach which is able to overcome some of the limitations of direct on-site observation. Although some may argue that this method minimizes the authenticity of research, there are indeed numerous scientific studies that have been conducted using camera observations (Peluso et al., 2013; Caravaggi et al., 2017; Seyrling et al., 2022). However, for example, Miller et al. (2020) show that certain positive effects of an in-person experience could not be replicated through video observation. Additionally, it is important to avoid giving students the impression that exciting behavior can be reproduced at the push of a button, as is the case with selected sequences in nature documentaries. Generally, the different practical approaches should not be viewed as competing with each other, but ideally be combined in a beneficial way (Smith and Broad, 2008). For instance, correct observation, description, and interpretation can be practiced in the classroom using video recordings, so that time spent at extracurricular learning locations and the engagement with live animals in their natural habitats can be utilized more effectively.
However, in order for the digital behavioral monitoring approach to work, it is first and foremost important to have acceptance toward the digital tools as a basis for actual use (Estriégana et al., 2019). In the conducted study, the acceptance for the used software in the context of behavioral biology and animal observation was measured after the laboratory day. A baseline survey before the laboratory day or the implementation of a control group was not possible in this study as the TAM requires the first time use of a technology. In response, we therefore also surveyed more general instruments such as technology affinity and attitudes toward AI, which were surveyed both before and after the student lab, as recommended by Formella-Zimmermann et al. (2022). Factor analysis, Cronbach’s alpha values, and model fits confirm the applicability of the TAM and ATAI scales to the data set of this study.
Looking at the results of the technology affinity survey at T1, it is noticeable that the average initial self-assessment of the students is already in the positive evaluation range (M = 4.51; SD = 1.08; scale 1–7). This speaks to a student body that can be predominantly classified as highly affine to technology. This is similar to the results of Franke et al. (2019), who surveyed students using a nine-item scale (Affinity for technology interaction scale, ATI ranging from 1 to 6) and obtained a mean score of 3.78 ± 0.87. People with high technology affinity tend to embrace technology and are positive about interacting with technology (Jin and Divitini, 2020). Since science classes in particular are suitable for incorporating technology (Dani and Koenig, 2008; Lewis, 2014; Kramer et al., 2019), high technology affinity provides a good starting point for interacting with it.
Our results on the change in technology affinity at T2 show a small but significant negative influence of the use of technologies for digital behavioral observation in the context of the conducted student lab day. However, a more differentiated picture is obtained if students with high and low technology affinity are considered separately. Here it can be seen that the decrease in technology affinity occurs in the students with high initial values and the students with low T1 values show a significant increase in their technology affinity, in both cases with a high effect size. The increase in technology affinity with low affinity as a starting point could be due to students initially underestimating their performance (van de Watering and van der Rijt, 2006), but noticing an increase in their technology affinity as a result of successfully using the software on student lab day. The decrease in students with high affinity could be due to the fact that their initial assessed affinity for technology is related to the technical systems they are familiar with, as existing skills for interacting with similar systems directly facilitate coping by reducing adaptation demands (Franke et al., 2019). It is possible that the use of software for digital behavior observation and the method of artificial intelligence is so novel that adaptation requirements as well as unexpected difficulties arise here and thus lead to a revision of the self-assessed affinity for technology.
Factor analysis, Cronbach’s alpha values, and model fits confirm the applicability of the ATAI scale to the data set of this study. The item regarding job loss on the ATAI scale has a slightly lower factor loading than the remaining. This suggests that the statement regarding artificial intelligence and the resulting job loss is not exclusively attributable to the fear factor. This phenomenon can also be observed in the study by Sindermann et al. (2021). The authors justify the charge with the fact that the general threat of a job loss is relatively unlikely for the respondents and is thus not associated with artificial intelligence in the first place. Additionally, some also argue that artificial intelligence is able to create new job opportunities (Wilson et al., 2017).
In general, people differ in their attitudes toward artificial intelligence (Sindermann et al., 2021). However, it is striking that for our dataset at T1, about the same number of students can be classified into the group of high fear values (N = 35) as into the group of high acceptance values (N = 34). On average, the values for acceptance (M = 3.17; SD = 0.70) are somewhat higher than those for fear (M = 2.92; SD = 0.76).
With regard to the influence of the student lab day and the associated use of software on the attitude toward artificial intelligence, opposite effects are found within the two factors ATAIF and ATAIA. Fear of artificial intelligence generally decreases, with this effect occurring most strongly among students with high anxiety scores at baseline (∆ = −0.4). At the same time, acceptance of artificial intelligence generally increases, which is particularly evident among students with initially low acceptance scores (∆ = 0.63). The reduction of fears as well as the promotion of acceptance can thus be fostered by addressing artificial intelligence and its use in a relevant application area, as this increases the knowledge about artificial intelligence. Similar effects could be found in other studies regarding attitudes of students (Zhu and Xie, 2015; Oražem et al., 2021). The tendency of KILab to have a positive effect on student’s attitude toward artificial intelligence is also supported by the fact that students with already low anxiety or high acceptance did not significantly revise their attitudes.
While the influence of software use on ITAS and ATAI has already been discussed, the basic prerequisite for a successful implementation of software programs is acceptance on the part of the students. Among other things, acceptance is also associated with motivational components (Lee et al., 2005; Formella-Zimmermann et al., 2022), from which it can be deduced that high acceptance values correspond to high motivation regarding the use of a software. Factor analysis, Cronbach’s alpha values, and model fits confirm the applicability of the TAM to the data set of the present study.
Due to the high median values (> 3.5), which indicate a positive evaluation range, the acceptance of the software of the student lab day can be regarded as sufficient considering the different components PU, PEOU, PE and ATT. The value of the 1st quartile (≥ 3) also indicates a high level of technology acceptance, since 75% of the students are in the positive range of technology acceptance. The highest average value is achieved by the component ATT, which can be considered positive for the potential behavioral intention to use the software (Davis, 1987; Davis et al., 1989). With regard to the quality of the software, the very good PU and PEOU values should be noted in particular, as studies have shown that these are directly influenced by the quality of the learning content (Khor, 2014; Almaiah et al., 2016).
Implementing new variables to explain technology acceptance is frequently performed in the TAM (Cheung and Vogel, 2013; Abdullah and Ward, 2016). The relationship between technology affinity and technology acceptance has been shown in previous studies (Hesse et al., 2020; Wong et al., 2020; Yang et al., 2021). In relation to our findings, it appears that technology affinity can act as a predictor of subsequent technology acceptance. Students with high technology affinity show higher technology acceptance after conducting the student lab day than students with low technology affinity. The influence on the PEOU component is particularly significant, with effect sizes of up to r = 0.5. This is not particularly surprising, as high technology affinity and a highly PEOU can both be associated with few perceived problems while interacting with technology (Davis, 1989; Jin and Divitini, 2020). Because of the influence of technology affinity on technology acceptance, it is potentially possible to predict how acceptance will play out with individual students even before software is integrated into educational settings. This allows for staged assistance and better preparation in dealing with technology in general. It should also be mentioned at this point that even the classification in low technology affinity on average shows technology acceptance values in the positive evaluation range (M > 3). Accordingly, low technology affinity should not be a fundamental obstacle to the introduction of technology into the classroom.
Since the student lab day also addresses artificial intelligence in addition to behavioral biology content and this is picked up in the software LabelIMG as well as DLoB, the potential influence of ATAI on technology acceptance is also of interest. Thereby, it seems to be primarily ATAIA that generally influences technology acceptance toward the software of the student lab day. Students with higher acceptance toward artificial intelligence also show higher acceptance toward the technology used. The effect sizes here are in the small to medium range (r = 0.2–0.3). The factor ATAIF has no significant influence, which is positive, since even students with fear of artificial intelligence can develop acceptance toward corresponding software solutions in an adequate learning environment. For comparison, the influence of related forms of anxiety, such as computer anxiety or general anxiety, has been documented differently in recent studies. While Abdullah and Ward (2016) and Hu et al. (2022) state a negative influence of anxiety on PU or PEOU, NuriAbdallah (2019) could not find any impact of anxiety as computer use has become a normal issue according to the authors. This makes it all the more remarkable that the comparatively less commonly used technology of artificial intelligence also shows no significant influence on technology acceptance.
The software of the student lab day was evaluated in its entirety. Thus, we cannot differentiate the statements regarding LabelIMG, BORIS, and DLoB. Future investigations should additionally survey the software individually, so that a more detailed evaluation is possible. Furthermore, we tested the student lab day primarily in high school. Therefore, statements for younger students are not possible. Our results show that in the context of teaching behavioral biology there is a positive acceptance toward the software used and that it can be used accordingly in class. In addition to live observations or, for example, zoo visits, the use of the software corresponds to a further possibility for the practical teaching of behavioral biology in the classroom. However, the mere existence of this possibility does not guarantee that teachers will use it. It therefore remains to be seen to what extent software for behavior analysis will actually be introduced into the classroom. For further research, it would be interesting to also evaluate teachers, as their technology acceptance will determine whether or not they incorporate digital tools into their teaching practices (Antonietti et al., 2022).
To address difficulties in understanding about behavioral biology, the teaching of behavioral biology should embrace a practical approach that provides students with repeated opportunities to practice recognizing and describing behavior. Therefore, this study implemented video recordings obtained from cameras installed in zoos into the classroom and used different software to analyze those recordings. To investigate the perception of the software on the part of the students, their technology acceptance toward the use of the software was surveyed. Overall, this study shows a generally positive perception as students achieved high technology acceptance scores. Thereby, a dependency of technology acceptance on the factors technology affinity and acceptance toward artificial intelligence was shown, whereas the fear of artificial intelligence had no influence. In addition, the use of the software on the student lab day had an impact on the students’ self-assessment of technology affinity and attitude toward artificial intelligence. In summary, our results show that there is sufficient technology acceptance on the part of the students toward the software used to implement it in the classroom. Thus, the mentioned advantages of modern, technically supported methods of behavioral biology can take effect and the implementation of a practical approach can be extended by another possibility. However, although the use of video recordings and software can be seen as rewarding in the context of behavioral biology teaching, it should not be considered as the only possibility of a practical approach.
The raw data supporting the conclusions of this article will be made available by the authors, without undue reservation.
The studies involving humans were approved by Ethics committee of the science didactic institutes and departments (FB 13,14,15) of the Goethe University Frankfurt am Main. The studies were conducted in accordance with the local legislation and institutional requirements. Written informed consent for participation in this study was provided by the participants' legal guardians/next of kin.
MH, JG, SF-Z, and PD: conceptualization. MH: data collection and writing—original draft. MH, SF-Z, and PD: methodology and writing—review and editing and visualization. MH and SF-Z: validation, formal analysis, and investigation. PD: funding acquisition and supervision. All authors contributed to the article and approved the submitted version.
This study was financially supported by Klaus Tschira Stiftung gGmbH (project funding number 00.007.2020).
The authors thank the von Opel Hessische Zoostiftung, whose financial help through the Opel-Zoo foundation professorship in zoo biology made the programming of the BOVIDS software and the collection of behavioral data possible. Here, we would especially like to thank Max Hahn-Klimroth, for his assistance in programming the software. The authors would also like to thank the Klaus Tschira Stiftung gGmbH, which contributed to the success of the project through its financial support.
The authors declare that the research was conducted in the absence of any commercial or financial relationships that could be construed as a potential conflict of interest.
All claims expressed in this article are solely those of the authors and do not necessarily represent those of their affiliated organizations, or those of the publisher, the editors and the reviewers. Any product that may be evaluated in this article, or claim that may be made by its manufacturer, is not guaranteed or endorsed by the publisher.
The Supplementary material for this article can be found online at: https://www.frontiersin.org/articles/10.3389/feduc.2023.1216318/full#supplementary-material
Abdullah, F., and Ward, R. (2016). Developing a general extended technology acceptance model for E-learning (GETAMEL) by analysing commonly used external factors. Comput. Hum. Behav. 56, 238–256. doi: 10.1016/j.chb.2015.11.036
Almaiah, M. A., Jalil, M. A., and Man, M. (2016). Extending the TAM to examine the effects of quality features on mobile learning acceptance. J. Comput. Educ. 3, 453–485. doi: 10.1007/s40692-016-0074-1
Ambrosino, C. M., and Rivera, M. A. J. (2022). Using ethological techniques and place-based pedagogy to develop science literacy in Hawaiʻi’s high school students. J. Biol. Educ. 56, 3–13. doi: 10.1080/00219266.2020.1739118
Antonietti, C., Cattaneo, A., and Amenduni, F. (2022). Can teachers’ digital competence influence technology acceptance in vocational education? Comput. Hum. Behav. 132:107266. doi: 10.1016/j.chb.2022.107266
Balcombe, J. P. (2000). The Use of Animals in Higher Education: Problems, Alternatives, & Recommendations. Public Policy Series. 1st Edn Washington, DC, USA: Humane Society Press.
Beauducel, A., and Wittmann, W. W. (2005). Simulation study on fit indexes in CFA based on data with slightly distorted simple structure. Struct. Equ. Model. Multidiscip. J. 12, 41–75. doi: 10.1207/s15328007sem1201_3
Betancourt, I., and McLinn, C. M. (2012). Teaching with the macaulay library: an online archive of animal behavior recordings. J. Microbiol. Biol. Educ. 13, 86–88. doi: 10.1128/jmbe.v13i1.382
Burkhardt, F. K., Hayer, J. J., Heinemann, C., and Steinhoff-Wagner, J. (2022). Drinking behavior of dairy cows under commercial farm conditions differs depending on water trough design and cleanliness. Appl. Anim. Behav. Sci. 256:105752. doi: 10.1016/j.applanim.2022.105752
Caravaggi, A., Banks, P. B., Burton, A. C., Finlay, C. M. V., Haswell, P. M., Hayward, M. W., et al. (2017). A review of camera trapping for conservation behaviour research. Remote Sens. Ecol. Conserv. 3, 109–122. doi: 10.1002/rse2.48
Carmines, E. G., and McIver, J. P. (1983). An introduction to the analysis of models with unobserved variables. Polit. Methodol. 9, 51–102.
Cheung, R., and Vogel, D. (2013). Predicting user acceptance of collaborative technologies: an extension of the technology acceptance model for e-learning. Comput. Educ. 63, 160–175. doi: 10.1016/j.compedu.2012.12.003
Collins, C., Quirke, T., McKeown, S., Flannery, K., Kennedy, D., and O’Riordan, R. (2019). Zoological education: can it change behaviour? Appl. Anim. Behav. Sci. 220:104857. doi: 10.1016/j.applanim.2019.104857
Cozens-Keeble, E. H., Arnold, R., Newman, A., and Freeman, M. S. (2021). It’s virtually summer, can the zoo come to you? Zoo Summer School engagement in an online setting. J. Zoolog. Bot. Gardens 2, 625–635. doi: 10.3390/jzbg2040045
Cripps, B. (2017). Psychometric testing: Critical perspectives. BPS textbooks in psychology. Hoboken, NJ: John Wiley & Sons Incorporated.
Curran, M. C., Siler, A., and Sherman, M. B. (2016). Do you see what I see? Using ethograms to observe animal behavior. Am. Biol. Teach. 78, 226–232. doi: 10.1525/abt.2016.78.3.226
Dani, D. E., and Koenig, K. M. (2008). Technology and reform-based science education. Theory Pract. 47, 204–211. doi: 10.1080/00405840802153825
Davis, F. D. (1985). A technology acceptance model for empirically testing new end user information systems: Theory and results dissertation. Sloan School of Management, Massachusetts. Institute of Technology.
Davis, F. D. (1987). User acceptance of information systems: The technology acceptance model (TAM) (Working Paper. University of Michigan, Michigan. School of Business Administration).
Davis, F. D. (1989). Perceived usefulness, perceived ease of use, and user acceptance of information technology. MIS Q. 13, 319–340. doi: 10.2307/249008
Davis, F. D., Bagozzi, R. P., and Warshaw, P. R. (1989). User acceptance of computer technology: A comparision of two theoretical models. Manag. Sci. 35, 982–1003. doi: 10.1287/mnsc.35.8.982
Davis, F. D., Bagozzi, R. P., and Warshaw, P. R. (1992). Extrinsic and intrinsic motivation to use computers in the Workplace1. J. Appl. Soc. Psychol. 22, 1111–1132. doi: 10.1111/j.1559-1816.1992.tb00945.x
Douali, L., Selmaoui, S., and Bouab, W. (2022). Artificial intelligence in education: fears and faiths. Int. J. Info. Educ. Technol. 12, 650–657. doi: 10.18178/ijiet.2022.12.7.1666
Eichhorst, B. (2018). Internet webcams provide opportunities for college student research on animal behavior and ecology. Am. Biol. Teach. 80, 680–685. doi: 10.1525/abt.2018.80.9.680
Eraslan Yalcin, M., and Kutlu, B. (2019). Examination of students' acceptance of and intention to use learning management systems using extended TAM. Br. J. Educ. Technol. 50, 2414–2432. doi: 10.1111/bjet.12798
Estriégana, R., Medina-Merodio, J.-A., and Barchino, R. (2019). Student acceptance of virtual laboratory and practical work: an extension of the technology acceptance model. Comput. Educ. 135, 1–14. doi: 10.1016/j.compedu.2019.02.010
Formella-Zimmermann, S., Kleespies, M. W., and Dierkes, P. W. (2022). Motivation and technology acceptance in a neuroscience student lab—an empirical comparison between virtual experiments with and without hands-on elements. Front. Educ. 7:817598. doi: 10.3389/feduc.2022.817598
Franke, T., Attig, C., and Wessel, D. (2019). A personal resource for technology interaction: development and validation of the affinity for technology interaction (ATI) scale. Int. J. Hum. Comput. Interact. 35, 456–467. doi: 10.1080/10447318.2018.1456150
Friard, O., and Gamba, M. (2016). BORIS: a free, versatile open-source event-logging software for video/audio coding and live observations. Methods Ecol. Evol. 7, 1325–1330. doi: 10.1111/2041-210X.12584
Fritz, C. O., Morris, P. E., and Richler, J. J. (2012). Effect size estimates: current use, calculations, and interpretation. J. Exp. Psychol. Gen. 141, 2–18. doi: 10.1037/a0024338
Gillie, L., and Bizub, A. L. (2012). In Darwin’s footsteps: an on and off-campus approach to teaching evolutionary theory and animal behavior. Bioscene 38, 15–21.
Granić, A., and Marangunić, N. (2019). Technology acceptance model in educational context: a systematic literature review. Br. J. Educ. Technol. 50, 2572–2593. doi: 10.1111/bjet.12864
Grove, P. (2011). Why should our students study animal behavior. Am. Biol. Teach. 73:206. doi: 10.1525/abt.2011.73.4.3
Gübert, J., Hahn-Klimroth, M., and Dierkes, P. W. (2022). Bovids: A deep learning-based software package for pose estimation to evaluate nightly behavior and its application to common elands (Tragelaphus oryx) in zoos. Ecol. Evol. 12:e8701. doi: 10.1002/ece3.8701
Hardin, A., and Schlupp, I. (2022). Using machine learning and DeepLabCut in animal behavior. Acta Ethol. 25, 125–133. doi: 10.1007/s10211-022-00397-y
Henrich, M., Kleespies, M. W., Dierkes, P. W., and Formella-Zimmermann, S. (2022). Inclusion of technology affinity in self scale—development and evaluation of a single item measurement instrument for technology affinity. Front. Educ. 7:970212. doi: 10.3389/feduc.2022.970212
Hesse, L. S., Walter, G., and Tietze, S. (2020). “Influence of personality, affinity for technology and risk awareness on technology acceptance using the example of voice control” in Mensch & Computer 2020. eds. F. Alt, S. Schneegass, and E. Hornecker (Magdeburg, Germany: MuC ’20: Proceedings of the Conference on Mensch und Computer).
Hu, L., and Bentler, P. M. (1999). Cutoff criteria for fit indexes in covariance structure analysis: conventional criteria versus new alternatives. Struct. Equ. Model. Multidiscip. J. 6, 1–55. doi: 10.1080/10705519909540118
Hu, X., Zhang, J., He, S., Zhu, R., Shen, S., and Liu, B. (2022). E-learning intention of students with anxiety: evidence from the first wave of COVID-19 pandemic in China. J. Affect. Disord. 309, 115–122. doi: 10.1016/j.jad.2022.04.121
Hughes, M., Bertram, S. M., Young, A. M., Merry, J. W., Kolluru, G. R., Dunlap, A. S., et al. (2021). Teaching animal behavior online: A primer for the pandemic and beyond. Ethology 127, 14–31. doi: 10.1111/eth.13096
Hummel, E., and Randler, C. (2012). Living animals in the classroom: A Meta-analysis on learning outcome and a treatment–control study focusing on knowledge and motivation. J. Sci. Educ. Technol. 21, 95–105. doi: 10.1007/s10956-011-9285-4
Jin, F., and Divitini, M. (2020). “Affinity for technology and Teenagers' learning intentions” in Proceedings of International Computing Education Research Conference (ICER’20). August 10–12; New Zealand, ACM. New York, NY, USA, 48–55.
Kabra, M., Robie, A. A., Rivera-Alba, M., Branson, S., and Branson, K. (2013). Jaaba: interactive machine learning for automatic annotation of animal behavior. Nat. Methods 10, 64–67. doi: 10.1038/nmeth.2281
Khor, E. T. (2014). An analysis of ODL student perception and adoption behavior using the technology acceptance model. Int. Rev. Res. Open Distribut. Learn. 15, 275–288. doi: 10.19173/irrodl.v15i6.1732
Kleespies, M. W., Feucht, V., Becker, M., and Dierkes, P. W. (2022). Environmental education in zoos—exploring the impact of guided zoo Tours on connection to nature and attitudes towards species conservation. J. Zoolog. Bot. Gardens 3, 56–68. doi: 10.3390/jzbg3010005
Kleespies, M. W., Gübert, J., Popp, A., Hartmann, N., Dietz, C., Spengler, T., et al. (2020). Connecting high school students with nature—how different guided Tours in the zoo Influence the success of extracurricular educational programs. Front. Psychol. 11:1804. doi: 10.3389/fpsyg.2020.01804
Kline, R. B. (2015). Principles and Practice of Structural Equation Modeling. 4th Edn New York: The Guilford Press.
Kramer, M., Förtsch, C., Aufleger, M., and Neuhaus, B. J. (2019). Der Einsatz digitaler Medien im gymnasialen Biologieunterricht. Zeitsch. Für Didak. Naturwissensch. 25, 131–160. doi: 10.1007/s40573-019-00096-5
Lee, M. K., Cheung, C. M., and Chen, Z. (2005). Acceptance of internet-based learning medium: the role of extrinsic and intrinsic motivation. Inf. Manag. 42, 1095–1104. doi: 10.1016/j.im.2003.10.007
Lewis, D. I. (2014). The Pedagogical Benefits and Pitfalls of Virtual Tools for Teaching and Learning Laboratory Practices in the Biological Sciences. Heslington: The Higher Education Academy.
Littman, P., and Moore, J. (2016). Using online content to study animal behavior. Am. Biol. Teach. 78, 323–327. doi: 10.1525/abt.2016.78.4.323
MacCallum, R. C., Browne, M. W., and Sugawara, H. M. (1996). Power analysis and determination of sample size for covariance structure modeling. Psychol. Methods 1, 130–149. doi: 10.1037/1082-989X.1.2.130
Margulis, S. W., Reiser, B. J., Dombeck, R., Go, V., Kyza, E. A., and Golan, R. (2001). “Behavior matters: Involving students in scientific investigations of animal behavior.” in Annual Meeting of the National Association for Research on Science Teaching. St. Louis.
McCleery, R. A., Lopez, R. R., Harveson, L. A., Silvy, N. J., and Slack, R. D. (2005). Integrating on-campus wildlife research projects into the wildlife curriculum. Wildl. Soc. Bull. 33, 802–809. doi: 10.2193/0091-7648(2005)33[802:IOWRPI]2.0.CO;2
Mench, J. (1988). Why it is important to understand animal behavior. ILAR J. 39, 20–26. doi: 10.1093/ilar.39.1.20
Miller, L. J., Luebke, J. F., Matiasek, J., Granger, D. A., Razal, C., Brooks, H. J. B., et al. (2020). The impact of in-person and video-recorded animal experiences on zoo visitors' cognition, affect, empathic concern, and conservation intent. Zoo Biol. 39, 367–373. doi: 10.1002/zoo.21565
Myers, O. E., Saunders, C. D., and Bexell, S. M. (2009). Fostering empathy with wildlife: factors affecting free-choice learning for conservation concern and behavior. Free Choice Learn. Environ. eds. J. H. Falk, J. E. Heimlich, and S. Foutz. (Lanham, MD: AltaMira Press) 39–56.
Ng, D. T. K., Leung, J. K. L., Chu, S. K. W., and Foutz, M. S. (2021). Conceptualizing AI literacy: an exploratory review. Comput. Educ. Artific. Intellig. 2:100041. doi: 10.1016/j.caeai.2021.100041
Ninaus, M., and Sailer, M. (2022). Closing the loop—the human role in artificial intelligence for education. Front. Psychol. 13:956798. doi: 10.3389/fpsyg.2022.956798
Nisbet, E. K., Zelenski, J. M., and Murphy, S. A. (2009). The nature relatedness scale. Environ. Behav. 41, 715–740. doi: 10.1177/0013916508318748
NuriAbdallah, S. A. (2019). Extend of TAM model with technology anxiety and self-efficacy to accept course websites at university Canada west. Int. J. Info. Technol. Lang. Stud. 3, 1–7.
Oražem, V., Smolej, T., and Tomažič, I. (2021). Students' attitudes to and knowledge of Brown bears (Ursus arctos L.): can more knowledge reduce fear and assist in conservation efforts? Animals 11:1958. doi: 10.3390/ani11071958
Peluso, A. I., Royer, E. A., Wall, M. J., and Anderson, M. J. (2013). The relationship between environmental factors and flamingo aggression examined via internet resources. Avian Biol. Res. 6, 215–220. doi: 10.3184/175815513X13740436033839
Randler, C., Hummel, E., and Wüst-Ackermann, P. (2013). The influence of perceived disgust on students’ motivation and achievement. Int. J. Sci. Educ. 35, 2839–2856. doi: 10.1080/09500693.2012.654518
Rault, J.-L., Elmore, M. R. P., Biehl, D. J., Russell, M. A., and Garner, J. P. (2013). The world is a natural laboratory, and social media is the new petri dish. Ethology 119, 803–806. doi: 10.1111/eth.12125
Reiss, M. J., and Beaney, N. J. (1992). The use of living organisms in secondary school science. J. Biol. Educ. 26, 63–66. doi: 10.1080/00219266.1992.9655245
Rodríguez-García, J. D., Moreno-León, J., Román-González, M., and Robles, G. (2020). “Introducing artificial intelligence fundamentals with LearningML” in Eighth international conference on technological ecosystems for enhancing Multiculturality (TEEM'20), Salamanca, Spain.
Rop, C. J. (2008). Cricket behavior: observing insects to learn about Science & Scientific Inquiry. Am. Biol. Teach. 70, 235–240. doi: 10.1662/0002-7685(2008)70[235:CBOITL]2.0.CO;2
Rosli, M. S., Saleh, N. S., Ali A, M., Abu Bakar, S., and Mohd Tahir, L. (2022). A systematic review of the technology acceptance model for the sustainability of higher education during the COVID-19 pandemic and identified research gaps. Sustain. For. 14:11389. doi: 10.3390/su141811389
Schütz, A. K., Krause, E. T., Fischer, M., Müller, T., Freuling, C. M., Conraths, F. J., et al. (2022). Computer vision for detection of body posture and behavior of red foxes. Animals 12:233. doi: 10.3390/ani12030233
Seyrling, I., Dierkes, P. W., and Burger, A. L. (2022). Diurnal and nocturnal behaviour of cheetahs (Acinonyx jubatus) and lions (Panthera leo) in zoos. Animals 12:2367. doi: 10.3390/ani12182367
Sindermann, C., Sha, P., Zhou, M., Wernicke, J., Schmitt, H. S., Li, M., et al. (2021). Assessing the attitude towards artificial intelligence: introduction of a short measure in German, Chinese, and English language. Künstliche Intellig 35, 109–118. doi: 10.1007/s13218-020-00689-0
Skibins, J. C., and Sharp, R. L. (2019). Binge watching bears: efficacy of real vs. virtual flagship exposure. J. Ecotour. 18, 152–164. doi: 10.1080/14724049.2018.1553977
Smith, L., and Broad, S. (2008). Comparing zoos and the media as conservation educators. Vis. Stud. 11, 16–25. doi: 10.1080/10645570801938392
Sprenger, D. A., and Schwaninger, A. (2021). Technology acceptance of four digital learning technologies (classroom response system, classroom chat, e-lectures, and mobile virtual reality) after three months’ usage. Int. J. Educ. Technol. High. Educ. 18, 1–17. doi: 10.1186/s41239-021-00243-4
Šumak, B., Heričko, M., and Pušnik, M. (2011). A meta-analysis of e-learning technology acceptance: the role of user types and e-learning technology types. Comput. Hum. Behav. 27, 2067–2077. doi: 10.1016/j.chb.2011.08.005
Taherdoost, H. (2018). A review of technology acceptance and adoption models and theories. Proced. Manufact. 22, 960–967. doi: 10.1016/j.promfg.2018.03.137
Tzutalin (2015). LabelIMG. Available at: https://github.com/tzutalin/labelImg
Valletta, J. J., Torney, C., Kings, M., Thornton, A., and Madden, J. (2017). Applications of machine learning in animal behaviour studies. Anim. Behav. 124, 203–220. doi: 10.1016/j.anbehav.2016.12.005
van de Watering, G., and van der Rijt, J. (2006). Teachers’ and students’ perceptions of assessments: A review and a study into the ability and accuracy of estimating the difficulty levels of assessment items. Educ. Res. Rev. 1, 133–147. doi: 10.1016/j.edurev.2006.05.001
van der Marel, A., O’Connell, C. L., Prasher, S., Carminito, C., Francis, X., and Hobson, E. A. (2022). A comparison of low-cost behavioral observation software applications for handheld computers and recommendations for use. Ethology 128, 275–284. doi: 10.1111/eth.13251
Venkatesh, V., and Bala, H. (2008). Technology acceptance model 3 and a research agenda on interventions. Decis. Sci. 39, 273–315. doi: 10.1111/j.1540-5915.2008.00192.x
Venkatesh, V., Morris, M. G., Davis, G. B., and Davis, F. D. (2003). User acceptance of information technology: toward a unified view. MIS Q. 27, 425–478. doi: 10.2307/30036540
Voss, M. A., and Cooper, C. B. (2010). Using a free online citizen-science project to Teach Observation & Quantification of animal behavior. Am. Biol. Teach. 72, 437–443. doi: 10.1525/abt.2010.72.7.9
Wilson, J. H., Daugherty, P. R., and Morini-Bianzino, N. (2017). The jobs that artificial intelligence will create. MIT Sloan Manag. Rev. 58, 14–16.
Wing, J. D. B., Champneys, T. S., and Ioannou, C. C. (2021). The impact of turbidity on foraging and risk taking in the invasive Nile tilapia (Oreochromis niloticus) and a threatened native cichlid (Oreochromis amphimelas). Behav. Ecol. Sociobiol. 75, 1–13. doi: 10.1007/s00265-021-02984-8
Wong, L.-W., Tan, G. W.-H., Lee, V.-H., Ooi, K.-B., and Sohal, A. (2020). Unearthing the determinants of Blockchain adoption in supply chain management. Int. J. Prod. Res. 58, 2100–2123. doi: 10.1080/00207543.2020.1730463
Wu, X. B., Knight, S., Schielack, J. F., Robledo, D., Jamie, X. A., Peterson, C. A., et al. (2016). Authentic ecological inquiries using BearCam archives. Course Source 3, 1–11. doi: 10.24918/cs.2016.22
Yang, L., Bian, Y., Zhao, X., Liu, X., and Yao, X. (2021). Drivers’ acceptance of mobile navigation applications: an extended technology acceptance model considering drivers’ sense of direction, navigation application affinity and distraction perception. Int. J. Hum. Comput. Stud. 145:102507. doi: 10.1016/j.ijhcs.2020.102507
Keywords: Technology Acceptance Model (TAM), behavioral biology, out-of-school student lab, digital education, learning technology, attitude towards artificial intelligence
Citation: Henrich M, Formella-Zimmermann S, Gübert J and Dierkes PW (2023) Students’ technology acceptance of computer-based applications for analyzing animal behavior in an out-of-school lab. Front. Educ. 8:1216318. doi: 10.3389/feduc.2023.1216318
Edited by:
Simon K. S. Cheung, Hong Kong Metropolitan University, ChinaReviewed by:
Sandi Connelly, Rochester Institute of Technology (RIT), United StatesCopyright © 2023 Henrich, Formella-Zimmermann, Gübert and Dierkes. This is an open-access article distributed under the terms of the Creative Commons Attribution License (CC BY). The use, distribution or reproduction in other forums is permitted, provided the original author(s) and the copyright owner(s) are credited and that the original publication in this journal is cited, in accordance with accepted academic practice. No use, distribution or reproduction is permitted which does not comply with these terms.
*Correspondence: Marvin Henrich, SGVucmljaEBiaW8udW5pLWZyYW5rZnVydC5kZQ==
Disclaimer: All claims expressed in this article are solely those of the authors and do not necessarily represent those of their affiliated organizations, or those of the publisher, the editors and the reviewers. Any product that may be evaluated in this article or claim that may be made by its manufacturer is not guaranteed or endorsed by the publisher.
Research integrity at Frontiers
Learn more about the work of our research integrity team to safeguard the quality of each article we publish.