 Peiyun Qiu1
94% of researchers rate our articles as excellent or good
Learn more about the work of our research integrity team to safeguard the quality of each article we publish.
Find out more
ORIGINAL RESEARCH article
Front. Built Environ., 23 May 2024
Sec. Construction Materials
Volume 10 - 2024 | https://doi.org/10.3389/fbuil.2024.1393882
This study aims to investigate the effect of rock types, i.e., granite, conglomerate rock, limestone, and crushing mechanism, i.e., Vertical Shaft Impact (VSI) crusher, Horizontal Shaft Impact (HSI) crusher, on the morphology of manufactured sands. By combining the 3D scanning and spherical harmonic analysis, the morphological parameters of manufactured sands such as elongation ratio (EL), flatness ratio (Fl), aspect ratio (AR), edge angle (EA), sphericity (SH), and fractal dimension were quantified. The results indicate limestone is more readily broken into blade-shaped particles without being able to blunt sharp edges through constant abrasion. The proportion of bladed particles in manufactured sand prepared from limestone is 1.91 times higher than the proportion of bladed particles in conglomerates. Additionally, the HSI crusher has a more significant effect on rocks with smaller strength. For the same parent rock, manufactured sand from a VSI crusher contains 30% more spherical and oblate particles than from an HSI crusher.
Natural sand is an unsustainable exploited and nonrenewable resource, as the main raw material for concrete preparation, approximately 51.7 billion metric tons of natural sand were used annually in industrial construction alone (Kurad et al., 2017; Barry et al., 2023). However, due to the uneven distribution of resources and limited local mining, the supply of natural sand was seriously insufficient. To deal with this problem, many researchers and engineers used manufactured sand as the alternative fine aggregates in concrete constructures (Feng et al., 2018; He et al., 2019; Li et al., 2021; Tawfek et al., 2023). The annual consumption of manufactured sand in the Great Britain and United States of America is estimated to be 230 million tons and 1.73 billion tons respectively (Kankam et al., 2017).
The manufactured sand is generally obtained by crushing rock using mechanical force, which could cause problems of high content of flaky particles, poor particle shape, and strong angularity of the manufactured sand (Aragão et al., 2016; Zhang et al., 2023). Many studies indicated that the manufactured sand with multi-angular shape properties affects the properties of concrete, such as rheology (Hafid et al., 2016), workability (Estephane et al., 2019), and mechanical properties (Felekoğlu, 2007; Wang et al., 2014; Xu et al., 2024). Hence, it is important to control the three-dimensional morphological parameters of manufactured fand. Generally, the properties of manufactured sand are affected by the rock type and the crushing mechanism (Donza et al., 2002; Jamkar and Rao, 2004; Singh et al., 2013). By using image analysis techniques, Hafeez et al. (Hafeez et al., 2016) found that the aggregates obtained by using the cone crusher show higher cubical than those from the jaw crusher. Also by using the image analysis technique, Kamani et al. (Kamani and Ajalloeian, 2020) compared the aggregate shape characteristics produced by common rock types and crushers, and found that the effect of crusher type on aggregate shape characteristics is more in marble and less in tuff. Therefore, capturing the morphological characteristics of manufactured sand and evaluating the effects of rock types and crushing mechanisms on the morphological characteristics are important issues for the production and application of manufactured sand.
The study of sand morphology originated from two dimensions and gradually developed into three dimensions (Zhu et al., 2014). Digital image processing is a traditional method to capture the two-dimensional morphology features of particles (Koohmishi and Palassi, 2017; Ding et al., 2019). For example, Ruan et al. (Ruan et al., 2019) extracted geometric data of 4407 real particles using digital image processing and investigated the effect of particle morphological parameters on the durability of concrete. The result showed that the particle aspect ratio plays a crucial role in the chloride ion diffusion. However, digital image processing cannot accurately represent the three-dimensional (3D) morphology of particles, which results in the obtained conclusions not being representative (Matsumura et al., 2023). Sun et al. (Sun et al., 2014) found that the latter would underestimate sphericity by comparing the 3D true sphericity and the corresponding two-dimensional (2D) sphericity obtained using digital image processing. In recent years, the development of methods such as 3D scanning and X-ray tomography have provided powerful tools for obtaining the 3D morphology of particles. (Li et al., 2022; Wu et al., 2022). These methods have shown very excellent accuracy in particle morphology characterization, especially when solving three-dimensional problems. However, the disadvantages of these methods such as being expensive, and time-consuming also limit their widespread utilization (Wei et al., 2013).
In response to the above problems, scholars have proposed several mathematical analysis methods aimed at simplifying the raw 3D scan data (Ritchie and Kemp, 1999; Rypl and Bým, 2012; Zhou et al., 2015; Thilakarathna et al., 2021; Wei et al., 2022). Among these, the spherical harmonic (SH) function proposed by Garboczi (Garboczi, 2002) is widely applied due to its high efficiency and adaptability in data simplification. For example, Su et al. (Su and Yan, 2019) reconstructed the 3D morphology of particles using spherical harmonic analysis and summarized a 3D angularity and surface texture characterization method. On the basis, Liang et al. (Liang et al., 2021) compared the surface area and volume of sand particles obtained by X-CT scanning and spherical harmonic analysis, and found that the deviation can be controlled within 3% by adjusting the spherical harmonic series.
According to these studies, the combination of 3D scanning and spherical harmonic analysis is attractive to evaluate the rock types and crushing mechanism on the morphology of manufactured sands, which is rarely reported yet. In the present study, the effects of rock types and crushing mechanisms on the morphology of manufactured sands were investigated. Three rock types, i.e., granite, conglomerate rock, and limestone, and two crushing mechanisms, i.e., Vertical Shaft Impact (VSI) crusher and Horizontal Shaft Impact (HSI) crusher were used. By combining the 3D scanning and spherical harmonic analysis, the 3D morphological parameters of manufactured sand, including elongation ratio, flatness ratio, edge angle, sphericity, and fractal dimension, were extracted and analyzed respectively. This study could provide better insight into quality of manufactured sands produced by different rock types and crushing mechanism.
Two types of common rock crushers, i.e., VSI crusher and HSI crusher were used in this study. The parameters of crushing process could affect the manufactured sand shape (Bouquety et al., 2007). Therefore, these parameters, including the feed speed, closed side setting, open side setting, and speed of the rotor are considered the same for all samples in this study. Meanwhile, the feed size of parent rock was required to be 70–90 mm.
The VSI Crusher is a crusher that reduces particle size by impacting aggregates against each other. The rotating table gives centrifugal acceleration to the aggregates and creates collisions with side-poured aggregates, as Figure 1A. Aggregates impact with each other resulting in greater uncertainty in the impact surface, which makes it easier to create square particles. The comminution under such loading condition leads to fracture of either flaky or weak particles by cleavage phenomena, resulting in particles with more isometric shapes and greater integrity (Nikolov, 2002; Gonçalves et al., 2007).
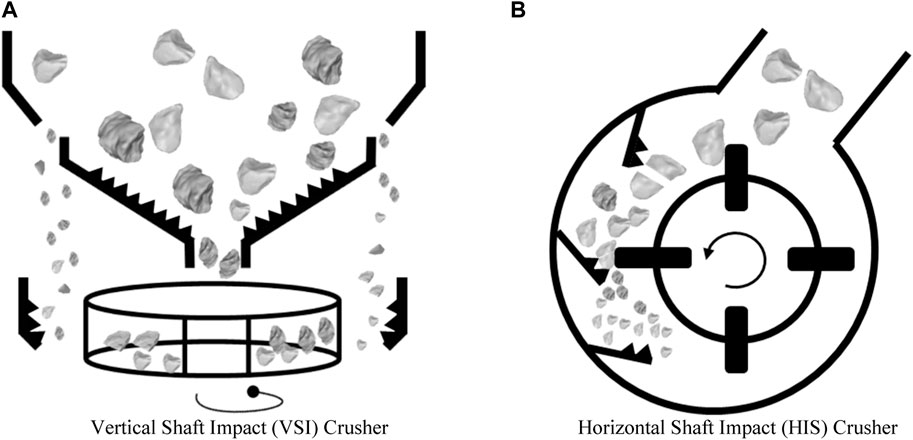
Figure 1. Schematic diagram of crusher. (A) Vertical Shaft Impact (VSI) Crusher. (B) Horizontal Shaft Impact (HIS) Crusher.
The HSI Crusher works on impact action and uses a rotating horizontal shaft. The aggregates break by colliding with the hammers on the rotating shaft and are further reduced by impacting the impact plate’s jaw, as Figure 1B.
In this study, five types of manufactured sands were collected. The types of rocks included granite, conglomerate rock, and limestone. Their basic information is shown in Table 1. The photos and grading curves of the manufactured sands obtained are shown in Figure 2 and Figure 3, respectively.
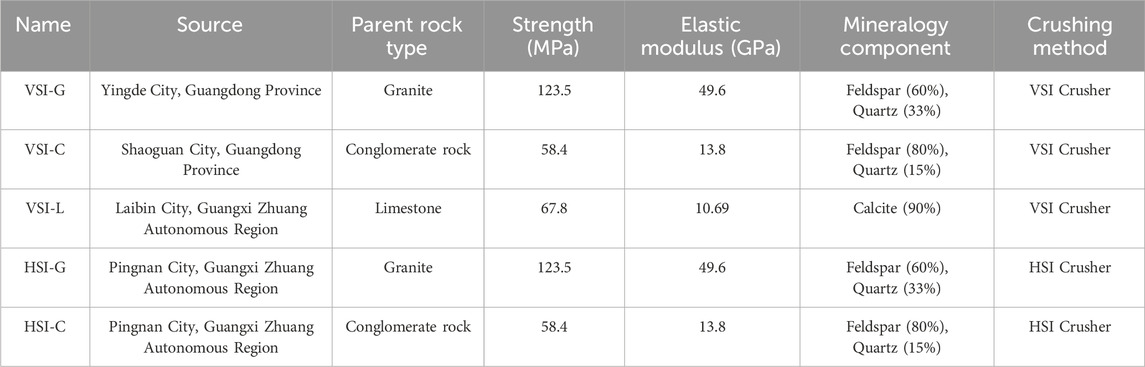
Table 1. Basic information on manufactured sand.
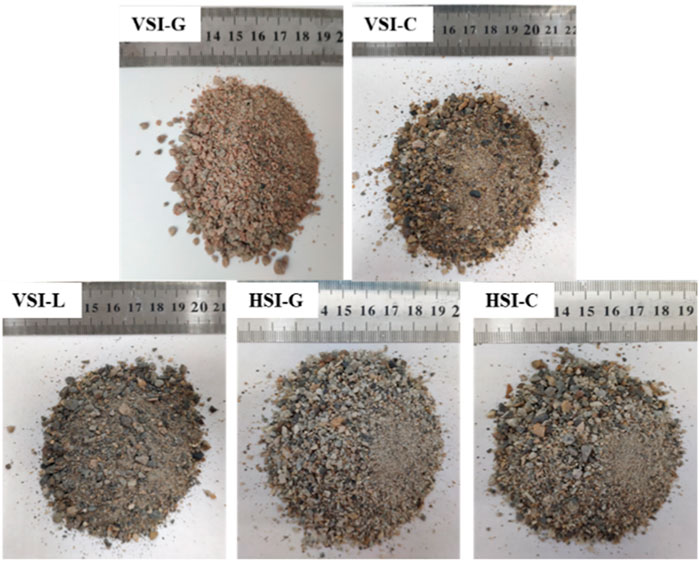
Figure 2. Object picture of mechanized sand.
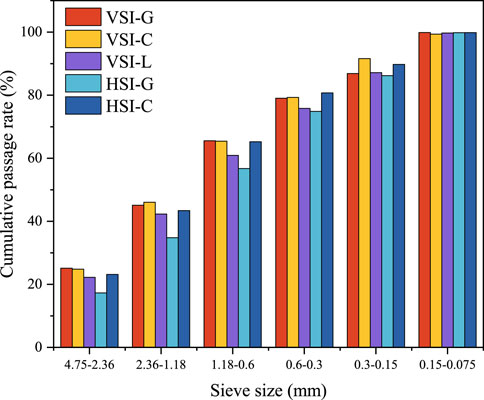
Figure 3. Grading curve of manufactured sand.
As schematically shown in Figure 4, a 3D scanner produced by Guangzhou Electronic Technology Co., Ltd, was used to capture manufactured sand. The resolution of the 3D scanner was set at 0.01 mm to attain an optimal raw point cloud. The main steps are as follows. (1) Sample holding: Fixing the sand by using the playdough. (2) Spraying developer: A white developer was sprayed on the sand surface to ensure scanning quality. (3) Sample Scanning: The upper and bottom halves of sand were scanned in sequence. (4) Data Analysis: The background data were removed, and the upper and lower halves of shell layers were incorporated to obtain a complete surface morphology of the sand. The particle morphology data in stl format data were obtained from the 3D scanner after testing, the open-source visualization tool library (VTK, Visualization Toolkit) (Schroeder et al., 2000) was used to read the stl format data and converted it to a 3D point cloud x, y, z coordinates and an array of triangular mesh vertices for saving, as shown in Figure 4.
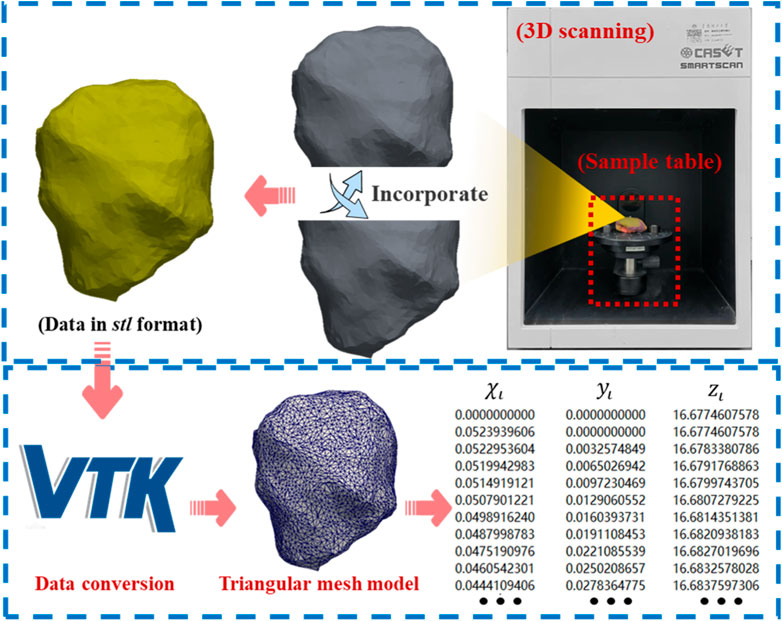
Figure 4. Schematic diagram of the three-dimensional scanner and point cloud coordinate extraction.
In the existing three-dimensional reconstruction methods, a large amount of point data was generated to reconstruct the particle morphology, which resulted in a very inefficient reconstruction of the 3D morphology of manufactured sand. The spherical harmonic function can convert 3D surface data into spherical harmonic coefficients for storage, which greatly reduces the storage space of the data, and has high accuracy and good stability, which is widely used in particle morphology reconstruction (Erdogan et al., 2006; Zhou et al., 2015; Thilakarathna et al., 2021; Wei et al., 2022). Therefore, a voxel-based spherical harmonic reconstruction method, was developed by Garboczi et al. (Garboczi and Hrabe, 2020), was applied in the current study. The outline of the procedure is presented in Figure 5. As illustrated in Figures 6A triangular mesh model of manufactured sand was obtained using the 3D scanning measurement method, which is a typical 3D surface model. To facilitate the spherical harmonic transformation, the particle coordinates are converted from a Cartesian coordinate system to a Spherical coordinate system. In contrast, the geometric center of the particle is set as the origin of the spherical coordinate system. The coordination transformation process converts all the triangular mesh vertices to spherical coordinates, as shown in Figure 6B. After obtaining the spherical coordinates, the particle surfaces can be reconstructed using the spherical harmonic function. A detailed description of the spherical harmonic process is given in Supplementary Appendix A. The degree of the SH series (N) in the spherical harmonic function is an important factor affecting the reconstruction accuracy, and a detailed discussion will be shown in Section 5.1.
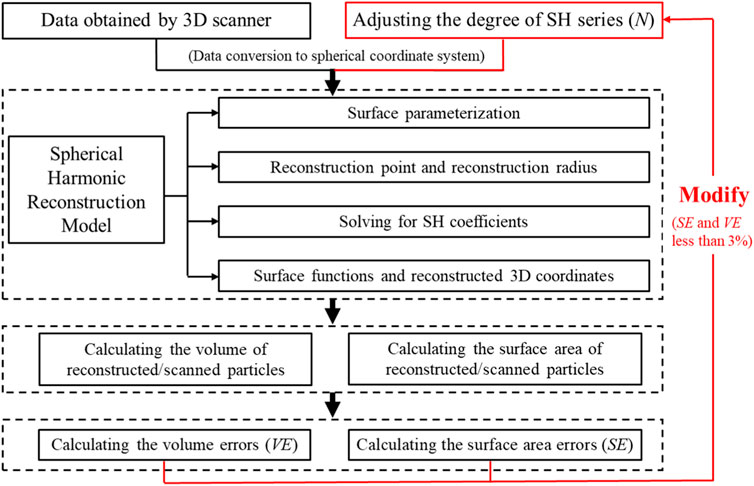
Figure 5. Spherical harmonics reconstruction model framework.
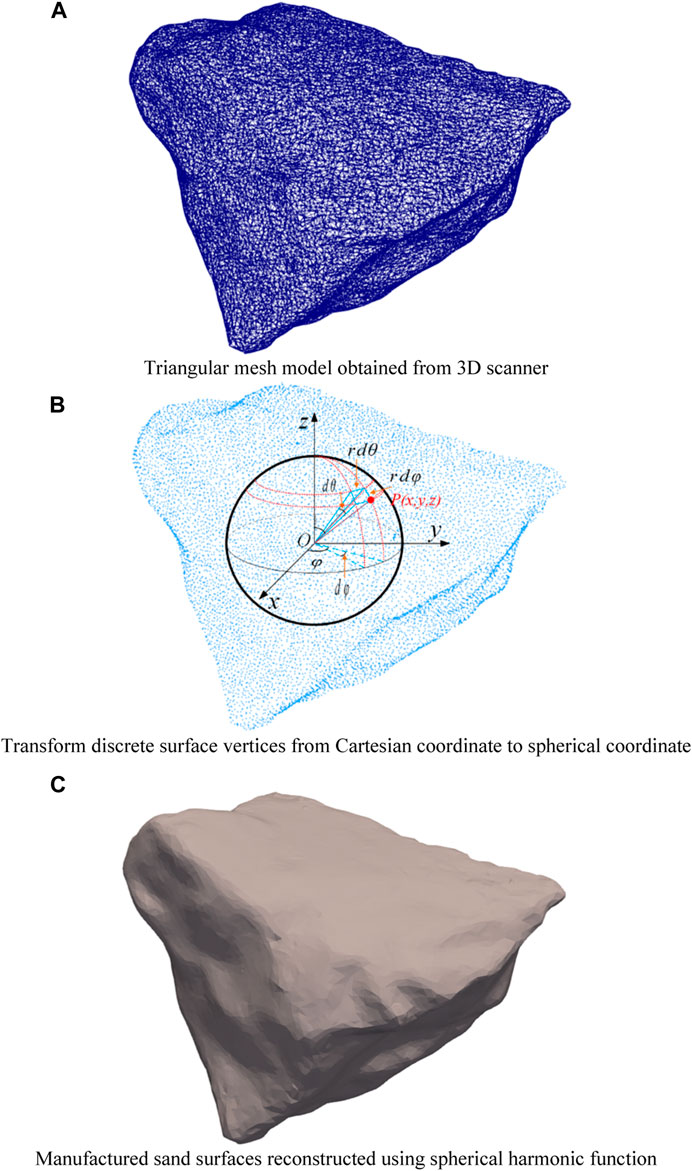
Figure 6. Schematic diagram of crusher. (A) Triangular mesh model obtained from 3D scanner. (B) Transform discrete surface vertices from Cartesian coordinate to spherical coordinate. (C) Manufactured sand surfaces reconstructed using spherical harmonic function
The surface of the particle before reconstruction consists of numerous points; after performing the Delaunay triangulation for those, multiple triangular facets used for computing the morphological parameter can be obtained. The surface of the particle after reconstruction was a continuous surface function. Thus, the coordinates of the points corresponding to the scanned locations can be obtained. After performing Delaunay triangulation for the reconstructed points according to the same rules as the scanned points, the triangular facets used for computing the morphological parameter can also be obtained. The reconstruction surface consists of numerous triangular facets, so the surface area can be calculated by using Eq. 1:
where, S is the surface area of particle; Si is the area of the ith triangular facet; p1, p2 and p3 are the three vertices of each triangular facet, respectively; θ1 is the angle between vectors and
As described in Section 4.1.1, the surface of reconstruction particle consists of numerous triangular facets, thus its volume can be calculated by summing the volume of all tetrahedral formed by the center of particle and the three vertices of each triangular facet, as shown in Eq. 2.
where, V is the volume of the reconstruction shape; Vi is the volume of the ith tetrahedron; S is the Surface area; O is the center of a particle; O′ represents the projection of the O at the triangular facet.
Referring to Ren (Ren et al., 2021), the specific surface area (SSA) of particles was calculated from the surface area and the volume, as shown in Eq. 3.
where, S is the Surface area of the reconstruction shape; V is the volume of the reconstruction shape.
The volume error (VE) was introduced to assess the relative error between the volume calculated from the original point cloud and the volume after reconstruction, as shown in Eq. 4.
where, V0 is the volume calculated from the raw point cloud; V1 is the volume after reconstruction.
The surface area error (SE) was introduced to assess the relative error between the surface area calculated from the raw point cloud and the surface area after reconstruction, as shown in Eq. 5.
in which, S0 is the surface area calculated from the raw point cloud; S1 is the surface area after reconstruction.
The three-axis dimensions of the manufactured sand particles are shown in Figure 7, where L, W and T denote the long, middle, and short axes of the manufactured sand particles, respectively.
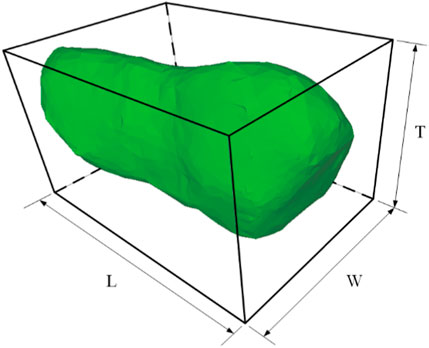
Figure 7. Schematic diagram of triaxial size parameters of particles.
Elongation (EL)is defined as the ratio of intermediate dimension (W) to the longest dimension (L), as shown in Eq. 6. Flatness (Fl) is defined as the ratio of shortest dimension (T) to the intermediate dimension (W), as shown in Eq. 7. Aspect ratio (AR) is defined as one-half of the sum of flatness and elongation, as shown in Eq. 8.
Referring to Zingg and Masad et al. (Masad and Button, 2000), the particle morphology can be categorized into four classes, including spheroid, prolate, oblate, and blade by fixed arbitrary ratio of 2/3rd (0.67), as shown in Figure 8. Zingg’s classification is widely accepted for shape classification due to its ease of use and simplicity of interpretation when compared with other classification methods.
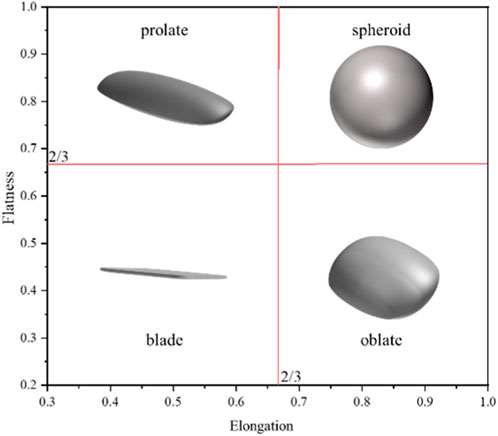
Figure 8. Schematic diagram of triaxial size parameters of particles.
Referring to the study of Wadell (Wadell, 1932), sphericity (SH) is defined as the degree of approximation of the particle shape to an equal volume sphere, as shown in Eq. 9. The SH value ranges from 0 to 1, with larger SH value indicating that the particle is more like a sphere.
where, S is the particle surface area; V is the particle volume.
Edge Angle (EA) is calculated as shown in Eq. 10.
where,
The fractal dimension can characterize the complexity of the particle geometry, and the larger the fractal dimension is, the more complex the particle geometry is. The two-dimensional fractal dimension proposed by Mandelbrot (Powers, 1953) was extended to three dimensions to characterize the three-dimensional fractal dimension of particles, as shown in Eq. 11. This is later simplified logarithmically to Eq. 12.
where,
In this study, the reconstruction errors of manufactured sand under different SH series were evaluated, and the appropriate N value was determined to ensure the calculation accuracy of manufactured sand morphology. Then, the effects of rock types and crushing mechanisms on the morphology parameters of manufactured sand were analyzed using statistics.
Related studies (Zhou et al., 2015; Su and Yan, 2018) have shown that the degree of SH series has a significant influence on the accuracy of particle reconstruction. A good reconstruction accuracy is achieved when the volume and surface area errors are reduced to less than 3% (Erdogan et al., 2006). In this paper, three different sizes of particles (1.18–2.36 mm (M118), 2.36–4.75 mm (M236), 4.75–9.50 mm (M475)) produced from granite were selected and the number of samples in each group was 30. The VE and SE of particles were compared with different numbers of SH functions (N), and a suitable N was searched to ensure the credibility of particle reconstruction.
Figure 9 illustrates the variation of VE with N for different types of particles. For M118, M236, and M475 particles, an N of 4, 4, and 6, respectively, is required to have a volumetric error of less than 3%. Meanwhile, as the N value is greater than 12, the values of VE for all types of particles are essentially stable. Manufactured sand with a larger grain size has more complex edge details.
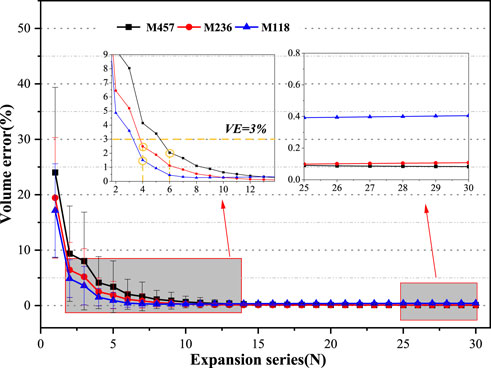
Figure 9. Variation of VE with N.
The variation of SE with N for different types of particles is like the VE vs. N curves, as shown in Figure 10. The values of SE for all types of particles gradually reduce as the N increases. As the same N value, the larger the particle size, the greater the SE value of particles. For M118, M236, and M475 particles, an N of 10, 14, and 16, respectively, is required to have a surface area error of less than 3%. When the N value exceeds 25, the surface area error of particles still varies with the N value. This is attributed to that the relatively complex surface morphologies on the particle surface have a greater impact on the surface area than the volume, thus a larger N is required to reconstruct the surface morphology accurately. This suggests that SE than VE is more suitable as a control index to determine the suitable N value for each kind of particle for ensuring the reconstruction accuracy of particles.
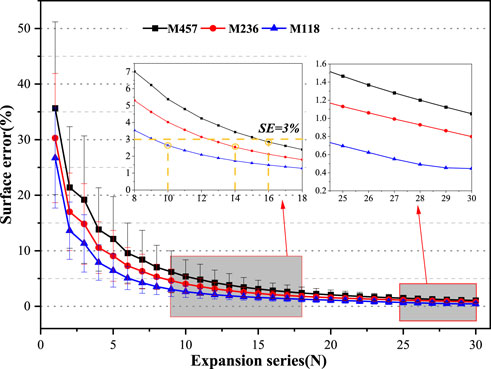
Figure 10. Variation of SE with N.
To visualize the change in the morphology of the reconstructed particles with N more intuitively, a reconstructed shape using different N was plotted in Figure 11, and the original scanned particle shape was also shown for comparison. As can be seen from Figure 11, when the particle is reconstructed using an SH series with a lower N (e.g., N < 10), the shape of reconstructed particles is relatively mellow due to the low-frequency nature of the low-order SH basis functions. This phenomenon leads to the inability of the low-order SH series to characterize the angular properties of the manufactured aggregates, thus resulting in a higher VE and SE (seen in Figure 9; Figure 10). The above analysis shows that the appropriate N is essential for ensuring sufficient reconstruction accuracy. Therefore, the appropriate N for manufactured sand reconstruction was obtained by requiring SE to be less than 3%, and the results are shown in Table 2.
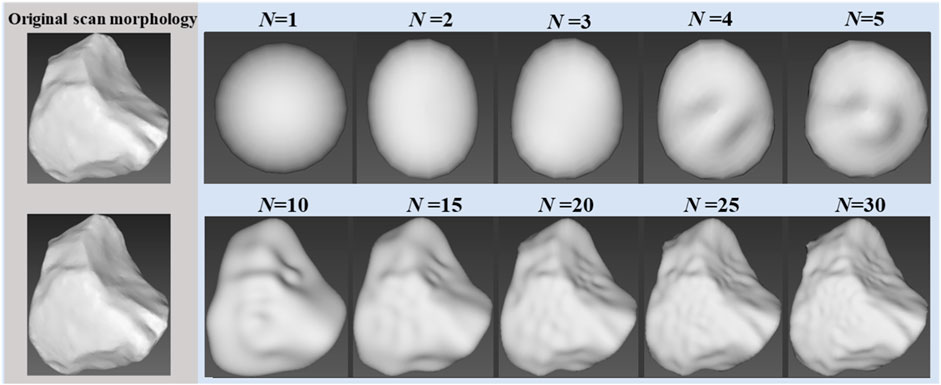
Figure 11. Variation of the morphology of particles with N.
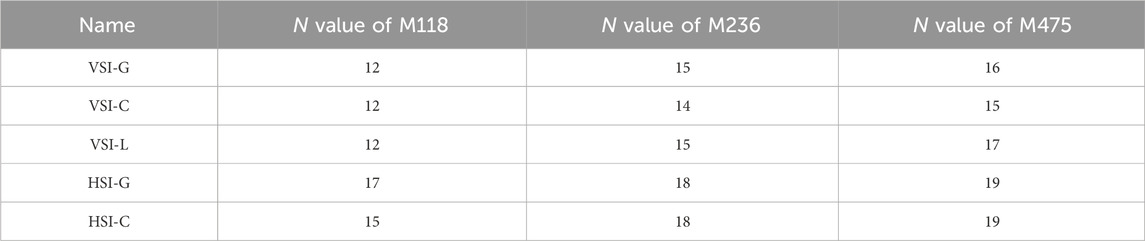
Table 2. The appropriate N to achieve a surface area error of less than 3%.
Randomly selected samples of manufactured sand with particle sizes of 1.18–4.75 mm were reconstructed, and the number of samples in each group was more than 80. The morphological parameters of the manufactured sand were calculated concerning the corresponding N values in Table 2. The statistical parameters of the manufactured sands are shown according to these sand categories in Table 3. Morphological parameters, including EI, FI, AR, SH, and EA, can represent the sand form characteristics. Also, statistical parameters, including Mean, minimum (Min), maximum (Max), and standard deviation (Std. D), were shown.
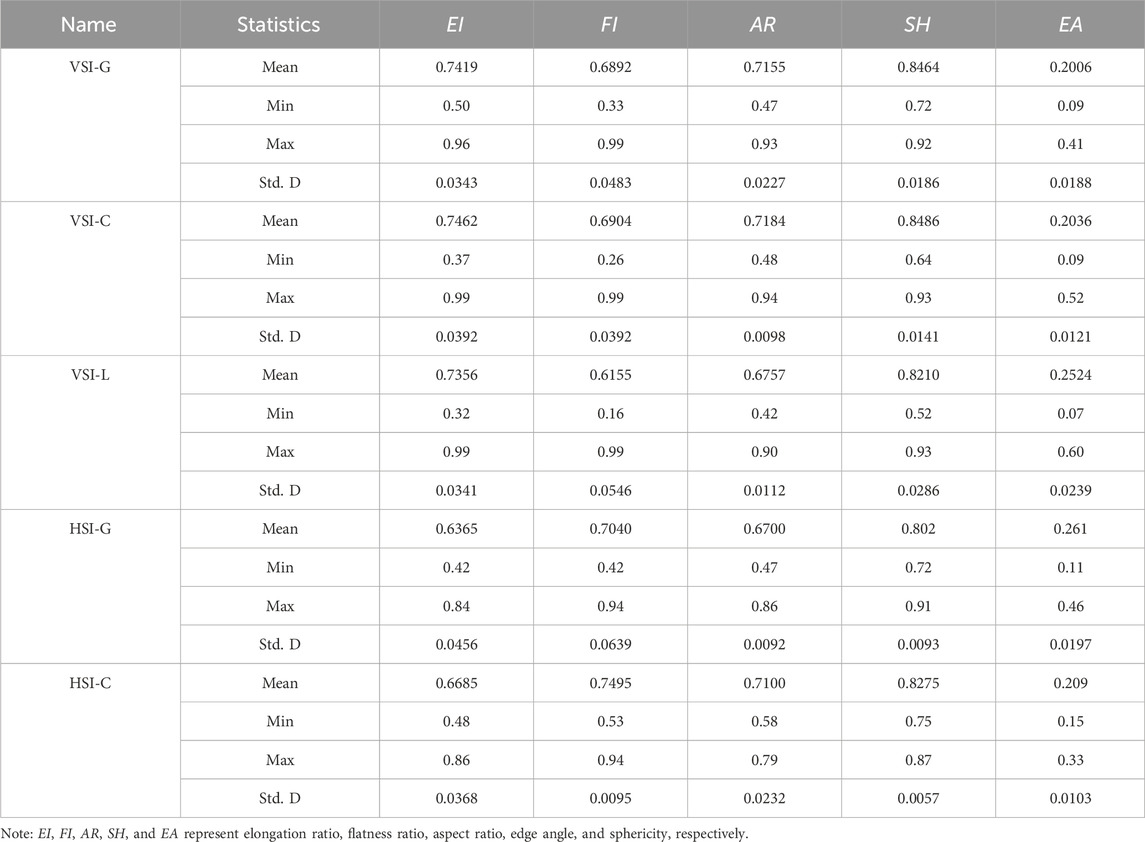
Table 3. The results of the morphological parameter of manufactured sands.
According to Table 3, the EI values range from 0.32 to 0.99, FI values have a range of 0.16–0.99, and AR values are in the range of 0.42–0.94. By comparing the average EA and average SH values of the manufactured sands prepared from three different rocks, it is found that limestone-manufactured sand (VSI-L) has the largest EA, which is 25.8% higher compared to conglomerate-manufactured sand, and limestone manufactured sand (VSI-L) has the smallest SH, which is 3% lower compared to conglomerate manufactured sand (VSI-C). Meanwhile, there were variations in the morphological parameters of the manufactured sands prepared from different crushers and the same parent rock. For example, the average SH of VSI-G is 5.5% larger than that of HSI-G, and the average SH of VSI-C is 2.5% larger than that of HSI-C. Similar conclusions were reached comparing the AR of mechanism sand from different crushers and the same parent rock. It may show the effects of both parent rock types and crushing mechanisms on the morphology of manufactured sand.
For determining whether the rock type has an essential influence on morphological characteristic parameters of manufactured sands. The Student’s t-test for unequal sample sizes was used to assess the statistical significance of the average values of morphological parameters at a significance level of 0.05 (Rouder et al., 2009; Estephane et al., 2019; Chukhrova and Johannssen, 2022). The results of the Student’s t-test are shown in Table 4. Comparing manufactured sands prepared with granite (VSI-G) and conglomerate rock (VSI-C), all p was found to be more than 0.05 (p > 0.05), indicating that no significant difference existed in the morphology of manufactured sand prepared with granite and conglomerate. Similarly, the multiple comparison analysis indicated that a significant difference existed (p < 0.05) in the other combination of the parent rock type (i.e., VSI-G versus VSI-L and VSI-C versus VSI-L) in morphometric parameters, except for El, which was found to be similar.
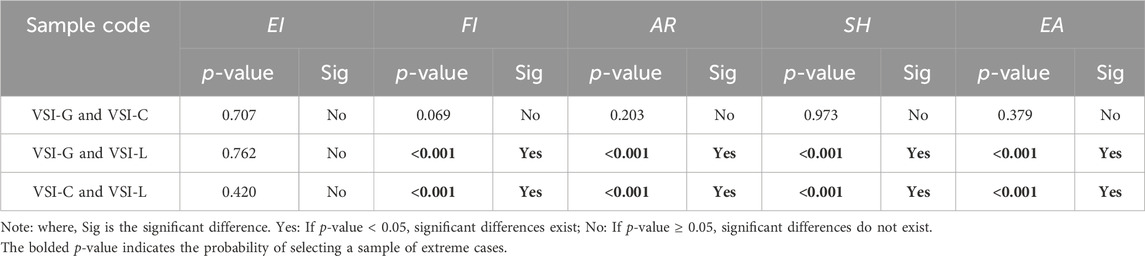
Table 4. The summary of Student’s t-test (p-value) for comparing the effect of rock type on the particle morphological.
Figure 12 shows the fractal dimension and average of main morphologic parameters for manufactured sands prepared with three parent rocks (VSI-G, VSI-C, VSI-L). In which, VSI-L has the largest fractal dimension, which is 1.8% larger than that of VSI-C, while the deviation of the fractal dimension between VSI-G and VSI-C is less than 0.4%. It indicates that the geometries of manufactured sand prepared by limestone are more complex and that the morphology of the sand prepared by granite and conglomerate is closer. This is attributed to the similar mineral component of granite and conglomerate. The main morphology parameters of VSI-G and VSI-C also demonstrate identical results. Figure 12B shows that the sphericity of VSI-L is 3.3% smaller than that of VSI-G and VSI-C, while the edge angle is 22.1% larger than that of VSI-G and VSI-C. Limestone is mainly composed of calcite, which has three cleavage planes in different directions and belongs to a perfect cleavage mineral (Jensen et al., 2010) (cleavage rocks are more easily broken up). Limestone is more readily broken into blade-shaped particles without being able to blunt sharp edges through constant abrasion. The key to the nature of the rock type influencing the morphology of manufactured sand lies in its cleavage and surface texture. Similar conclusions were obtained in Mojtaba Kamani’s study on rock crushers and rock types affecting aggregate shape (Kamani and Ajalloeian, 2020). As a result, the particle sphericity of manufactured sand prepared from limestone is worse than that of granite and conglomerate under the exact crushing mechanism.
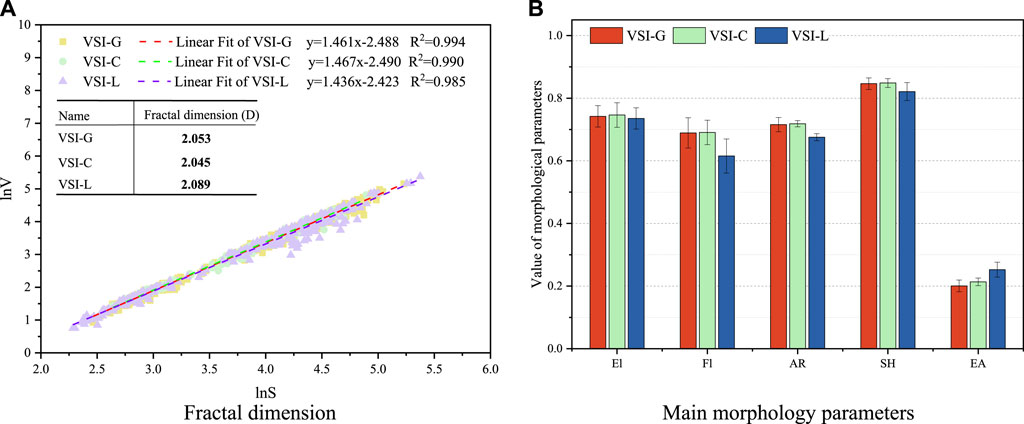
Figure 12. Schematic diagram of crusher. (A) Fractal dimension. (B) Main morphology parameters.
Based on the orthogonal dimension classification method presented by Zingg (Zingg, 1935), the manufactured sand was classified into four classes, including spheroid, prolate, oblate, and blade, as shown in Figure 13. Statistics on the quantity percentage of particles in different classes indicated that VSI-L had least number of particles distributed in spheroid range, only 59.1% of VSI-C. Meanwhile, VSI-L has the highest number of blade particles, reaching 1.91 times VSI-G. This is consistent with the results of the previous analysis on sphericity. It is noticed that VSI-C has 9.7% more particles than VSI-G in the spheroid range. This may be attributed to the fact that conglomerate rock contains more quartz belonging to the non-cleavage mineral (Gao et al., 2021) (non-cleavage rocks are harder broken up), resulting in rocks that may be subjected to more extended periods of abrasion, which is conducive to the formation of more spherical particles. Overall, there are more spherical particles in the manufactured sand prepared with granite and conglomerate compared to limestone.
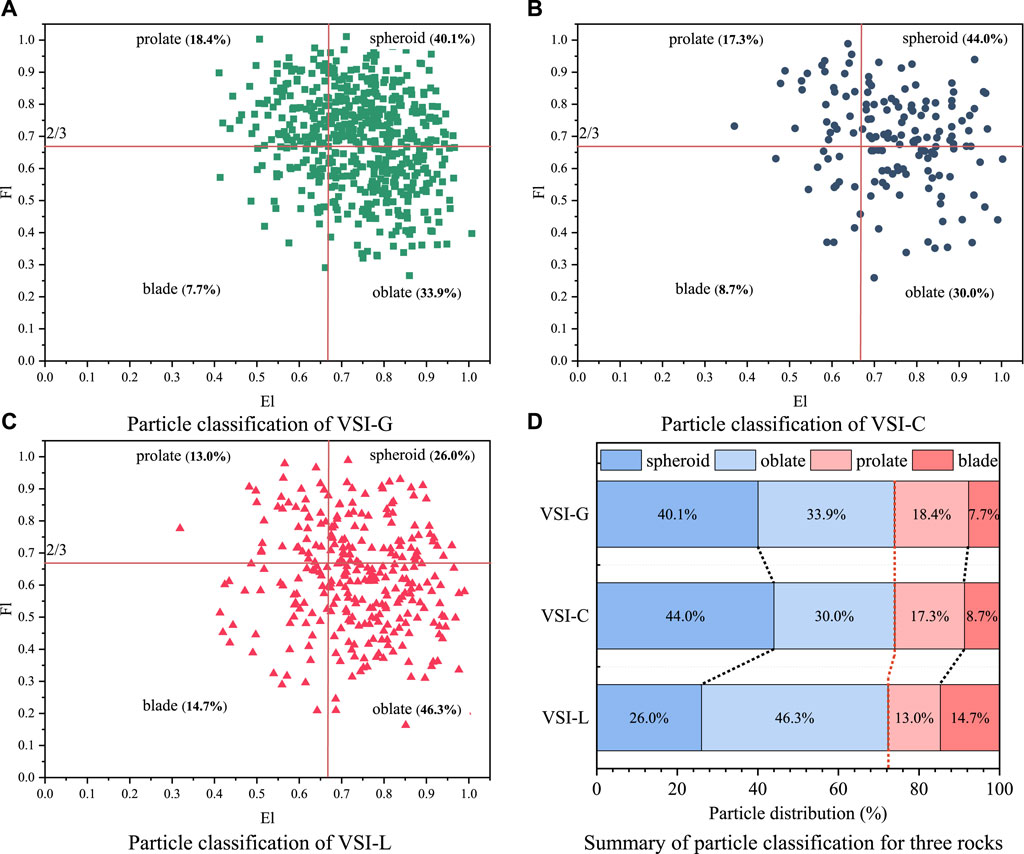
Figure 13. Schematic diagram of crusher. (A) Particle classification of VSI-G. (B) Particle classification of VSI-C. (C) Particle classification of VSI-L. (D) Summary of particle classification for three rocks.
Analyze the typical force condition of rock in the VSI crusher and HSI crusher, as shown in Figure 14. As shown in Figure 14A, the prime crushing mechanism in the VSI crusher is the impact and abrasion of rocks against each other. The mutual abrasion of rocks is conducive to the formation of sub-spherical particles. Therefore, increasing the rock strength may prolong the abrasion time to form better spherical particles. Meanwhile, in the HSI crusher, the rocks are mainly subjected to anvil impact, shear, and friction, as shown in Figure 14B. The shear crushing mechanism tends to produce more sharp particles from the rock surface.
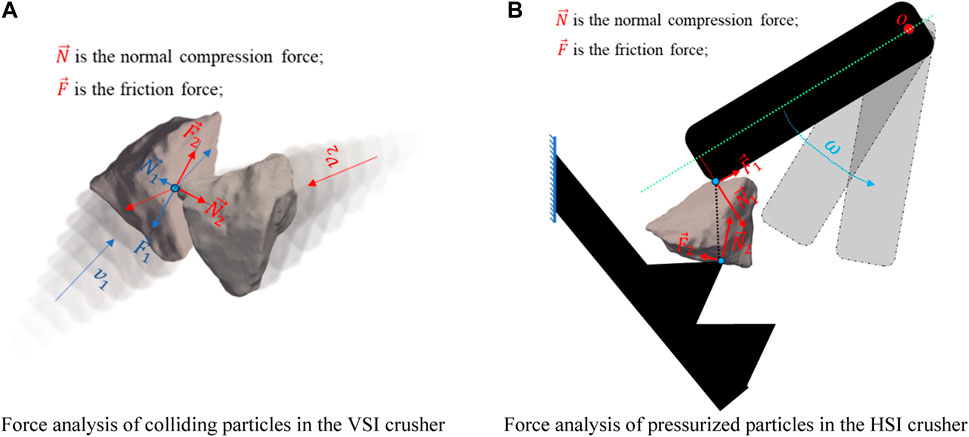
Figure 14. Schematic diagram of crusher. (A) Force analysis of colliding particles in the VSI crusher. (B) Force analysis of pressurized particles in the HSI crusher.
Figure 15 shows the fractal dimension of manufactured sands prepared with different crushing methods (VSI-G, VSI-C, HSI-G, HSI-C). From Figure 15, the fractal dimension of manufactured sands produced from the HSI crusher is higher than sands obtained from the VSI crusher, which indicates that the geometry of the manufactured sand produced by the HSI crusher is more complex.
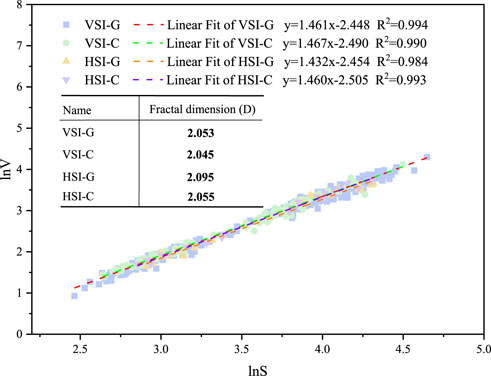
Figure 15. Fractal dimension of manufactured sands with different crushing methods.
The Student’s t-test was conducted to compare the average morphology parameters of manufactured sand prepared from the VSI crusher and HSI crusher based on the same parent rock, and the results are shown in Table 5. In granite samples, there was a significant difference (p < 0.05) in the El, SH, and EA of the manufactured sand produced by the VSI and HSI crushers. However, for the conglomerate, there were few significant differences (p > 0.05) in the EA of manufactured sand produced by VSI and HSI crushers, which indicates variability in the effect of crusher type on the different parent rocks.
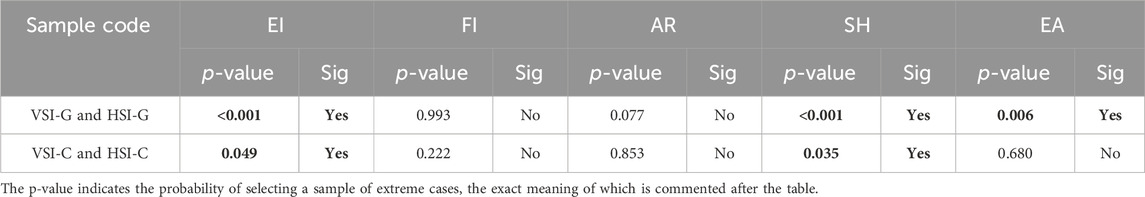
Table 5. The summary of Student’s t-tests (p-value) for comparing the effect of rock crusher on the particle morphological.
The boxplot was employed to describe the distribution of the main morphological parameters of manufactured sands, as shown in Figure 16. The boxes contain 50% of the data. Their height values reflect the fluctuation of the data, the line in the box denotes the median value, and the hollow rectangle represents the average value (Liu et al., 2023). Overall, the heights of the pink boxes are all greater than the blue boxes, indicating a more centralized range of distribution of the morphological parameters of the manufactured sand produced by the VSI crusher. This showed similar results in the comparison of VSI-C and HSI-C. The AR and SH of the manufactured sand produced by the HSI crusher were smaller than those produced by the VSI crusher, indicating that more equi-dimension manufactured sand would be produced using the HSI crusher. For edge angle, HSI-G is 30.1% higher than VSI-G, yet HSI-C and VSI-C are almost identical. This is attributed to the inconsistency of strength between granite and conglomerate. When the strength of the rock is higher, the rock in the HSI crusher breaks up more blade particles under shear, which results in a higher average edge angle in the manufactured sand.
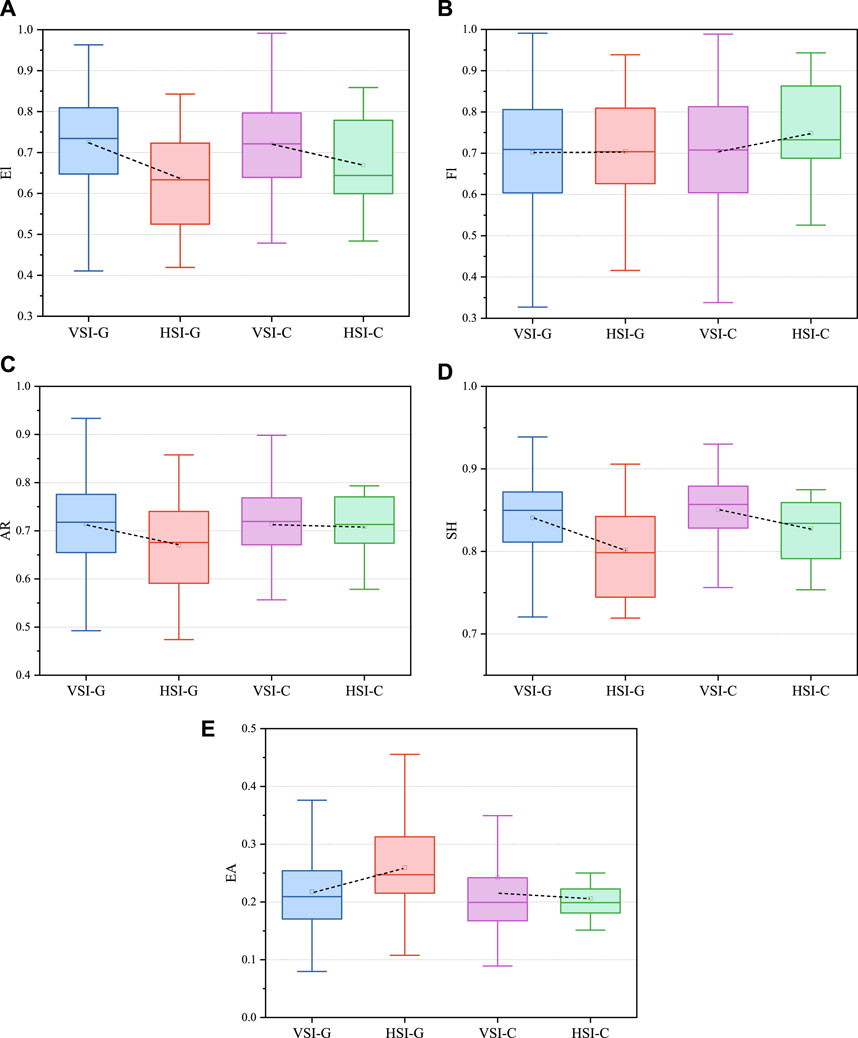
Figure 16. Schematic diagram of crusher. (A) El. (B) Fl. (C) AR. (D) SH. (E) EA.
Based on the orthogonal dimension classification method, the shape classification of manufactured sand produced from different crushing mechanisms was carried out, as shown in Figure 17. The VSI crusher produces 74% of manufactured sands in spheroid and oblate, and the overall particle shape tends to be rounded. The manufactured sand made from the HSI crusher has a greater proportion of prolate and blade (55%–60%), and the overall particle shape tends to be flat-long. The VSI crusher produced more sub-spherical particles than the HSI crusher. As a result, the VSI crusher produces better spherical sand for the same rock type than the HSI crusher.
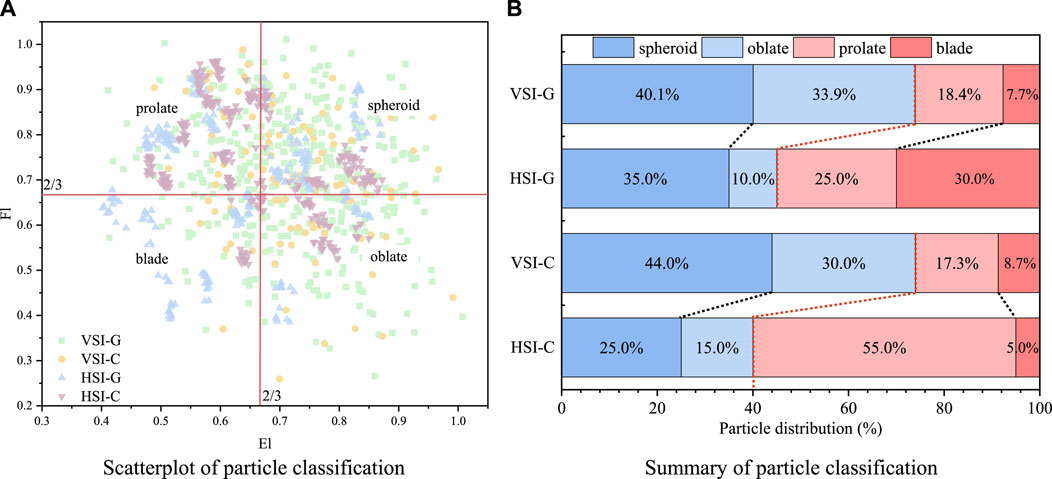
Figure 17. Schematic diagram of crusher. (A) Scatterplot of particle classification. (B) Summary of particle classification.
This paper extracted morphological parameters of manufactured sand, including EI, FI, AR, SH, and EA, by combining the 3D scanning and spherical harmonic analysis. Three rock types, i.e., granite, conglomerate rock, and limestone, and two crushing mechanisms, i.e., VSI crusher and HSI crusher, were studied. From the results of this study, the following conclusions can be drawn:
1) The surface area error rather than the volume error is more suitable as a control index to determine the appropriate N value for ensuring the reconstruction accuracy of manufactured sand.
2) Rock type significantly affects the 3D morphology parameters of manufactured sand. Notably, well-cleavage rocks are more readily broken into blade-shaped particles without being able to blunt sharp edges through constant abrasion. The proportion of bladed particles in manufactured sand prepared from limestone containing multiple cleavages is 1.91 times higher than in conglomerates.
3) Compared to the HSI crusher, manufactured sand produced with the VSI crusher has a more concentrated distribution of 3D morphology parameters while having a more prominent SH and smaller EA. For the same parent rock, manufactured sand from a VSI crusher contains 30% more spherical and oblate particles than from an HSI crusher.
In future research, we suggest comparing the effects of combined crushing mechanisms on the morphological parameters of manufactured sand, which is meaningful to further improve the morphological of manufactured sand.
The original contributions presented in the study are included in the article/Supplementary Material, further inquiries can be directed to the corresponding author.
PQ: Formal Analysis, Investigation, Methodology, Validation, Writing–original draft. HW: Validation, Writing–review and editing. PW: Formal Analysis, Investigation, Methodology, Writing–review and editing. MX: Conceptualization, Supervision, Validation, Writing–review and editing. JW: Supervision, Writing–review and editing.
The author(s) declare financial support was received for the research, authorship, and/or publication of this article.
The authors would like to thank the financial support by the Research on Mechanized Sand Concrete Application Technology for Guangzhou Metro Line 10 (HT211634). The authors would also like to thank Yanfeng Tang for its linguistic assistance during the preparation of this manuscript.
Authors PQ, HW, and PW were employed by Guangzhou Metro Construction Management Co., Ltd.
The remaining authors declare that the research was conducted in the absence of any commercial or financial relationships that could be construed as a potential conflict of interest.
All claims expressed in this article are solely those of the authors and do not necessarily represent those of their affiliated organizations, or those of the publisher, the editors and the reviewers. Any product that may be evaluated in this article, or claim that may be made by its manufacturer, is not guaranteed or endorsed by the publisher.
The Supplementary Material for this article can be found online at: https://www.frontiersin.org/articles/10.3389/fbuil.2024.1393882/full#supplementary-material
Aragão, F. T. S., Pazos, A. R. G., Motta, L. M. G. d., Kim, Y. R., and Nascimento, L. A. H. d. (2016). Effects of morphological characteristics of aggregate particles on the mechanical behavior of bituminous paving mixtures. Constr. Build. Mater 123, 444–453. doi:10.1016/j.conbuildmat.2016.07.013
Barry, M., Clément, M., Rangeard, D., Jacquet, Y., and Perrot, A. (2023). Manufactured crushed sand: packing fraction prediction and influence on mortar rheology. Mater. Struct. 56, 139. doi:10.1617/s11527-023-02231-8
Bouquety, M. N., Descantes, Y., Barcelo, L., de Larrard, F., and Clavaud, B. (2007). Experimental study of crushed aggregate shape. Constr. Build. Mater 21, 865–872. doi:10.1016/j.conbuildmat.2005.12.013
Chukhrova, N., and Johannssen, A. (2022). Two-tailed hypothesis testing for the median with fuzzy categories applied to the detection of health risks. Expert Syst. Appl. 192, 116362. doi:10.1016/j.eswa.2021.116362
Ding, X., Ma, T., and Huang, X. (2019). Discrete-element contour-filling modeling method for micromechanical and macromechanical analysis of aggregate skeleton of asphalt mixture. J. Transp. Eng. B-Pave. 145, 04018056. doi:10.1061/jpeodx.0000083
Donza, H., Cabrera, O., and Irassar, E. F. (2002). High-strength concrete with different fine aggregate. Cem. Concr. Res. 32, 1755–1761. doi:10.1016/s0008-8846(02)00860-8
Erdogan, S. T., Quiroga, P. N., Fowler, D. W., Saleh, H., Livingston, R., Garboczi, E., et al. (2006). Three-dimensional shape analysis of coarse aggregates: new techniques for and preliminary results on several different coarse aggregates and reference rocks. Cem. Concr. Res. 36, 1619–1627. doi:10.1016/j.cemconres.2006.04.003
Estephane, P., Garboczi, E. J., Bullard, J. W., and Wallevik, O. H. (2019). Three-dimensional shape characterization of fine sands and the influence of particle shape on the packing and workability of mortars. Cem. Concr. Compos. 97, 125–142. doi:10.1016/j.cemconcomp.2018.12.018
Felekoğlu, B. (2007). Effects of PSD and surface morphology of micro-aggregates on admixture requirement and mechanical performance of micro-concrete. Cem. Concr. Compos. 29, 481–489. doi:10.1016/j.cemconcomp.2006.12.008
Feng, H., Pan, L., Zheng, Q., Li, J., Xu, N., and Pang, S. (2018). Effects of molecular structure of polycarboxylate superplasticizers on their dispersion and adsorption behavior in cement paste with two kinds of stone powder. Constr. Build. Mater 170, 182–192. doi:10.1016/j.conbuildmat.2018.02.195
Gao, M., Li, T., Zhu, J., Yin, H., and Yang, Y. (2021). An analysis of relationship between the microfracture features and mineral morphology of granite. Adv. Civ. Eng. 2021, 4765731–4765736. doi:10.1155/2021/4765731
Garboczi, E. J. (2002). Three-dimensional mathematical analysis of particle shape using X-ray tomography and spherical harmonics: application to aggregates used in concrete. Cem. Concr. Res. 32, 1621–1638. doi:10.1016/s0008-8846(02)00836-0
Garboczi, E. J., and Hrabe, N. (2020). Three-dimensional particle shape analysis using X-ray computed tomography: experimental procedure and analysis algorithms for metal powders. J. Vis. Exp. 12, 61636. doi:10.3791/61636
Gonçalves, J. P., Tavares, L. M., Toledo Filho, R. D., Fairbairn, E., and Cunha, E. (2007). Comparison of natural and manufactured fine aggregates in cement mortars. Cem. Concr. Res. 37, 924–932. doi:10.1016/j.cemconres.2007.03.009
Hafeez, I., Juniad, F., Kamal, M. A., and Hussain, J. (2016). Influence of single-and two-stage aggregate manufacturing mechanisms on asphalt mixture performance. J. Mater. Civ. Eng. 28, 0415180. doi:10.1061/(asce)mt.1943-5533.0001480
Hafid, H., Ovarlez, G., Toussaint, F., Jezequel, P., and Roussel, N. (2016). Effect of particle morphological parameters on sand grains packing properties and rheology of model mortars. Cem. Concr. Res. 80, 44–51. doi:10.1016/j.cemconres.2015.11.002
He, H., Wang, Y., and Wang, J. (2019). Effects of aggregate micro fines (AMF), aluminum sulfate and polypropylene fiber (PPF) on properties of machine-made sand concrete. Appl. Sci. 9, 2250. doi:10.3390/app9112250
Jamkar, S. S., and Rao, C. B. K. (2004). Index of Aggregate Particle Shape and Texture of coarse aggregate as a parameter for concrete mix proportioning. Cem. Concr. Res. 34, 2021–2027. doi:10.1016/j.cemconres.2004.03.010
Jensen, L. R. D., Friis, H., Fundal, E., Møller, P., and Jespersen, M. (2010). Analysis of limestone micromechanical properties by optical microscopy. Eng. Geol. 110, 43–50. doi:10.1016/j.enggeo.2009.10.004
Kamani, M., and Ajalloeian, R. (2020). The effect of rock crusher and rock type on the aggregate shape. Constr. Build. Mater 230, 117016. doi:10.1016/j.conbuildmat.2019.117016
Kankam, C. K., Meisuh, B. K., Sossou, G., and Buabin, T. K. (2017). Stress-strain characteristics of concrete containing quarry rock dust as partial replacement of sand. Case Stud. Constr. Mat. 7, 66–72. doi:10.1016/j.cscm.2017.06.004
Koohmishi, M., and Palassi, M. (2017). Evaluation of morphological properties of railway ballast particles by image processing method. Transp. Geotech. 12, 15–25. doi:10.1016/j.trgeo.2017.07.001
Kurad, R., Silvestre, J. D., de Brito, J., and Ahmed, H. (2017). Effect of incorporation of high volume of recycled concrete aggregates and fly ash on the strength and global warming potential of concrete. J. Clean. Prod. 166, 485–502. doi:10.1016/j.jclepro.2017.07.236
Li, Y., Qin, X., Zhang, Z., and Dong, H. (2022). Solid waste shape description and generation based on spherical harmonics and probability density function. Waste Manag. Res. 40, 66–78. doi:10.1177/0734242x211045003
Li, Y., Zeng, X., Zhou, J., Shi, Y., Umar, H. A., Long, G., et al. (2021). Development of an eco-friendly ultra-high performance concrete based on waste basalt powder for Sichuan-Tibet Railway. J. Clean. Prod. 312, 127775. doi:10.1016/j.jclepro.2021.127775
Liang, H., Shen, Y., Xu, J., and Shen, X. (2021). Multiscale three-dimensional morphological characterization of calcareous sand particles using spherical harmonic analysis. Front. Phys-Lausanne. 9, 744319. doi:10.3389/fphy.2021.744319
Liu, Y., Zhang, J., Zhao, T., Wang, Z., and Wang, Z. (2023). Reconstruction of the meso-scale concrete model using a deep convolutional generative adversarial network (DCGAN). Constr. Build. Mater 370, 130704. doi:10.1016/j.conbuildmat.2023.130704
Masad, E., and Button, J. W. (2000). Unified imaging approach for measuring aggregate angularity and texture. Comput-Aided Civ. Inf. 15, 273–280. doi:10.1111/0885-9507.00191
Matsumura, S., Kondo, A., Nakamura, K., Mizutani, T., Kohama, E., Wada, K., et al. (2023). 3D image scanning of gravel soil using in-situ X-ray computed tomography. Sci. Rep-Uk 13, 20007. doi:10.1038/s41598-023-46772-y
Nikolov, S. (2002). A performance model for impact crushers. Min. Eng. 15, 715–721. doi:10.1016/s0892-6875(02)00174-7
Powers, M. C. (1953). A new roundness scale for sedimentary particles. J. Sediment. Res. 23, 117–119. doi:10.1306/d4269567-2b26-11d7-8648000102c1865d
Ren, Q., Tao, Y., Jiao, D., Jiang, Z., Ye, G., and De Schutter, G. (2021). Plastic viscosity of cement mortar with manufactured sand as influenced by geometric features and particle size. Cem. Concr. Compos. 122, 104163. doi:10.1016/j.cemconcomp.2021.104163
Ritchie, D. W., and Kemp, G. J. (1999). Fast computation, rotation, and comparison of low resolution spherical harmonic molecular surfaces. J. Comput. Chem. 20, 383–395. doi:10.1002/(sici)1096-987x(199903)20:4<383::aid-jcc1>3.3.co;2-d
Rouder, J. N., Speckman, P. L., Sun, D., Morey, R. D., and Iverson, G. (2009). Bayesian t tests for accepting and rejecting the null hypothesis. Psychon. Bull. Rev. 16, 225–237. doi:10.3758/pbr.16.2.225
Ruan, X., Li, Y., Jin, Z., Pan, Z., and Yin, Z. (2019). Modeling method of concrete material at mesoscale with refined aggregate shapes based on image recognition. Constr. Build. Mater 204, 562–575. doi:10.1016/j.conbuildmat.2019.01.157
Rypl, D., and Bým, T. (2012). Geometrical modeling of concrete microstructure for the assessment of ITZ percolation. Acta Polytech. 52, 38–47. doi:10.14311/1674
Schroeder, W. J., Avila, L., and Hoffman, W. (2000). Visualizing with VTK: a tutorial. Ieee Comput. Graph 20, 20–27. doi:10.1109/38.865875
Singh, D., Zaman, M., and Commuri, S. (2013). Effect of production and sample preparation methods on aggregate shape parameters. Int. J. Pavement Eng. 14, 154–175. doi:10.1080/10298436.2011.635792
Su, D., and Yan, W. M. (2018). 3D characterization of general-shape sand particles using microfocus X-ray computed tomography and spherical harmonic functions, and particle regeneration using multivariate random vector. Powder Technol. 323, 8–23. doi:10.1016/j.powtec.2017.09.030
Su, D., and Yan, W. M. (2019). Prediction of 3D size and shape descriptors of irregular granular particles from projected 2D images. Acta Geotech. 15, 1533–1555. doi:10.1007/s11440-019-00845-3
Sun, Y., Indraratna, B., and Nimbalkar, S. (2014). Three-dimensional characterisation of particle size and shape for ballast. Géotechnique Lett. 4, 197–202. doi:10.1680/geolett.14.00036
Tawfek, A. M., Ge, Z., Yuan, H., Zhang, N., Zhang, H., Ling, Y., et al. (2023). Influence of fiber orientation on the mechanical responses of engineering cementitious composite (ECC) under various loading conditions. J. Build. Eng. 63, 105518. doi:10.1016/j.jobe.2022.105518
Thilakarathna, P. S. M., Kristombu Baduge, S., Mendis, P., Chandrathilaka, E. R. K., Vimonsatit, V., and Lee, H. (2021). Aggregate geometry generation method using a structured light 3D scanner, spherical harmonics–based geometry reconstruction, and placing algorithms for mesoscale modeling of concrete. J. Mater. Civ. Eng. 33, 04021198. doi:10.1061/(asce)mt.1943-5533.0003851
Wadell, H. (1932). Volume, shape, and roundness of rock particles. J. Geol. 40, 443–451. doi:10.1086/623964
Wang, J., Yang, Z., and Liu, Y. (2014). Effects of the lithologic character of manufactured sand on properties of concrete. J. Wuhan Univ. Technology-Mater. Sci. Ed. 29, 1213–1218. doi:10.1007/s11595-014-1070-9
Wei, D., Zhao, B., and Gan, Y. (2022). Surface reconstruction with spherical harmonics and its application for single particle crushing simulations. J. Rock Mech. Geotech. 14, 232–239. doi:10.1016/j.jrmge.2021.07.016
Wei, S., Yiqiang, C., Yunsheng, Z., and Jones, M. (2013). Characterization and simulation of microstructure and thermal properties of foamed concrete. Constr. Build. Mater 47, 1278–1291. doi:10.1016/j.conbuildmat.2013.06.027
Wu, M., Wang, J., and Zhao, B. (2022). DEM modeling of one-dimensional compression of sands incorporating statistical particle fragmentation scheme. Can. Geotech. J. 59, 144–157. doi:10.1139/cgj-2020-0308
Xu, Y., Chen, H., Liang, Y., Shen, J., and Yang, H. (2024). Study on fracture characteristics and fracture mechanism of fully recycled aggregate concrete using AE and DIC techniques. Constr. Build. Mater 419, 135540. doi:10.1016/j.conbuildmat.2024.135540
Zhang, H., Zhao, H., Liu, F., Yang, H., Geng, Y., and Pan, K. (2023). Models for uniaxial stress-strain relationship and thermal properties of fine recycled aggregate concrete exposed to elevated temperatures. J. Build. Eng. 66, 105869. doi:10.1016/j.jobe.2023.105869
Zhou, B., Wang, J., and Zhao, B. (2015). Micromorphology characterization and reconstruction of sand particles using micro X-ray tomography and spherical harmonics. Eng. Geol. 184, 126–137. doi:10.1016/j.enggeo.2014.11.009
Zhu, Z., Chen, H., Xu, W., and Liu, L. (2014). Parking simulation of three-dimensional multi-sized star-shaped particles. Modell. Simul. Mater. Sci. Eng. 22, 035008. doi:10.1088/0965-0393/22/3/035008
Keywords: manufactured sand, spherical harmonic analysis, morphological parameter, rock type, crushing mechanism
Citation: Qiu P, Wang H, Wang P, Xiao M and Wei J (2024) Effects of rock types and crushing mechanism on the 3D morphological parameters of manufactured sands: a combination study of 3D scanning and spherical harmonic analysis. Front. Built Environ. 10:1393882. doi: 10.3389/fbuil.2024.1393882
Received: 29 February 2024; Accepted: 10 April 2024;
Published: 23 May 2024.
Edited by:
Augusto Cesar Da Silva Bezerra, Federal Center for Technological Education of Minas Gerais, BrazilCopyright © 2024 Qiu, Wang, Wang, Xiao and Wei. This is an open-access article distributed under the terms of the Creative Commons Attribution License (CC BY). The use, distribution or reproduction in other forums is permitted, provided the original author(s) and the copyright owner(s) are credited and that the original publication in this journal is cited, in accordance with accepted academic practice. No use, distribution or reproduction is permitted which does not comply with these terms.
*Correspondence: Min Xiao, 202210184034@mail.scut.edu.cn
Disclaimer: All claims expressed in this article are solely those of the authors and do not necessarily represent those of their affiliated organizations, or those of the publisher, the editors and the reviewers. Any product that may be evaluated in this article or claim that may be made by its manufacturer is not guaranteed or endorsed by the publisher.
Research integrity at Frontiers
Learn more about the work of our research integrity team to safeguard the quality of each article we publish.