 Saif Jawad
 Jie Han
 Hao Liu
94% of researchers rate our articles as excellent or good
Learn more about the work of our research integrity team to safeguard the quality of each article we publish.
Find out more
ORIGINAL RESEARCH article
Front. Built Environ., 21 May 2024
Sec. Geotechnical Engineering
Volume 10 - 2024 | https://doi.org/10.3389/fbuil.2024.1365890
This article is part of the Research TopicRecent Advances in Soil ImprovementView all articles
Geo-mat system is considered as an alternative to a flexible or rigid pavement that can be used for fire lanes, parking areas, or roadway shoulders for cars, pickup trucks, utility/delivery trucks, and fire trucks. Also, it can be used to reduce the thickness of the base course in unpaved roads. In this investigation, six cyclic loading tests were conducted to assess the efficacy of the geo-mat system on weak to intermediate subgrade layers, characterized by California Bearing Ratios (CBR) of 2%, 3%, and 4%. Control sections, consisting of a 300-mm thick base course over subgrade layers with CBR values of 2% or 4%, were compared against the test sections comprising a geo-mat system placed atop aggregates of varied thickness (150 or 50 mm) on a geotextile layer over the same subgrade layers. Each test section underwent cyclic loading, progressively increasing from 17.8 to 71.2 kN using a 300-mm diameter steel plate. The results demonstrate that the geo-mat system, particularly when placed over a 150 mm-thick aggregate base, exhibited comparable or superior performance to the control sections with a 300 mm thickness, especially under substantial cyclic loading. This was evidenced by the reduced permanent deformations beneath the loading plate and a wider load distribution. The increase of the subgrade CBR value reduced the permanent deformation significantly. When the intermediate subgrade with a 4% CBR was used, the geo-mat system played a more important role than the aggregate base and the base thickness had a minor effect on the performance.
Weak subgrade soil refers to soil with low bearing capacity, high compressibility, or inadequate stability, which can lead to significant deformation and failure under loading if not properly addressed. Constructing roads on weak subgrade soils often requires a special treatment to avoid excessive deformations in the weak layer. Chemical treatment is one of the solutions widely used to improve the properties of the weak soils; however, this type of treatment is often costly and requires special equipment and procedure. Another solution is to place a layer of aggregate base over the weak subgrade to reduce the stresses on the weak soil. Even though this choice is commonly used in practice, it needs a large amount of materials and considerable effort for compaction and it is more suitable for permanent road projects. For temporary roads, such as fire lanes, parking areas, or roadway shoulders for cars, pickup trucks, utility/delivery trucks, and fire trucks, a geosynthetic mat-system has apparent advantages over the previous solutions.
The geo-mat system, one type of geosynthetics, is composed of interconnected plastic cells, which can function as a stiff load-distribution foundation for unpaved roads. The use of the geo-mat system over weak soils presents an alternative method to enhancing the performance and durability of roads in the areas where traditional paved roads might not be practical or cost-effective. The benefit of this technique can be summarized as improving the load distribution, enhancing the bearing capacity, minimizing soil particle migration, reducing maintenance need, minimizing rutting and deformations, and having quick installation.
The use of geosynthetics to stabilize the base aggregate and to reduce the load distributed on the weak subgrade in the road projects has been investigated by several researchers (Giroud and Han, 2004a; Giroud and Han, 2004b; Sun et al., 2015; Correia and Zornberg, 2016; Sun and Han, 2019a; Sun and Han, 2019b; Sun et al., 2020a; Sun et al., 2020b). Other research has also been conducted on using geosynthetics in mechanically stabilized earth (MSE) walls and geosynthetic-reinforced soils (GRS) (Karpurapu and Bathurst, 1995; Shen et al., 2019; 2020; Kakrasul et al., 2020; Liu et al., 2022; Jawad et al., 2020; 2021).
The benefit of geosynthetics in reducing the thickness of base layer has also been investigated through conducting several experimental studies (Anderson and Killeavy, 1989; Miura et al., 1990; Webster, 1993; Gupta, 2009; Rejwanur Rahman et al., 2021). Anderson and Killeavy (1989) found that the use of a geotextile reduced the base thickness from 450 mm in the unreinforced section to 350 mm in the reinforced section. Miura et al. (1990) observed in the field that the reinforced sections with a 50 mm less base course outperformed the control sections without any reinforcement across all rut depths. Webster (1993) found that, on a subgrade with a California Bearing Ratios (CBR) of 8%, the section consisting of a geogrid with a 150-mm thick base showed equivalent performance to an unreinforced section with a 250-mm thick base. Gupta (2009) reported the base course reduction in the range of 20%–40% after geosynthetic reinforcement, with a greater percentage reduction observed for weaker subgrade. Rejwanur Rahman et al. (2021) conducted four large-scale tests to evaluate the performance of geocell-stabilized base course versus the non-stabilized section placed on the subgrade with different CBR values. Their results revealed that the performance of a geocell layer with a 58% thinner base course was better than that of a non-stabilized base course. Moreover, the effect of the geocell was more obvious when it was placed on the weak subgrade than on the intermediate subgrade.
Even though the geo-mat system is not new innovation, limited studies have been conducted as compared to geogrid, geotextile, and geocell. Gartrell et al. (2009) assessed the performance of six types of mat systems constructed on low strength soil (5%–6% CBR), medium strength soil (8%–10% CBR), and strong soil (40%–50% CBR). They plotted rut depths with the number of passes for each test section and found that some mat systems experienced deformations more or less than the allowable rutting depth, while other mat systems had mechanical failure due to the applied load. Rushing and Howard (2011) examined 11 matting systems placed over loose sand and/or weak fine soils and then estimated a rut depth using the developed regression equations. The failure criteria in their full-scale tests were 20% damage in the mat system or the rut depth exceeding 75 mm. Another experimental study was conducted on geo-mat systems that were made of different types of materials and subjected to aircraft loading (Dolye et al. 2014). Sun et al. (2021) developed an analytical method to evaluate the vertical resistance by the geo-mat system and the reduced vertical stresses on the subgrade layer, which were verified by numerical results and experimental data.
This study was designed to compare the performance of geo-mat systems over weak to intermediate subgrades with a typical section of 300 mm-thick base course layer placed over subgrade layers of different strengths. The comparisons between the tests were conducted based on the surface permanent deformation, the vertical stress at the interface, and the angle of load distribution.
The subgrade material used in this study was a mix of kaolin clay (plasticity index, PI = 24) and non-plastic concrete sand (ASTM, 2018) at a mixing ratio 1:3 (i.e., 25% clay and 75% sand) based on their dry masses. Three subgrades at different CBR values were prepared at different moisture contents in this study. The subgrade with a nominal CBR value of 2% was prepared at a moisture content of approximately 9.8%, while the intermediate subgrades with nominal CBR values of 3% and 4% were prepared at the moisture contents of approximately 8.9% and 8.5%, respectively. The maximum dry unit weight of the subgrade was 20.3 kN/m3. The subgrade was compacted in six layers of 150 mm thick each layer at the desired moisture content and density to achieve the required CBR value.
To control the quality of the subgrade material during construction, vane shear tests were conducted according to ASTM (2016c) for each subgrade layer, and also Dynamic Cone Penetrometer (DCP) tests according to ASTM (2016d) were conducted after the completion of the subgrade layers and after the placement of the aggregate base.
The base course material used in all test sections was Virgin Granular Base (VGB) that is usually utilized in road projects and meets the specifications of the Kansas Department of Transportation (KDOT) for granular base courses under concrete pavements (KDOT, 2018). Figure 1 shows the gradation curves of the base course along with the upper and lower limits defined by KDOT (2018) . The plasticity index of the VGB particles passing No. 40 sieve was 7 and the optimum moisture content and its corresponding maximum dry unit weight according to modified Proctor tests (ASTM, 2016b) were 7.1% and 21.2 kN/m3, respectively. The nominal CBR value of the aggregate base at the moisture content of approximately 7.1% was 15% and verified by DCP tests after the preparation of each test section.
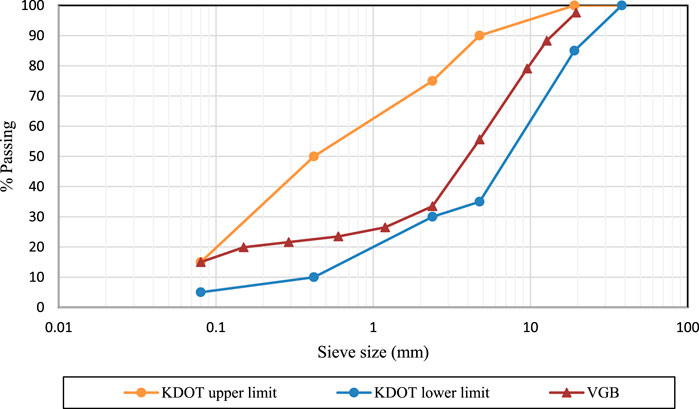
Figure 1. Base course material gradation.
A nonwoven geotextile layer was placed between the aggregate base and the subgrade and anchored to the subgrade layer at the four corners of the test box. Nonwoven geotextile is commonly used for a variety of functions including separation, filtration, and drainage for geotechnical engineering projects. Table 1 shows the parameter values of the nonwoven geotextile used in the tests.
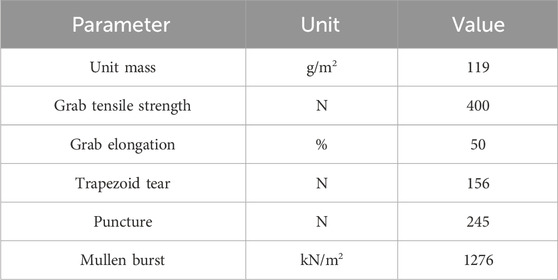
Table 1. Specifications and parameters of the nonwoven geotextile (provided by the manufacturer).
The geo-mat made of high-density polyethylene material consists of porous cells with the mat dimensions of 1 m long, 0.5 m wide, and 0.05 m high. Each cell is either rectangular (83 mm × 165 mm) or square (83 mm × 83 mm) to provide confinement to aggregate filled in the cell. The geo-mats were connected using U-shape steel clips to form a geo-mat system. Figure 2 shows the geo-mat system configuration in the test box.
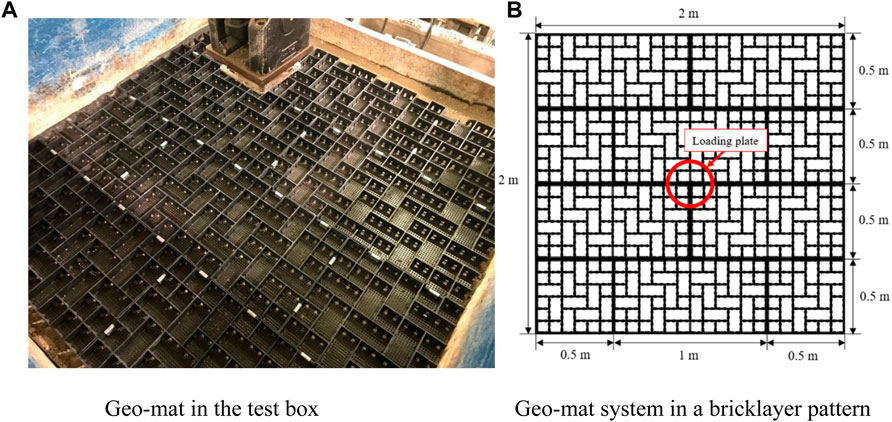
Figure 2. Configuration of the geo-mat system: (A) geo-mat in the test box and (B) geo-mat in a bricklayer pattern.
Totally six large-scale tests were constructed inside a test box with dimensions of 2.0 m × 2.2 m × 2.0 high. In each test, six subgrade layers with a thickness of 150 mm were placed and compacted by an electrical compactor to a target CBR value (i.e., 2%, 3%, or 4%). Five vane shear tests were conducted at two depths for each compacted subgrade layer to confirm the CBR value. After the completion of the subgrade layers, four dynamic cone penetrometer (DCP) tests were conducted at different locations for each test section. In the control sections (i.e., without a geo-mat system), the base course material was compacted in two layers with a thickness of 150 mm. In the test sections with the geo-mat system, a nonwoven geotextile layer was placed on the top surface of the subgrade and anchored to the subgrade layer by stakes at the four corners of the test box before the placement of the base course layer. The base course material was placed and compacted in one layer of different thickness (i.e., 150 mm and 50 mm) as desired. Sand cone method (ASTM, 2016a) was carried out for the base course layer to confirm the relative compaction not less than 95% of the maximum dry unit weight. Three more DCP tests were carried out after the compaction of the aggregate base to confirm the CBR values for the aggregate base and the subgrade. The correlation developed by Webster et al. (1994) as shown in Eq. 1 has been commonly used in the literature to estimate the CBR values of the base and the subgrade from the DCP tests. The CBR value of the subgrade has also been correlated with its undrained shear strength in the literature. Walkenbach et al. (2019) established the correlation between the subgrade CBR value and its undrained shear strength from the vane shear test as shown in Eq. 2, specifically for the subgrade used in this study. The geo-mat units were placed on top of the base course and connected together by U-shape clips and then filled in with compacted virgin granular base material. Table 2 presents the average CBR values calculated from the DCP test and the vane shear test for the subgrade and the base course layers.
where DPI = dynamic penetration index in mm/blow and cu = undrained shear strength from the vane shear test in kPa.
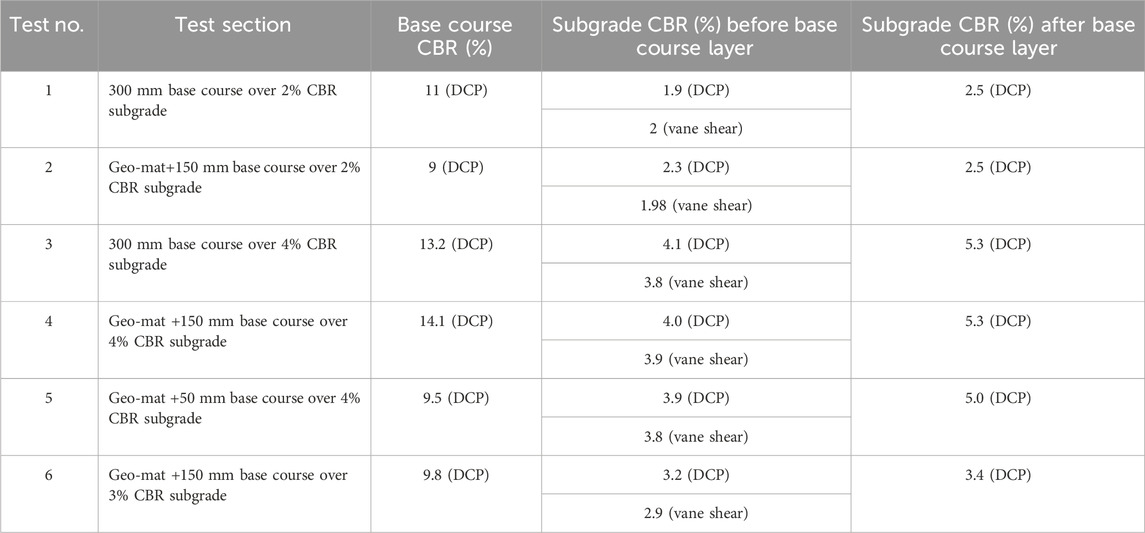
Table 2. Summary of base and subgrade conditions in six test sections.
Since the length of the geo-mat unit was 1 m, two of the geo-mat units were cut in halves in all the test sections to arrange the geo-mat units in bricklayer pattern inside the test box with the dimension of 2 × 2 m. The mat inside the test box was consisted of six complete geo-mat units and four-halves units. The complete mat unit was connected to the adjacent mats by 12 steel clips, while the cut mats were connected to others by six steel clips. The load was applied on a 300-mm diameter steel plate seated on three adjacent mats. Figure 2B shows the bricklayer pattern of the geo-mat system with the location of the loading plate.
Cyclic load increments of 17.8, 35.6, 53.4, and 71.2 kN were applied on the top surface to simulate different axle loads ranging from a small axle load to an H-20 load that has a single axle load of 142.4 kN (i.e., each tire 71.2 kN). The time for each single cycle of load was 1.3 s, i.e., a frequency of 0.77 Hz. The actuator produced cyclic loading in a trapezoidal waveform with a minimum load magnitude of 0.2 kN as shown in Figure 3. A pre-installed displacement transducer (i.e., inside the actuator) was used to measure the loading plate displacements during the test. Three more displacement transducers were placed on the surface of the base course or the geo-mat at distances of 300, 450, and 600 mm from the loading plate center. To measure the vertical stress at the interface between the subgrade and the aggregate base, six earth pressure cells were used in each test, four of them, installed at the center and at distances of 150, 300, and 450 mm from the loading plate center, and the other two placed in the transverse direction in front and behind the loading plate at the distance of 300 mm from the center. Figure 4 shows the schematics of the test sections with the locations of sensors.
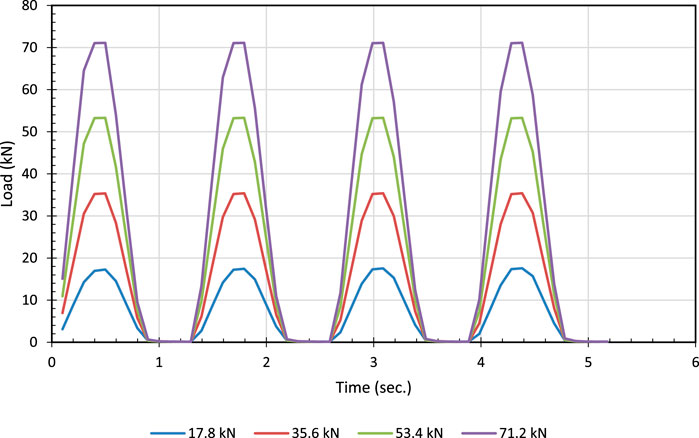
Figure 3. Cyclic loading wave form.
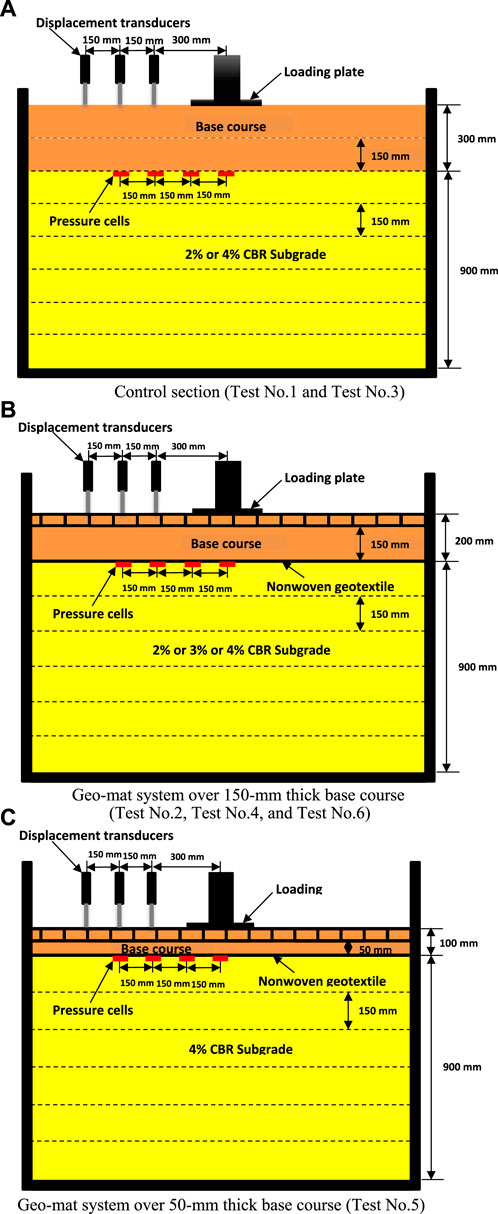
Figure 4. Schematics of test sections.
Figure 5 shows the displacements of the six tests under the loading plate subjected to incrementally cyclic loading. Each load increment was applied to the maximum cycle number of 2000, or until the maximum displacement reached 75 mm or more in some tests. The permanent displacement represents the smallest displacement in the curve for each load increment, while the resilient displacement is the band thickness of the curve (i.e., the maximum displacement minus the permanent displacement). Figure 5A presents a comparison between the two control test sections with different subgrade CBR values. As expected, the control test with a strong subgrade (i.e., 4% CBR) showed less vertical displacement and higher load bearing capacity than the control test with a weak subgrade (i.e., 2% CBR). For example, at the end of the cyclic load of 17.8 kN, the maximum displacement under the loading plate center decreased by 38.5% when the CBR value increased from 2% to 4%. Also, the control test section with the weak subgrade reached a punching failure at the cyclic load of 35.6 kN while the test section with the intermediate subgrade (i.e., 4% CBR) failed at the cyclic load of 54.4 kN. To assess the performance and the benefit of the geo-mat system, comparisons between the control test sections and the geo-mat test sections were made at different CBR values of subgrade. Figure 5B shows the comparison between the control and geo-mat sections on the weak subgrade. The test results show that both tests failed before completing 2000 cycles at the cyclic load of 35.6 kN. At the cyclic load of 17.8 kN, the control section exhibited less displacement as compared with the geo-mat section, e.g., at the end of cycle number, the permanent displacement in the control section was 16.6 mm while 25.6 mm in the geo-mat section. This behavior changed when the cyclic load increased to 35.6 kN. Even though both tests failed before completing 2000 cycles of the load increment of 35.6 kN, the permanent displacements at 500 cycles of load were 82 mm for the control section and 71.1 mm for the geo-mat section, respectively. It should be pointed out that the geo-mat section had a base course layer of 150 mm thinner than the control section. Figure 5C shows the comparison between the control and geo-mat sections on 4% CBR subgrade. The test results show almost the same performance for both tests up to the cyclic load of 35.6 kN, but the geo-mat section exhibited more bearing capacity than the control section with the increasing cyclic load. For example, the control section failed at the cyclic load of 53.4 kN while the test section failed at the cyclic load of 71.2 kN. Figure 5D presents the comparison between the geo-mat test sections with different base course thicknesses (i.e., 50 mm and 150 mm) and different CBR values of subgrade. The test results show that the bearing capacity of the test section increased with the increase of the subgrade CBR value. Moreover, the thickness of the base course layer had insignificant effect on the bearing capacity of the test section on the intermediate subgrade (i.e., 4% CBR).
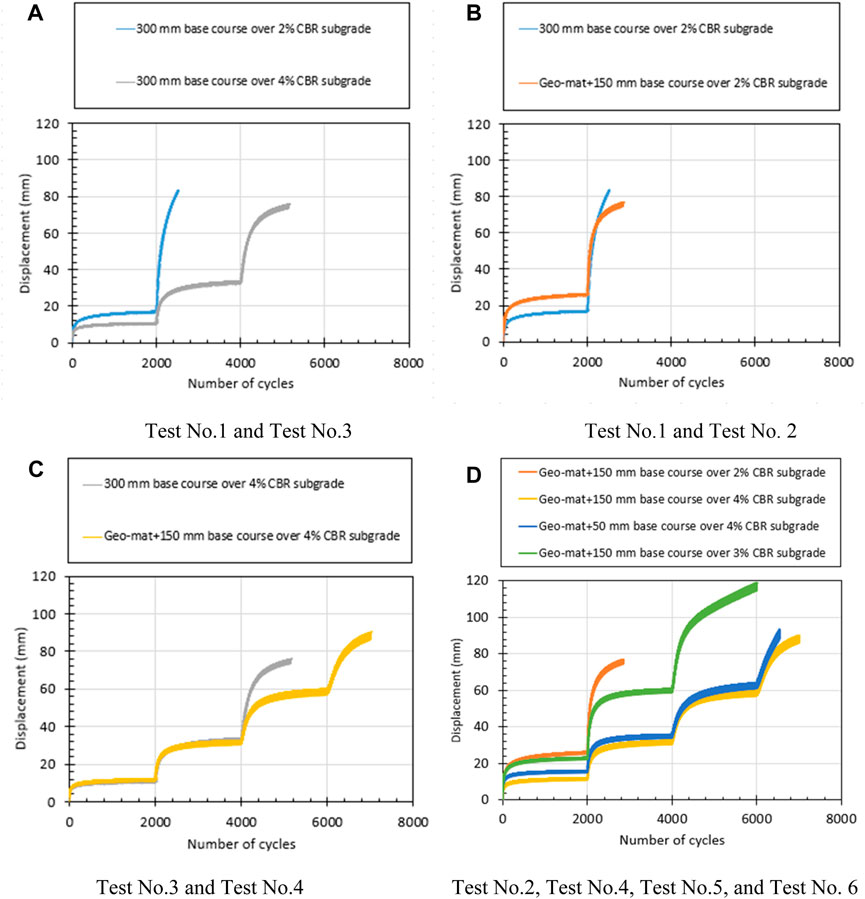
Figure 5. Loading plate displacement during cyclic loading: (A) Test No. 1 and Test No. 3, (B) Test No. 1 and Test No. 2, (C) Test No. 3 and Test No. 4, and (D) Test No. 2, Test No. 4, Test No. 5, and Test No. 6.
To quantify the benefits of the geo-mat system at different cyclic loads, permanent displacements induced by each cyclic load increment were determined and are presented in Table 3. The permanent displacements were reported at the last cycle of each load increment or at the cycle when the displacement under the loading plate reached the maximum value (approximately 75 mm or higher). Table 3 shows that the geo-mat system reduced the permanent displacement by approximately 13% at the cyclic load of 35.6 kN for the 2% CBR subgrade and 24.8% at the cyclic load of 53.4 kN for the 4% CBR subgrade.

Table 3. Summary of permanent displacements due to load increments.
Figures 6–11 show the vertical stresses at the interface between the aggregate base and the subgrade at different locations with the number of loading cycles. Figures 6, 8 present that the measured vertical stresses at the interface in the control tests at the center and a distance of 150 mm from the center increased with the number of cycles, while the measured stresses decreased at the locations from the distances of 300 mm–450 mm. Qian et al. (2013) reported the same behavior and Giroud and Han (2004a) attributed this phenomenon to the decreasing load distribution angle with base course deterioration due to the increasing loading cycles.
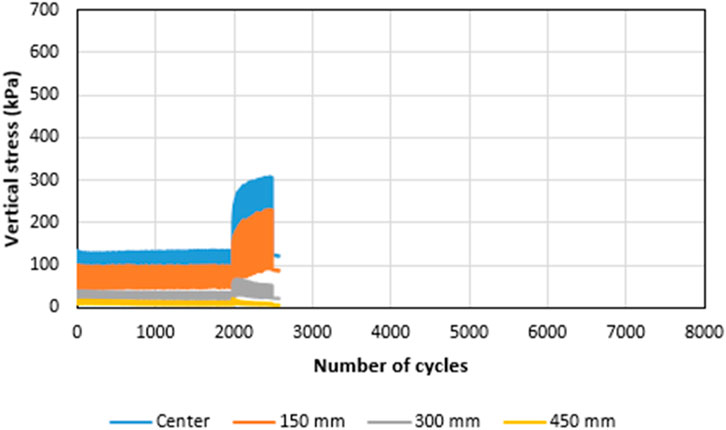
Figure 6. Vertical stresses at the interface in the control test section with the 300-mm thick base course on 2% CBR subgrade.
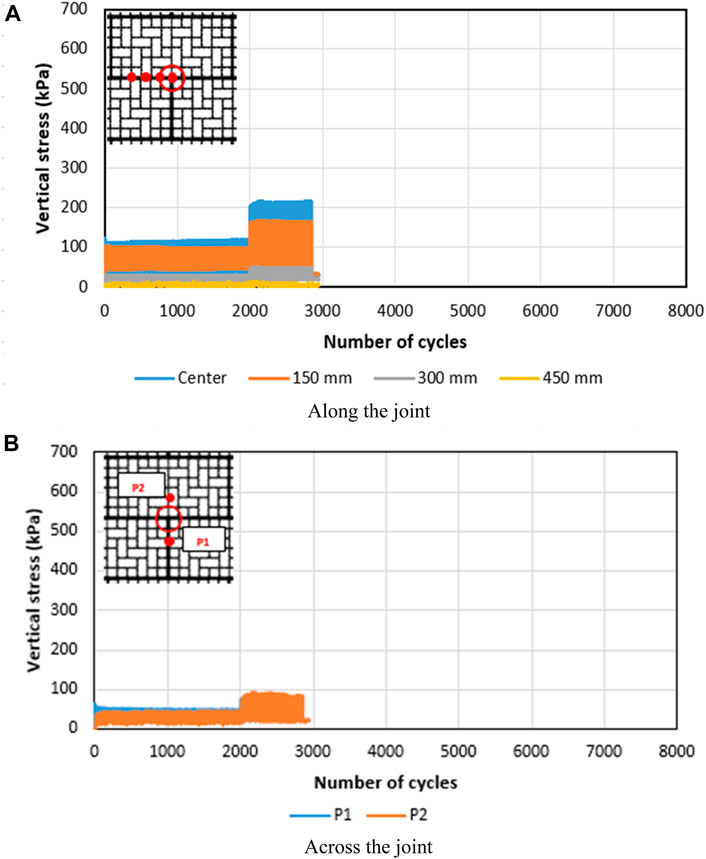
Figure 7. Vertical stresses at the interface in the geo-mat test section over the 150-mm thick aggregate base on 2% CBR subgrade (A) Along the joint, and (B) Across the joint.
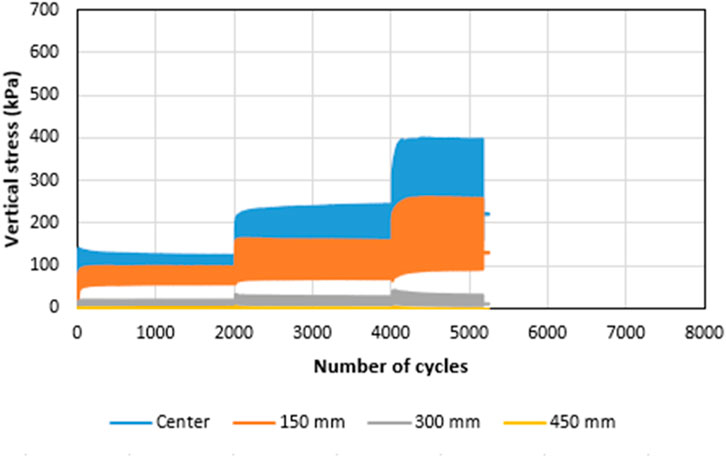
Figure 8. Vertical stresses at the interface in the control test section with the 300-mm thick base course on 4% CBR subgrade.
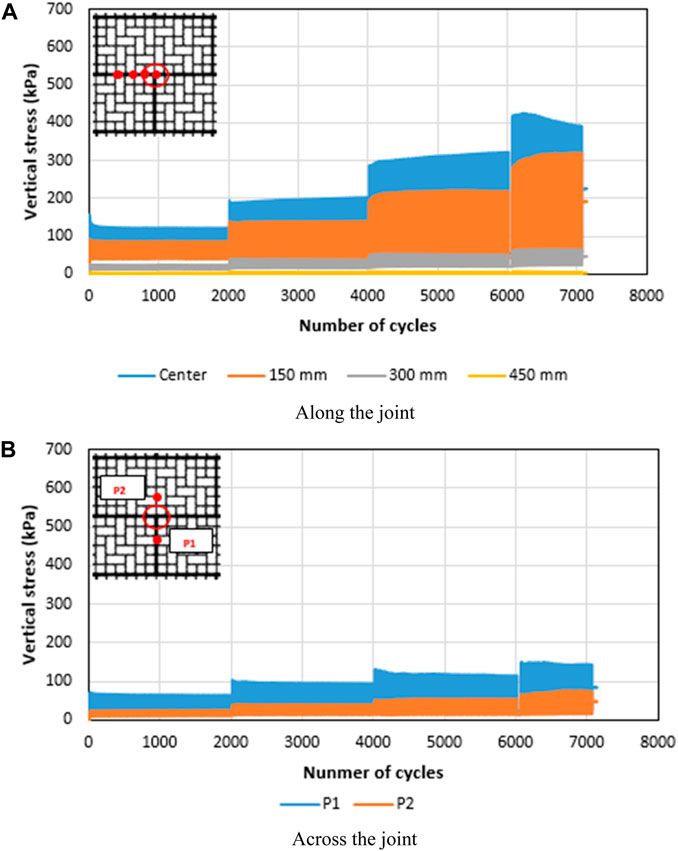
Figure 9. Vertical stresses at the interface in the geo-mat test section over the 150-mm thick aggregate base on 4% CBR subgrade: (A) Along the joint, and (B) Across the joint.
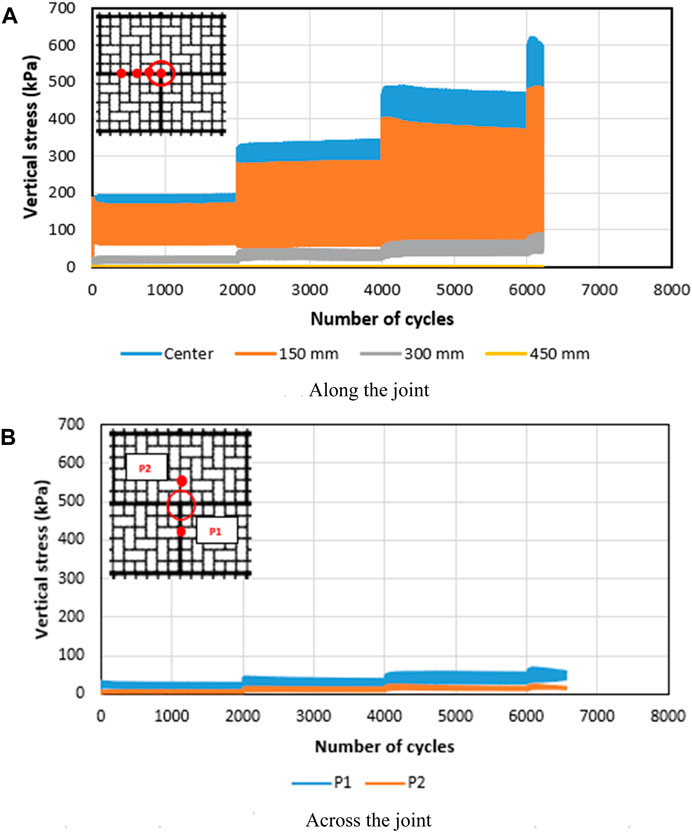
Figure 10. Vertical stresses at the interface in the geo-mat test section over the 50-mm thick aggregate base on 4% CBR subgrade: (A) Along the joint, and (B) Across the joint.
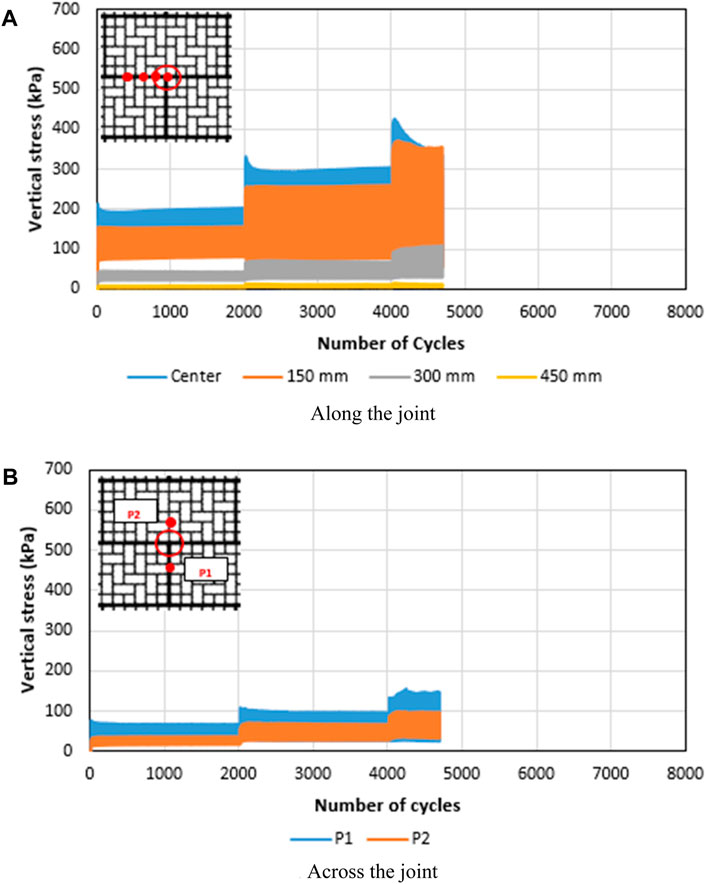
Figure 11. Vertical stresses at the interface in the geo-mat test section over the 150-mm thick aggregate base on 3% CBR subgrade: (A) Along the joint, and (B) Across the joint.
Figure 7A shows that the geo-mat system over the 150-mm thick base course on the 2% CBR subgrade reduced the vertical stresses at the center and at the distance of 150 mm from the center as compared to those of the control section in Figure 6. For example, at the cyclic load of 35.6 kN, approximately 30% stress reduction was observed at the center and at the distance of 150 mm from the center. This reduction in the vertical stresses can be attributed to the combined stiffness of the geo-mat and the aggregate filled in the geo-mat cells, indicating that the combined stiffness was higher than the stiffness of the 150-mm thick aggregate base.
Figures 7B, 9B, 10B, 11B show the vertical stresses at the distance of 300 mm from the loading plate center in two different locations. The first location marked as P1 was at the interface between the base course and the subgrade beneath the joint of two geo-mats, while the second location marked as P2 was beneath one geo-mat. In general, the stresses at the location of P1 were higher than those at P2. This phenomenon happened because the rigidity or the flexural modulus of the geo-mat system at the joint was lower, thus transferring more load to the base course under the geo-mat system. The test results also show that the difference between the vertical stresses at P1 and P2 increased with the CBR value of the subgrade. At the 2% CBR subgrade, the vertical stress at P1 was almost the same as that at P2; however, it increased to almost double and triple the stress at P2 in the test sections on 3% and 4% CBR subgrade, respectively.
The results of the test sections on the 4% CBR subgrade show that the vertical stresses in the test section with the geo-mat over the 50-mm thick aggregate base (Figure 10A) were higher than those in the other test sections (Figures 6, 7A, 8A, 9A). This might be because the load was distributed through the 50-mm thick base course on a smaller area. Moreover, the stress was lower at the center than that at the distance of 150 mm from the loading plate center. This behavior is attributed to two reasons: 1) an increase in the permanent deformation with loading cycles reduced the contact between the mat and the base course and 2) the rigidity and the bending effect reduced the stress near to the center. The vertical stresses under the geo-mat system over the 150 mm-thick aggregate base (Figure 9A) were slightly lower than those in the control section with the 300-mm thick aggregate base (Figure 8); however, these differences in the vertical stresses increased with the cyclic load increments.
To assess the benefits resulting from the geo-mat system on the base course, the angle of load distribution through the base course in each test was determined based on the force equilibrium and the trigonometric principle as shown in Eqs 3, 4, respectively.
where d = diameter of the loading plate; p = applied pressure; σc = measured vertical interface stress between the base course and the subgrade; D = distributed diameter on the subgrade; H = thickness of the base course or the thickness of the base course and the geo-mat; α = load distribution angle.
The measured vertical stress used in Eq. 3 is the maximum vertical stress at the last cycle of each load increment or the last cycle before failure. Using both equations, the load distribution angle was determined for each test at different load increment. Figure 12 presents the relationship between the applied load and the ratio of the load distribution angles between the geo-mat and the control test sections at different subgrade CBR values. Figure 12 shows that the ratio of the load distribution angle increased with the decrease in the thickness of the base course and the subgrade CBR value. The test results also show that the ratio of the load distribution angle increased with the applied load, indicating the geo-mat helped distribute the load onto a wider area under a higher load.
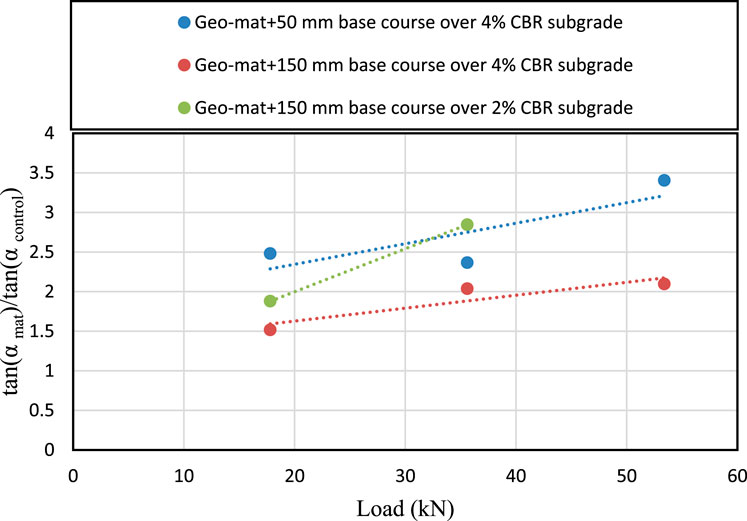
Figure 12. Relationship between the applied load and the ratio of the load distribution angle with and without geo-mat.
Figure 13 presents the vertical displacement atop the surface of the geo-mat or the aggregate base measured from the loading plate center to the distance of 600 mm from the plate center. The results represent the permanent displacements at the last cycle of each load increment. Considering the high rigidity of the loading plate, the vertical displacement at the distance of 150 mm from the center of the loading plate was assumed to be equal to that measured loading plate center. In general, the vertical displacement profile was similar in all the test sections, i.e., the maximum displacement under the loading plate and the displacement dramatically decreased with an increase of the distance from the plate edge. The geo-mat sections showed some negative displacements or heave at the distance of 450 mm and farther; however, their values were small (i.e., less than 3 mm) because of the steel clip effect that connected the loaded geo-mat with the adjacent mats. The test results in Figure 13A show that the maximum vertical displacement in the control section with a weak subgrade (i.e., 2% CBR) was 34.5% less than the geo-mat section of the same subgrade strength but the control section had the base course of 100% thicker than the geo-mat section. This percentage of displacement difference decreased to 8.7% with the subgrade CBR value increasing from 2% to 4%, indicating that the effect of the geo-mat system is more significant for the weaker subgrade. Moreover, reducing the base course layer from 150 to 50 mm increased the maximum vertical displacement by 36%. With increasing the applied load from 17.8 kN to 35.6 kN, the control and geo-mat sections with 4% CBR subgrade had similar vertical displacements under the plate but the control section had the base course of 100% thicker than the geo-mat section as shown in Figure 13.
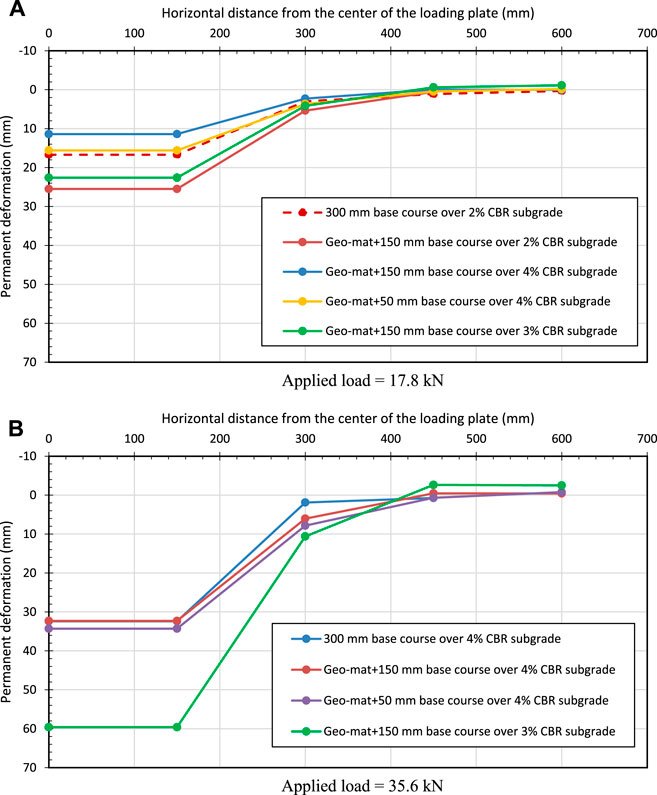
Figure 13. Vertical displacements on the top surface of test sections at different cyclic loads. (A) Applied load = 17.8 kN and (B) Applied load = 35.6 kN.
Visual inspections were conducted before and after the removal of the geo-mat units to identify whether the mat units sustained any damage after cyclic loading. The inspection showed that all the steel clips remained at their positions connecting the geo-mat units together during the test; however, a gap of approximately 25 mm wide was observed between the joints of the geo-mat units close to the loading plate. Even though the high load and the large number of loading cycles were applied, insignificant distortions were observed on the wall of the geo-mat under the loading plate.
Six large-scale experimental tests were carried out on the base course and the geo-mat system over different CBR subgrades. These six tests included two control test sections of the 300-mm thick aggregate base on 2% and 4% CBR subgrades, three geo-mat sections over the 150-mm thick aggregate base on 2%, 3%, and 4% CBR subgrades, and one geo-mat section over the 50-mm thick aggregate base on the 4% CBR subgrade. The following conclusions can be drawn from these tests:
1. The geo-mat system provided additional support for weak to intermediate subgrade subjected to cyclic loading by reducing permanent deformations. For the geo-mat system over the intermediate subgrade, the permanent deformation at the cyclic load of 53.4 kN decreased by 24.8% as compared to the control section.
2. The subgrade CBR value had a significant effect on the performance of the geo-mat section under cyclic loading including the maximum load each section could carry. The subgrade with a larger CBR value performed much better than that with a smaller CBR value.
3. The geo-mat system over the 150-mm thick aggregate base performed almost equally or even better than the control section of the 300-mm thick aggregate base on both weak and intermediate subgrades.
4. On the intermediate subgrade, the geo-mat system had a more important effect than the aggregate base course and the influence of the base thickness from 50 to 150 mm was not significant.
5. The geo-mat system over the 150-mm thick base course on the intermediate subgrade reduced the maximum vertical interface stress at the cyclic load of 53.4 kN by approximately 25% as compared to the control section with the 300-mm thick base course. This percentage of reduction increased to 33% at the cyclic load of 35.6 kN when a weak subgrade was used.
6. The vertical interface stresses along the geo-mat joint were much higher than those across the joint in all geo-mat tests due to the stiffness difference.
7. In the direction across the joint, the vertical interface stress under the joint of the geo-mat was similar to that away from the joint when the geo-mat was placed on weak subgrade; however, the vertical interface stress under the joint of the geo-mats was two to three times higher than that away from the joint when the geo-mat was placed on the intermediate subgrade.
8. The geo-mat helped distribute the applied load onto a wider area on the subgrade and this benefit increased with the increase of the applied load.
9. No significant damage caused to the geo-mat system was observed during and after cyclic loading tests.
10. This study is limited to the performance of the geo-mat system made of high-density polyethylene material and placed on a layered foundation comprising a base course and a subgrade of weak to intermediate strength subjected to cyclic loading not exceeding 71.2 kN. For the future scope, more studies can be conducted to evaluate its long-term performance and optimize its design parameters.
The original contributions presented in the study are included in the article/Supplementary Material, further inquiries can be directed to the corresponding author.
SJ: Investigation, Methodology, Validation, Data curation, Formal Analysis, Writing–original draft. JH: Conceptualization, Funding acquisition, Investigation, Methodology, Project administration, Resources, Supervision, Validation, Writing–review and editing. HL: Data curation, Investigation, Writing–review and editing.
The author(s) declare that financial support was received for the research, authorship, and/or publication of this article. This research was financially sponsored by Presto Geosystems. The funder was not involved in the study design, collection, analysis, interpretation of data, the writing of this article, or the decision to submit it for publication.
Mr. Bryan Wedin, P.E., Chief Design Engineer, provided technical guidance for this research. Undergraduate research assistant, Lucas Spriggs, provided great assistance in the preparation of test sections and operation of the testing equipment.
The authors declare that the research was conducted in the absence of any commercial or financial relationships that could be construed as a potential conflict of interest.
The author(s) declared that they were an editorial board member of Frontiers, at the time of submission. This had no impact on the peer review process and the final decision.
All claims expressed in this article are solely those of the authors and do not necessarily represent those of their affiliated organizations, or those of the publisher, the editors and the reviewers. Any product that may be evaluated in this article, or claim that may be made by its manufacturer, is not guaranteed or endorsed by the publisher.
Anderson, P., and Killeavy, M. (1989). “Geotextiles and Geogrids: cost effective alternate materials for pavement design and construction,” in Geosynthetics, Conference, 1989, San diego, California, USA, Aug 24 2012.
ASTM (2018). Standard specification for concrete aggregates. America, West Conshohocken, PA: American Society for Testing and Materials (ASTM) International.
ASTM (2016a). Standard test method for density and unit weight of soil in place by sand-cone method. America: West Conshohocken, PA: American Society for Testing and Materials (ASTM) International.
ASTM (2016b). Standard test methods for laboratory compaction characteristics of soil using modified effort. America, West Conshohocken, PA: American Society for Testing and Materials (ASTM) International.
ASTM (2016c). Standard test method for field vane shear test in saturated fine-grained soils. America, West Conshohocken, PA: American Society for Testing and Materials (ASTM) International.
ASTM (2016d). Standard test method for soil compaction determination at shallow depths using 5-lb (2.3 kg) dynamic cone penetrometer. America, West Conshohocken, PA: American Society for Testing and Materials (ASTM) International.
Correia, N. S., and Zornberg, J. G. (2016). Mechanical response of flexible pavements enhanced with geogrid-reinforced asphalt overlays. Geosynth. Int. 23 (3), 183–193. doi:10.1680/jgein.15.00041
Doyle, J. D., Howard, I. L., Gartrell, C. A., Anderton, G. L., Newman, J. K., and Berney IV, E. S. (2014). Full-scale instrumented testing and three-dimensional modeling of airfield matting systems. Int. J. Geomechanics 14 (2), 161–170. doi:10.1061/(asce)gm.1943-5622.0000272
Gartrell, C. A., Newman, J. K., and Anderton, G. L. (2009). Performance measurements of pavement matting systems by full-scale testing over differing soil strengths. J. Mater. Civ. Eng. 21 (10), 561–568. doi:10.1061/(asce)0899-1561(2009)21:10(561)
Giroud, J. P., and Han, J. (2004a). Design method for geogrid-reinforced unpaved roads. I. Development of design method. J. Geotechnical Geoenvironmental Eng. 130 (8), 775–786. doi:10.1061/(asce)1090-0241(2004)130:8(775)
Giroud, J. P., and Han, J. (2004b). Design method for geogrid-reinforced unpaved roads. II. Calibration and applications. J. Geotechnical Geoenvironmental Eng. 130 (8), 787–797. doi:10.1061/(ASCE)1090-0241(2004)130:8(787)
Gupta, R. (2009). A study of geosynthetic reinforced flexible pavement system. Austin: University of Texas. Doctorial diss.
Jawad, S., Han, J., Abdulrasool, G., and Al-Naddaf, M. (2021). Responses of single and group piles within MSE walls under static and cyclic lateral loads. Geotext. Geomembranes 49 (4), 1019–1035. doi:10.1016/j.geotexmem.2021.01.010
Jawad, S., Han, J., Al-Naddaf, M., and Abdulrasool, G. (2020). Responses of laterally loaded single piles within mechanically stabilized earth walls. J. Geotechnical Geoenvironmental Eng. 146 (12), 04020128. doi:10.1061/(asce)gt.1943-5606.0002388
Kakrasul, J. I., Han, J., and Rahmaninezhad, S. M. (2020). Load-deformation behavior of geosynthetic-reinforced retaining walls with limited fill space under static footing loading. Transp. Infrastruct. Geotechnol. 7, 309–331. doi:10.1007/s40515-020-00132-9
Karpurapu, R., and Bathurst, R. J. (1995). Behaviour of geosynthetic reinforced soil retaining walls using the finite element method. Comput. geotechnics 17 (3), 279–299. doi:10.1016/0266-352x(95)99214-c
Liu, H., Han, J., Jawad, S., and Parsons, R. L. (2022). Effects of traffic loading on seasonal temperature change-induced problems for integral bridge approaches and mitigation with geosynthetic reinforcement. Int. J. Geomechanics 22 (6), 04022082. doi:10.1061/(asce)gm.1943-5622.0002393
Miura, N., Sakai, A., Taesiri, Y., Yamanouchi, T., and Yasuhara, K. (1990). Polymer grid reinforced pavement on soft clay grounds. Geotext. Geomembranes 9 (1), 99–123. doi:10.1016/0266-1144(90)90007-y
Qian, Y., Han, J., Pokharel, S. K., and Parsons, R. L. (2013). Performance of triangular aperture geogrid-reinforced base courses over weak subgrade under cyclic loading. ASCE J. Mater. Civ. Eng. 25 (8), 1013–1021. doi:10.1061/(asce)mt.1943-5533.0000577
Rejwanur Rahman, M., Jawad, S., and Han, J. (2021). Equivalency of geocell-stabilized aggregate base to non-stabilized aggregate base over weak subgrade under static loading. IFCEE, 530–540. doi:10.1061/9780784483411.050
Rushing, T. W., and Howard, I. L. (2011). Matting solutions for low-volume roads. Transp. Res. Rec. 2204 (1), 92–101. doi:10.3141/2204-12
Shen, P., Han, J., Zornberg, J. G., Morsy, A. M., Leshchinsky, D., Tanyu, B. F., et al. (2019). Two and three-dimensional numerical analyses of geosynthetic-reinforced soil (GRS) piers. Geotext. Geomembranes 47 (3), 352–368. doi:10.1016/j.geotexmem.2019.01.010
Shen, P., Han, J., Zornberg, J. G., Tanyu, B. F., Christopher, B. R., and Leshchinsky, D. (2020). Responses of geosynthetic-reinforced soil (GRS) abutments under bridge slab loading: numerical investigation. Comput. Geotechnics 123, 103566. doi:10.1016/j.compgeo.2020.103566
Sun, X., Guo, J., Han, J., and Guo, K. (2021). Stress analysis of geosynthetic access mat systems over weak subgrade. Comput. Geotechnics 134, 104071. doi:10.1016/j.compgeo.2021.104071
Sun, X., and Han, J. (2019). Mechanistic-empirical analysis of geogrid-stabilized layered systems: Part I. Solutions. Geosynth. Int. 26 (3), 273–285. doi:10.1680/jgein.19.00006
Sun, X., and Han, J. (2019). Mechanistic-empirical analysis of geogrid-stabilized layered systems: Part II. Analysis. Geosynth. Int. 26 (3), 286–296. doi:10.1680/jgein.19.00007
Sun, X., Han, J., Kwon, J., Parsons, R. L., and Wayne, M. H. (2015). Radial stresses and resilient deformations of geogrid-stabilized unpaved roads under cyclic plate loading tests. Geotext. Geomembranes 43 (5), 440–449. doi:10.1016/j.geotexmem.2015.04.018
Sun, X., Han, J., Zhao, Y., Guo, J., Huang, L., and Zhang, W. (2020). Analysis of geosynthetic-stabilized base course over a subgrade considering base modulus degradation in a transversely isotropic layered elastic system. Comput. Geotechnics 125, 103668. doi:10.1016/j.compgeo.2020.103668
Sun, X. H., Han, J., Fei, J. B., Guo, J., and Zhang, W. Y. (2020). Geosynthetic-stabilized flexible pavements: solution derivation and mechanistic-empirical analysis. Geotext. Geomembranes 48 (4), 468–478. doi:10.1016/j.geotexmem.2020.02.005
Walkenbach, T. N., Han, J., Li, Z., and Parsons, R. L. (2019). “Evaluation of composite subgrade reaction modulus of geosynthetic-stabilized recycled subbase over subgrade,” in Eighth international conference on case histories in geotechnical engineering (Reston, VA: American Society of Civil Engineers), 212–221.
Webster, S. L. (1993). Geogrid reinforced base courses for flexible pavements for light aircraft, test section construction, behavior under traffic, laboratory tests, and design criteria. Technical report GL-93-6. USA: U.S. Army Corps of Engineers, Waterways Experiment Station, Vicksburg, 86p.
Keywords: geo-mat system, aggregate base, weak subgrade, cyclic loading, permanent deformation
Citation: Jawad S, Han J and Liu H (2024) Experimental evaluation of performance of geo-mat system on weak to intermediate subgrade . Front. Built Environ. 10:1365890. doi: 10.3389/fbuil.2024.1365890
Received: 05 January 2024; Accepted: 23 April 2024;
Published: 21 May 2024.
Edited by:
Prabir K. Kolay, Southern Illinois University Carbondale, United StatesReviewed by:
Umashankar Balunaini, Indian Institute of Technology Hyderabad, IndiaCopyright © 2024 Jawad, Han and Liu. This is an open-access article distributed under the terms of the Creative Commons Attribution License (CC BY). The use, distribution or reproduction in other forums is permitted, provided the original author(s) and the copyright owner(s) are credited and that the original publication in this journal is cited, in accordance with accepted academic practice. No use, distribution or reproduction is permitted which does not comply with these terms.
*Correspondence: Jie Han, amllaGFuQGt1LmVkdQ==
Disclaimer: All claims expressed in this article are solely those of the authors and do not necessarily represent those of their affiliated organizations, or those of the publisher, the editors and the reviewers. Any product that may be evaluated in this article or claim that may be made by its manufacturer is not guaranteed or endorsed by the publisher.
Research integrity at Frontiers
Learn more about the work of our research integrity team to safeguard the quality of each article we publish.