 Reda Amer
- UMSL Geospatial Collaborative, University of Missouri-St. Louis, Saint Louis, MO, United States
Climate change and the associated sea level rise (SLR) are presenting newfound challenges to the port systems and coastal transportation infrastructure of southeast Texas. This paper introduces a Geographic Information Systems (GIS) based model designed to simulate inundation scenarios under various sea-level projections, aiming to assess the vulnerabilities of both port facilities and road networks. The study area encompasses a specific region within Jefferson County, southeast Texas, encompassing three major ports: Port Arthur, Beaumont, and Orange. Utilizing a high-resolution (1-m) Digital Elevation Model (DEM) derived from the 2017 LiDAR dataset, this model is integrated with NASA’s sea-level rise projections to compute the extent and volume of inundation across low, medium, and high SLR scenarios. Drawing from monthly mean sea level data spanning from 1958 to 2020, the lowest SLR projections, derived from the relative sea-level trend measured at the Sabine Pass, TX gauge station, indicate a yearly increase of 6.16 mm, with a 95% confidence interval of +/- 0.74 mm. Projections for 2050 and 2,100 show the lowest SLR at 0.17 m and 0.48 m, respectively. In contrast, the medium to high RSLR projections under the IPCC SSP3-7.0 scenario for 2050 and 2,100 stand at 0.54 m and 1.34 m, respectively. The findings reveal that, under medium to high SLR scenarios, the extent of inundated areas in the study region is expected to expand by 12.4% in 2050 and 19.9% in 2,100, compared to the lowest SLR projection. Additionally, the length of submerged roadways is predicted to increase by 6.9% in 2050 and 13.3% in 2,100, in comparison to the lowest SLR projection. It is worth noting that some margin of error may be introduced due to factors such as the width of the port area and access roads, the high-resolution DEM, and the alignment of computed inundated areas with the existing topography. Overall, the manuscript highlights the urgency of proactive planning and underscores the importance of safeguarding critical infrastructure in the context of climate change and SLR.
1 Introduction
The increasing flood risk in coastal regions due to climate change and sea-level rise (SLR) has become a pressing concern. Climate change-related factors such as thermal expansion of seawater, land subsidence from crustal warping and fluid withdrawal, and sediment compaction are causing sea levels to rise relative to the land (Nicholls and Leatherman, 1996; Sella et al., 2007; Eggleston and Pope, 2013). Additionally, climate change is expected to intensify major hurricanes (Emanuel et al., 2008), making coastal infrastructure increasingly vulnerable to damage from intense storms, further exacerbated by relative sea-level rise (RSLR) pushing storm paths inland. The assessment of storm surge impacts on coastal infrastructure under potential RSLR scenarios is essential for community resilience planning.
The impact of global warming and sea level rise, coupled with changes in weather patterns, extends beyond coastal regions to transportation infrastructure systems, including roads, airports, railways, and ports (Chinowsky et al., 2013). Maintaining the operational functionality of port systems, particularly in southeast Texas, is crucial for the transportation of oil and natural gas, as well as for the sustained economic growth and job security of the nation and the region (Figure 1). Any significant disruption in port logistics operations would have far-reaching consequences for both the region and the national economy, given that the majority of waterborne cargo tonnage passes through deep-draft ports, of which southeast Texas boasts seven of them.
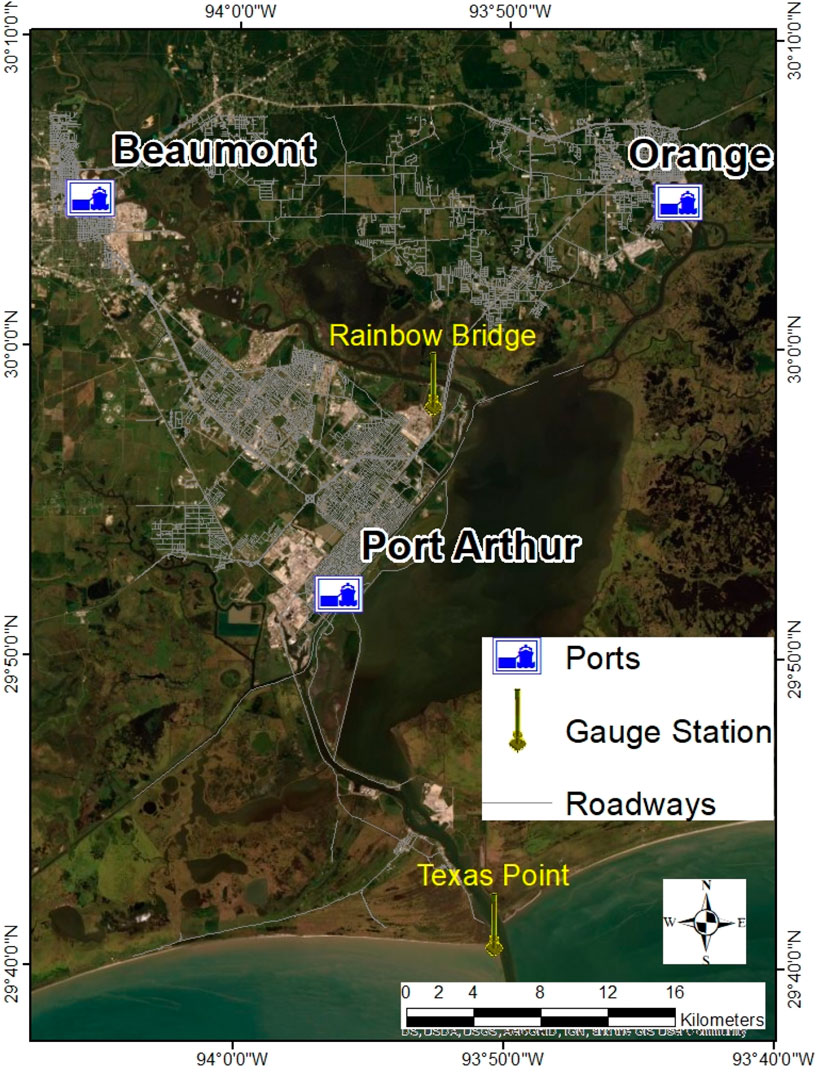
Figure 1. Location map of the study area shows the geographic location of the Port of Port Arthur, Port of Beaumont, and Port of Orange; the NOAA gauge stations; and the roadway network.
Recent periodic hurricane events in southeast Texas have forced port businesses to close or operate at reduced capacity. The combined impacts of sea-level rise and hurricanes pose a significant challenge to the future survival of these ports. Sea-level rise is among the most concerning and costly effects of climate change. Since 1993, sea-level rise has been estimated to range from +2.6 mm to +2.9 mm per year (0.4 mm) (NOAA, n.d.). Projections suggest that global average sea levels could rise by up to 6 feet by 2,100 (Kenigson and Han, 2014). A 1.6-foot rise by 2070 threatens 150 million people worldwide and $35 trillion in assets in 20 of the world’s most vulnerable and fastest-growing port cities (Kenigson and Han, 2014). Low-lying coastal areas are particularly susceptible to storm surges and flooding during hurricane events, and these effects will be exacerbated by rising sea levels in the future (Nicholls and Cazenave, 2010).
According to tide gauges at Pier 21 in Galveston and Sabine Pass, Texas, the rate of relative sea-level rise was recorded at 6.59 and 6.16 mm/yr, respectively, as of 26 March 2021 (www.psmsl.org). Relative sea-level rise at Galveston Pier 21, Texas, comprises both absolute sea-level rise and land subsidence (Liu et al., 2020). Between 1909 and 1992, the Gulf of Mexico experienced a uniform absolute sea-level rise rate of 1.10 mm 0.19/yr, with an acceleration of 0.27 mm/yr2 at Galveston Pier 21 since 1992, according to Liu et al. (2020). The same study estimates subsidence rates of 3.53 mm/yr during 1909–1937, 6.08 mm/yr during 1937–1983, and 3.51 mm/yr since 1983 at Galveston Pier 21.
To address these challenges, it is imperative to develop a geospatial methodology capable of evaluating the vulnerability of port assets and quantifying the resiliency and rate of recovery of port systems under sea-level rise. This study’s main objectives are as follows: 1) Assess the level of threat and vulnerability of the port systems in Port Arthur, Beaumont, and Orange in response to sea-level rise; 2) Determine the vulnerability of access roads to the ports of Port Arthur, Beaumont, and Orange in terms of inundation intensity and duration under various sea-level rise scenarios; and 3) Recommend adaptation strategies to mitigate the risks posed by sea-level rise to ensure the continued operational performance of these port systems.
2 Data
2.1 LiDAR data
LiDAR - Light Detection and Ranging, is a remote sensing technology that employs rapid laser pulses to measure the distances of return signals from the Earth’s surface, as detected by a sensor positioned at the laser source. These collective pulse return measurements, complemented by supplementary spatial and temporal data gathered by either airborne or terrestrial acquisition systems, generate a highly detailed three-dimensional (3-D) representation of the Earth’s terrain, thereby revealing its surface characteristics with precision. LiDAR stands as one of the most precise methods for obtaining elevation data and is employed wherever feasible. In the case of our study area, airborne LiDAR data was acquired from the Texas Natural Resources Information System (TNRIS) in order to craft an exceptionally high-resolution Digital Elevation Model (DEM) with a pixel size of 1 m. TNRIS acquires LiDAR data through the Texas Strategic Mapping StratMap Contract, which is overseen by the Texas Department of Information Resources (TxDIR) (n.d.). Data collection occurred between 22 February 2017, and 23 March 2017, during the leaf-off season in Texas. LiDAR technology finds application in a range of fields, including floodplain management and planning, feature extraction, water quality modeling, analysis of stream restoration potential, change detection, wildfire mitigation, identification and modeling of habitats for endangered species, and dam safety (Texas Natural Resources Information System (TNRIS), n.d.).
2.2 Sea-level rise data
The data on sea-level rise were acquired through two sources: the NASA Sea Level Projection Tool (IPCC 6th Assessment Report Sea Level Projections: NASA (n.d.)), which provided global sea-level rise data relative to a baseline period of 1995–2014 across five Socioeconomic Pathway (SSP) scenarios, and the NOAA Sea Level Trend, which recorded local relative sea-level rise trends at the Sabine Pass, TX gauge station (NOAA, n.d.). To calculate the average rates of total sea-level change from 2020 to 2,150, we considered contributions from glaciers, Greenland, Antarctica, land water storage, and vertical land motion. Our sea-level projections for the SSP scenarios were based on processes with at least medium confidence. These scenarios are as follows: 1) SSP1-1.9: Aiming to limit warming to approximately 1.5°C above the 1850–1900 baseline by 2,100, with a slight overshoot, and implying net zero CO2 emissions around the mid-century. 2) SSP1-2.6: Striving to remain below 2.0°C warming relative to the 1850–1900 baseline (median) with implied net-zero emissions in the second half of the century. 3) SSP2-4.5: Roughly aligning with the upper end of aggregate Nationally Determined Contribution emission levels by 2030. 4) SSP5-8.5: Emission levels as high as SSP5-8.5 are not reached by Integrated Assessment Models (IAMs) under any of the SSPs except for the fossil-fueled SSP5 socioeconomic development pathway. In this study, we specifically used the medium to high projection of SSP3-7.0, characterized by high non-CO2 emissions. Figure 2 below illustrates the SSP3-7.0 projection and associated uncertainties for total sea-level change (TSLC) in the Gulf of Mexico, specifically in Jefferson County, Texas. By 2050, it is anticipated that TSLC will reach 0.54 m with an uncertainty range of ±0.1 m, while by 2,100, it is projected to be 1.34 m with an uncertainty range of ±0.27 m.
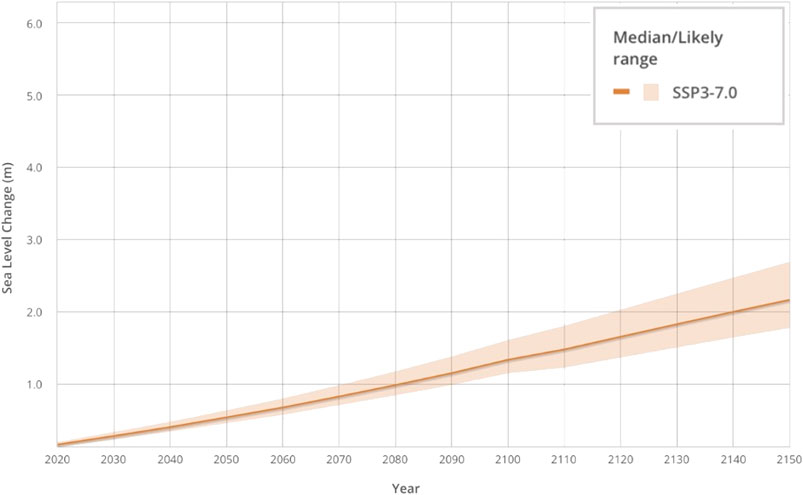
Figure 2. The Intergovernmental Panel on Climate Change (IPCC) Socioeconomic Pathway (SSP) SSP3-7.0 projection and uncertainties for the total sea-level change in the Gulf of Mexico at Jefferson County of Texas. Source: NASA (n.d.)
The sea level trends monitored by NOAA through tide gauges pertain to local relative sea level (RSL) trends rather than global sea level trends. These tide gauge measurements are conducted with respect to a fixed local reference point on land. RSL represents a combination of sea level rise and local vertical land movement. The data for RSL measurements are collected from tide stations within the National Water Level Observation Network, strategically positioned along the entirety of the United States’ coastlines. Changes in RSL, whether they involve an increase or decrease in sea level, have been meticulously calculated at 142 long-term water level stations, each based on a minimum of 30 years of continuous observations at their respective locations (refer to Figure 3 for details). To ensure precision, these measurements have been monthly averaged to mitigate the influence of high-frequency phenomena, thereby facilitating the computation of an accurate linear sea level trend. Furthermore, this trend analysis extends to encompass 240 global tide stations, utilizing data sourced from the Permanent Service for Mean Sea Level (PSML, n.d), which can be accessed at (https://www.psmsl.org/).
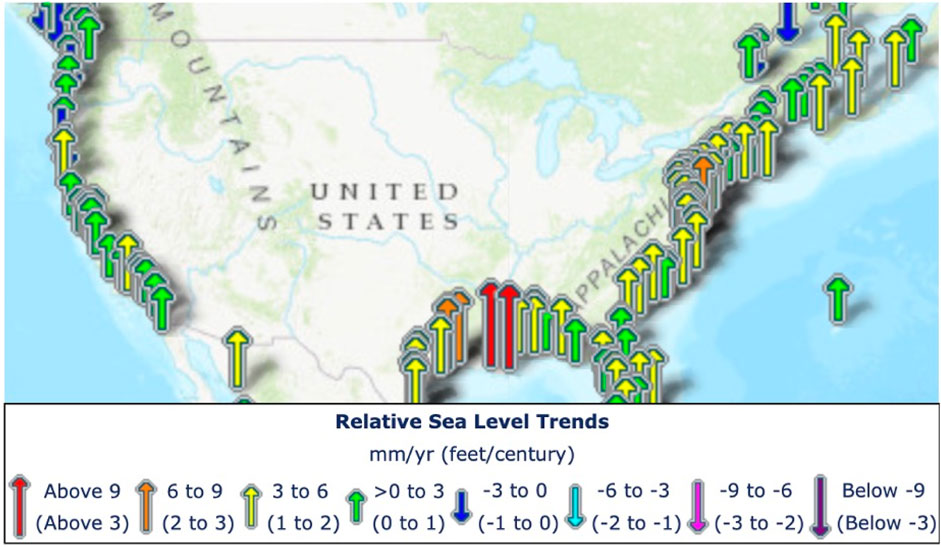
Figure 3. The map illustrates relative sea level trends, with arrows representing the direction and magnitude of change. Source: NOAA (n.d.)
Based on monthly mean sea level data spanning from 1958 to 2020, the Sabine Pass, TX gauge station exhibits a relative sea-level (RSL) trend of 6.16 mm per year, accompanied by a 95% confidence interval of +/- 0.74 mm per year. This trend corresponds to a 0.61-m (2.02 feet) change over a century. Figure 4 presented below illustrates the monthly mean sea level, eliminating the seasonal fluctuations attributed to coastal ocean conditions such as temperatures, salinities, winds, atmospheric pressures, and ocean currents. It also includes a depiction of the long-term linear trend, complete with its 95% confidence interval. Any instances of questionable data or datum shifts are marked by dashed vertical lines.
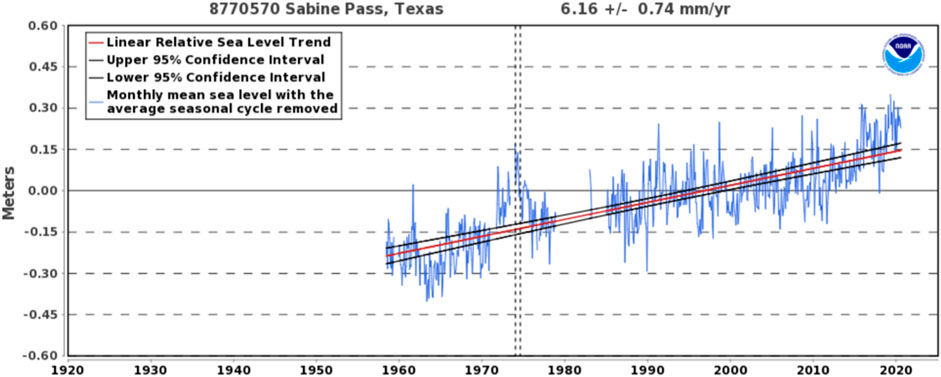
Figure 4. Relative sea level trend at sabine pass, Texas. Source: NOAA (n.d.)
To project future relative sea-level changes at Sabine Pass, we applied the current rate of 6.16 mm per year. For the year 2050, this calculation yields an estimated rise of 178.6 mm (0.17 m), and for 2,100, it anticipates an increase of 486.6 mm (0.48 m). Notably, these calculations do not account for the specific contributions from glaciers, heightened CO2 emissions, or the projected effects of rising temperatures, as outlined by NASA.
2.3 Roadway network data
A comprehensive GIS roadway network for the study area was obtained from The Transportation Planning and Programming (TPP) Division of the Texas Department of Transportation (TxDOT) (n.d). TxDOT maintains a comprehensive spatial dataset containing roadway polylines for purposes such as planning, asset inventory, visualization, and general mapping. This dataset encompasses the entirety of Texas and encompasses various types of routes, including interstate highways, US highways, state highways, farm and ranch roads, county roads, and local streets (see Figure 1). Notably, this dataset incorporates measures stored as M-values at each vertex along the line, akin to how some datasets store z-values for elevation, with the distinction that these measures represent the distance from the line’s origin (referred to as DFO). M-enabled networks are instrumental in pinpointing roadway assets using linear referencing along the network. To maintain the integrity of M-values, it is essential to download this dataset in the form of a file geodatabase, which is accessible at the following link: https://gis-txdot.opendata. This dataset was instrumental in identifying the roadway segments susceptible to the impacts of sea-level rise in GIS sea-level rise projection models.
3 Method
3.1 Creating topographic surface
Initially, the LiDAR data underwent preprocessing to ensure uniformity in projection and coordinate systems. A Transverse Mercator projection, specifically the North American Datum of 1983 (NAD, 1983), UTM Zone 15, and meter as the linear unit, was employed. The elevation values were computed with reference to the NAVD88 vertical datum, a well-established benchmark on solid ground. Subsequently, high-resolution Digital Elevation Models (DEMs) with a pixel size of 1 m were generated from the LiDAR LAS datasets using ArcGIS Geoprocessing tools. To enhance data quality, a spatial analyst operation called “filling” was applied to the DEM, rectifying surface sinks and eliminating minor imperfections that could otherwise be misconstrued as inundation zones resulting from rising sea levels.
3.2 Selecting sea-level scenarios
In this study, sea-level rise scenarios were chosen based on empirical data and projections. The lowest sea-level rise scenarios were determined by analyzing the relative sea-level (RSL) trend observed at the Sabine Pass, TX gauge station, with a rate of 6.16 mm/year and a 95% confidence interval of +/- 0.74 mm/year, derived from monthly mean sea level data spanning from 1958 to 2020 (see Figures 2, 3). These observed rates were utilized to project relative sea-level changes at Sabine Pass for two future scenarios: 2050 (178.6 mm) and 2,100 (486.6 mm), equivalent to 0.48 m. These calculations did not incorporate additional factors such as glacier contributions, heightened CO2 emissions, or increased temperatures, as projected by NASA.
The medium to high sea-level scenarios were based on the NASA IPCC SSP3-7.0 projection, which integrates various factors, including glacier melt, Greenland and Antarctica ice sheet dynamics, land water storage, and vertical land motion, to estimate the average rates of total sea-level change from 2020 to 2,150 (see Figure 2). The SSP3-7.0 projection, along with associated uncertainties, predicted total sea-level change (TSLC) for the Gulf of Mexico at Jefferson County, Texas. Specifically, the projections for 2050 were 0.54 m with a 0.1-m uncertainty and for 2,100 were 1.34 m with a 0.27-m uncertainty.
To delineate areas susceptible to inundation in response to the sea-level scenarios, the Raster Calculator tool within ArcGIS Spatial Analyst was employed to extract all DEM cells situated below the flood thresholds for both the “lowest” and “high” scenarios in 2050 and 2,100. The resulting raster layers were subsequently converted into vector features to quantify the extent of inundated areas in each modeled scenario. Finally, a geometric intersection analysis was conducted, intersecting the extracted inundated areas with the existing roadway network, allowing for the quantification of predicted roadway network damage in each sea-level scenario for both 2050 and 2,100. The flow chart below, Figure 5, illustrates the methodological framework adopted for delineating inundated areas and producing spatial outcomes.
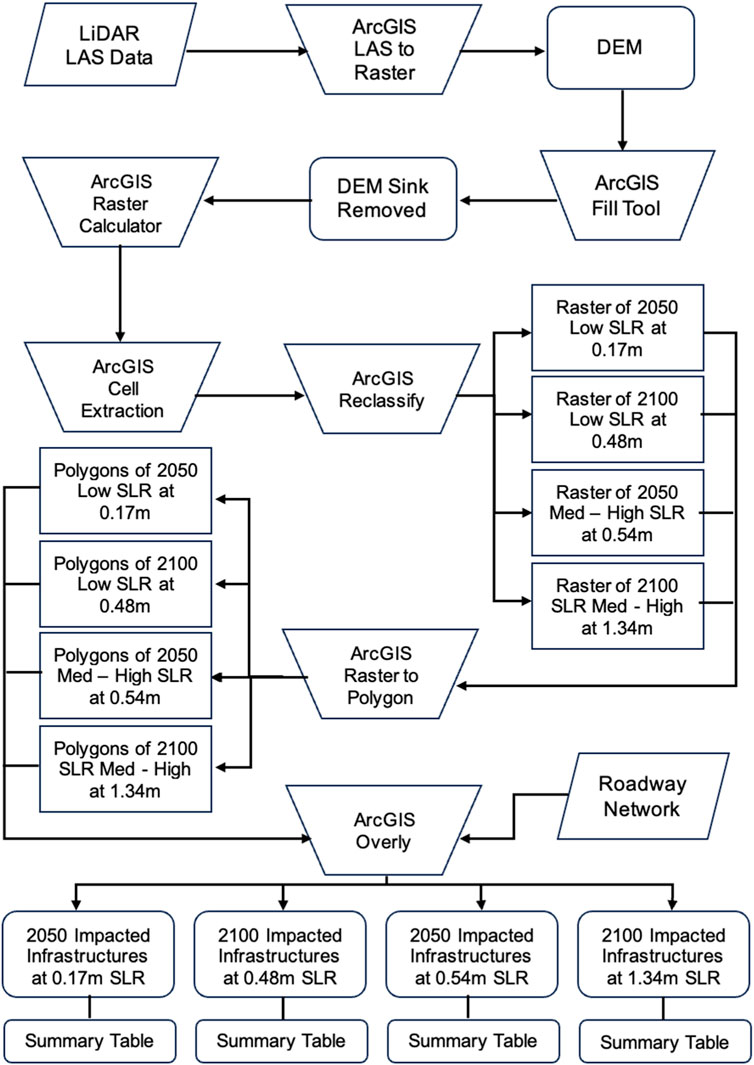
Figure 5. Methodology flowchart.
4 Results
The study investigated the repercussions of sea-level rise and storms on ports and roadway networks, encompassing a range of detrimental effects such as road base erosion, subsidence, flooding of underground tunnels, inundation of low-lying infrastructures, port platforms, roads, and rail lines, as well as resulting traffic congestion and infrastructure damage due to heightened storm intensity. Utilizing Geographic Information System (GIS) models, we quantified changes in the total flooded area, the extent of flooded roadways, and flood volume in Jefferson County, Southeast Texas, an area encompassing three vital port systems: Port Arthur, Beaumont, and Orange.
4.1 Inundation under the lowest sea-level rise scenario
In our analysis, we employed the lowest sea-level rise scenario, based on the relative sea-level rise (RSLR) trend measured at the Sabine Pass TX gauge station. The gauge locations are illustrated in Figure 1. Using monthly mean sea level data spanning from 1958 to 2020, we determined the current RSLR to be 6.16 mm/year, with a 95% confidence interval of +/- 0.74 mm/year (see Figures 2, 3). For the 2050 scenario, the calculated RSLR is projected to reach 178.6 mm (0.17 m) (Figure 6A). Under this conservative 2050 scenario, the estimated extent of inundated areas is 44.7 km2, equivalent to 3.8% of the study area’s total land area (1,170 km2). Importantly, RSLR-induced flooding is not expected to affect the infrastructure, including buildings and platforms, of the Ports of Port Arthur, Beaumont, and Orange (refer to Figure 6B, C, D).
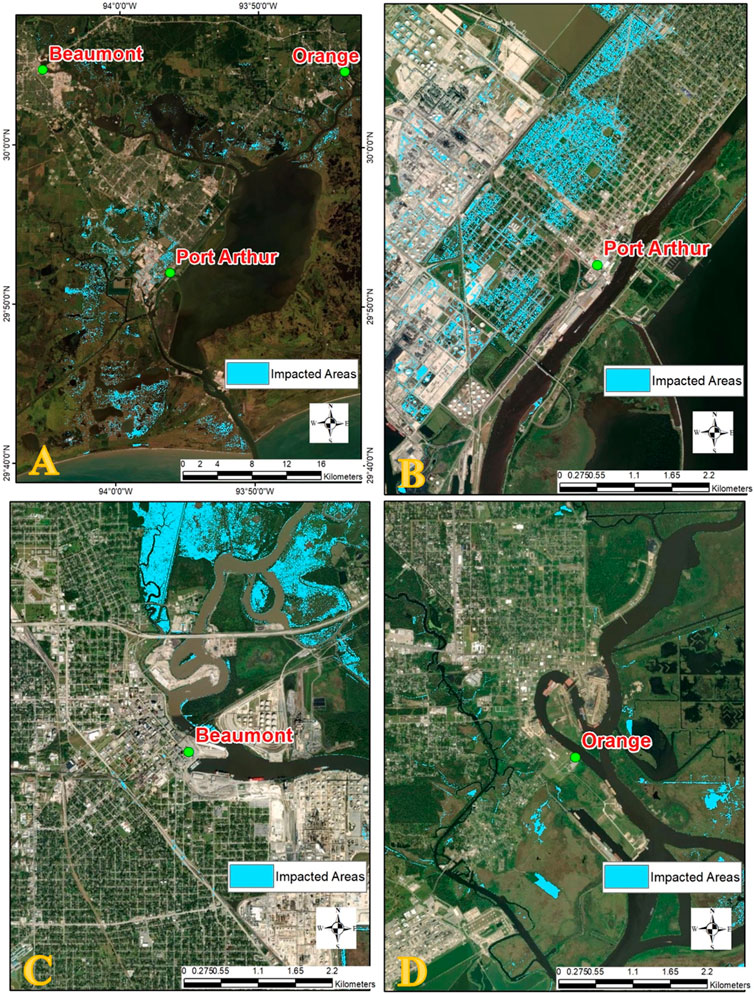
Figure 6. Projected flood coverage in 2050 under the lowest relative sea level rise scenario: (A) Total study area; (B) port Arthur; (C) port of Beaumont; (D) port of orange.
Looking ahead to 2,100, the predicted RSLR stands at 486.6 mm (0.48 m), representing a 0.31 m increase from the 2050 projection (see Figure 7A). Under the most pessimistic scenario for 2,100, the extent of inundated areas is anticipated to expand to 227 km2, accounting for 19.4% of the study area, reflecting a 15.6% increase compared to 2050 (see Figure 7B, C, D). As with the 2050 scenario, RSLR-induced flooding is not expected to impact the infrastructure of the Ports of Port Arthur, Port Beaumont, and Port Orange.
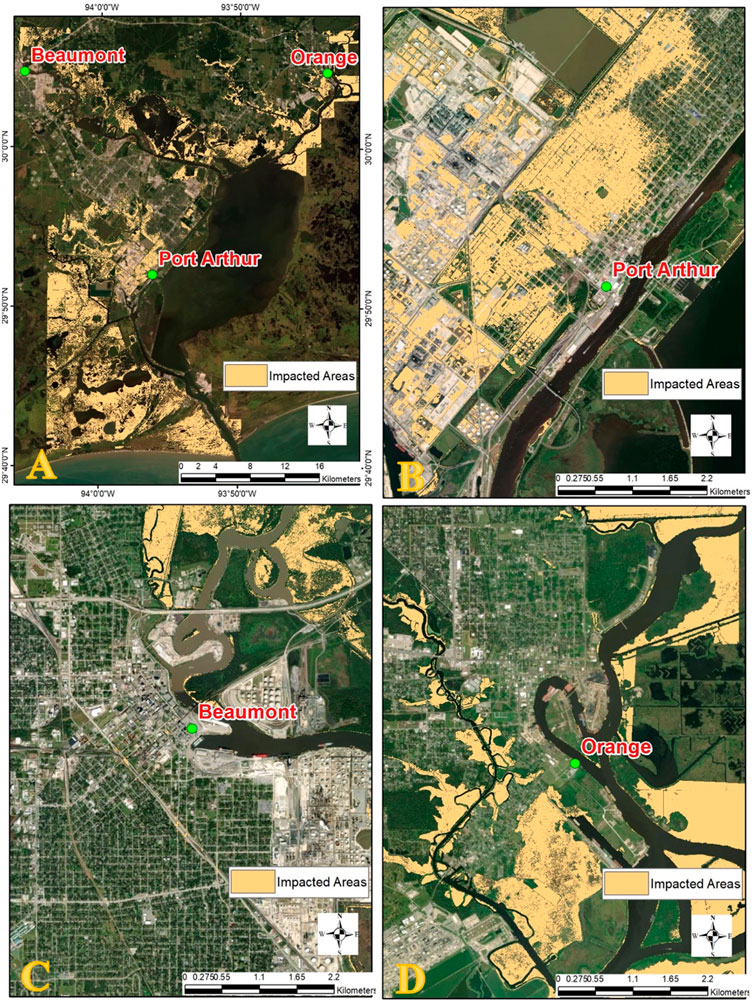
Figure 7. Projected flood coverage in 2,100 under the lowest relative sea level rise scenario: (A) Total study area; (B) port Arthur; (C) port of Beaumont; (D) port of orange.
To gauge the vulnerability of transportation infrastructure, particularly the road network, we assessed variations in the total length of inundated roadways under RSLR conditions. This metric provides valuable insights into changes in the overall risk to transportation infrastructure, which plays a pivotal role in the intermodal transportation network connecting container shipping lines and consignees. The total length of roadways in the study area amounts to 2,548 km. Our analysis revealed that, for the lowest RSLR scenario in 2050, 763 km of roads are at risk of flooding, while for 2,100, this number increases to 982 km (refer to Figures 8, 9). To calculate these quantities, we divided the length of flooded roadway by the total length of roadways, resulting in percentages of 30% for 2050 and 38.5% for 2,100, respectively. Notably, the majority of roads in the Port Arthur area are susceptible to flooding.
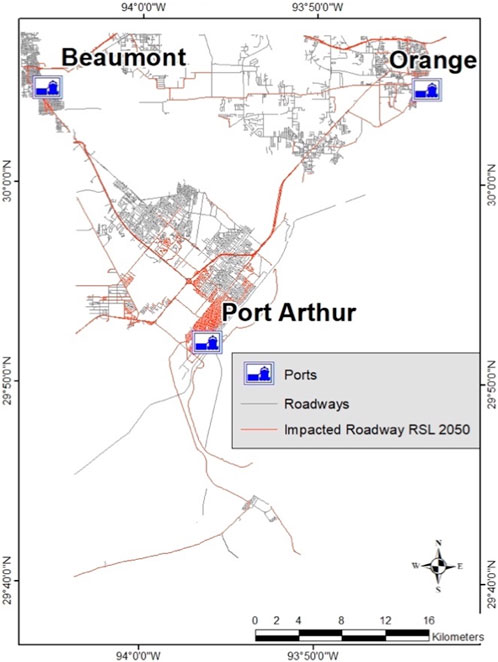
Figure 8. Flooded roadways under the lowest RSLR scenario in 2050.
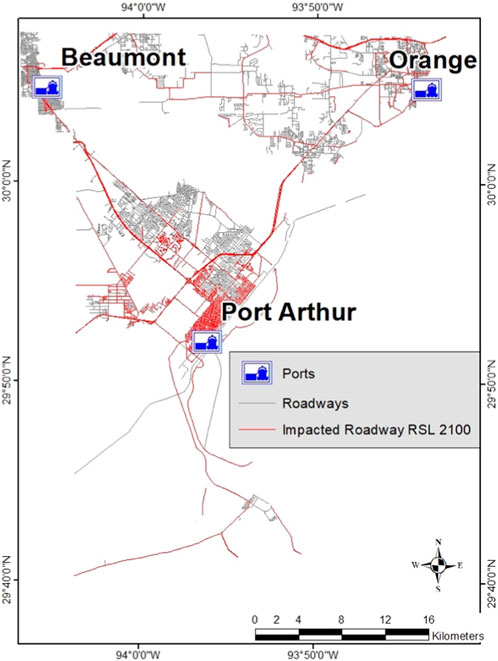
Figure 9. Flooded roadways under the lowest RSLR scenario in 2100.
4.2 Inundation under medium to high sea-revel rise scenario
In this section, we present the outcomes of our simulations focusing on flooding under medium to high sea-level rise (RSLR) scenarios. The sea-level change projections are based on NASA’s IPCC SSP3-7.0, providing us with estimates for the average rates of total sea-level change from 2020 to 2,150, as illustrated in Figure 2.
For the year 2050, under the SSP3-7.0 projection, we anticipate a total sea-level change of 0.54 m + 0.1 m with an uncertainty of 0.1 m. In this scenario, the Gulf of Mexico at Jefferson County, Texas, is at risk of experiencing flooding over an area of 190 km2, which corresponds to 16.2% of the study area’s total extent (1,170 km2). This represents an increase of 145.3 km2 compared to the lowest RSLR scenario, translating to a 12.4% expansion in inundated areas within our research region (see Figure 10A). It is noteworthy that the infrastructures of key areas such as Port Arthur, Port Beaumont, and Port Orange will remain unaffected by the RSLR floods (refer to Figures 10B–D).
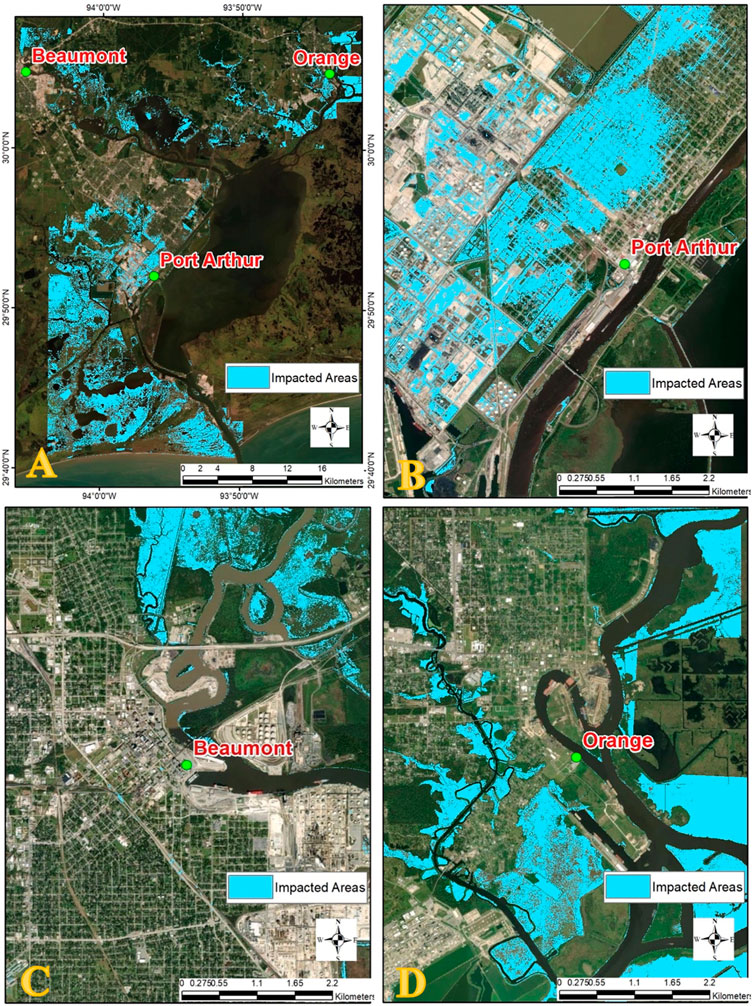
Figure 10. Projected Flood Coverage in 2050 under the medium to high RSLR scenario: (A) Total Study Area; (B) Port Arthur; (C) Port of Beaumont; (D) Port of Orange.
In the more distant future, specifically the 2,100 scenario, we project a medium to high RSLR of 1.34 m + 0.27 m, with a sea-level increase of 0.8 m. This projection could result in flooding over an extensive area of 460 km2, accounting for 39.3% of the study area’s total extent (see Figure 11A). Under this scenario, both the Port of Port Arthur and the Port of Orange will encounter partial submergence (see Figures 11B,C). Remarkably, the infrastructure of the Port of Beaumont is expected to remain unaffected by this medium to high RSLR scenario (see Figure 11D).
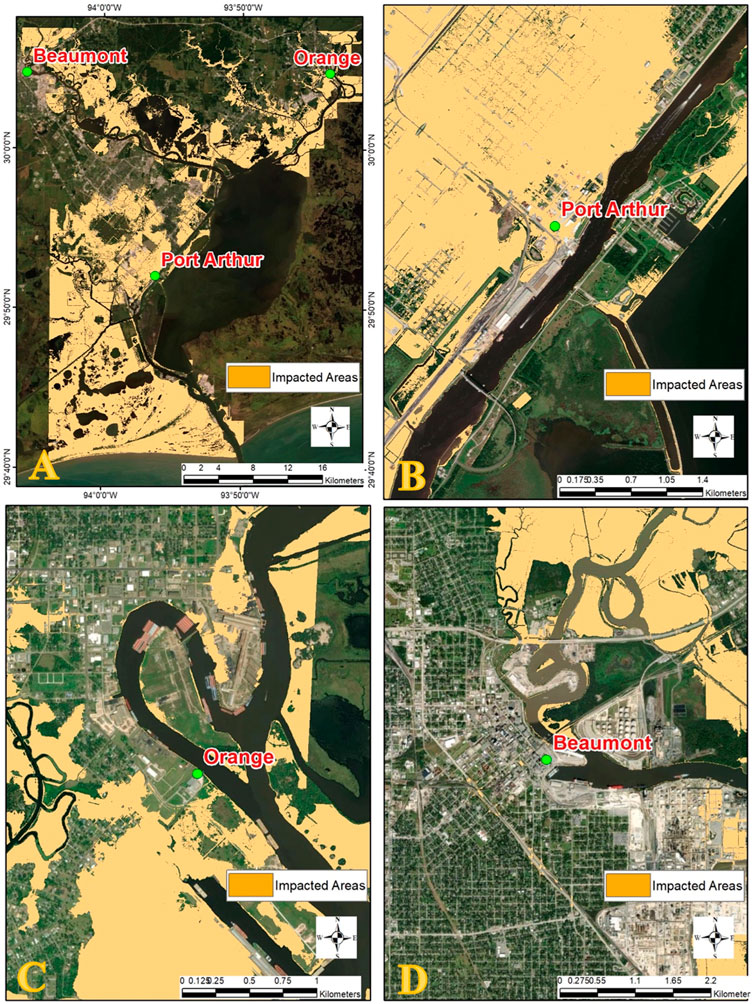
Figure 11. Projected Flood Coverage in 2,100 under the medium to high RSLR scenario: (A) Total Study Area; (B) Port Arthur; (C) Port of Beaumont; (D) Port of Orange.
To better understand the impact on the transportation network, we conducted a vulnerability analysis of the roadways within the study area. In the medium to high RSLR scenario of 2050, approximately 941 km of roads, equivalent to 39.9% of the total road network, are at risk of flooding (see Figure 12). This represents an increase of 178 km in flooded roadways, reflecting a 6.9% rise compared to the lowest RSLR scenario. Looking ahead to the 2,100 scenario, our GIS model predicts that about 1,323 km of roadways will be submerged, accounting for 51.9% of the total road network’s length (see Figure 13). Notably, the impacted roadways under the IPCC medium to high RSLR scenario exceed those under the NOAA lowest RSLR scenario for 2,100 by 341 km (13.3%). Table 1 provides a summary of our GIS model results, detailing the inundated areas and roadways under the low, medium, and high RSLR scenarios for 2050 and 2,100, respectively.
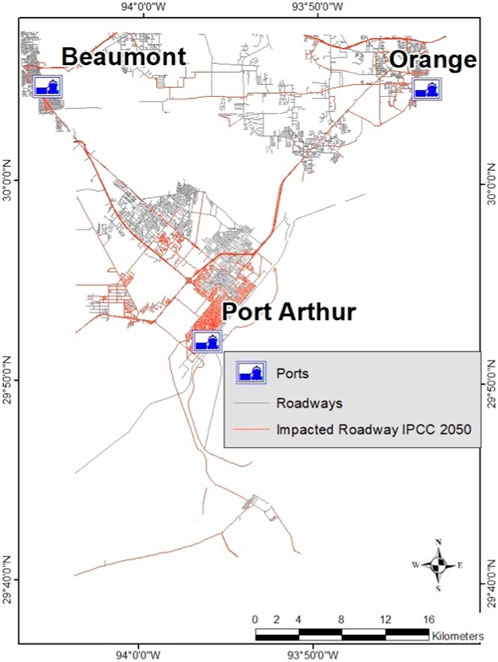
Figure 12. Flooded roadways under the medium to high RSLR scenario in 2050.
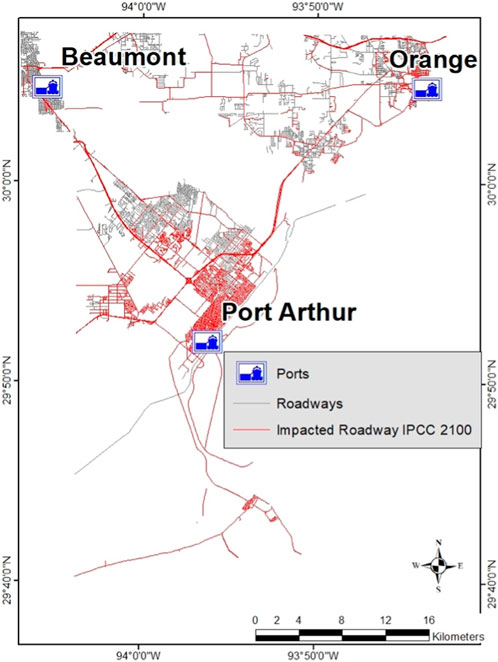
Figure 13. Flooded roadways under the medium to high RSLR scenario in 2100.
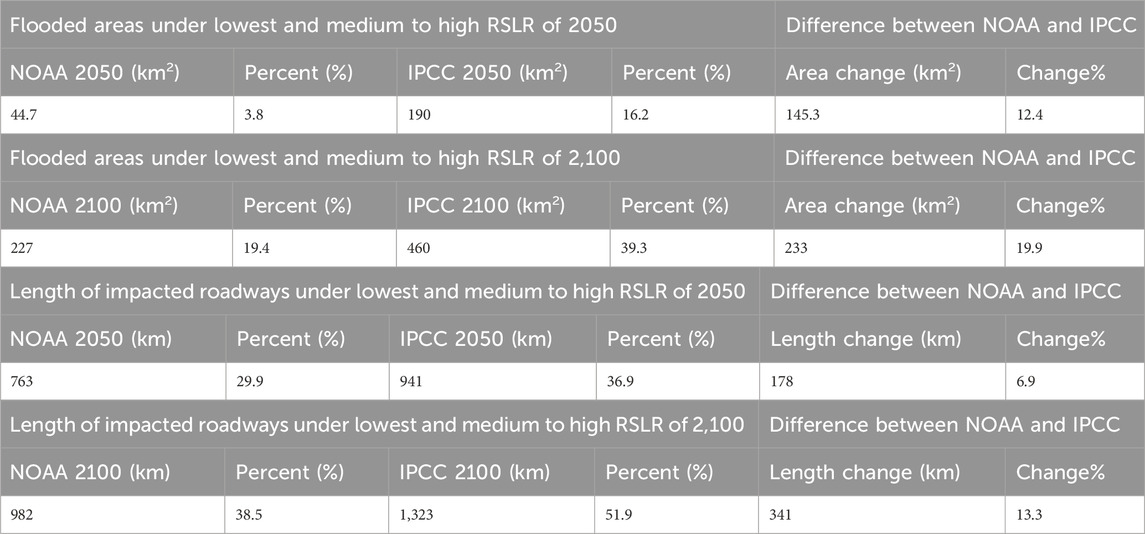
Table 1. Calculated inundated areas and roadways under the lowest and medium to high RSLR scenarios of 2050 and 2,100.
5 Discussion
The findings presented in this manuscript highlight the significant challenges posed by sea-level rise on the critical infrastructure of coastal regions, particularly in southeast Texas. As climate change continues to exacerbate sea-level rise, understanding the vulnerability and resiliency of port systems and transportation networks becomes paramount for effective planning and mitigation efforts.
5.1 Impacts on port systems
Our analysis indicates that under the lowest sea-level rise scenario (based on observed relative sea-level rise at Sabine Pass), the extent of inundation in the study area remains relatively modest by 2050, affecting 3.8% of the total land area. However, by 2,100, even this conservative scenario could lead to significant challenges, with an estimated 19.4% of the study area inundated. While the infrastructure of the Ports of Port Arthur, Beaumont, and Orange remains unaffected under these projections, the potential for increased inundation of surrounding areas calls for a proactive approach to safeguarding port operations.
Under the medium to high sea-level rise scenario (based on NASA’s IPCC SSP3-7.0 projection), the projected inundation areas in 2050 and 2,100 are considerably larger, encompassing 16.2% and 39.3% of the study area, respectively. Importantly, this scenario could lead to partial submergence of the Port of Port Arthur and the Port of Orange by 2,100. While the Port of Beaumont is expected to remain resilient under this scenario, the broader implications for transportation networks must be acknowledged.
5.2 Impacts on transportation infrastructure
Our analysis of roadway networks reveals that under the lowest sea-level rise scenario, approximately 30% of the total roadway length is at risk of flooding by 2050. By 2,100, this percentage increases to 38.5%, reflecting the escalating threat posed by sea-level rise. The majority of roads in the Port Arthur area are susceptible to flooding, underscoring the vulnerability of transportation infrastructure.
Under the medium to high sea-level rise scenario, the vulnerability of roadways becomes even more pronounced. In 2050, nearly 40% of the total road network is at risk of inundation, representing a 6.9% increase compared to the lowest scenario. By 2,100, over half of the road network (51.9%) could be submerged, significantly impeding transportation and access to critical port facilities.
5.3 Adaptation and mitigation strategies
Given the potential risks outlined in our analysis, it is imperative to develop adaptation and mitigation strategies to safeguard both port systems and transportation infrastructure. Recommendations for resilience planning include:
1. Elevated Infrastructure: Consider elevating critical port infrastructure and key sections of roadways to mitigate the impacts of sea-level rise and flooding. Elevating key assets like port platforms and access roads can help maintain functionality during inundation events.
2. Storm Surge Barriers: The current model offers valuable insights into the long-term challenges posed by rising sea levels. However, it encounters notable limitations in capturing the dynamics of storm surge events, a critical aspect of coastal vulnerability. This shortfall underscores the necessity for developing separate, specialized models dedicated to understanding and predicting the intricacies of storm surge phenomena. Such models are crucial for devising effective mitigation and adaptation strategies. Furthermore, the proposal of a storm surge barrier emerges as a pivotal element within this context. Not only does it serve as a mitigation strategy for SLR, but it also stands as critical infrastructure for safeguarding against the more immediate and severe impacts of storm surges. The storm surge barrier represents a dual-purpose solution, addressing both gradual sea-level changes and the acute challenges posed by storm-induced surges, thereby highlighting its importance in enhancing the resilience of port systems in Southeast Texas.
3. Improved Drainage: Enhance drainage systems to manage excess water during heavy rainfall and storm events. Effective drainage can help prevent road flooding and minimize damage to transportation infrastructure.
4. Infrastructure Relocation: In cases where adaptation measures are not feasible, consider relocating critical infrastructure to higher ground or less vulnerable areas to ensure continued functionality.
5. Integrated Planning: Collaborate with regional stakeholders, government agencies, and communities to develop integrated resilience plans that address both port systems and transportation networks. Coordination is essential to ensure a holistic approach to resilience planning.
6. Public Engagement: Engage with local communities and the private sector to raise awareness of the risks and involve them in resilience planning. Public support and involvement are key to the successful implementation of adaptation strategies.
5.4 Limitations and future research
The accuracy of the GIS flood simulations presented in this study is highly dependent on the grid resolution, with the cell size playing a crucial role in accurately calculating flood extents, especially over narrow features such as roadways. For our analysis, we utilized a high-resolution Digital Elevation Model (DEM) derived from LiDAR data, with a refined pixel size resolution of 1 m. Our focus was on critical points, namely, the ports of Port Arthur, Beaumont, and Orange, which feature access roads boasting two or three lanes in each direction, and the narrowest access road spanning at least 22 m in both directions.
We employed GIS overlay and measuring tools to meticulously evaluate the alignment of the DEM projection and the modeled flood layers on the terrain. This thorough analysis confirmed that both the DEM and model resolutions are adequate to yield dependable flood estimates at these crucial points and access roads. While we acknowledge the potential for some error introduced by factors such as the width of the port area, access roads, DEM resolution, and the alignment of computed inundated areas with the underlying topography, our model consistently delivers reliable flood estimates for these specific locations.
While this study provides valuable insights into the potential impacts of RSLR on port systems and road infrastructure, it is essential to acknowledge its limitations. Our analysis focused on a specific geographic area, and future research should extend the analysis to encompass a broader region to capture the interconnectedness of transportation networks. Additionally, incorporating climate change-induced factors such as increased storm intensity and rainfall patterns would provide a more comprehensive understanding of the challenges posed by climate change.
Further research should also consider the social and environmental implications of SLR, including the displacement of communities, impacts on ecosystems, and potential mitigation measures to protect vulnerable populations and natural habitats.
6 Conclusion
This manuscript has provided a comprehensive assessment of the impacts of sea-level rise on critical infrastructure, specifically focusing on port systems and transportation networks in southeast Texas. The findings underscore the growing challenges posed by climate change-related factors and highlight the need for proactive resilience planning and adaptation strategies. The results indicate that even under the most conservative sea-level rise scenarios, the potential for inundation of coastal areas and transportation infrastructure is significant by the end of the century. This poses a direct threat to the operational functionality of ports and the accessibility of critical roadways, which are essential for economic growth and national security. To address these challenges, we have outlined several recommendations for resilience planning, including elevated infrastructure, storm surge barriers, improved drainage systems, infrastructure relocation, integrated planning, data monitoring, and public engagement. These strategies aim to enhance the preparedness and response capacity of the region, ensuring the continued functionality of critical assets and minimizing the potential economic and social disruptions caused by sea-level rise. However, it is important to acknowledge the limitations of this study, including the focus on a specific geographic area and the assumptions made in sea-level rise projections. Future research should expand the analysis to broader regions, consider additional climate change-related factors, and assess the broader social and environmental implications of sea-level rise.
Data availability statement
The original contributions presented in the study are included in the article/Supplementary material, further inquiries can be directed to the corresponding author.
Author contributions
RA: Conceptualization, Data curation, Formal Analysis, Funding acquisition, Investigation, Methodology, Project administration, Resources, Software, Supervision, Validation, Visualization, Writing–original draft, Writing–review and editing.
Funding
The author(s) declare that no financial support was received for the research, authorship, and/or publication of this article.
Acknowledgments
I would like to express my heartfelt gratitude to the UMSL Geospatial Collaborative for their unwavering support throughout the development of this manuscript. I also extend my sincere appreciation to the reviewers who dedicated their time and expertise to provide invaluable feedback. Last but not least, I would like to thank the editor for their guidance and efforts in overseeing the publication process.
Conflict of interest
The author declares that the research was conducted in the absence of any commercial or financial relationships that could be construed as a potential conflict of interest.
Publisher’s note
All claims expressed in this article are solely those of the authors and do not necessarily represent those of their affiliated organizations, or those of the publisher, the editors and the reviewers. Any product that may be evaluated in this article, or claim that may be made by its manufacturer, is not guaranteed or endorsed by the publisher.
References
Chinowsky, P., Price, J., and Neumann, J. (2013). Assessment of climate change adaptation costs for the U.S. Road network. Global Environmental Change 23, 764–773. doi:10.1016/j.gloenvcha.2013.03.004
Eggleston, J., and Pope, G. A. (2013). Land Subsidence and Relative Sea-Level Rise in the Southern Chesapeake Bay Region. U.S. Geological Survey, U.S. Geological Survey Circular 1392. Available at: http://pubs.usgs.gov/circ/1392/pdf/circ1392.pdf.
Emanuel, K., Sundararajan, R., and Williams, J. (2008). Hurricanes and global warming: results from downscaling IPCC AR4 simulations. Bull. Am. Meteorological Soc. 89 (3), 347–368. doi:10.1175/bams-89-3-347
Kenigson, J. S., and Han, W. (2014). Detecting and understanding the accelerated sea level rise along the east coast of the United States during recent decades. J. Geophys. Res. Oceans 119, 8749–8766. doi:10.1002/2014JC010305
Liu, Y., Li, J., Fasullo, J., and Galloway, D. L. (2020). Land subsidence contributions to relative sea level rise at tide gauge Galveston Pier 21, Texas. Sci Rep. 10, 17905. . doi:10.1038/s41598-020-74696-4
NASA (n.d.). NASA Sea Level projection tool. Available at: https://sealevel.nasa.gov/ipcc-ar6-sea-level-projection-tool.
Nicholls, R. J., and Cazenave, A. (2010). Sea-level rise and its impact on coastal zones. Science 328, 1517–1520. doi:10.1126/science.1185782
Nicholls, R. J., and Leatherman, S. P. (1996). Adapting to sea-level rise: Relative sea-level trends to 2100 for the United States. Coastal Management 24 (4), 301–324. doi:10.1080/08920759609362298
NOAA (n.d.). NOAA Sea Level trend. Available at: https://tidesandcurrents.noaa.gov/sltrends/.
PSML (n.d.). Permanent Service for Mean Sea Level. Available at: https://www.psmsl.org/.
Sella, G. F., Stein, S., Dixon, T. H., Craymer, M., James, T. S., Mazzotti, S., et al. (2007). Observation of glacial isostatic adjustment in “stable” North America with GPS. Geophys. Res. Lett. 34, L02306. doi:10.1029/2006GL027081
Texas Department of Information Resources (TxDIR) (n.d.). Texas strategic mapping StratMap Contract. Available at: https://dir.texas.gov.
Texas Natural Resources Information System (TNRIS) (n.d.). Elevation LiDAR data. Available at: https://tnris.org/stratmap/elevation-lidar/.
Transportation Planning and Programming (TPP), Division of the Texas Department of Transportation (TxDOT) (n.d.). GIS roadway network data. Available at: https://gis-txdot.opendata.arcgis.com/search?q=%20TPP.
Keywords: climate change, sea level rise (SLR), coastal infrastructure, ports, GIS
Citation: Amer R (2024) Assessing vulnerability and enhancing resilience of port systems in southeast Texas facing sea-level rise. Front. Built Environ. 10:1369833. doi: 10.3389/fbuil.2024.1369833
Received: 13 January 2024; Accepted: 16 April 2024;
Published: 17 May 2024.
Edited by:
Corrado Altomare, Universitat Politecnica de Catalunya, SpainReviewed by:
Venkata Ravibabu Mandla, National Institute of Rural Development and Panchayati Raj, IndiaSungwon Shin, Hanyang Universiy, Erica, Republic of Korea
Copyright © 2024 Amer. This is an open-access article distributed under the terms of the Creative Commons Attribution License (CC BY). The use, distribution or reproduction in other forums is permitted, provided the original author(s) and the copyright owner(s) are credited and that the original publication in this journal is cited, in accordance with accepted academic practice. No use, distribution or reproduction is permitted which does not comply with these terms.
*Correspondence: Reda Amer, cmVkYS5hbWVyQHVtc2wuZWR1