 Wenxiu Zhang
 Yang Shen
- 1School of Marxism, Xiamen University, Xiamen, China
- 2Institute of Quantitative Economics and Statistics, Huaqiao University, Xiamen, China
Introduction: Agricultural carbon emission reduction is the meaning of realizing the goal of double carbon, and Sichuan province, as one of the main grain producing areas in China, it is urgent to realize agricultural carbon reduction.
Methods: Based on the data of 18 cities in Sichuan province from 2000 to 2022, this paper calculates the total agricultural carbon emission and carbon emission intensity in Sichuan province by using IPCC guidelines, and measures its temporal, spatial evolution trend and regional differences, and further evaluates the driving factors by using fixed effect model.
Results: The results show that: (1) The total quantity of agricultural carbon emissions in Sichuan province has increased, but the carbon intensity has decreased, among which agricultural carbon emissions caused by agricultural land planting and residents’ life are the main carbon sources; (2) The regional differences of agricultural carbon emissions in Sichuan province are narrowing, among which the gap between groups is the root of the regional differences of agricultural carbon emissions, which shows that the agricultural carbon emissions in eastern Sichuan and western Sichuan, eastern Sichuan and southern Sichuan, western Sichuan and southern Sichuan, are quite different; (3) Agricultural carbon emissions in Sichuan province are characterized by agglomeration and spatial spillover, mainly showing a High-High agglomeration mode, but a few cities have changed their agglomeration modes; (4) The agricultural carbon intensity in Sichuan province is influenced by multiple factors. Population density, industrial structure, social wealth, agricultural mechanization and technological progress have negative effects on agricultural carbon intensity, while macro-control has increased agricultural carbon intensity.
Discussion: In this study, a complete accounting system for agricultural carbon emissions was established, and a series of statistical methods were used to analyze and obtain insightful results. It is a useful exploration of low-carbon agricultural models in the context of climate change. The results of this paper have important implications for the green development of agriculture in Sichuan province.
1 Introduction
Halfway through the 2030 Agenda for Sustainable Development process, climate change remains one of the global challenges that transcends national boundaries. Agriculture has the dual attributes of carbon sink and carbon source. From the perspective of carbon source, at present, in addition to the energy sector, agricultural carbon emissions (ACE) have become another major source of greenhouse gas (GHG) in China. This stems from the fact that in the pre-development period of the agriculture, production mainly relied on large-scale inputs of agricultural production materials, and the total quantity and intensity were high. Although in recent years, due to the improved level of agricultural technology and agricultural intensification has improved the efficiency of inputs of production materials and also reduced the agricultural carbon intensity (ACI), but as of 2020, the ACI is still around 1 ton / 10,000 yuan. Moreover, China’s agricultural emission reduction and carbon sequestration foundation is relatively weak due to the constraints of agricultural production conditions, such as the high proportion of medium- and low-yield fields and the still low degree of production scale intensification. According to the estimation of the Food and Agriculture Organization of the United Nations (FAO) on GHG, in 2005, China’s ACI were 780 million tons, and by 2020, the ACI will grow to 1.192 billion tons, and the total amount of China’s ACE will be on an upward trend from 2005 to 2020 (Figure 1). However, this data also shows that the annual ACE growth rate is on a downward trend, especially after 2012.
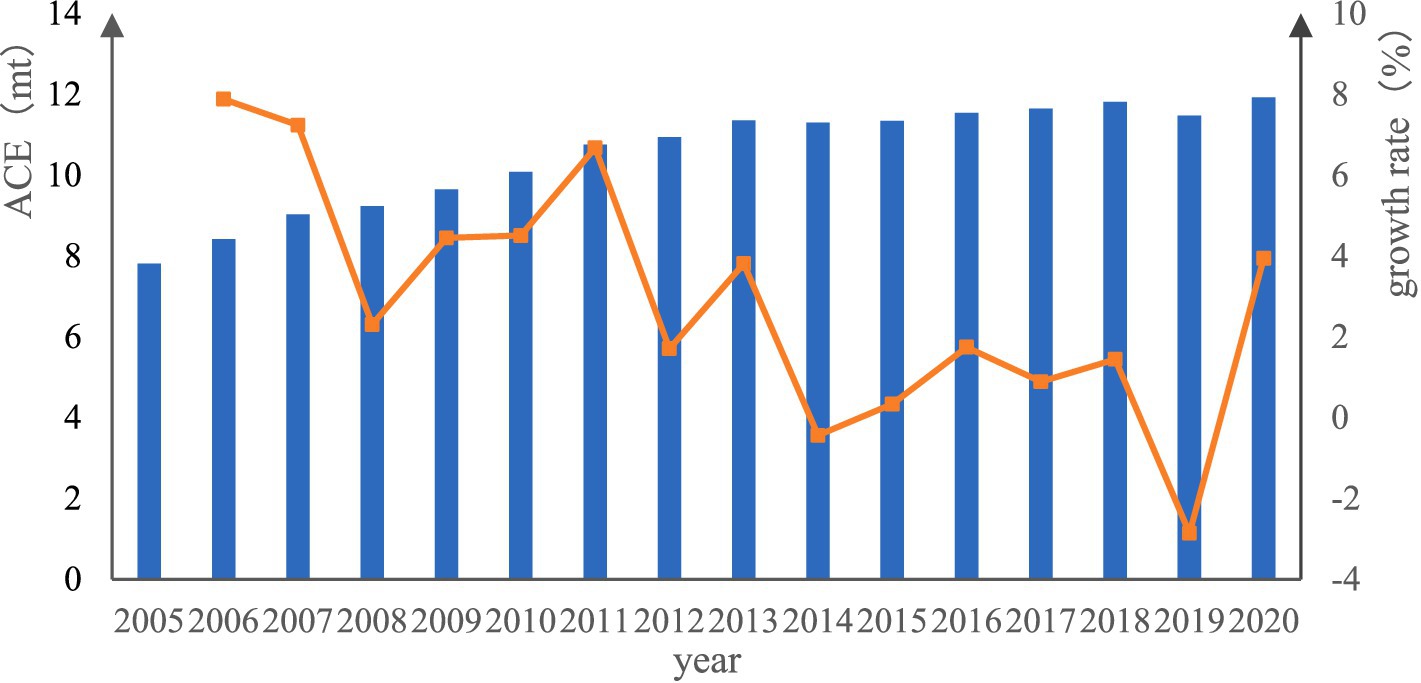
Figure 1. ACE and its growth trend in China from 2005 to 2020.
Existing studies have mainly focused on the different sources of ACE and the characteristics of temporal and spatial changes. In terms of emission source, the Kyoto Protocol adopted in 1997 specifies the selection of ACE sources, which mainly include animal husbandry (animal manure and enteric fermentation), plowing of agricultural land, rice cultivation, and burning of crop residues. As a complex ecosystem, the production and operation activities of agriculture are closely related to the climate environment. West and Marland (2002) studied ACE from a single point of view, choosing fertilizers, pesticides, agricultural irrigation, and the energy consumed by seed cultivation as the main sources of carbon emissions, while Johnson et al. (2007) showed that the generation of agricultural waste, the consumption of agricultural energy, rice cultivation, and straw cultivation are the main sources. Hillier et al. (2009) found that as much as 75% of carbon emissions came from nitrogen fertilizer use across all farm types studied. Zou et al. (2015) used 2010 statistics and market survey data to estimate GHG from irrigated agriculture in China, and the results showed that carbon emissions increased from 36.72 to 54.16 mt, and emissions from energy activities in irrigation accounted for 60%, also indicating that energy consumption in agricultural irrigation is an important source of carbon. Wiśniewski and Kistowski (2018) selected 48 representative rural, urban–rural, and municipal communities in Poland for the calculation of the carbon footprint of agriculture, and the study found that soil management in agriculture is an important greenhouse gas emission source, accounting for about 48.2% of the total, especially direct emissions from organic soil cultivation and the use of mineral fertilizers, as well as indirect emissions from leaching of nitrogen compounds from the soil. A collaborative study by FAO shows that the world’s food system is responsible for one third of global anthropogenic GHG. Due to the differences in the production process and growth cycle of different food crops, and the differences in the requirements for inputs of production factors such as land, fertilizers, pesticides, etc., theoretically, there are differences in the carbon emissions and emission intensity of different food crops. Zhang et al. (2017) have estimated the carbon emissions of the major food crops in China, and their study found that in 2013, China’s corn, wheat, rice production process carbon footprints were at a high level. In particular, the carbon footprint of producing 1 kg of corn was 0.48 kg of CO2, wheat was 0.75, and rice was 1.6 kg.
Many scholars have also studied the regional differences in China’s ACE. Tian et al. (2014) found through a study of 31 provinces and municipalities in China that different carbon emission sources have different contributions to total ACE, with obvious differences between regions, and the western region has the highest intensity of ACE. Liu et al. (2021) analyzed the spatial distribution of ACE in 30 provinces in China from 2009 to 2019 and found that the performance of ACE in China follows the spatial layout pattern of east > west > central. Wu et al. (2021) studied the efficiency of agricultural carbon emissions in 30 provinces in China and found that there is a large potential for emission reduction in most regions, and the efficiency of agricultural carbon emissions in different provinces and explored the factors affecting ACE efficiency and its spatial spillover effect. Han and Zhong (2023) also estimated the differences in ACE among the three major grain functional areas in China, and the study showed that, both in terms of total and mean indicators, carbon emissions from the agricultural production process in the main grain-producing areas were higher than those in the main marketing areas and the areas of balanced production and marketing.
In terms of research on drivers, existing literature has shown that there are numerous factors influencing ACE, such as production efficiency, agricultural production structure, rural population, agricultural industrial structure, agricultural economic development level, rural education level, agricultural mechanization, agricultural development level, industrial agglomeration level, and urbanization level (Song and Lu, 2009; Tian et al., 2023; Xiaong et al., 2020; Ji et al., 2024; Su et al., 2013; Deng et al., 2015). Tunç et al. (2009) used four types of energy consumption of solid fuel, oil, gas and electricity in three major industries, namely, agriculture, industry and service, as an indicator to measure the carbon emissions of Turkey in 1970–2006, and applied the logarithmic mean divisia index (LMDI) decomposition model energy carbon emission influencing factors, and pointed out that the biggest influencing factor of carbon emission is economic activities, and structural effects negatively affect carbon emission. González et al. (2014) also used LMDI decomposition model to analyze the carbon emission influencing factors of EU countries, and the results showed that energy efficiency investment negatively affects carbon emission. According to Tian et al. (2014), carbon sources were classified in detail from three main levels: planting, livestock and poultry industry, and land use. By using multiple linear regression, it was found that the urbanization rate and nitrogen fertilizer application rate were the two main factors affecting carbon emissions of planting, while per capita agricultural output value and the ratio of beef production to total output of animal husbandry were the important factor influencing carbon emissions of animal husbandry. Jiang et al. (2021) analyzed the factors of ACE at the provincial level in China, and concluded that ACE were mainly affected by per capita arable land area and rural population.
Generally speaking, the research scales of the existing literature is relatively macro. China has a vast territory, different resource endowments in different region, and the agricultural production layouts and production methods are quite different. Firstly, there are regional differences in ACE in Sichuan province compared with other regions. Secondly, in different perspectives of ACE research, most of the existing studies are conducted from the national level, and the research on a single region is mainly concentrated in Heilongjiang, Hubei, Shandong and other agricultural provinces, while the related research on ACE in Sichuan province is few and scattered. As an important grain production base, Sichuan province’s accounts for about 10% of China’s total grain production. The number of pigs in Sichuan province ranks first in China, and the output of cash crops such as rapeseed and tea ranks first. Sichuan province is a key region to ensure national food security and the stability of agricultural supply chain. From the perspective of industrial structure, the country is actively promoting industrialization and urbanization, and the agricultural economy of a considerable number of cities accounts for less than 10% of GDP, while the agricultural sector in Sichuan province still accounts for a considerable share. From the internal perspective of the agricultural industrial structure, in 2023, the proportion of planting and animal husbandry in the agricultural sector is 47 and 38%, respectively. Food crops (rice, wheat, corn) and cash crops (rapeseed, tea, fruits) are developing simultaneously. In 2023, 66.5 million pigs will be sold, accounting for 10.8% of the country’s total, and production capacity continues to recover. Cattle and sheep breeding to large-scale transformation, beef cattle stock increased by 5.3%. The forest coverage rate of Sichuan province exceeds 40%. If the ecological balance is damaged by agricultural activities (such as slope farmland development), soil erosion will be aggravated, forest and soil carbon sink capacity will be weakened, and ecological security in the middle and lower reaches of the Yangtze River will be threatened. However, the research on agricultural carbon emissions in Sichuan province is still insufficient. The most important is that, global methane emissions from agriculture account for 40% of man-made emissions. Sichuan province is the largest pig farming region in China, and its livestock methane reduction (through manure recycling) is a benchmark for achieving the Global Methane Commitment. So it is necessary to systematically study agricultural carbon emission in Sichuan province from the aspects of the total amount, spatial and temporal characteristics and the influencing factors. Finally, in terms of methods, many studies focus on quantitative analysis, lacking in-depth explanation of the spatio-temporal characteristics of ACE and the socio-economic driving factors behind the influencing factors. The main contributions are as follows:
(1) The importance of the object of study. As an important grain production base in China, Sichuan province is located in the ecologically fragile area of the upper reaches of the Yangtze River. Existing studies have mainly analyzed carbon emissions from industry, transportation, service industries and energy (Li et al., 2022; Zeng et al., 2022; Zhang et al., 2025), but few literatures have focused on ACE. In addition, there are few studies on long time series of GHG emissions from regional agricultural sector. According to the particularity of agricultural economy and agricultural structure, this paper innovatively takes Sichuan province of China as the research object and analyzes the ACE change status of various cities in the past 20 years. This study collected the long-panel data from 18 cities in Sichuan province from 2000 to 2022, and the results based on long-time series data can fully display the changing trends and regional evolution of ACE in Sichuan province. The results of this study can provide empirical support for agricultural carbon reduction in major grain production bases in China.
(2) Innovation of evaluation system. This study enriches the system for measuring carbon emissions from agriculture. Compared with the existing literature that measures ACE from the narrow sense of planting, this study measures ACE from four dimensions of land use, farmland cultivation, rural life and animal husbandry, starting from the broad concept of agriculture. The measurement system of this study includes carbon emissions from most aspects of the agricultural sector as far as possible. In addition, we measured methane and nitrous oxide emissions on the basis of existing literature and converted them to CO2 to make the results more comprehensive. In particular, we include rural energy consumption in our ACE calculations. It is mainly calculated by using urban and rural power consumption data and based on annual power carbon dioxide emission factors. This index has not been fully reflected in previous studies (Zhang et al., 2019; Guo et al., 2023; Wei et al., 2023). ACE has the characteristics of multiple sources and subjects, and the construction of a specialized carbon emission accounting inventory will make the results closer to the real value of agricultural economic development.
(3) Innovation of research methods. This paper innovatively uses statistical methods to analyze the current situation, main sources and regional differences of ACE in Sichuan province. From the perspective of regional differences, this study analyzes the regional differences, convergence and agglomeration of ACE in 18 cities in Sichuan province by using visualization tools and a series of statistical methods. Specifically, based on geographical location, this study divides the cities into sub-samples of northern Sichuan, eastern Sichuan, western Sichuan and southern Sichuan, analyzes the gap within and between groups by Gini coefficient, then tests whether cities with higher ACE per unit output have higher emission reduction rates by using the conditional convergence method, and confirms the convergence trend of the ACE reduction. It tests whether ACE reduction in the 18 cities in Sichuan province is more effective than other cities in the province by using the spatial autocorrelation method. Spatial autocorrelation method was used to study the spatial correlation and spatial agglomeration mode of ACE. We also improved the STIRPAT model when analyzing the external factors driving the reduction of ACE (York et al., 2003).
2 Methodology, sample and data sources
2.1 Methods
2.1.1 Methods and indicators for ACE
The multi-source, multi-variable and multi-subject characteristics of ACE make it necessary to cover a large number of carbon sources for its measurement. Currently, there is no authoritative organization to disclose the total amount of ACE in Chinese cities. The methods used in the existing literature to measure ACE include the input–output method, the life cycle method, the field measurement method, the model optimization method, and the carbon emission coefficient method (Wen et al., 2024; Li et al., 2024). Among them, the coefficient method recommended by IPCC has been adopted by a large number of studies due to its advantages of concise formula, wide range of applicability, and convenient calculation (Du et al., 2023; Wang et al., 2020; Shen et al., 2023). According to IPCC, the process of measuring ACE is as follows:
In Equation 1, TE is the total amount of ACE, Ei is the carbon emissions from each type of carbon source, AD is the specific carbon source, EFi is the emission factor of the carbon source, and n is the number of carbon sources. A large number of literatures have only considered the carbon emissions from agricultural cultivation when measuring ACE (Huan et al., 2025; Jin M. et al., 2024; Hou et al., 2024). However, cultivation is only a narrow concept of agriculture, which does not fully encompass all production activities in rural areas. From the broad concept of agriculture, it also includes indicators of rural life, animal husbandry, forestry and aquaculture. Combined with the actual situation of agricultural production in Sichuan province, this paper selects 14 indicators for comprehensive measurement from four aspects: land use, farmland cultivation, livestock breeding and rural life. Common greenhouse gasses are methane (CH4), nitrous oxide (N2O) and carbon dioxide (CO2). In order to quantitatively and conveniently measure the ACE, this paper refers to the methodology of existing literature (Tian and Zhang, 2013), which converts the greenhouse effect produced by CH4 and N2O to CO2. Their conversion processes are 1 t CH4 = 6.82 t C = 25 t CO2 and 1 t N2 O = 81.27 t C = 298 t CO2, respectively. CH4’s source is mainly biological action in anaerobic environment, so it is mainly sourced from various types of shallower water bodies, wetlands such as swamps and rice fields. Combined with the availability of agricultural data in Sichuan province, only the GHG from dryland crops in cultivation are considered in this paper. In dryland ecosystems, the anaerobic respiration process is relatively weak, CH4 bacteria are inactive, and dryland soils have an absorptive effect on CH4, so the CH4 emission from dryland ecosystems is very small, while the N2O emission is quite large. Therefore, only N2O emissions were calculated in this study when calculating GHG emissions from cultivation. The GHG emissions from large livestock and poultry farming can be divided into enteric fermentation and manure management. CH4 emissions are mainly generated from the enteric fermentation process of animals and the anaerobic environment formed by manure in the process of stacking. N2O emissions are mainly generated from the management of livestock manure. In this paper, the two sources of carbon in animal husbandry are accounted for separately. Energy consumption is the main component of agricultural carbon emissions. Because data on fossil energy consumption for agricultural production, such as farm machinery, are not available, this paper uses rural electricity consumption to measure energy consumption.
In summary, integrating the availability of agricultural economic data in Sichuan province and the characteristics of multiple subjects and sources of ACE, this paper constructs the carbon emission accounting inventory in Table 1. For the indicators, GHG categories and carbon emission factors in the inventory, this study also referred to a large number of literature (Feng et al., 2025; Wu et al., 2024; Xie et al., 2024; Han et al., 2024; Xia et al., 2023). The carbon emission coefficients of some indicators of agricultural land use, agricultural land cultivation and animal husbandry also refer to the 2006 IPCC Guidelines for National Greenhouse Gas Inventories. The carbon emission conversion factors for electricity in Sichuan province were obtained from the CO2 Emission Factors for Electricity in 2021, jointly published by the Ministry of Ecology and Environment of China and the National Bureau of Statistics.

Table 1. Indicators and conversion factors for ACE accounting.
2.1.2 Convergence analysis
The theory of convergence is condensed from the theory of convergence in classical economics. Convergence of economic variables implies that over time, the backward regions will show a tendency to catch up with the relatively developed regions because they have higher growth rates, and the differences between regions will become smaller and smaller. This study mainly applies convergence to analyze the convergence trend of ACE reduction in Sichuan province. Depending on whether external factors affecting the growth rate are included in the model, β convergence can be divided into absolute β convergence and conditional β convergence. Different regions have different economic development patterns, resource endowments and natural conditions, and ACE are also affected by the economic system, so it is necessary to incorporate control variables to control the effects of individual differences. The expression for convergence is:
Equations 2, 3 are absolute β convergence and conditional β convergence, respectively. 0 is a constant term, β1 and 2 are regressions, μi is an individual fixed effect, νt is a time-fixed effect, εit is a randomized perturbation term, and CV are control variables. The STIRPAT model improved on the IPAT model overcomes the shortcomings of the unit elasticity of the effects of external factors on environmental pressures and gives the model more stochasticity, and is now widely used to test the influencing factors that drive the indicators of carbon emissions, carbon reduction, and ecological footprints (Yu et al., 2023; Huang et al., 2021; Zuo et al., 2020; Lohwasser et al., 2025). Based on the existing literature, this paper extends and optimizes the STIRPAT model, and selects seven variables as control variables from the economic system and natural causal conditions (Huan et al., 2025; Jin et al., 2024). The control variables are shown in Table 2. According to the results, if β is significantly negative, it indicates that the ACE in Sichuan province shows a converging trend, and vice versa, it is considered that there is a diverging trend. It should be noted that, because the ACE is a negative indicator, if it is substituted into the model the measured results reflect the growth rate of carbon emissions in each region, which is not in line with the era of carbon emission reduction. Therefore, the meaning of Y in Equations 2, 3 is the carbon emission intensity per unit of GDP (ACI).
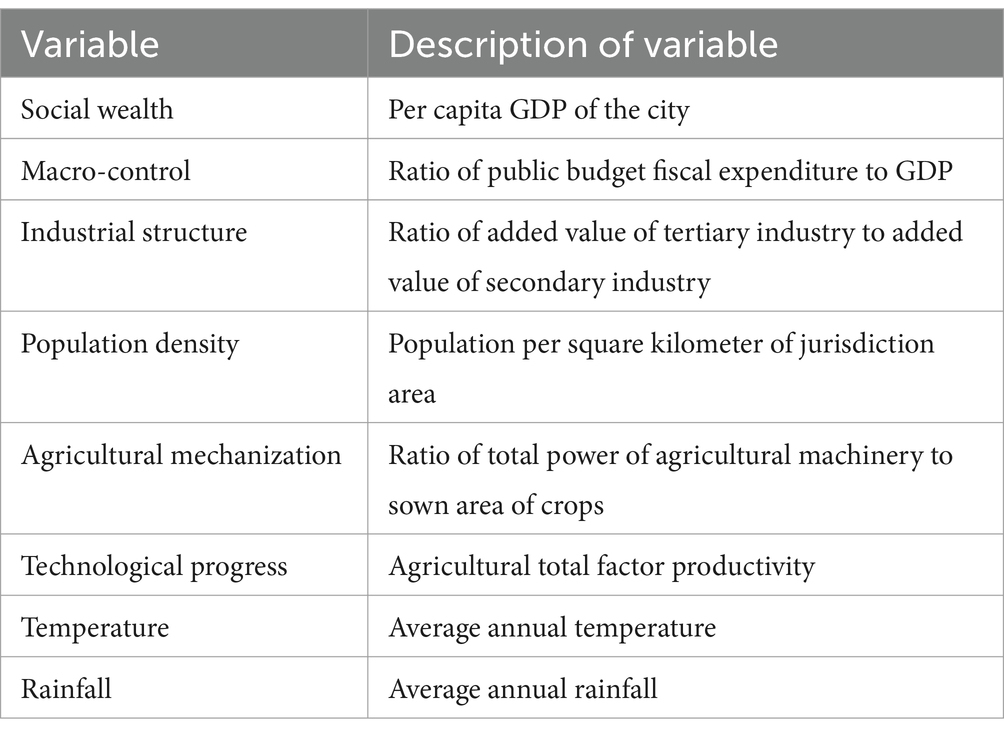
Table 2. Control variable and its measurement.
2.1.3 Dagum Gini coefficient
The convergence analysis reflects the fact that the growth rate of carbon emission reduction in backward regions is higher than that in developed regions, which is a holistic analysis. Compared with the traditional Gini coefficient, coefficient of variation and Tel index, the Gini coefficient method proposed by Dagum (1997) has good spatial decomposition function. It can not only identify the source and composition of regional differences, but also effectively overcome the problem of repeated overlapping between sample data. In general, the overall regional Gini coefficient (G) can be divided into three parts: intra-group disparity (Gw), inter-group disparity (Gnb) and hyper variance density (Gt). Among them, the results of Gw measure the within-region gap, the results of Gnb measure the between-region gap, and the results of Gt measure the phenomenon of cross-overlapping of sample data between groups. The inequality in ACE due to overlap between groups of sample data is known as hyper variance density. The equation to calculate the Dagum Gini coefficient is:
In Equation 4, G is the Dagum Gini coefficient, and the larger its value means the larger the overall difference. k is the number of sub-regions, which is divided into four regions according to the geographic location of the cities in Sichuan province. The list of cities within the base period of the specific region list is shown in Table 3. nj and nk are the number of cities within each of region j and region h, respectively. yji and yhr are the ACE of city i in region j and city r in region h, respectively. is the mean value of the ACE in Sichuan province. According to the three constituent sources that make up the overall variance G, it can be categorized as:
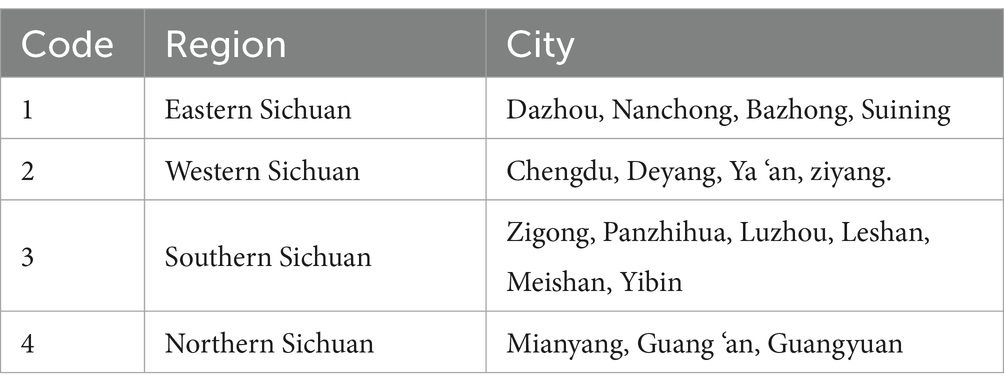
Table 3. List of cities in the four regions of Sichuan province.
In Equations 5–9, Gjj is the Gini coefficient of region j, and Gjh is the Gini coefficient between region j and region h. The Gini coefficient of region j is the Gini coefficient of region h. , . is the degree of interaction of ACE between region j and region h, and djh is the difference in ACE between region j and region h. pjh is the hypervariable first-order moment. It is the mathematical expectation of the sum of all sample values. djh and pjh are calculated as shown in Equations 10, 11.
In both equations, is the cumulative probability density distribution function.
2.1.4 Analysis of spatial autocorrelation
The spatial autocorrelation aims to test the spatial correlation and agglomeration status of the sample data, and the commonly used metrics are Moran’s I and Geary’s C. Moran’s I is widely used for its distributional characteristics, standardized statistics, and fewer application conditions. Referring to existing literature, this study uses Moran’s I to measure the spatial correlation of 18 cities in Sichuan province (Cheruiyot, 2022; Ding and Liu, 2024; Xiag et al., 2024). It is expressed as:
In Equation 12, S2 is the sample variance, n is the number of cities, GI is Global Moran’s I, and Wij is the spatial weight matrix, which was used to measure the spatial linkages between cities. Regarding the setting of the spatial weight matrix, the matrix constructed on the basis of geographic information was also made the most exogenous weight matrix due to geographic proximity and the fact that geographic distances are naturally occurring. Since this study does not include data from autonomous regions, it leaves Panzhihua with no bordering cities. Therefore, this paper constructs the spatial weight matrix based on the spherical distance between cities. In general, the value range of Moran index is [−1,1]. If GI > 0, it means that there is a spatial positive correlation of ACE in cities, that is, similar values tend to cluster. The larger its value is, the more obvious the spatial clustering phenomenon is. If GI < 0, it means that there is a spatial negative correlation of ACE in cities, that is, similar values tend to disperse. The larger its value, the greater the degree of spatial dispersion. If GI = 0, it means that the ACE of the cities are randomly wandering at the spatial level without any spatial correlation. The tool to determine whether the Moran’s I coefficient is positive or not is the Z-test, which is expressed as , with . However, GI can only report on the presence or absence of agglomeration states or outliers at the spatial level of the study object, not quite ignoring the potential problem of uncertainty in the spatial process, and also rather than being able to report on more details. The results contained in the GL are inadequate if the researcher is to further analyze observations for high or low values of local clustering, discern the contribution of regional units to global spatial autocorrelation, and the extent to which the global assessment masks anomalous local conditions or small-scale instabilities. Local Moran’s I (LI) is the first of a number of ways in which the GL can be used to further complement and development of the technical details. It measures the local spatial correlation around each individual in the dataset, and can provide researchers with information on which areas of high value clustering exist and which areas of low value exist, thus explaining more complex spatial distribution patterns. Overall, the GI results answer the question of “Yes” or “No,” while the LI results answer the question of “Where,” and the LI expression is:
In Equation 13, LI is local Moran’s I. The meaning of the rest of the symbols is consistent with Equation 15. In order for the observations to be clearly presented, this study used the visualization tool of scatterplot for analysis. Existing literature states that the Moran scatterplot is divided into four quadrants (Xu, 2017). The first quadrant represents the form of spatial linkage in which regional units with high observations are surrounded by other regions with high observations, that is, the High(H)-High(H) clustering pattern. The second quadrant represents the form of spatial association in which regional units with low observations are surrounded by other regions with high observations, i.e., the Low (L)-High (H) pattern of agglomeration. The third quadrant represents the L-L pattern of agglomeration and the fourth quadrant the H-L pattern of agglomeration.
2.1.5 Econometric model
The IPAT model incorporates the environment (I), population (P), economy (A), and technology (T) into a unified framework, and attempts to describe the relationship between each factor and environmental change through mathematical modeling. The STIRPAT model, which was improved from the IPAT model, has the characteristic of flexibility and is now widely used in studies related to analyzing abatement factors and scenario projections of carbon emissions (Cooray and Özmen, 2024; Niu et al., 2024). In order to examine the external factors driving ACE, this paper optimizes and improves the IPAT model using the principles of the STIRPAT model. The basic expression of IPAT is:
In Equation 14, the I denotes environmental pressure, which in a generalized context can be replaced by any indicator of environmental pollution and load. In this paper, it refers to ACI. e is the error term. The Equation 14 could be transformed to Equation 15:
The STIRPAT model has a strong openness. Most of the existing studies are adjusted according to the research topic when utilizing the STIRPAT model for analysis. Existing literature suggests that other external factors can be included in the STIRPAT model as long as there is rationality in the theoretical dimension (York et al., 2003). In this paper, the model is expanded on the three existing factors, which leads to the following panel data model:
In Equation 16, ACI is the carbon intensity, which is measured by the ratio of the absolute quantity ACE to the value added of the primary industry. CV is the external factor that drives ACE. It contains population density, industrial structure, social wealth, macro-control, agricultural technology progress, agricultural mechanization, rainfall and temperature. The calculation process of external factors driving ACE is shown in Table 4.

Table 4. Descriptive statistics.
2.2 Location
Located in the southwest of China and the upper reaches of the Yangtze River, Sichuan province is known as the “Land of Abundance,” covering an area of 486,000 square kilometers, accounting for 5.1% of the total land area of the country, ranking fifth in the country. Sichuan province has jurisdiction over 21 cities and 183 counties, connecting Chongqing in the east, Yunnan and Guizhou in the south, Xizang Autonomous Region in the west and Qinghai, Gansu and Shaanxi in the north. In agricultural production, Sichuan is one of the 13 major grain-producing provinces in China, and its grain output has maintained steady growth for many years. In 2023, Sichuan’s grain output reached 35.938 million tons, ranking ninth in China. According to the distribution of crop, the sown area of cash crops in Sichuan province reached 3.861 million hectare, accounting for 37.6% of the total sown area of crops. Among them, the output of rapeseed ranks first in the country for 14 consecutive years, the output of tea ranks fourth in the country, and the output of citrus ranks third in the country. From the perspective of animal husbandry, the output of live pigs steadily ranked first in the country. In 2022, the added value of the primary industry in Sichuan province was 596.43 billion CNY, and the contribution rate to economic growth was 10.5%, respectively. It can be seen that the green development of agriculture is crucial to the high-quality development of Sichuan province.
As one of the important agricultural bases in the western region of China, Sichuan province is facing severe pressure to reduce ACE under the policy overweight of the western development strategy and the construction plan of Chengdu-Chongqing double-city economic circle. ACE in Sichuan province has shown a year-on-year growth trend over the past decade, especially in the planting and animal husbandry sectors, where the growth in carbon emissions has been more significant. At the same time, Sichuan province is located in a high altitude area (the average elevation is 2,598 meters, and the largest elevation difference between cities is 3,836 meters), with complex terrain and changeable climate. These geographical features affect the temporal and spatial distribution of ACE, making the characteristics of ACE in this area different from those in the eastern region. This study focuses on the main grain-producing areas in western China, and takes Sichuan province as the sample of the study, with ACE as the theme. The results will help to narrow the gap of agricultural economic development between China, and provide data support and reference for China’s agricultural provinces and other countries with similar conditions in the world to achieve low-carbon agriculture.
2.3 Data source
The data for 18 cities from 2000 to 2022 was selected as a sample based on the principles of availability of indicators and comparability in Sichuan province. Since China’s administrative divisions are divided into five levels, including provinces, cities and counties, three autonomous prefectures exist within the jurisdiction of Sichuan province. They do not belong to the same level as prefecture-level cities, making their results not directly comparable. Therefore, this study did not consider the samples of Ganzi Tibetan Autonomous Prefecture, Aba Qiang Tibetan Autonomous Prefecture and Liangshan Yi Autonomous Prefecture. The sources of data are Statistical Yearbook of Sichuan, Statistical Yearbook of China, Urban Statistics Bureau and the EPS database. For a few missing values, this paper uses interpolation method to fill the blanks.
3 Results
3.1 Analysis of overall ACE
In order to analyze more deeply the ACE caused by the development of the agricultural economy in Sichuan province, this study also measured the carbon intensity (ACI) on top of the ACE. Among them, ACI is measured by the ratio of ACE to the value added of primary industry, which reflects the carbon emissions per unit of GDP. Figure 2 shows the trend of ACE and ACI in Sichuan from 2000 to 2022, calculated based on the inventory in Table 1. In Figure 2, the vertical axis is measured in ten thousand tons.
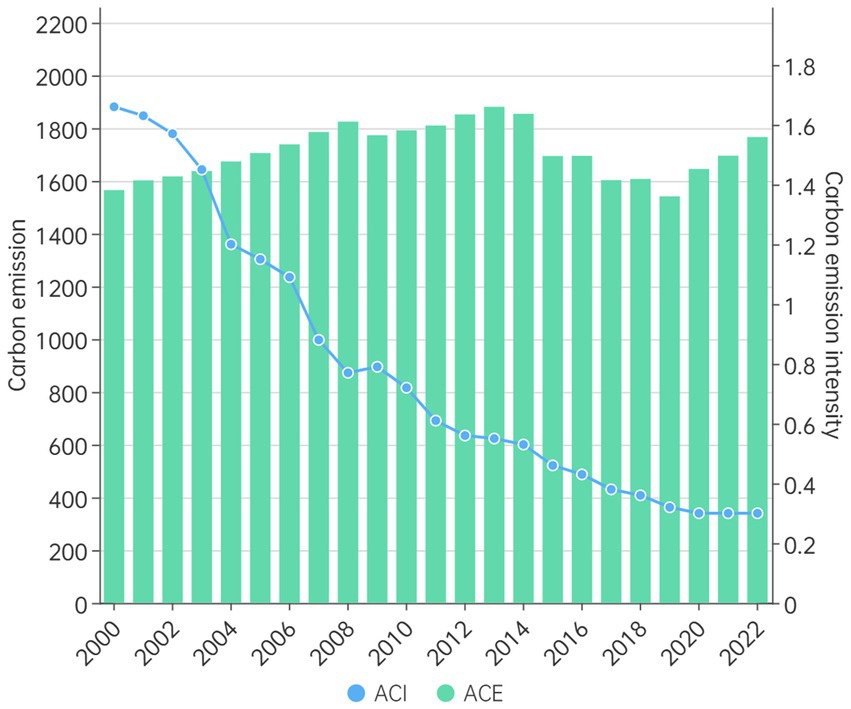
Figure 2. Results of ACE in Sichuan province from 2000 to 2022.
Figure 2 shows that, from 2000 to 2022, the ACE show a general trend of rising in fluctuation, growing from 15,654,300 tons in 2000 to 17,666,300 tons in 2022, with an average annual growth rate of 0.61%. This trend can be subdivided into three stages: The first stage is from 2000 to 2013, and the ACE in this stage increased from 15.6543 million tons to 18.8115 million tons; The second stage is 2014–2020, in which the ACE is reduced from 18.8115 million tons to 16.4557 million tons; After 2020, the ACE show a rising trend again. The change trend of total carbon emissions in Sichuan province calculated in this paper is consistent with that calculated at the provincial level in China (Jiang et al., 2021), which is also consistent with the data on ACE in China disclosed by FAO.
However, ACI in Figure 2 shows that although the ACE in Sichuan province fluctuated and rising from 2000 to 2022, due to technological progress, agricultural transformation and upgrading and the country’s emphasis on the development of green agriculture, the ACI showed an obvious downward trend, from 160 million yuan per 10,000 tons in 2000 to 0.3 billion yuan per 10,000 tons in 2022. This shows that the relationship between agricultural growth and carbon emissions in Sichuan province has reached a decoupling state, that is, ACE per unit of agricultural GDP have been declining. The trend of ACE reduction is highlighted, which means that Sichuan is expected to achieve the dual-carbon target for agriculture as scheduled.
3.2 Decomposition analysis of ACE
In Figure 3a, the vertical axis is measured in ten thousand tons. As can be seen from Figure 3, in 2000, 2010 and 2015, the ratio of carbon emissions and ACE produced by animal husbandry was 39,48,37.41 and 33.94%, indicating that during 2000–2015, animal husbandry contributed one-third of the ACE, which is the main source of carbon emissions in agricultural ecosystems in Sichuan province. This may be due to farmers’ lack of awareness of agricultural green development at this stage, the frequent phenomena of free-range and disorderly breeding, the low scale of aquaculture, the unscientific division of aquaculture area and the insufficient supporting facilities and equipment for the resource utilization of livestock and poultry manure. The proportion of livestock carbon emissions to ACE has declined after 2015, and will account for 27.34% by 2022. ACE from land use showed a fluctuating upward trend before and after 2015, and also showed a downward trend after 2015. This may be due to the intensive planning and management of land, the improvement of land use efficiency, such as the construction of high-standard farmland and other policies, and the reduction of land use emissions. From 2000 to 2022, carbon emissions from agricultural land cultivation show a fluctuating upward trend, and its proportion in the agricultural ecosystem rose from 24.69% in 2000 to 31.48% in 2022, indicating that agricultural production urgently needed to adopt green and clean technologies to improve the level of intensification and greening. The carbon emissions caused by farmers’ lives, however, always show an upward trend, growing from 6.30 to 14.79% from 2000 to 2022, with an average annual growth rate of 4.54%, much higher than the overall growth rate of ACE. This reflects the improvement of Sichuan residents’ living standards and its increasing impact on the environment, which leads to the rise of ACE.

Figure 3. Decomposition of carbon emission sources in Sichuan province. (a) Absolute quantity of carbon sources. (b) Proportion of different carbon sources.
3.3 Analysis of the spatial and temporal evolution trend of ACE
From a to d in Figure 4, it can be found that, from 2000 to 2022, the ACE of all cities shows an upward trend. Figures 4e,f also show this. However, Figures 4a–d also show at the same time that there are obvious regional differences in ACE. As shown in Figure 4a, in 2000, Ya’an, Panzhihua and Zigong had lower levels of ACE, while Chengdu, Nanchong and Dazhou had higher levels, that is, there was an obvious gap in ACE between cities. And Figure 4b shows that in 2010, Chengdu, Nanchong and Dazhou still had higher levels of ACE, while Panzhihua still had lower levels. And by 2015 (Figure 4c), Ya’an’s ACE grew significantly, but it was still much lower than the levels of Chengdu, Nanchong and Dazhou. And Figure 4d shows that this inter-city difference in ACE still exists by 2022.
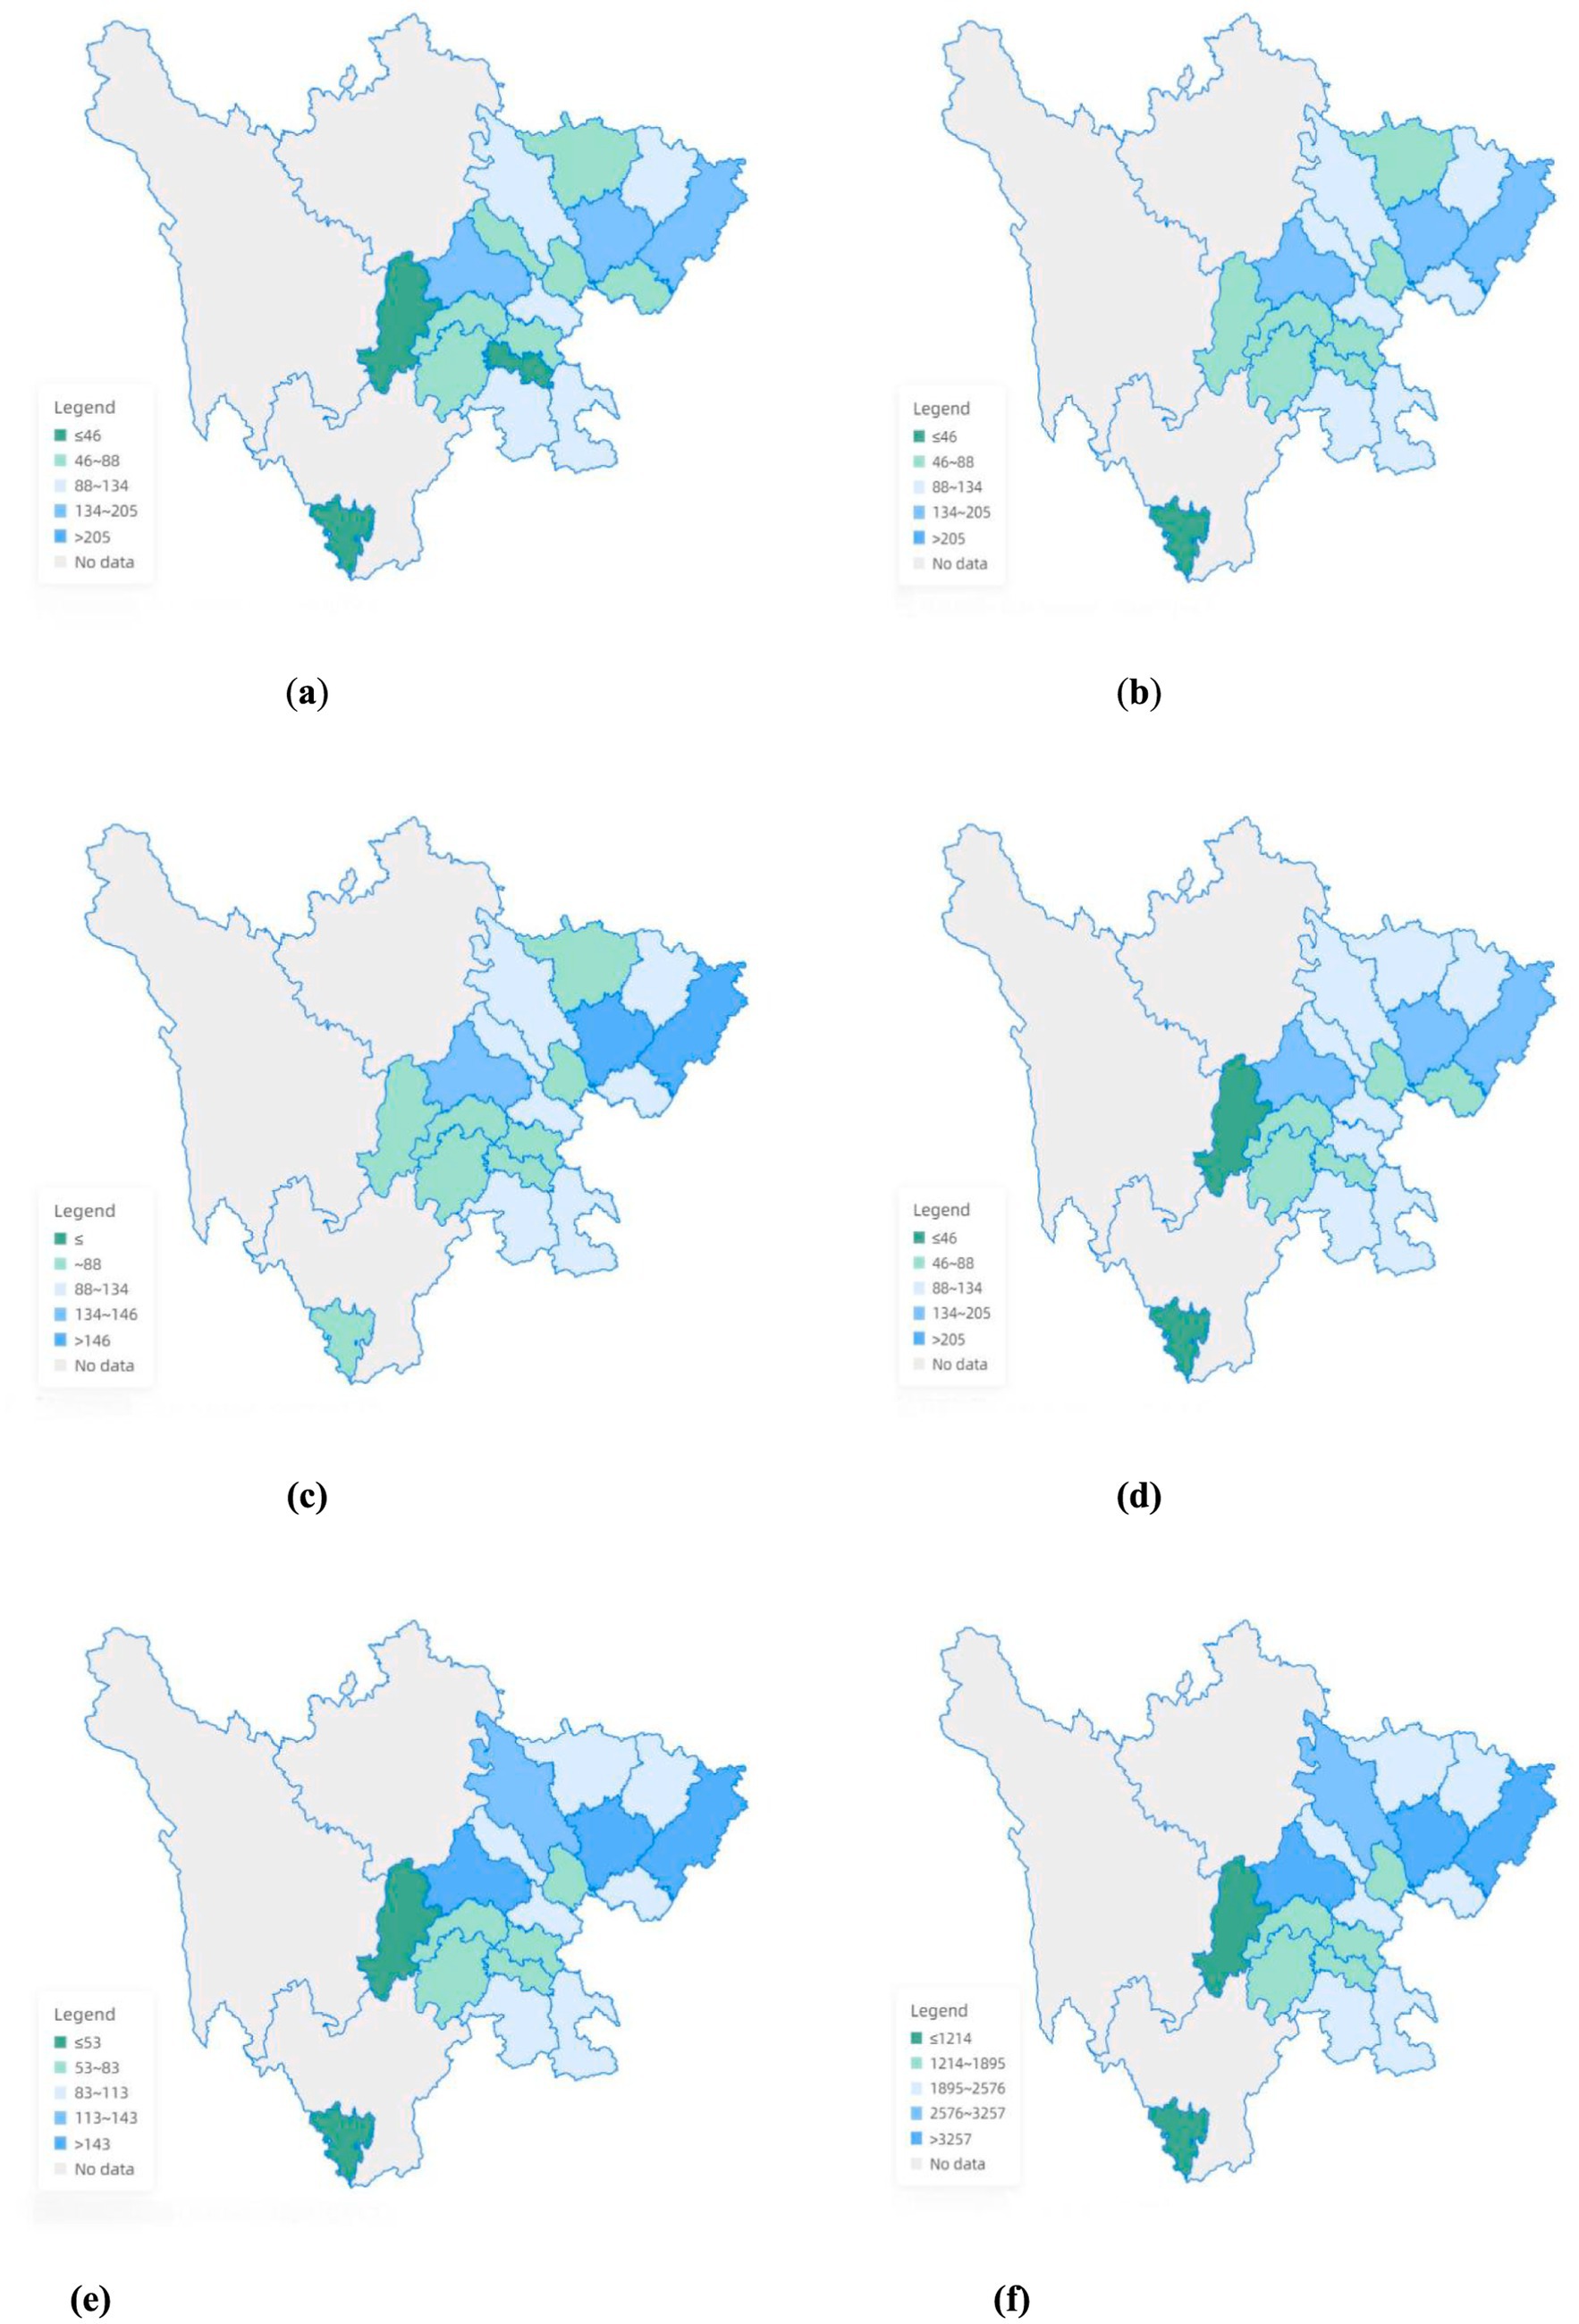
Figure 4. Temporal and spatial evolution of agricultural carbon emissions in Sichuan province. (a) ACE in 2001. (b) ACE in 2010. (c) ACE in 2015. (d) ACE in 2022. (e) Average value of ACE from 2000 to 2022. (f) Total ACE from 2000 to 2022.
So, is this regional gap widening or narrowing? At what level exactly? Does this gap exist within cities? To answer these questions, a detailed analysis of the regional gap follows.
3.4 Convergence analysis
According to the method proposed in section 2.4, this study considers the absolute convergence and conditional convergence of ACE in Sichuan province, respectively. As can be seen from column (1) of Table 5, the β coefficient of ACE is negative at the significance level of 5%, indicating that the regional gap in ACE is gradually narrowing and there is absolute β convergence. Using a fixed-effect model, population density, macro-control, industrial structure, social wealth, agricultural mechanization, agricultural technological progress, temperature and rainfall are taken as control variables, and conditional β convergence is further considered. The results in column (2) of Table 5 show that the β coefficient of conditional convergence of ACE in Sichuan province is negatively significant at the statistical level of 1%, which indicates that there is conditional β convergence, but the factors affecting β convergence are different.
Table 5. Results of convergence analysis.
Macro-control and mechanization have a significant positive effect on ACE, showing that the increase in government financial inputs and the increase in the level of agricultural mechanization will make ACE higher. This may be due to the increase in government financial input, which leads to an increase of social investment, thus expanding agricultural production and increasing carbon emissions. The level of mechanization has improved the efficiency of agricultural production, and the improvement of agricultural production efficiency has promoted the increase of ACE through the expansion of production scale. Agricultural technology progress has a significant negative impact on ACE, which shows that agricultural technology progress is beneficial to reducing ACE. On the one hand, the progress of agricultural technology has a direct emission reduction effect, which will reduce the waste of production factors such as pesticides by promoting the intensive and clean channels of agricultural production, therefore producing emission reduction effect. On the other hand, agricultural technological progress has a spillover effect. Through the diffusion and integration of technology, it will lead to green-biased technological progress, thus producing emission reduction effect. Population density, industrial structure, social wealth, temperature and rainfall have no influence on the convergence of ACE in Sichuan province.
3.5 Regional differences and decomposition analysis in ACE
To further observe the regional disparity, as described in section 2.5, this paper uses the Datum Gini coefficient and its decomposition method to analyze the regional differences in ACE.
As can be seen from Table 6, the Gini coefficient of ACE has experienced an inverted U-shaped trend of first rising and then falling. Taking 2014 as the cut-off point, the regional differences of ACE in Sichuan province gradually expanded from 2000 to 2014, which showed that Gini coefficient rose from 0.221 in 2000 to 0.235 in 2014. However, the overall regional differences of ACE remained at a low level in this period. From 2014 to 2022, the Gini coefficient dropped from 0.235 to 0.212, indicating that the regional gap in ACE is gradually narrowing. Decomposition of the Gini coefficient shows that the intra-group gap in ACE remains stable from 2000 to 2022, and the inter-group gap constitutes the root of the regional gap in ACE. From 2000 to 2012, the contribution of the inter group gap grew from 47.94 to 63.42%, with an average growth rate of 4.79%. However, after 2014, the contribution rate of the gap between groups fluctuated, from 61.46% in 2014 to 43.95% in 2022, with an average annual decline of 7.46%. This shows that the regional gap is narrowing, which is consistent with the previous convergence analysis.
Table 6. Results of Dagum Gini coefficient and contribution rate.
Analyzing the reasons, on the one hand, Sichuan province issued key energy-saving and emission-reduction projects, focusing on and treating some cities with high ACE level, high pollution and high energy consumption, such as implementing pilot demonstration of comprehensive utilization of straw in the whole region, promoting the construction of industrial-agricultural composite circular economy demonstration zones and the collaborative treatment of solid waste, and the task of rural environmental improvement projects in established villages issued by the state, which reduce the ACE with high pollution and high energy consumption. On the other hand, the establishment of river basin ecological compensation and carbon trading platform mechanism also narrowed the regional gap of ACE. However, Table 5 also shows that the contribution rate of hyper variable density fluctuates and increases from 2012, growing from 17.14 to 32.72% in 2022. This shows that the importance of the gap caused by the overlap and cross between the samples is increasing, which means that there are also serious high-carbon emission in some cities with low ACE level. If the high-carbon emission in these cities with low overall ACE level are ignored in the government’s carbon emission reduction strategic planning, this may aggravate the intra-group gap of ACE.
Further, taking into account the situation of Sichuan province, this paper observes the intra-group gap of ACE according to four regions of eastern Sichuan, western Sichuan, southern Sichuan and northern Sichuan. As shown in Table 7, the Gini coefficients of ACE in the four regions in the sample period are, in descending order of mean value, 0.091, 0.171, 0.194, and 0.227 for northern Sichuan, eastern Sichuan, southern Sichuan, and western Sichuan, respectively, indicating that there are gaps in carbon emissions to varying degrees in the four regions, with the smallest intra-group gaps in ACE in northern Sichuan and the largest intra-group gaps in western Sichuan. intra-group gap is the largest. Further observation of the time trend of the within-group coefficients reveals that the Gini coefficients of eastern and northern Sichuan are fluctuating upward, while western and southern Sichuan show a fluctuating downward trend.
Table 7. Results of Gini coefficient within the group.
As can be seen from Table 8, the gap between eastern Sichuan and western Sichuan, eastern Sichuan and southern Sichuan, and western Sichuan and southern Sichuan is an important part of the gap in ACE. The average Gini coefficients between groups during the sample period being 0.232, 0.296 and 0.269, respectively. Among them, the ACE gap between eastern and southern Sichuan is the biggest, followed by western Sichuan and southern Sichuan.
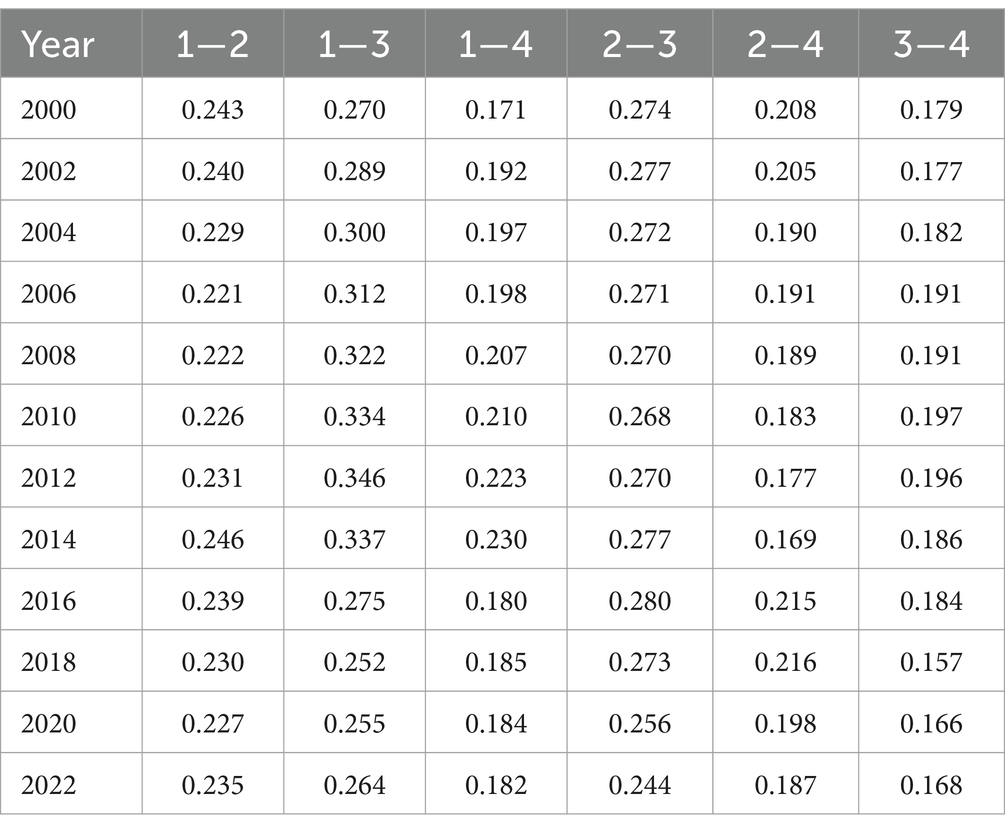
Table 8. Results of Gini coefficient between groups.
3.6 Analysis of spatial correlation characteristics
Although in the previous section this paper analyzed the regional disparity in ACE through convergence and the Gini coefficient, and found that this disparity is mainly contributed by inter-group disparity. However, this assumes that regions have clear boundaries. However, the fact is that cities or regions are correlated, and ACE are also characterized by spatial correlations and spatial spillovers. In order to examine the spatial correlation characteristics of ACE in Sichuan province, this paper calculates the Moran’s I coefficient of ACE in Sichuan province from 2000 to 2022 according to the method proposed in section 2.6, and the results are shown in Table 9.
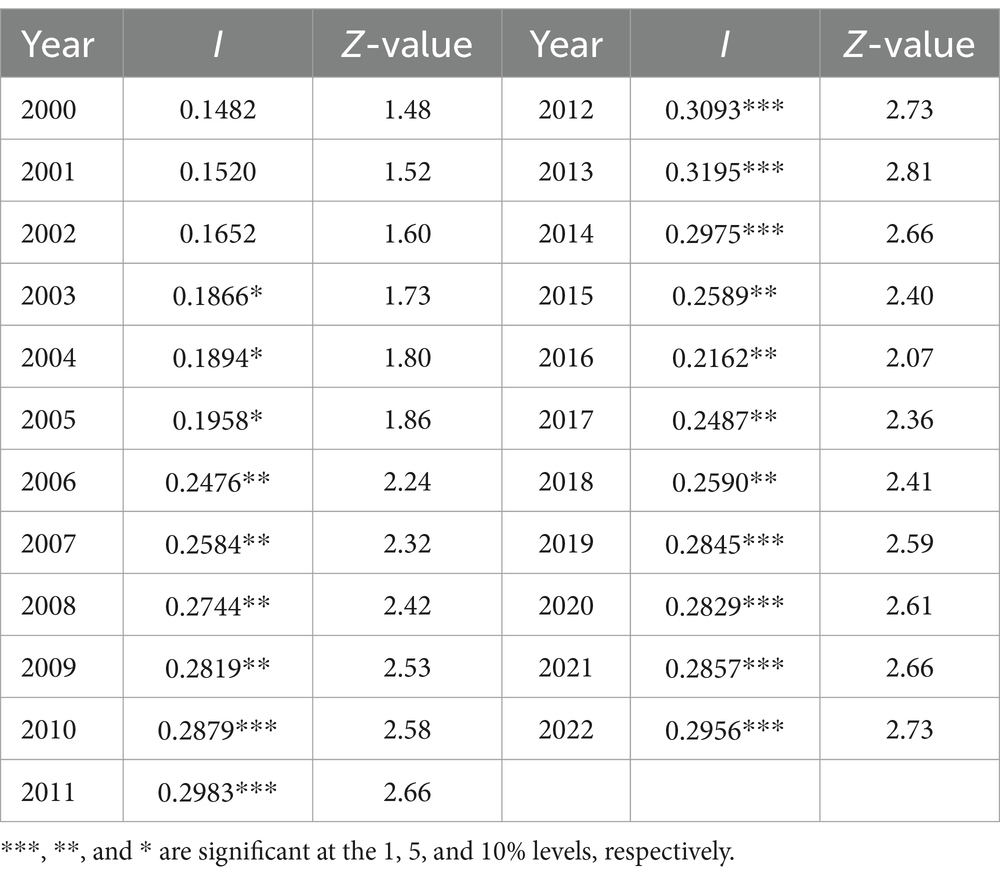
Table 9. Results of the Moran’s I.
As can be seen from Table 9, since 2003, although Moran’ I coefficient fluctuates and rises, it shows a positive spatial correlation, and ACE between cities has the characteristics of spatial correlation and spatial spillover. To a certain extent, this also shows that the formulation of ACE reduction policy plan needs the concerted efforts of all cities.
The global Moran’s I can be used to evaluate the overall spatial aggregation characteristics of ACI, but it cannot adequately reflect its localized agglomeration in different geographical locations. Therefore, this paper also calculated the local Moran’s I of 18 cities and visualized the agglomeration using STATA 16.0, and the results are shown in Figure 5.
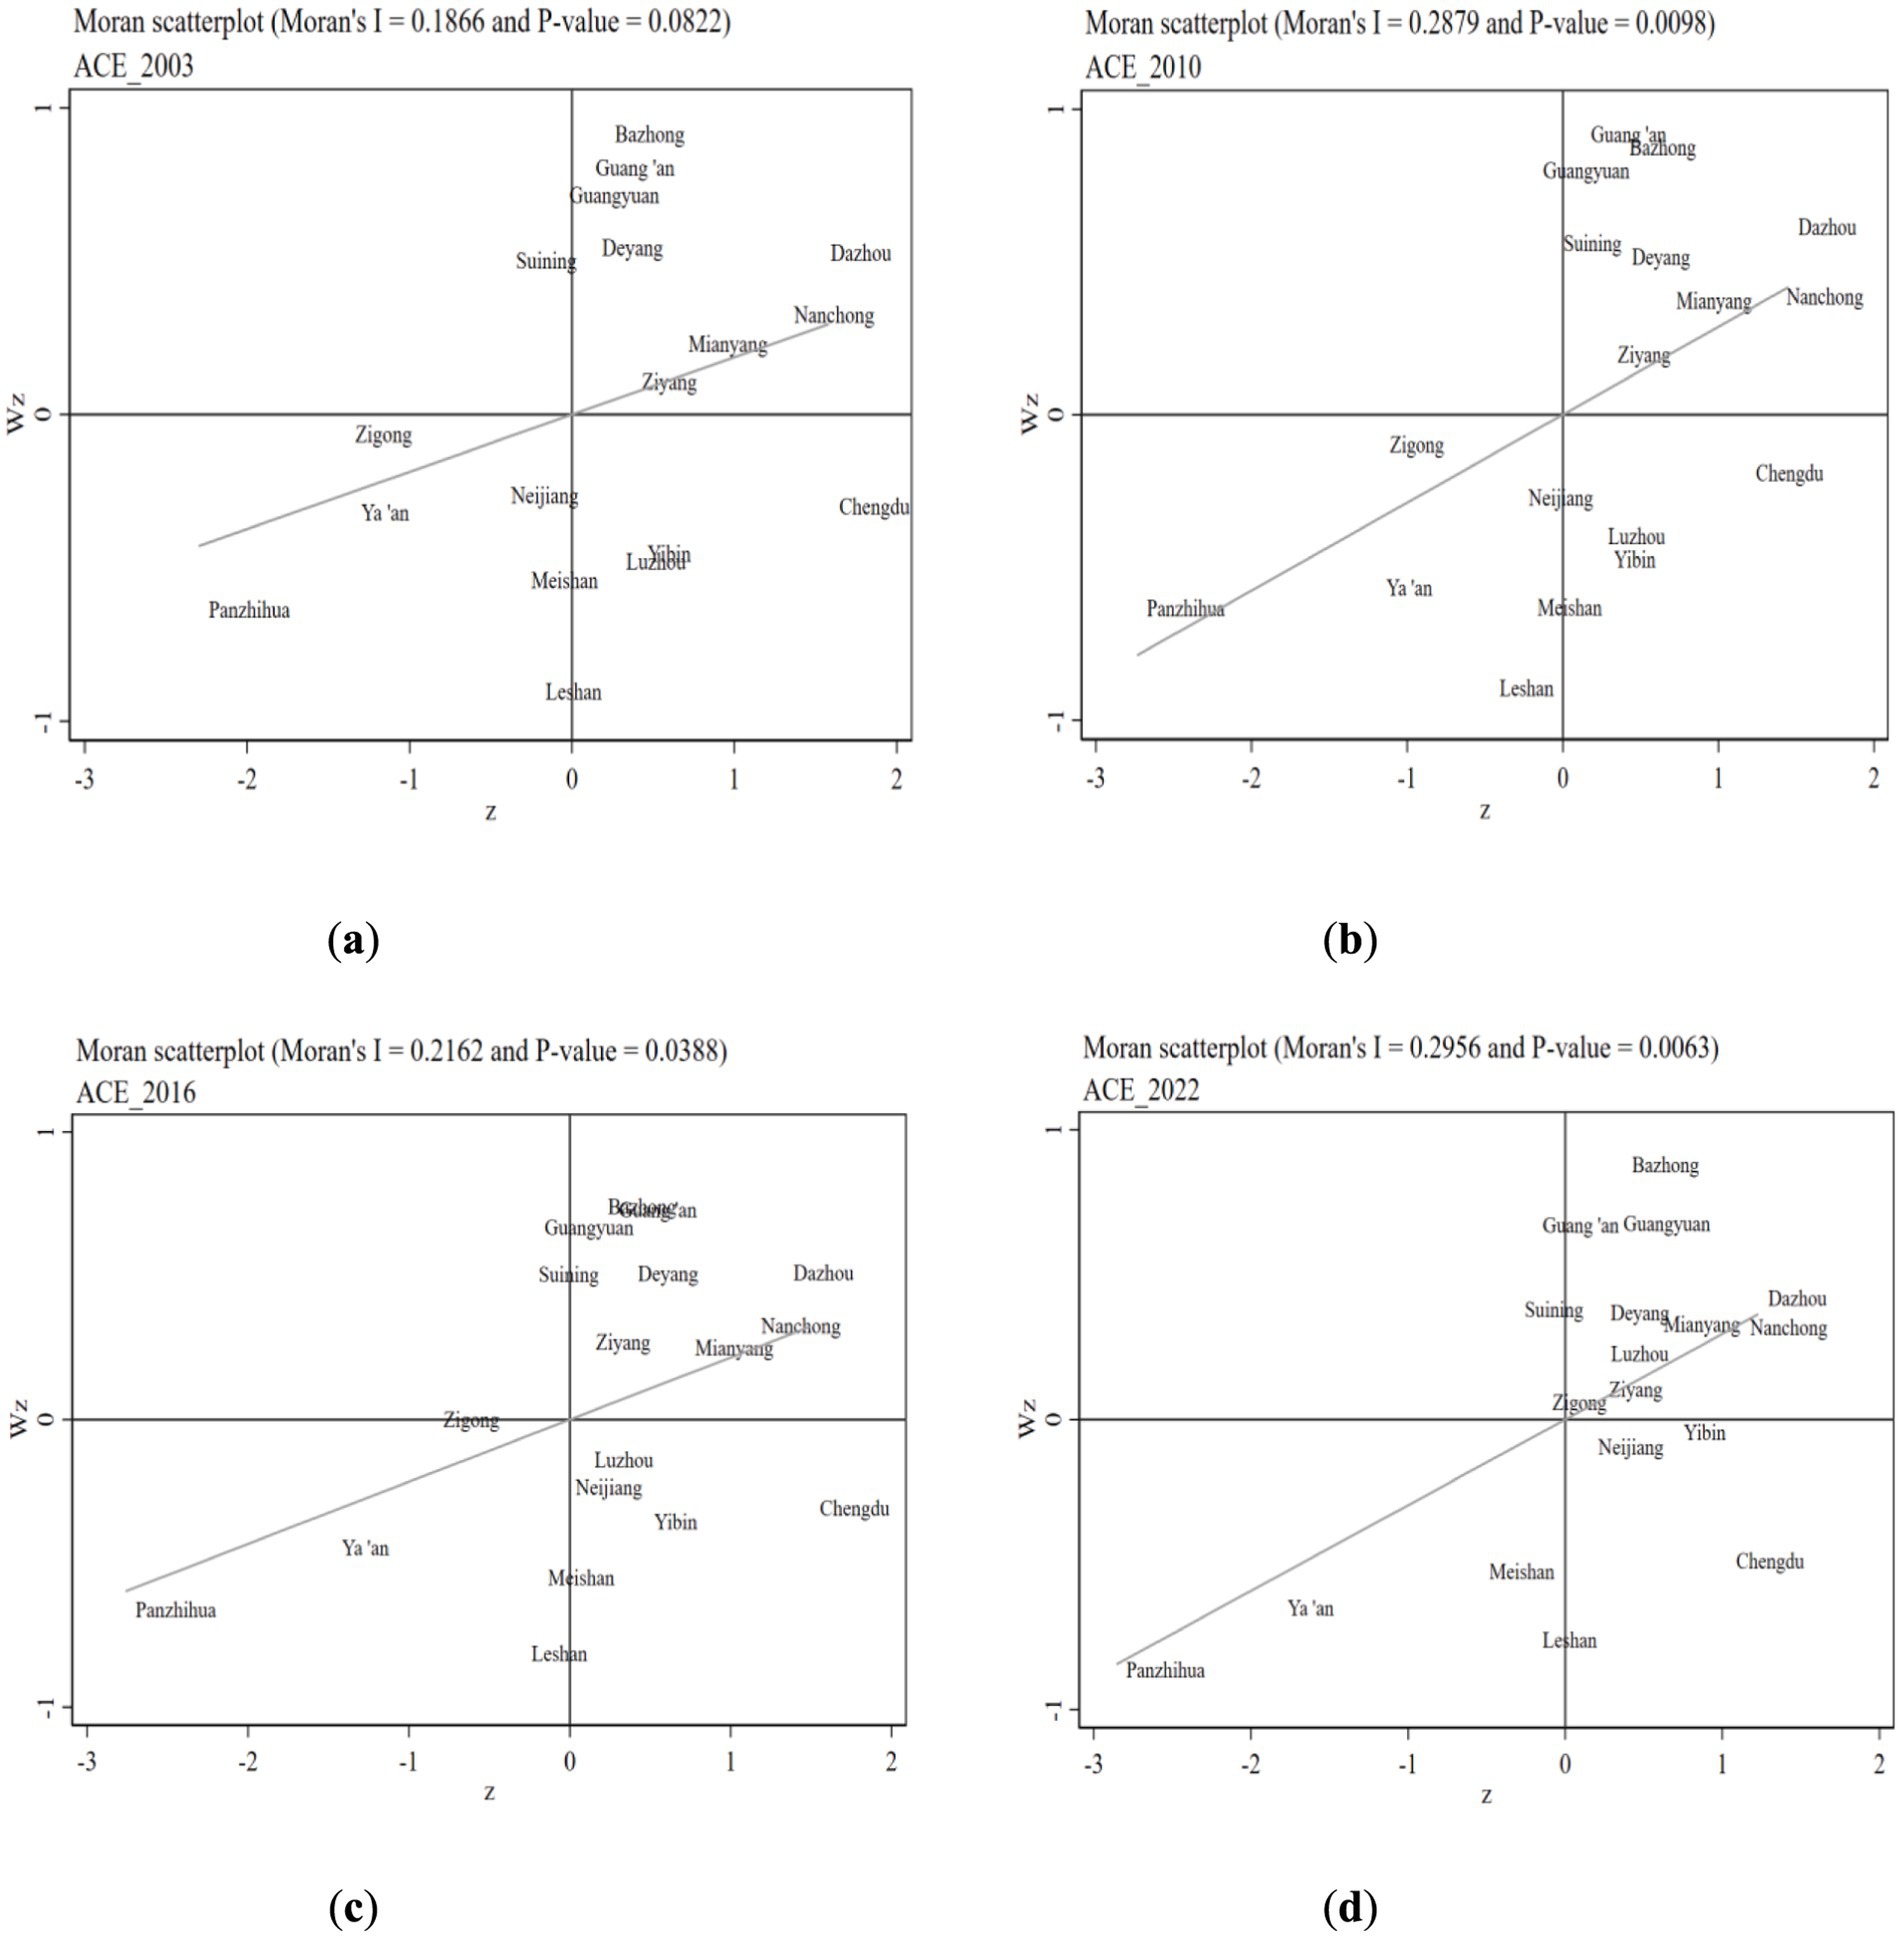
Figure 5. Moran scatter chart of representative years. (a) LI in 2003. (b) LI in 2010. (c) LI in 2016. (d) LI in 2022.
As can be seen from Figures 5a-d, most of the cities in the sample period are in the High-High agglomeration module, that is, the cities with high levels of ACE and high while agglomerate and interact with each other. Among them, eight cities, including Bazhong, Guang’an, Dazhou, Deyang, Guangyuan, Mianyang, Nanchong and Ziyang, were located in the High-High agglomeration module in 2003, which indicates that there are spatial agglomeration characteristics in these cities with relatively high levels of ACE. In the same year, Zigong, Ya’an, Neijiang, Meishan, Leshan, and Panzhihua are located in the Low-Low agglomeration module, indicating that spatial agglomeration exists in these cities with relatively low levels of ACE. In 2022, in the High-High agglomeration module, there are 10 cities, including Bazhong, Guang’an, Dazhou, Deyang, Guangyuan, Mianyang, Nanchong, Ziyang, Luzhou, and Zigong. Two of these cities have completed the leap to High-High agglomeration. Specifically, from 2003 to 2022, Luzhou shifts from High-Low agglomeration mode to High-High agglomeration, while Zigong shifts from Low-Low agglomeration mode to High-High agglomeration mode. This also shows that the level of ACE in these two cities is rising. However, on the whole, the cities with lower levels of ACE still have spatial agglomeration characteristics with the cities with higher levels of ACE.
3.7 Driver analysis of ACE
Table 10 reports the driver factors affecting ACE in Sichuan province estimated by Equation 16, where column (1) is the mixed regression result, column (2) is the result of random effects, and column (3) is the result using a two-way fixed effects model. Hausman tests for columns (2) and (3) show support for estimation using a panel fixed effects model.

Table 10. Results of driver analysis.
Table 10 shows that population density has a negative effect on ACE, which is inconsistent with the findings of Zarco-Periñán et al. (2021) on the relationship between urban population density and carbon emissions. This may stem from the fact that Sichuan province is still in the process of urbanization and the population density in rural areas is gradually decreasing, which makes the impact on ACE decrease. Macro-control increases ACE. The reason for this is that the increase in the level of government financial expenditure may have increased factor inputs to agriculture in the form of agricultural machinery capital subsidies, which in turn has led to an emissions-enhancing effect from the expansion of agricultural production. Industrial structure, social wealth, agricultural mechanization and technological progress have all contributed to ACE reduction. From the viewpoint of industrial structure, industrial structure upgrading on the one hand makes the industrial structure develop in the direction of advanced development, makes the proportion of agricultural added value in GDP gradually decline, and that part of high energy-consuming agriculture is gradually replaced. On the other hand, industrial structure upgrading has industrial ripple effects, such as the green transformation of the secondary and tertiary industries will lead to the green transformation of the primary industry, for example, agriculture-related enterprises engaged in the manufacture of agricultural machinery will promote the adoption of energy-efficient technologies in agricultural production, and the development of the tourism industry will improve the added value of agricultural production through the integration of agriculture and tourism, thus reducing ACE. Social wealth, represented by GDP per capita, has a negative impact on ACE, showing that economic growth promotes ACE reduction in Sichuan province. Agricultural mechanization and technological progress also have a significant negative impact on ACE. This stems from the fact that both agricultural mechanization and technological progress help to improve the efficiency of agricultural production and increase the scale and intensification of agricultural production, which reduces ACE due to factors such as production fragmentation and waste. However, in this sample, rainfall and temperature do not demonstrate a significant effect on ACE in Sichuan province.
Since the statistical sample used in this paper is the panel data of 18 cities in Sichuan province from 2000 to 2022, the number of observation years is significantly larger than the number of cities. In other words, this study uses long panel data. In order to eliminate the effects of heteroskedasticity and autocorrelation on the accuracy of the results, this paper also conducts a robustness test using the full feasible generalized least squares method (GLS). This method incorporates the residual vectors of each cross-section individual into the covariance matrix of heteroskedasticity, and utilizes the GLS method, and finally, it applies the GLS for the estimation. It is able to revise the heteroskedasticity and autocorrelation defects in the long panel data model. As can be seen from column (4) in Table 9, the results of FGLS are similar to those of the two-way fixed effects model, with no significant change in the direction of sign and significance of the coefficients of each variable. This result shows that the results of TWFE have robustness.
Overall, ACE in Sichuan province are significantly affected by population density, macro-control, industrial structure, social wealth, agricultural mechanization, and technological progress, among which population density, industrial structure, social wealth, agricultural mechanization, and technological progress have a negative effect on ACE, while macro-control increases ACE.
4 Conclusion
When estimating carbon emissions from China’s agricultural sector, the existing literature tends to focus on the narrow agricultural scope, where agricultural carbon sources only include agricultural materials, crop seeding, irrigation and farmland plowing (Huang X. et al., 2024; Huang Y. et al., 2024; Zhang et al., 2024; Huan et al., 2025; Feng et al., 2025). However, the main sources of carbon emissions from the agricultural sector are not only agricultural land use, but also rural energy consumption, survivable emissions from crop growtht (Wei et al., 2024; Zhang and Li, 2022; Yu et al., 2025). Therefore, it is necessary to construct a reasonable evaluation system and measure ACE from the perspective of a broad concept. This paper uses data of 18 cities in Sichuan province from 2000 to 2022, selects 12 carbon sources from two perspectives of planting and breeding according to the concept of agriculture in the broad sense, and measures the ACE by applying the IPCC guidelines. After the measurement, this paper analyzes the spatial and temporal evolution trend of the ACE as well as the carbon emissions of each prefectural city in Sichuan province, followed by the convergence analysis, regional inequality, agglomeration status and center of gravity shifting trend of the prefectural cities’ ACE using convergence analysis, the Gini coefficient and spatial correlation analysis. Finally, this paper examines the driving factors of ACE by using the fixed-effects model. The results of the study found as follow:
1. Basic status and contribution sources of agricultural carbon emissions. From 2000 to 2022, the overall level of ACE in Sichuan province rises, but the ACI declines. The existing study analyzed ACE in Sichuan province 30 years ago and concluded that ACE showed a rapid growth trend (Li and Zheng, 2011). This paper updates its data and draws new conclusions. The existing literature holds that the decoupling between ACE and economic growth in Sichuan province is unstable (Meng et al., 2024). The results of this paper show that ACE has experienced a change trend of first increasing and then decreasing, and is now at the right end of the inverted U-shaped curve. Thanks to the low-carbon transition and the rapid growth of the agricultural economy, the carbon emissions of the agricultural sector and economic growth are in a good decoupling state. The results of this study again confirm the findings of Liang et al., 2019. The agricultural sector in Sichuan province is expected to achieve a carbon peak. The decomposition of the carbon sources found that manure management and animal intestinal fermentation in aquaculture, farming and land use are major sources of agricultural carbon emissions. Before 2015, the main source of carbon was fecal management and intestinal fermentation, and after 2015, it was farm planting.
2. Convergence and regional differences of carbon emissions. The results of convergence theory and panel data model show that there is both absolute convergence and conditional convergence of agricultural carbon emission intensity in Sichuan province during the sample observation period. This means that regions with high carbon intensity have a faster rate of carbon reduction. Gini coefficient results show that the regional gap in ACE fluctuates and decreases, and the inter-group gap is the root cause of the existence of regional gaps in ACE in Sichuan province. And the gaps between eastern Sichuan and eastern Sichuan, eastern Sichuan and southern Sichuan, and western Sichuan and southern Sichuan contribute more to the regional gaps.
3. The results of spatial correlation show that there are spatial agglomeration and spatial spillover characteristics of ACE, which mainly show a high-high agglomeration pattern, but there are also a few cities that have undergone changes in the agglomeration pattern.
4. Analysis of driving factors. The extended STIRPAT model indicates that the ACE in Sichuan province is influenced by multiple factors. Specifically, population density, macro-control, industrial structure, social wealth, agricultural mechanization, and technological progress significantly affect ACE, of which population density, industrial structure, social wealth, agricultural mechanization, and technological progress have a negative effect on ACE while macro-control increases ACE.
4.1 Limitation and future research
Based on the panel data of 18 cities in Sichuan province from 2000 to 2022, this study used a series of statistical and econometric methods to make a detailed analysis of the current situation, spatio-temporal evolution trends and influencing factors of ACE in Sichuan, but this paper has the following limitations. The observations are affected by the fact that the results for autonomous regions are not comparable with cities. The unique feature of administrative differentiation in Sichuan province makes Panzhihua has no neighboring prefecture-level cities, which limits the potential of this paper on the reverse side of spatial analysis. In future studies, the authors strongly recommend focusing observations on the county dimension. Using a sample of counties offers advantages in expanding the sample size and improving the feasibility of spatial analysis. On the basis of spatial autocorrelation, the use of the center of gravity migration model, the quadratic cardboard procedure, and the standard elliptic difference technique can clearly demonstrate the spatial trends of ACE and the spatial linkages among cities in Sichuan province. In the part of influencing factors analysis, this study selected external variables with theoretical and practical rationality based on the STIRPAT model, but the factors related to agricultural policies have not been thoroughly discussed. In future studies, the authors suggest that the impacts of agricultural policies, including the zero-growth strategy of fertilizers and pesticides, the construction of high-standard farmland, and the assumption of a digital countryside, on the intensity of ACE in Sichuan should be fully explored.
Data availability statement
The data used in this study are publicly available and have been correctly cited. The main data sources are Sichuan Provincial Bureau of Statistics and ESP database. Data sets used or analysed in the current study are available from corresponding authors upon reasonable request.
Author contributions
WZ: Data curation, Formal analysis, Methodology, Software, Validation, Writing – original draft. YS: Conceptualization, Formal analysis, Funding acquisition, Investigation, Supervision, Visualization, Writing – review & editing.
Funding
The author(s) declare that no financial support was received for the research and/or publication of this article.
Conflict of interest
The authors declare that the research was conducted in the absence of any commercial or financial relationships that could be construed as a potential conflict of interest.
Generative AI statement
The authors declare that no Gen AI was used in the creation of this manuscript.
Publisher’s note
All claims expressed in this article are solely those of the authors and do not necessarily represent those of their affiliated organizations, or those of the publisher, the editors and the reviewers. Any product that may be evaluated in this article, or claim that may be made by its manufacturer, is not guaranteed or endorsed by the publisher.
References
Cheruiyot, K. (2022). Detecting spatial economic clusters using kernel density and global and local Moran's I analysis in Ekurhuleni metropolitan municipality, South Africa. Reg. Sci. Policy Pract. 14, 307–328. doi: 10.1111/rsp3.12526
Cooray, A., and Özmen, I. (2024). Institutions and carbon emissions: an investigation employing STIRPAT and machine learning methods. Empir. Econ. 67, 1015–1044. doi: 10.1007/s00181-024-02579-y
Dagum, C. (1997). A new approach to the decomposition of the Gini income inequality ratio. Empir. Econ. 22, 515–531. doi: 10.1007/BF01205777
Deng, C., Shi, P., and Dong, J. (2015). Analysis carbon emission factors influence empirical in Shanxi based on Kaya identity. Fut. Develop. 39, 102–107. doi: 10.3969/j.issn.1003-0166.2015.08.021
Ding, H., and Liu, C. (2024). Carbon emission efficiency of China's logistics industry: measurement, evolution mechanism, and promotion countermeasures. Energy Econ. 129:107221. doi: 10.1016/j.eneco.2023.107221
Du, Y., Liu, H., Huang, H., and Li, X. (2023). The carbon emission reduction effect of agricultural policy——evidence from China. J. Clean. Prod. 406:137005. doi: 10.1016/j.jclepro.2023.137005
Feng, L., Yang, W., Hu, J., Wu, K., and Li, H. (2025). Exploring the nexus between rural economic digitalization and agricultural carbon emissions: a multi-scale analysis across 1607 counties in China. J. Environ. Manag. 373:123497. doi: 10.1016/j.jenvman.2024.123497
González, P. F., Landajo, M., and Presno, M. J. (2014). The driving forces behind changes in CO2 emission levels in EU-27. Differences between member states. Environ. Sci. Pol. 38, 11–16. doi: 10.1016/j.envsci.2013.10.007
Guo, X., Yang, J., Zhang, X., and Shen, Y. (2023). Prediction of agricultural carbon emissions in China based on a GA-ELM model. Front. Energy Res. 11:1245820. doi: 10.3389/fenrg.2023.1245820
Han, C., Bingcan, W., and Mingsheng, Z. (2024). The spatiotemporal evolution and driving factors of China’s agricultural carbon emissions. Chin. J. Eco-Agric. 32, 1097–1108. doi: 10.12357/cjea.20230709
Han, D., and Zhong, Y. (2023). Research on the impact of agricultural science and technology innovation on carbon emission of grain production: a case study of China's three grain functional areas. Sci. Tech. Rev. 41, 32–42. doi: 10.3981/j.issn.1000-7857.2023.16.003
Hillier, J., Hawes, C., Squire, G., Hilton, A., Wale, S., and Smith, P. (2009). The carbon footprints of food crop production. Int. J. Agric. Sustain. 7, 107–118. doi: 10.3763/ijas.2009.0419
Hou, M., Cui, X., Xie, Y., Lu, W., and Xi, Z. (2024). Synergistic emission reduction effect of pollution and carbon in China's agricultural sector: regional differences, dominant factors, and their spatial-temporal heterogeneity. Environ. Impact Assess. Rev. 106:107543. doi: 10.1016/j.eiar.2024.107543
Huan, H., Wang, L., and Zhang, Y. (2025). Regional differences, convergence characteristics, and carbon peaking prediction of agricultural carbon emissions in China. Environ. Pollut. 366:125477. doi: 10.1016/j.envpol.2024.125477
Huang, Y., Elahi, E., You, J., Sheng, Y., Li, J., and Meng, A. (2024). Land use policy implications of demographic shifts: analyzing the impact of aging rural populations on agricultural carbon emissions in China. Land Use Policy 147:107340. doi: 10.1016/j.landusepol.2024.107340
Huang, J., Li, X., Wang, Y., and Lei, H. (2021). The effect of energy patents on China's carbon emissions: evidence from the STIRPAT model. Technol. Forecast. Soc. Chang. 173:121110. doi: 10.1016/j.techfore.2021.121110
Huang, X., Wu, X., Guo, X., and Shen, Y. (2024). Agricultural carbon emissions in China: measurement, spatiotemporal evolution, and influencing factors analysis. Front. Environ. Sci. 12:1488047. doi: 10.3389/fenvs.2024.1488047
Ji, M., Li, J., and Zhang, M. (2024). What drives the agricultural carbon emissions for low-carbon transition? Evidence from China. Environ. Impact Assess. Rev. 105:107440. doi: 10.1016/j.eiar.2024.107440
Jiang, J., Zhao, T., and Wang, J. (2021). Decoupling analysis and scenario prediction of agricultural CO2 emissions: an empirical analysis of 30 provinces in China. J. Clean. Prod. 320:128798. doi: 10.1016/j.jclepro.2021.128798
Jin, B., Cui, C., Wen, L., Shi, R., and Zhao, M. (2024). Regional differences and convergence of agricultural carbon efficiency in China: embodying carbon sink effect. Ecol. Indic. 169:112929. doi: 10.1016/j.ecolind.2024.112929
Jin, M., Feng, Y., Wang, S., Chen, N., and Cao, F. (2024). Can the development of the rural digital economy reduce agricultural carbon emissions? A spatiotemporal empirical study based on China's provinces. Sci. Total Environ. 939:173437. doi: 10.1016/j.scitotenv.2024.173437
Johnson, J. M. F., Franzluebbers, A. J., Weyers, S. L., and Reicosky, D. C. (2007). Agricultural opportunities to mitigate greenhouse gas emissions. Environ. Pollut. 150, 107–124. doi: 10.1016/j.envpol.2007.06.030
Li, H., Jin, X., Zhao, R., Han, B., Zhou, Y., and Tittonell, P. (2024). Assessing uncertainties and discrepancies in agricultural greenhouse gas emissions estimation in China: a comprehensive review. Environ. Impact Assess. Rev. 106:107498. doi: 10.1016/j.eiar.2024.107498
Li, W., Yu, X., Hu, N., Huang, F., Wang, J., and Peng, Q. (2022). Study on the relationship between fossil energy consumption and carbon emission in Sichuan Province. Energy Rep. 8, 53–62. doi: 10.1016/j.egyr.2022.01.112
Li, Z., and Zheng, X. (2011). Study on relationship between Sichuan agricultural carbon dioxide emissions and agricultural economic growth. Energy Procedia 5, 1073–1077. doi: 10.1016/j.egypro.2011.03.189
Liang, H., Xiao, S., and Wang, Y. (2019). Decoupling analysis of agricultural carbon emissions and economic development in Sichuan Province. J. Shandong Agri. Univ. 21:69. doi: 10.3969/j.issn.1008-8091.2019.02.011
Liu, D., Zhu, X., and Wang, Y. (2021). China's agricultural green total factor productivity based on carbon emission: an analysis of evolution trend and influencing factors. J. Clean. Prod. 278:123692. doi: 10.1016/j.jclepro.2020.123692
Lohwasser, J., Bolognesi, T., and Schaffer, A. (2025). Impacts of population, affluence and urbanization on local air pollution and land transformation – a regional STIRPAT analysis for German districts. Ecol. Econ. 227:108416. doi: 10.1016/j.ecolecon.2024.108416
Meng, Y., Shen, Y., Wang, W., Liu, Y., Wang, F., and Wang, H. (2024). Who affects carbon emissions? Drivers and decoupling effects of agricultural carbon emissions—evidence from Sichuan, China. Front. Sustain. Food Syst. 8:1441118. doi: 10.3389/fsufs.2024.1441118
Niu, X., Tian, Y., Tang, M., and Mian, Z. (2024). An empirical analysis of agricultural and rural carbon emissions under the background of rural revitalization strategy–based on machine learning algorithm. Air Qual. Atmos. Health 17, 2819–2837. doi: 10.1007/s11869-024-01606-2
Shen, Y., Guo, X., and Zhang, X. (2023). Digital financial inclusion, land transfer, and agricultural green total factor productivity. Sustain. For. 15:6436. doi: 10.3390/su15086436
Song, D., and Lu, Z. (2009). The factor decomposition and periodic fluctuations of carbon emission in China. China Popul. Res. Environ. 19, 18–24. doi: 10.3969/j.issn.1002-2104.2009.03.005
Su, Y., Ma, H. L., and Yan, L. (2013). Spatial-temporal differences and driving mechanism of agricultural land use carbon emission in Xinjiang. Arid Land Geog. 36, 1162–1169. doi: 10.13826/j.cnki.cn65-1103/x.2013.06.015
Tian, Y., and Zhang, J. B. (2013). Regional differentiation research on net carbon effect of agricultural production in China. J. Nat. Resour. 28, 1298–1309. doi: 10.11849/zrzyxb.2013.08.003
Tian, Y., Wang, R., Yin, M., and Zhang, H. (2023). Study on the measurement and influencing factors of rural energy carbon emission efficiency in China: Evidence using the provincial panel data. Agriculture 13:441. doi: 10.3390/agriculture13020441
Tian, Y., Zhang, J. B., and He, Y. (2014). Research on spatial-temporal characteristics and driving factor of agricultural carbon emissions in China. J. Integr. Agric. 13, 1393–1403. doi: 10.1016/S2095-3119(13)60624-3
Tunç, G. I., Türüt-Aşık, S., and Akbostancı, E. (2009). A decomposition analysis of CO2 emissions from energy use: Turkish case. Energy Policy 37, 4689–4699. doi: 10.1016/j.enpol.2009.06.019
Wang, G., Liao, M., and Jiang, J. (2020). Research on agricultural carbon emissions and regional carbon emissions reduction strategies in China. Sustain. For. 12:2627. doi: 10.3390/su12072627
Wei, J., Hu, R., and Shen, Y. (2024). Regional and urban-rural differences in carbon emissions of Chinese residents: dynamic evolution and structural decomposition. Pol. J. Environ. Stud. 33, 4767–4778. doi: 10.15244/pjoes/178203
Wei, Z., Wei, K., Liu, J., and Zhou, Y. (2023). The relationship between agricultural and animal husbandry economic development and carbon emissions in Henan Province, the analysis of factors affecting carbon emissions, and carbon emissions prediction. Mar. Pollut. Bull. 193:115134. doi: 10.1016/j.marpolbul.2023.115134
Wen, T., Sun, P., and Zhang, L. (2024). Dynamic evolution and regional pattern of agricultural carbon emissions in China. Econ. Geogr. 44, 165–175. doi: 10.15957/j.cnki.jjdl.2024.10.017
West, T. O., and Marland, G. (2002). A synthesis of carbon sequestration, carbon emissions, and net carbon flux in agriculture: comparing tillage practices in the United States. Agric. Ecosyst. Environ. 91, 217–232. doi: 10.1016/S0167-8809(01)00233-X
Wiśniewski, P., and Kistowski, M. (2018). Assessment of greenhouse gas emissions from agricultural sources in order to plan for needs of low carbon economy at local level in Poland. Geogr. Tidsskr. 118, 123–136. doi: 10.1080/00167223.2018.1436447
Wu, H., Huang, H., He, Y., and Chen, W. (2021). Measurement, spatial spillover and influencing factors of agricultural carbon emissions efficiency in China. Chin. J. Eco-Agric. 29, 1762–1773. doi: 10.13930/j.cnki.cjea.210204
Wu, H., Yue, Y., and Shen, Y. (2024). Agricultural carbon emissions in China: estimation, influencing factors, and projection of peak emissions. Pol. J. Environ. Stud. 33, 4791–4806. doi: 10.15244/pjoes/177464
Xia, Q., Liao, M., Xie, X., Guo, B., Lu, X., and Qiu, H. (2023). Agricultural carbon emissions in Zhejiang Province, China (2001–2020): changing trends, influencing factors, and has it achieved synergy with food security and economic development? Environ. Monit. Assess. 195:1391. doi: 10.1007/s10661-023-11998-w
Xiag, W., Lan, Y., Gan, L., and Li, J. (2024). How does new urbanization affect urban carbon emissions? Evidence based on spatial spillover effects and mechanism tests. Urban Clim. 56:102060. doi: 10.1016/j.uclim.2024.102060
Xiaong, C., Chen, S., and Xu, L. (2020). Driving factors analysis of agricultural carbon emissions based on extended STIRPAT model of Jiangsu Province, China. Growth and Change 51, 1401–1416. doi: 10.1111/grow.12384
Xie, T., Huang, Z., Tan, T., and Chen, Y. (2024). Forecasting China's agricultural carbon emissions: a comparative study based on deep learning models. Eco. Inform. 82:102661. doi: 10.1016/j.ecoinf.2024.102661
York, R., Rosa, E. A., and Dietz, T. (2003). STIRPAT, IPAT and ImPACT: analytic tools for unpacking the driving forces of environmental impacts. Ecol. Econ. 46, 351–365. doi: 10.1016/S0921-8009(03)00188-5
Yu, S., Yue, W., Li, S., Chen, S., and Wu, P. (2025). Characteristics identification and mitigating potentials of provincial gaseous reactive nitrogen emissions from livestock and poultry breeding systems in China. J. Environ. Manag. 374:124126. doi: 10.1016/j.jenvman.2025.124126
Yu, S., Zhang, Q., Hao, J., Ma, W., Sun, Y., and Wang, X. (2023). Development of an extended STIRPAT model to assess the driving factors of household carbon dioxide emissions in China. J. Environ. Manag. 325:116502. doi: 10.1016/j.jenvman.2022.116502
Zarco-Periñán, P. J., Zarco-Soto, I. M., and Zarco-Soto, F. J. (2021). Influence of population density on CO2 emissions eliminating the influence of climate. Atmos. 12:1193. doi: 10.3390/atmos12091193
Zeng, X., Chen, G., Luo, S., Teng, Y., Zhang, Z., and Zhu, T. (2022). Renewable transition in the power and transport sectors under the goal of carbon-neutral in Sichuan, China. Energy Rep. 8, 738–748. doi: 10.1016/j.egyr.2022.02.213
Zhang, H., and Li, S. (2022). Carbon emissions’ spatial-temporal heterogeneity and identification from rural energy consumption in China. J. Environ. Manag. 304:114286. doi: 10.1016/j.jenvman.2021.114286
Zhang, L., Pang, J., Chen, X., and Lu, Z. (2019). Carbon emissions, energy consumption and economic growth: evidence from the agricultural sector of China's main grain-producing areas. Sci. Total Environ. 665, 1017–1025. doi: 10.1016/j.scitotenv.2019.02.162
Zhang, D., Shen, J., Zhang, F., Li, Y. E., and Zhang, W. (2017). Carbon footprint of grain production in China. Sci. Rep. 7:4126. doi: 10.1038/s41598-017-04182-x
Zhang, Z., Wang, D., Meng, F., Tan, Q., Zhao, L., Deng, Y., et al. (2025). Navigating low-carbon transport in Sichuan Province: a synergistic approach. Transp. Res. Part D: Transp. Environ. 142:104687. doi: 10.1016/j.trd.2025.104687
Zhang, S., Wen, X., Sun, Y., and Xiong, Y. (2024). Impact of agricultural product brands and agricultural industry agglomeration on agricultural carbon emissions. J. Environ. Manag. 369:122238. doi: 10.1016/j.jenvman.2024.122238
Zou, X., Li, Y. E., Li, K., Cremades, R., Gao, Q., Wan, Y., et al. (2015). Greenhouse gas emissions from agricultural irrigation in China. Mitig. Adapt. Strateg. Glob. Chang. 20, 295–315. doi: 10.1007/s11027-013-9492-9
Keywords: agricultural carbon emission, agricultural carbon intensity, Sichuan province, region difference, driver factors
Citation: Zhang W and Shen Y (2025) Toward low-carbon agriculture: measurement and driver analysis of agricultural carbon emissions in Sichuan province, China. Front. Sustain. Food Syst. 9:1565776. doi: 10.3389/fsufs.2025.1565776
Edited by:
Srdjan Šeremešić, University of Novi Sad, SerbiaReviewed by:
Bruno Condori, Universidad Pública de El Alto, BoliviaChangming Cheng, Nanjing Forestry University, China
Copyright © 2025 Zhang and Shen. This is an open-access article distributed under the terms of the Creative Commons Attribution License (CC BY). The use, distribution or reproduction in other forums is permitted, provided the original author(s) and the copyright owner(s) are credited and that the original publication in this journal is cited, in accordance with accepted academic practice. No use, distribution or reproduction is permitted which does not comply with these terms.
*Correspondence: Yang Shen, eWFuZ3M5OTZAZm94bWFpbC5jb20=