 Huzur Deveci
 Buse Önler2
 Tolga Erdem
94% of researchers rate our articles as excellent or good
Learn more about the work of our research integrity team to safeguard the quality of each article we publish.
Find out more
ORIGINAL RESEARCH article
Front. Sustain. Food Syst., 02 April 2025
Sec. Crop Biology and Sustainability
Volume 9 - 2025 | https://doi.org/10.3389/fsufs.2025.1563048
Accurately predicting future changes in plant water requirements is crucial for effective irrigation scheduling. This study modeled the effect of climate change on irrigation water requirements for wheat and canola in the TR21 Thrace Region using CROPWAT 8.0. The HadGEM2-ES and MPI-ESM-MR models were used to simulate reference (1971–2000) and future short-term (2031–2040) and long-term (2051–2060) periods under RCP4.5 and RCP8.5 scenarios. The effects of climate change on reference evapotranspiration (ETo), crop evapotranspiration (ETc), and irrigation water requirements (IWR) for wheat and canola cultivation were modeled. As a result, compared to the reference period, ETo values increased by 4.5%–%17.1 (2.396–2.906 mm day−1) and 5.8%–%17.7 (2.110–2.533 mm day−1), while ETc values increased by 5.7%–%17.0 (438–595 mm season−1) and 6.3%–%17.0 (374–464 mm season−1) for wheat and canola, respectively. IWR values varied between −2.4 and 35.8% (158.8–321.3 mm season−1) for wheat and − 2.5 and 48.8% (106.5–238.6 mm season−1) for canola. When the results obtained from wheat and canola are compared, it is predicted that ETo will be 11–14% higher, ETc will be 14–23% higher, and IWR will be 19–43% higher for wheat than for canola. In addition, an analysis of the relationship between temperature and ETo, ETc, and IWR showed the pattern ETo > ETc > IWR, suggesting that while temperature strongly influences ETo and ETc, it is not the sole determinant of IWR. These findings provide valuable projections for farmers, agriculturalists, local administrators, planners, and decision-makers to support adaptation strategies for climate variability.
According to the Intergovernmental Panel on Climate Change (Bernstein et al., 2008), greenhouse gasses such as carbon dioxide, methane, and nitrous oxide, which have been released into the atmosphere due to human activities since 1750, have increased globally and contributed to climate change (Bernstein et al., 2008). Over time, these changes are expected to strain water and other resources, render soils infertile, degrade agricultural lands, drive widespread desertification, increase pest and disease outbreaks in crops, and threaten coastal ecosystems by raising sea levels (Akalın, 2014). These climate change-induced impacts pose critical challenges to agricultural sustainability and food security.
Wheat and canola are critical crops for global food security, dietary quality, and economic sustainability. Wheat serves not only as a staple food source but also as a versatile crop used in animal feed production and the food industry. Canola plays a strategic role in oil production and the biofuel industry. Together, these two crops are vital both globally and in countries with significant agricultural production capacity, such as Türkiye. Regions such as the TR21 Thrace Region play an important role in national wheat and canola production, exemplifying agricultural diversity and production stability.
According to 2023 TurkStat data, the TR21 Thrace Region accounts for 10.41% of Türkiye’s wheat production, with a total cultivated area of 4452508 decades and a production volume of 1843250 tons (Table 1). In canola production, the region holds a 36.94% share, contributing 44329 tons. At the provincial level, Tekirdağ plays a leading role in wheat and canola production, while Edirne and Kırklareli also make significant contributions (TSMS, 2024c). These data clearly demonstrate that the TR21 Thrace Region plays a strategic role in both wheat and canola production at the national level.
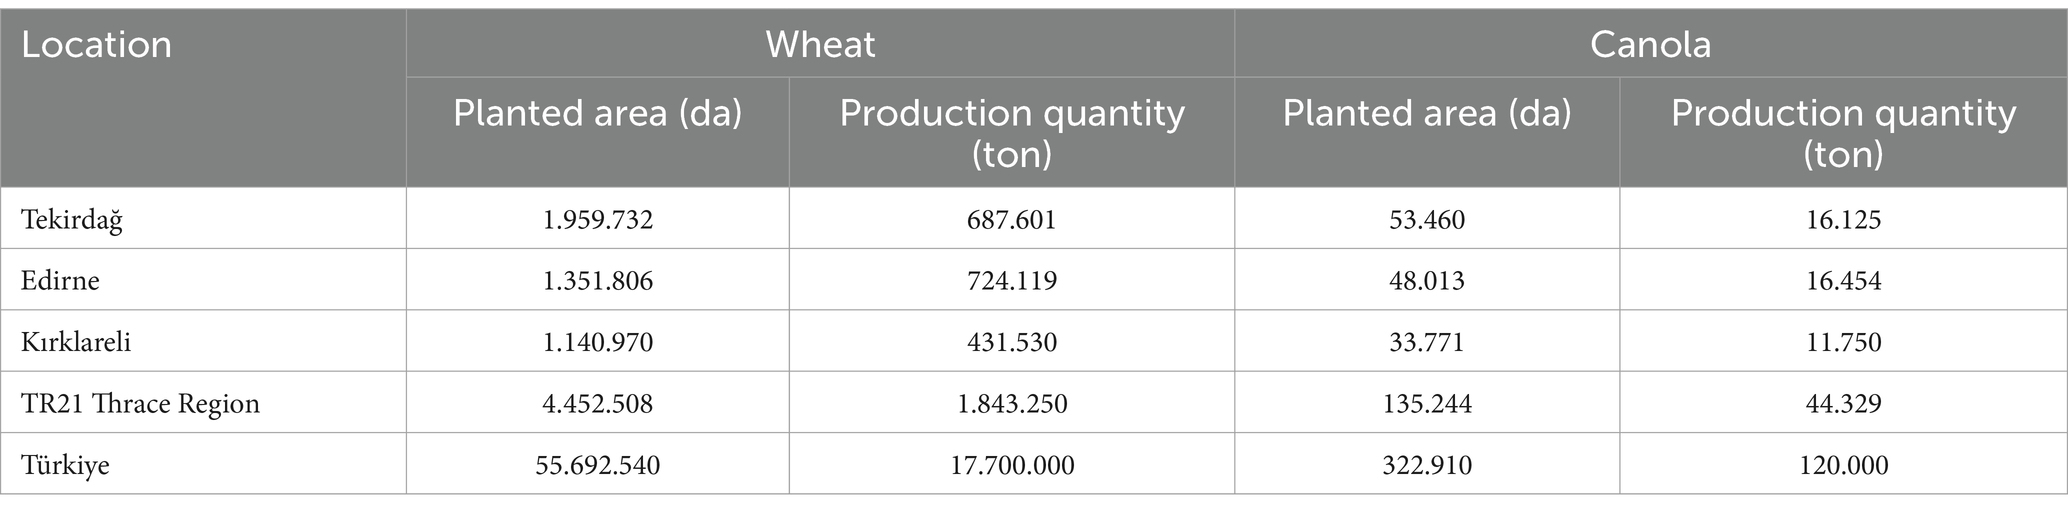
Table 1. Wheat and canola planting areas (da) and production amounts (tons) in Türkiye, TR21 Thrace Region, and the provinces in the region (TSMS, 2024c).
The TR21 Thrace Region, characterized by adequate and evenly distributed rainfall throughout the year, supports the growth of wheat and canola without the need for irrigation. However, during dry or critical growth periods, irrigation may be required (Güler et al., 2005; Dundar and Topak, 2021). In arid and semi-arid regions like the TR21 Thrace Region, crop cultivation largely depends on rainfall (Unakıtan and Abdikoğlu, 2014). Changing climate conditions and irregular rainfall can lead to yield fluctuations, highlighting the increasing importance of agricultural irrigation for maintaining yield stability and productivity.
Özalp (2010) defined agricultural irrigation as supplying the water needed for plant growth that natural rainfall cannot provide. Accurate measurement of ETc is crucial for healthy growth, high yields, and conserving water resources. Under-irrigation can cause plant stress and yield loss, while over-irrigation wastes water and harms the environment. Therefore, to adapt to climate change, it is essential to estimate future water needs using climate data and develop new irrigation strategies. Numerous studies address this issue globally and in Türkiye (Azlak and Şaylan, 2019; Sun et al., 2020; Selçuk, 2021; Aydın-Kandemir and Yıldız, 2022; Yetik and Şen, 2023; Reta et al., 2024; Youssef et al., 2024). For the region to adapt to climate change and maintain agricultural productivity, it is vital to predict future water needs and develop strategies based on these data. This study expands the current research for future estimations of ETo for wheat and canola crops in the TR21 Thrace Region using various climate models. Moreover, no previous program study has investigated irrigation water for any crop in the area. Therefore, this study is the first comprehensive region-specific study to model future irrigation water needs for wheat and canola crops in the TR21 Thrace Region.
This study aims to assess the impact of climate change on irrigation water requirements for wheat and canola in the TR21 Thrace Region. It evaluates the reference period from 1971 to 2000, as well as the RCP4.5 and RCP8.5 scenarios for both the short term (2031–2040) and long term (2051–2060), using data from the HadGEM2-ES and MPI-ESM-MR climate models. Reference evapotranspiration (ETo), crop evapotranspiration (ETc), and irrigation water requirements (IWR) were calculated using the CROPWAT 8.0 program. This research highlights the need to improve regional agricultural practices to adapt to future climatic conditions in light of the impacts of climate change on water resources.
The TR21 Thrace Region, located in northwest Türkiye on the European continent, includes 26 districts and 432 villages spread across three key provinces (MIART, 2024): Edirne (41° 40′ 37” N, 26° 33′ 20″ E), Tekirdağ (40° 58′ 0” N, 27° 30′ 0″ E), and Kırklareli (41° 40′ 48” N, 27° 26′ 11.4″ E). Renowned for its strategic geographical location, the region plays a vital role in both agriculture and trade. Figure 1 illustrates the location of the research area.
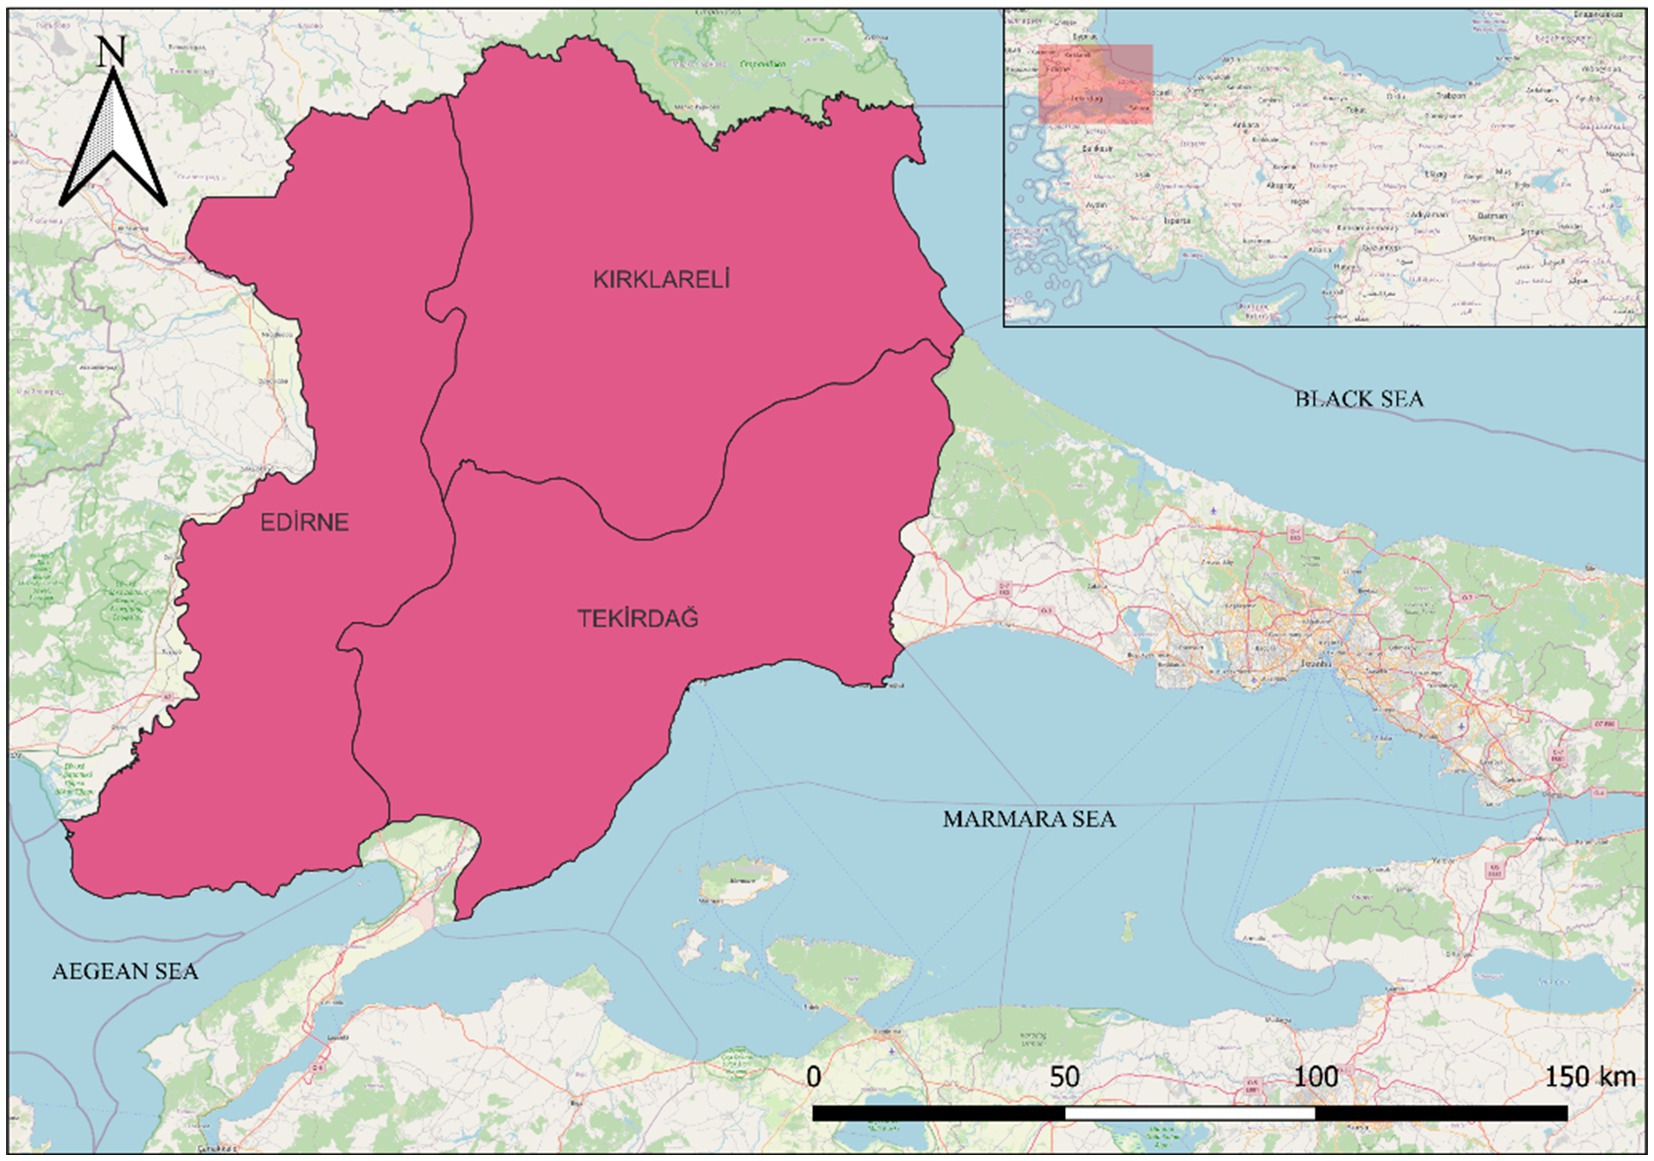
Figure 1. Research area.
The TR21 Thrace Region experiences three climate types: the Thrace continental climate in the inland areas, the Marmara (transitional) climate along the coast of the Marmara Sea, and the Black Sea climate along the Black Sea coast. The Thrace continental climate features hot summers and relatively cold winters, while the Marmara climate has hot, dry summers and warm, rainy winters. The Black Sea climate offers cool summers and warm winters along the coast, with snowy and cold conditions at higher elevations (Sensoy et al., 2008). Table 2 shows long-term climate data, indicating that Tekirdağ has the highest average temperature (14.1°C) and Edirne has the highest total precipitation (601 mm).
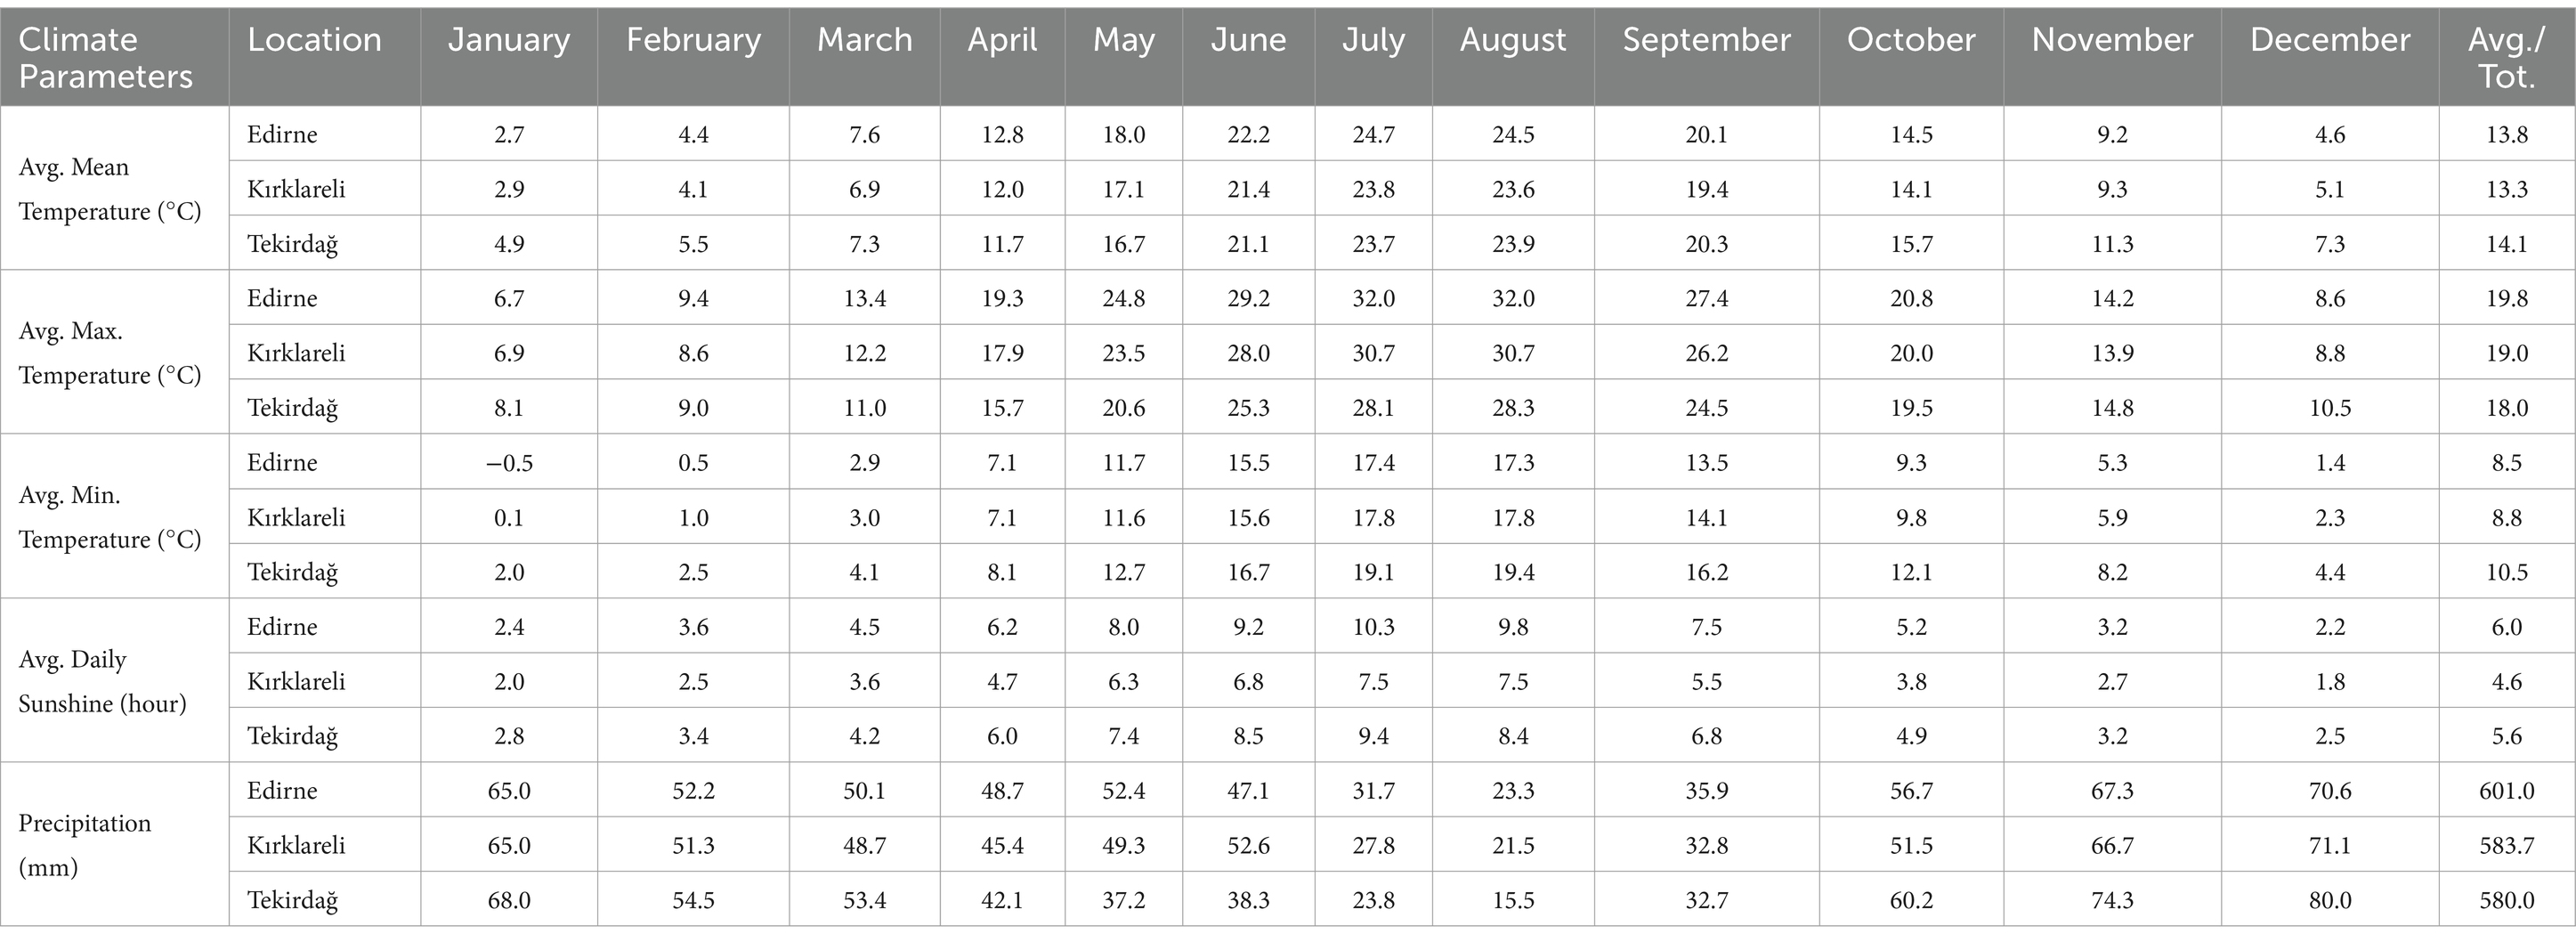
Table 2. Long-term monthly average climate data [Edirne (1930–2023), Kırklareli (1959–2023), Tekirdağ (1940–2023); TSMS, 2024a, 2024b, 2024c].
HadGEM2 (Hadley Center Global Environment Model version 2) is a second-generation Earth system model developed by the Hadley Center, an institute of the UK Meteorological Service. The most comprehensive version of the HadGEM2 series, HadGEM2-ES, was used in this study. The HadGEM2 series includes a combined atmosphere–ocean configuration and an earth-system configuration that includes dynamic vegetation, ocean biology, and atmospheric chemistry (Met Office, 2024). The standard atmospheric component consists of 38 levels extending down to 40 km, creating a 192×145 grid cell with a resolution of 1.25° latitude and 1.875° longitude. At the equator, the surface resolution reaches 208 kmx139 km, while at 55° latitude, it decreases to 120 kmx130 km. The atmospheric component of the model also includes a well-resolved stratosphere. In investigating the effects of stratospheric processes on the global climate model, 60 vertical levels up to 85 km are used (Collins et al., 2008).
The other model used in the research is the Max-Planck-Institute Earth System Model (MPI-ESM). The MPI-ESM is an integrated Earth system model composed of atmosphere, surface, and ocean submodules developed by the Max Planck Institute in Germany [Max-Plank-Institut für Meterologie (MPI), 2024]. In this research, the mixed resolution (MR) version of MPI-ESM, called MPI-ESM-MR, was used. This version, which is one of the preferred models in CMIP5 (Coupled Model Intercomparison Project Phase 5), has a resolution of 1.9° (~210 km) on land and consists of 63 levels horizontally and 95 levels vertically. In addition, MPI-ESM-MR allows for detailed analysis of the troposphere and stratosphere at 95 different levels down to 0.01 hPa (~80 km; Gürkan et al., 2015).
In the 5th Assessment Report (AR5) of the IPCC, a new generation of concentration scenarios, known as Representative Concentration Pathways (RCPs), was identified. These represent the concentration trajectories of four greenhouse gasses developed by the IPCC. In other words, representative concentration trajectories are scenarios created to illustrate the concentration trajectories of emissions that disturb the Earth’s radiation balance. Four types of RCPs are defined according to their radiative forcing levels and trajectories. These scenarios also reflect the concentration trajectories of the four greenhouse gasses developed for the IPCC’s 5th Assessment Report (Moss et al., 2010). They are categorized as RCP2.6 (RCP3-PD), RCP4.5, RCP6.0, and RCP8.5. Among these, RCP4.5 and RCP8.5 are the most preferred scenarios on a global scale (Pachauri et al., 2014). RCP4.5 represents an intermediate stabilization route, where radiative forcing is assumed to reach 4.5 W m−2 by 2100, and equivalent CO2 concentrations are projected to reach around 650 ppm. In contrast, the RCP8.5 scenario assumes radiative forcing will reach 8.5 W m−2 and equivalent CO2 concentrations will be around 1370 ppm by 2,100 (Thomson et al., 2011).
In this study, the projection data from the “Impact of Climate Change on Water Resources Project,” conducted within the borders of the TR 21 Thrace Region, were used. This project was executed by the Republic of Türkiye Ministry of Forestry and Water Affairs General Directorate of Water Management from 2013 to 2016. As part of the project, the regional climate model RegCM 4.3 was run using outputs from three global models selected from the CMIP5 archive (HadGEM2-ES, MPI-ESM-MR, CNRM-CM5.1). In this project, climate models were executed simultaneously for Türkiye as a whole rather than at the basin scale. Given that the resolution of climate and earth system models reaches hundreds of kilometers, introducing uncertainties in these model outputs, dynamic downscaling was conducted with the RegCM 4.3 regional climate model. To simulate the climate at a high resolution of 10 km, initial simulation results were obtained at a resolution of 50 km; these results served as initial and boundary conditions, enabling solutions to be produced at a 10 km resolution. Elevation information for the grids over the designated study area was sourced from the United States Geological Survey (USGS), while land use and vegetation cover were determined using the Global Land Cover Characterization (GLCC) dataset. Topographic elevation data exhibit resolutions of 60, 30, 10, 5, 3, and 2 min, with appropriate topography and land use data allocated based on the designed model resolution. Considering the simulation time necessary for the components of the regional model to achieve equilibrium, the period from 1971 to 2000 was established as the reference period. At the beginning of the modeling study conducted within the scope of the project, climate simulations with a horizontal resolution of 10 km for the reference years of the models were compared with meteorological station observations from the observation network of the General Directorate of Meteorology (MGM). A gap analysis of the meteorological data was conducted for the reference period.
Then, the observation data were transferred to 10 km grids. The PRISM (Parameter-elevation Relationships on Independent Slopes Model) model was used to interpolate the observation data. The model grid distances are fixed, and the “Lambert Conformal” projection type, which yields the best results for mid-latitudes, was used. The model results were validated with meteorological parameters covering the reference period. Spearman rank correlation coefficients and their root mean square errors (RMSE) statistical tests were applied to the daily mean temperature and precipitation observation data interpolated to 10 km grids. Subsequently, the bias of the global model in climate simulations was examined by comparing the reference period simulations of the global model with the simulations obtained using observational data. In the project, the month-based mean value bias correction method was applied to correct the bias of the precipitation parameter. For the temperature parameter, the bias was defined as the difference between the reference period average of the interpolated observations at each grid point for each month and the model reference period. The correction was executed by adding this difference to the model reference period.
Corrections to other meteorological parameters were made according to the monthly mean difference method. As a result, the model results were compared with the interpolated average observations, followed by bias correction on the results. In addition, the model’s bias was determined according to the project’s reference period, and corrections were applied to the bias values derived for all precipitation data modeled for the 2015–2,100 timeframe. Simulations corresponding to the present conditions of the HadGEM2-ES, MPI-ESM-MR, and CNRM-CM5.1 ground system models, which establish the initial and boundary conditions for the RegCM4.3 regional climate model, were generated for the 30-year reference period. Future climate simulations for RCP4.5 and RCP8.5 representative concentration pathways for all of Türkiye, based on each 10-year period, were also produced for the period 2015–2100 (RTMFWAGDWM, 2015).
Table 3 shows the values used in CROPWAT 8.0 for wheat and canola. The crop development period, including initial crop development, mid-season, and late-season stages; crop coefficients for initial, mid-season, and late-season stages; rooting depth for initial and late-season; sowing date; vegetation duration; critical depletion fraction; and yield response factor values should all be input into the model. All parameters for these wheat and canola crops were specifically determined for the provinces of Edirne, Kırklareli, and Tekirdağ (RTMAFGDARP, 2017).
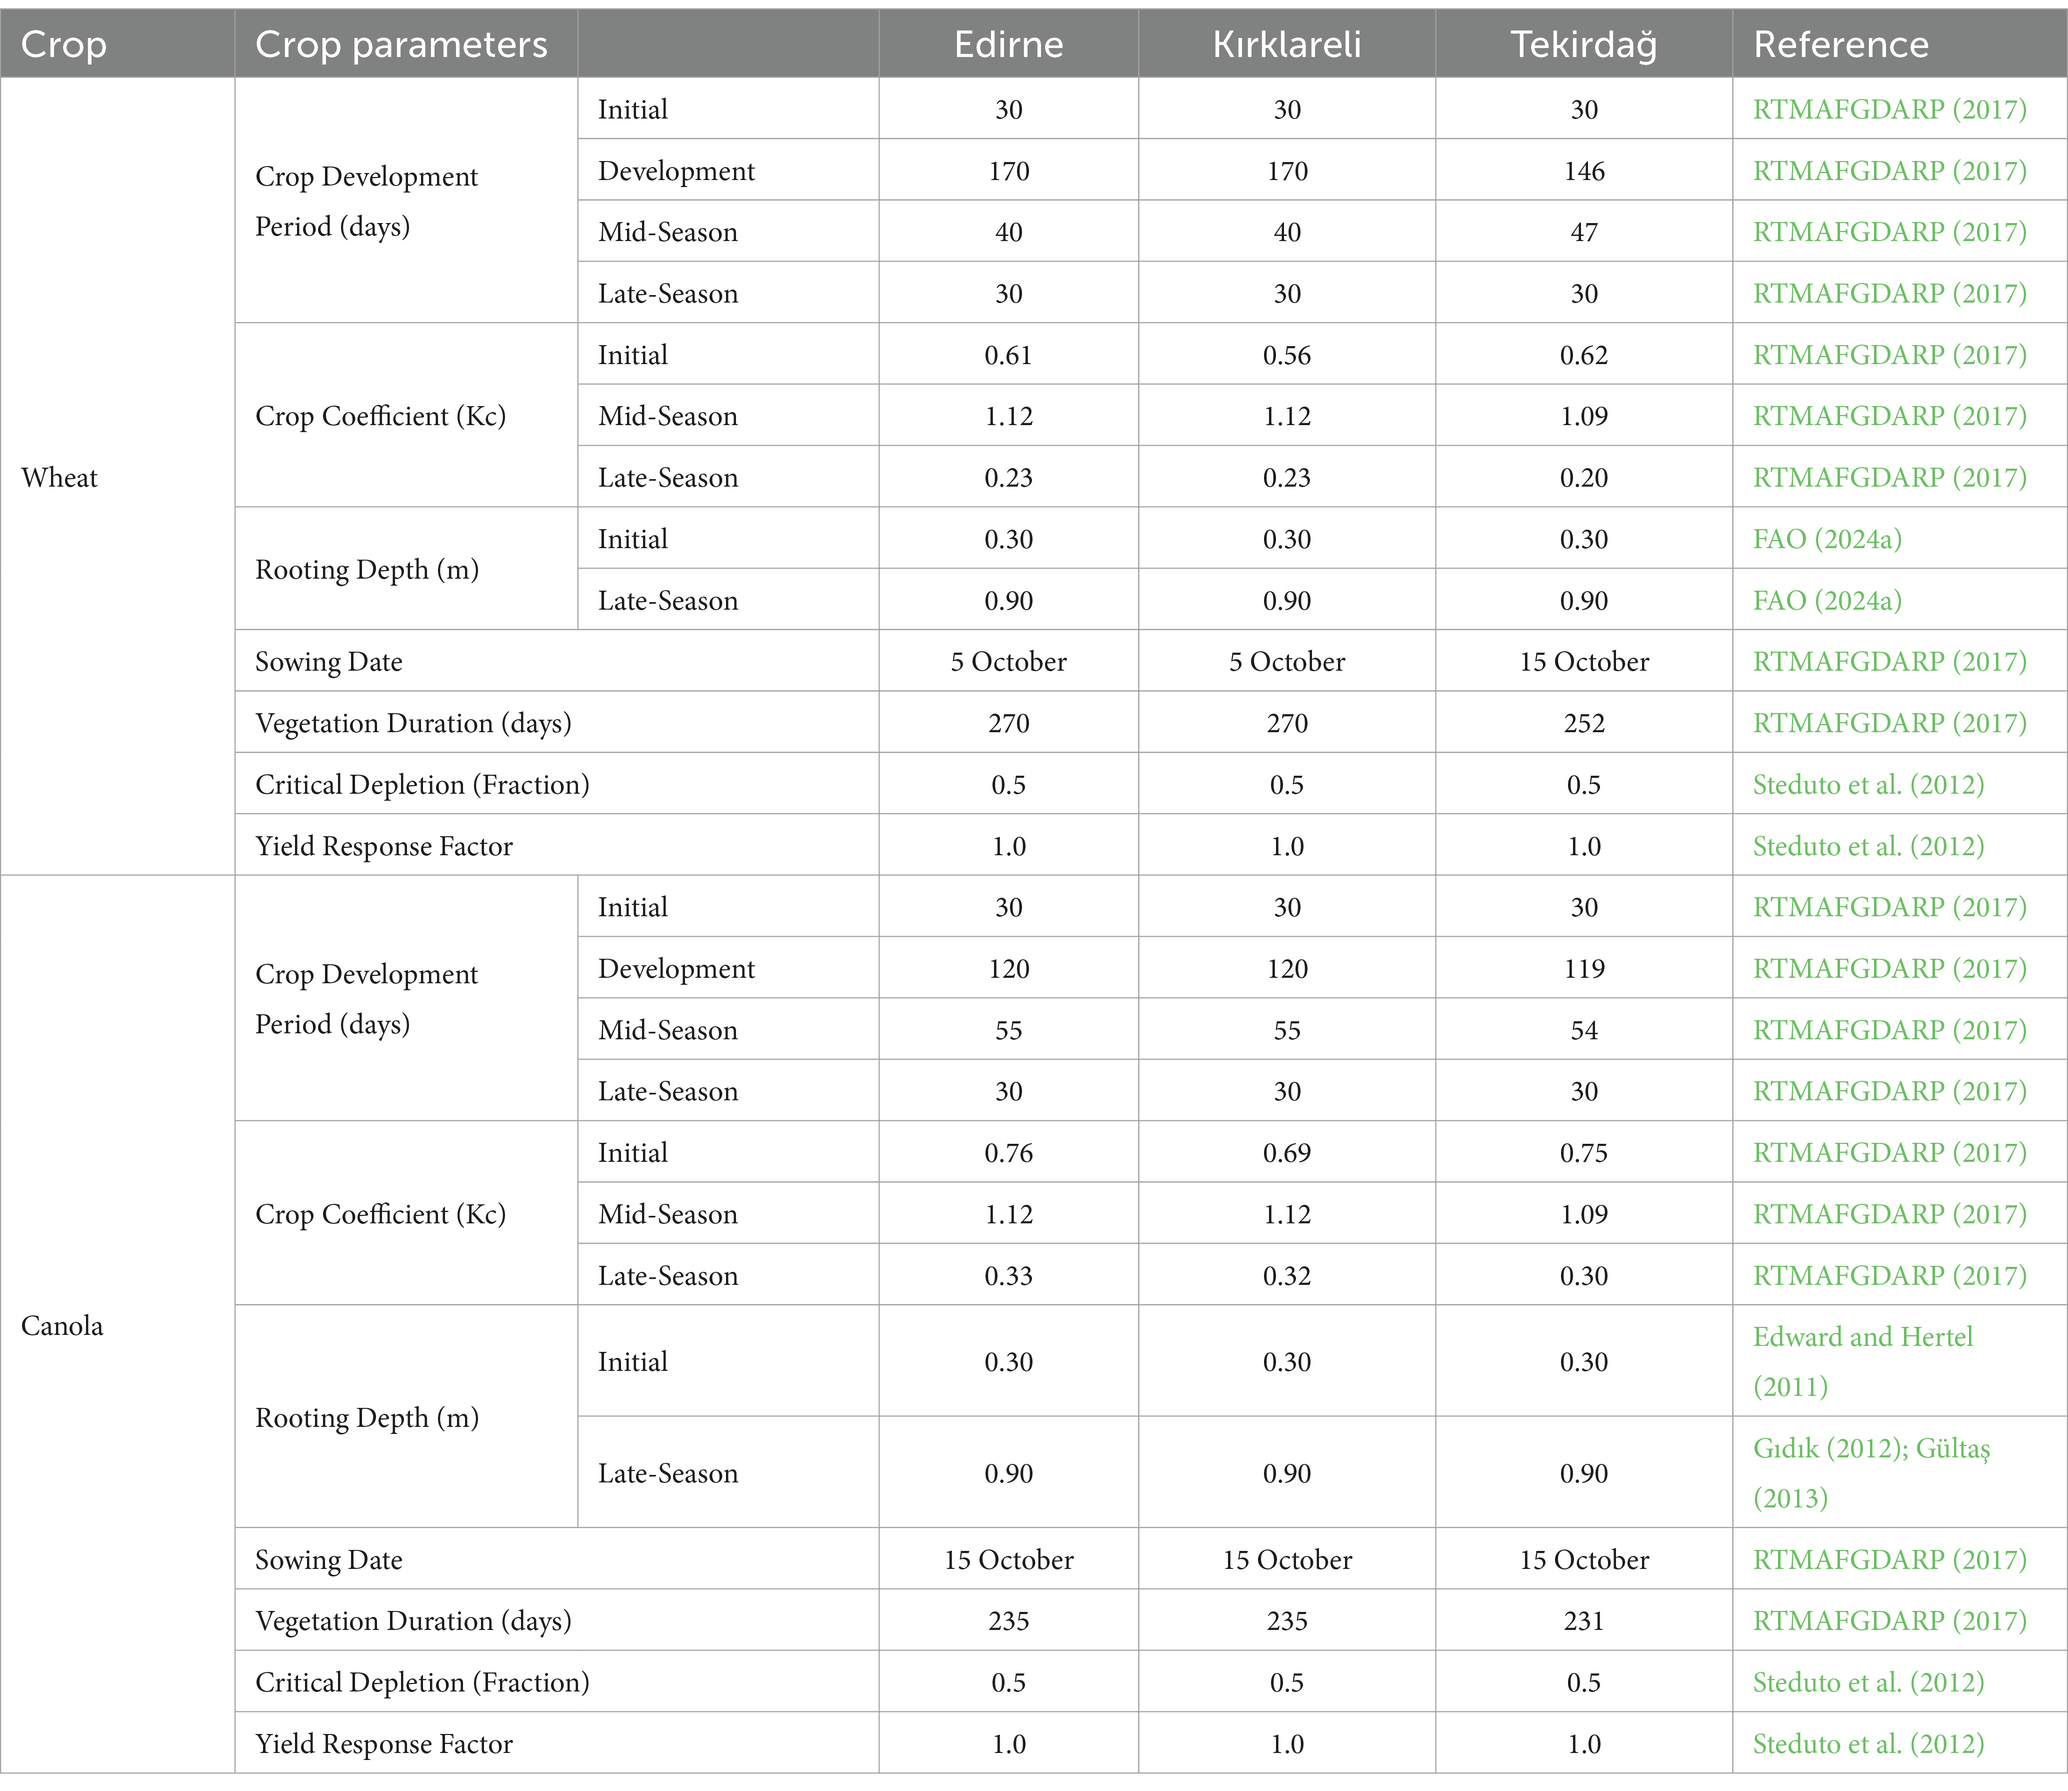
Table 3. Crop characteristics of wheat and canola for Edirne, Kırklareli, and Tekirdağ.
Soil data classified as medium, available in CROPWAT 8.0, were used in the research area. Accordingly, the total available soil moisture was 140 mm m−1, the maximum rain infiltration rate was 40 mm day−1, the maximum rooting depth was 900 cm, and the initial soil moisture depletion was 0%.
CROPWAT 8.0, developed by the FAO (Food and Agriculture Organization of the United Nations), is a computer program that calculates plant water needs and irrigation requirements based on climate, plant, and soil data (FAO, 2024b). It enables the accurate determination of water needs throughout plant growth stages and helps create irrigation schedules.
The method used in the research is detailed in Figure 2. In this research, the CROPWAT 8.0 model was used to calculate ETo, ETc, and IWR. The program uses the FAO Penman-Monteith method to calculate ETo (FAO, 2024b). This method is a standard calculation approach that provides accurate and reliable ETo values taking into account atmospheric conditions. In ETo calculations, meteorological data such as minimum and maximum temperature (°C), relative humidity (%), wind speed (m s−1), and sunshine duration (hours) for the reference period (1971–2000), short period (2031–2040), and long period (2051–2060) are used. ETc is calculated according to the following formula (Equation 1):
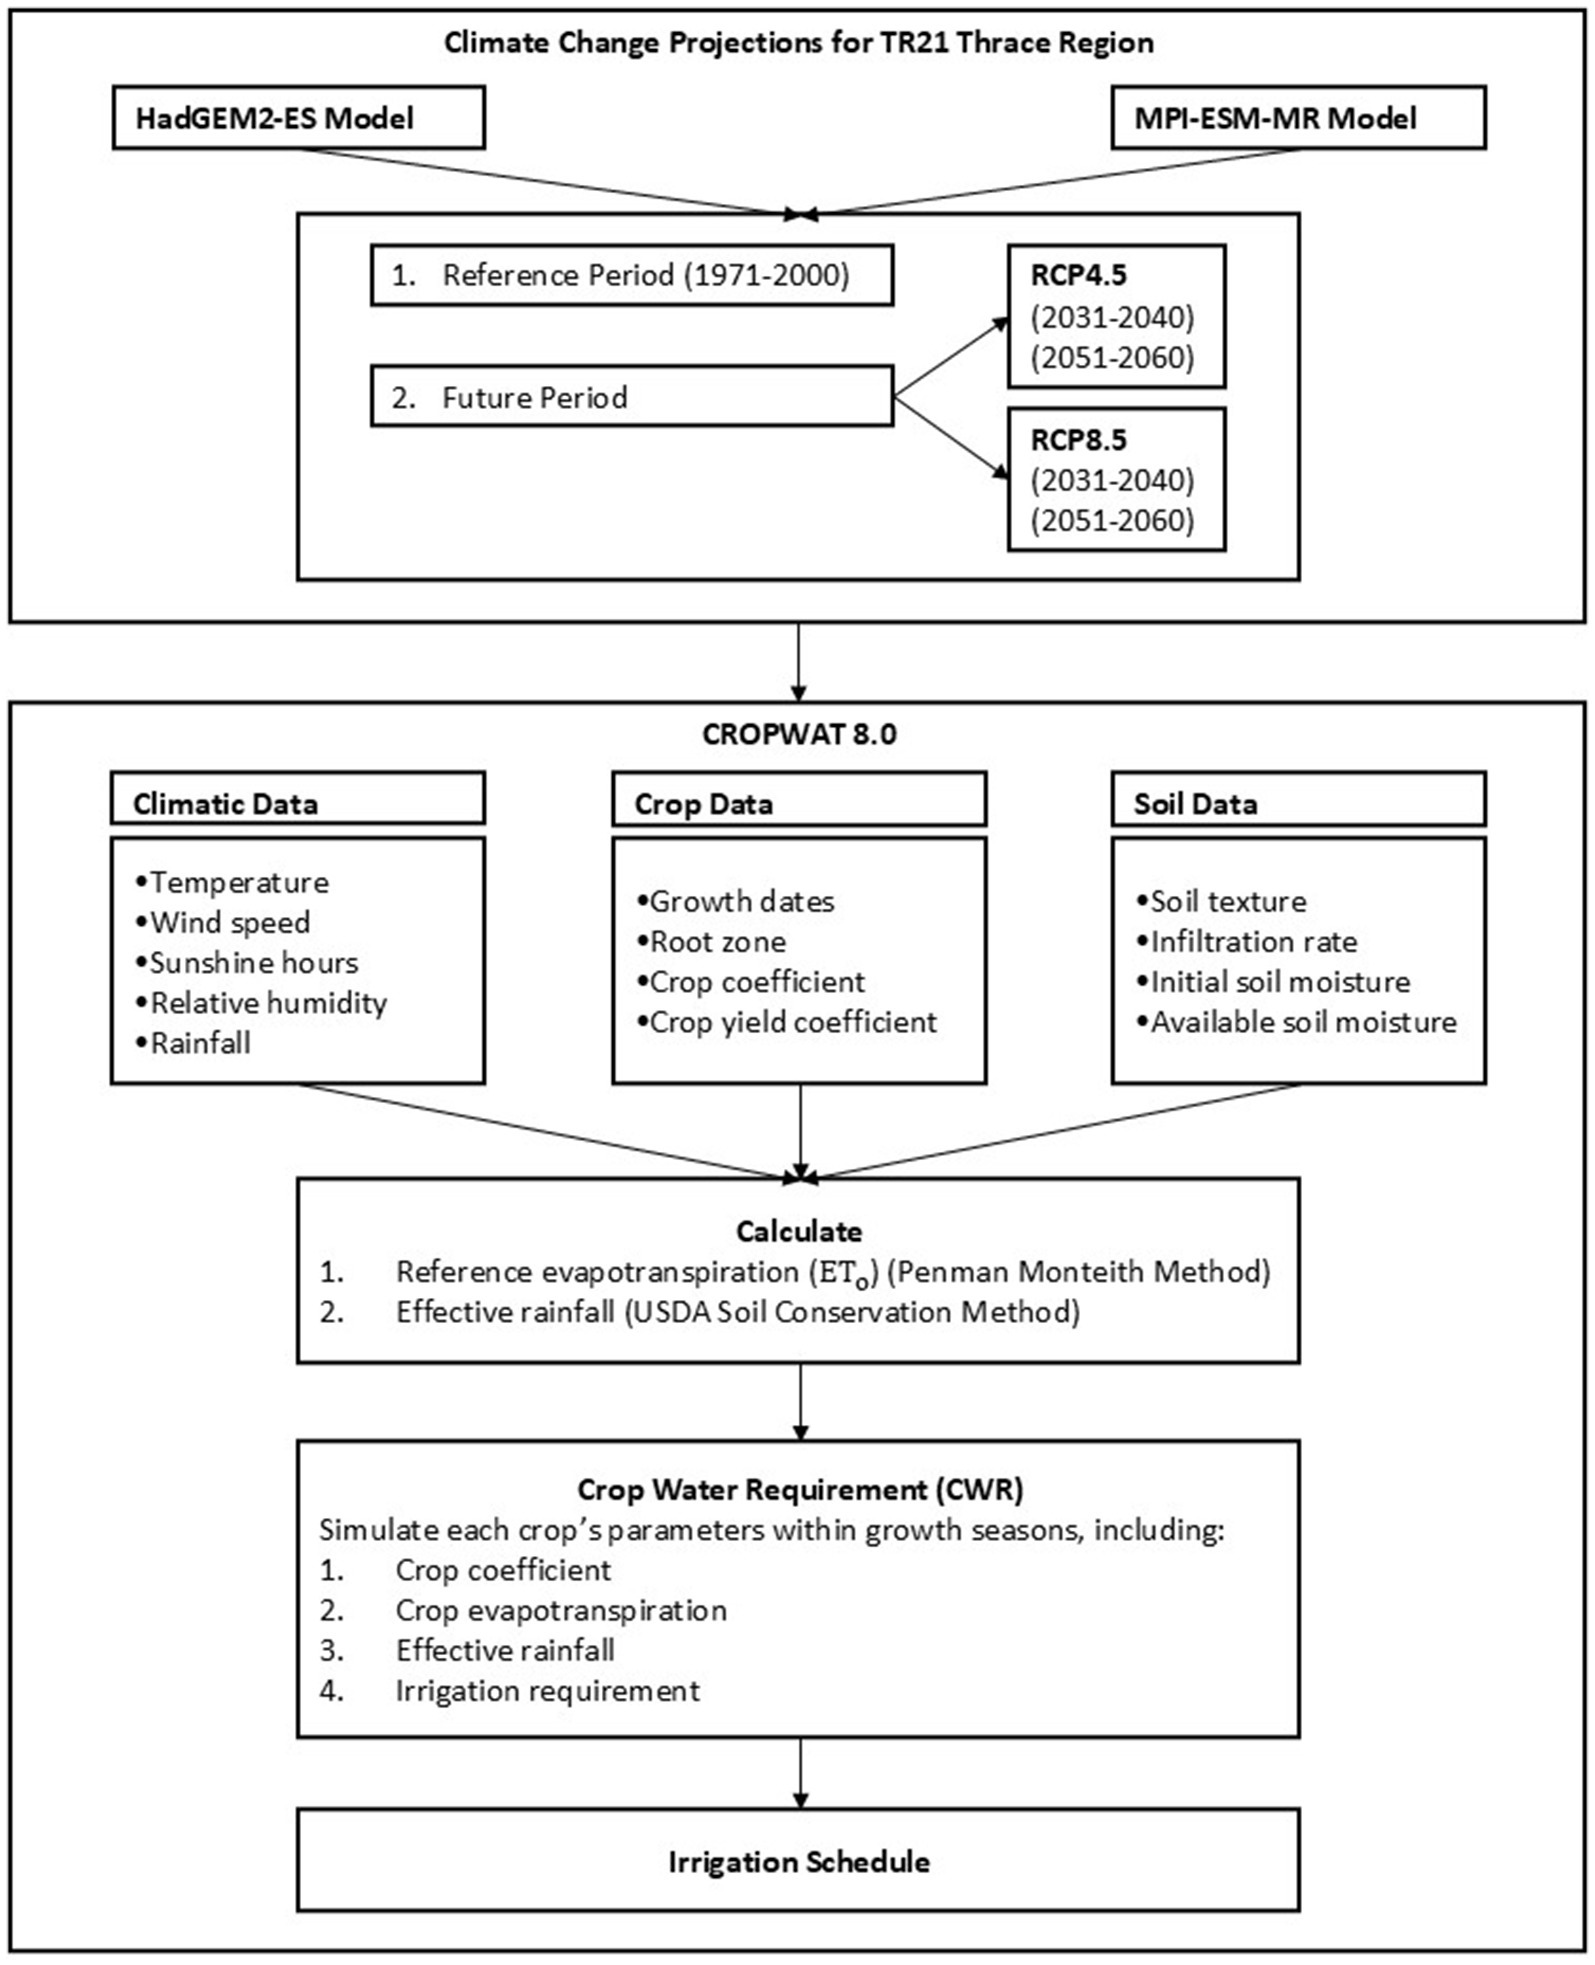
Figure 2. Graphical summary of the methods applied.
ETc: evapotranspiration (mm day−1).
ETo: reference evapotranspiration (mm day−1).
kc: plant coefficient.
Effective rainfall values were calculated using the USDA (United States Department of Agriculture) method and were used to determine the total net irrigation water. The total net irrigation water is calculated using the following formula, Equation 2.
IWR: irrigation water requirement (mm day−1).
ETc: evapotranspiration (mm day−1).
Peff: effective rainfall (mm day−1).
Figure 2 also shows the climate, plant, and soil parameters used as inputs in CROPWAT 8.0 and the model output values for ETo, ETc, and IWR. The climate data used in this study include the reference period (1971–2000) along with future short (2031–2040) and long (2051–2060) period results from the RCP4.5 and RCP8.5 scenarios based on the HadGEM2-ES and MPI-ESM-MR models, produced within the TR21 Thrace Region for the “Impact of Climate Change on Water Resources Project” (ClimateWater, 2016). A study was conducted to validate the future period data obtained for this project within the TR21 Thrace Region.
According to the results of this study, Deveci (2025) found a very high agreement between the average temperatures recorded in the TR21 Thrace Region from 2015 to 2024 and the average temperatures from the HadGEM2-ES and MPI-ESM-MR models under the RCP4.5 and RCP8.5 scenarios [Nash Sutcliffe Model Efficiency Coefficient (0.861–0.920), Root Mean Squared Error (1.980–2.986), R-Square (0.903–0.929), Model Consistency Index (0.965–0.980), Mean Absolute Percentage Error (14.30–35.80%), Mean Absolute Error (1.591–2.497)]. Data for reference and future climate periods were entered into the CROPWAT 8.0 model. Additionally, crop and soil data specific to the region for wheat and canola were included, from which ETo, ETc, and IWR values were obtained. The results were compared and evaluated based on plant categories for both reference and future periods. In addition, an attempt was made to determine the relationship between temperature and ETo, ETc, and IWR.
In this study conducted in TR21 Thrace Region, the growth periods of ETo, ETc and IWR were compared in terms of irrigation requirements of wheat and canola, and the relationship between temperature and ETo, ETc, and IWR was evaluated during the reference period (1971–2000) for wheat and canola.
In this study, CROPWAT 8.0 was used to calculate ETo for wheat and canola in the TR21 Thrace Region during the developmental phase of both crops. Kc values for wheat and canola are shown in Table 3. It is estimated that ETo will increase across both models, scenarios, and periods for wheat and canola in the TR21 Thrace Region compared to the reference period (Table 4; Figures 3, 4). For wheat, the projected increase in ETo ranges from 4.5 to 15.8% in Edirne, 5.3 to 17.1% in Kırklareli, and 5.7 to 15.6% in Tekirdağ (Table 4). For canola, this increase is estimated to be between 5.8 and 16.0% in Edirne, 7.3 and 17.7% in Kırklareli, and 6.9 and 15.7% in Tekirdağ (Table 4). During the growing period for wheat and canola, the highest ETo is estimated in Kırklareli for the period 2051–2060 (wheat: 2.906 mm day−1 and canola: 2.533 mm day−1) under the HadGEM2-ES model RCP8.5 scenario, while the lowest ETo is estimated in Tekirdağ for the period 2031–2040 (wheat: 2.396 mm day−1 and canola: 2.110 mm day−1) due to the MPI-ESM-MR model RCP4.5 scenario (Figures 3, 4). In addition, the most significant changes in wheat and canola compared to the reference period are projected for the period 2051–2060 (wheat: 17.1% and canola: 17.7%) in Kırklareli, resulting from the HadGEM2-ES model RCP8.5 scenario, while the least change is projected for the period 2051–2060 (wheat: 4.5% and canola: 5.8%) in Edirne due to the MPI-ESM-MR model RCP4.5 scenario (Table 4).

Table 4. Changes in ETo values for the HadGEM2-ES and MPI-ESM-MR models during the reference period (1971–2000) and future periods (2031–2040 and 2051–2060) in relation to the wheat and canola vegetation period.
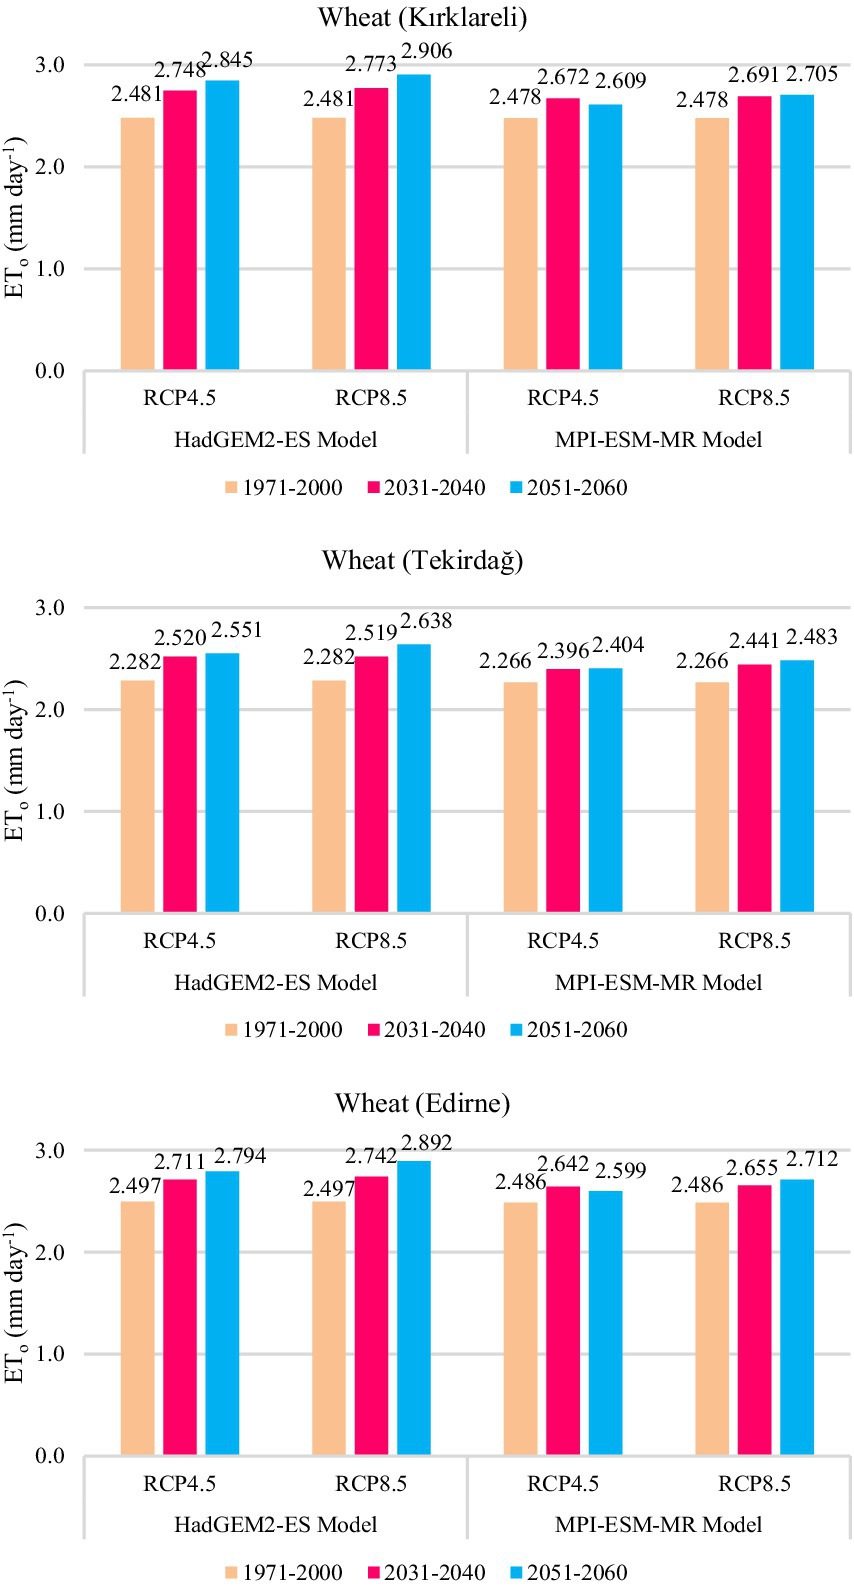
Figure 3. ETo values for the HadGEM2-ES and MPI-ESM-MR models during the reference period (1971–2000) and future periods (2031–2040 and 2051–2060) for wheat in the vegetation period.
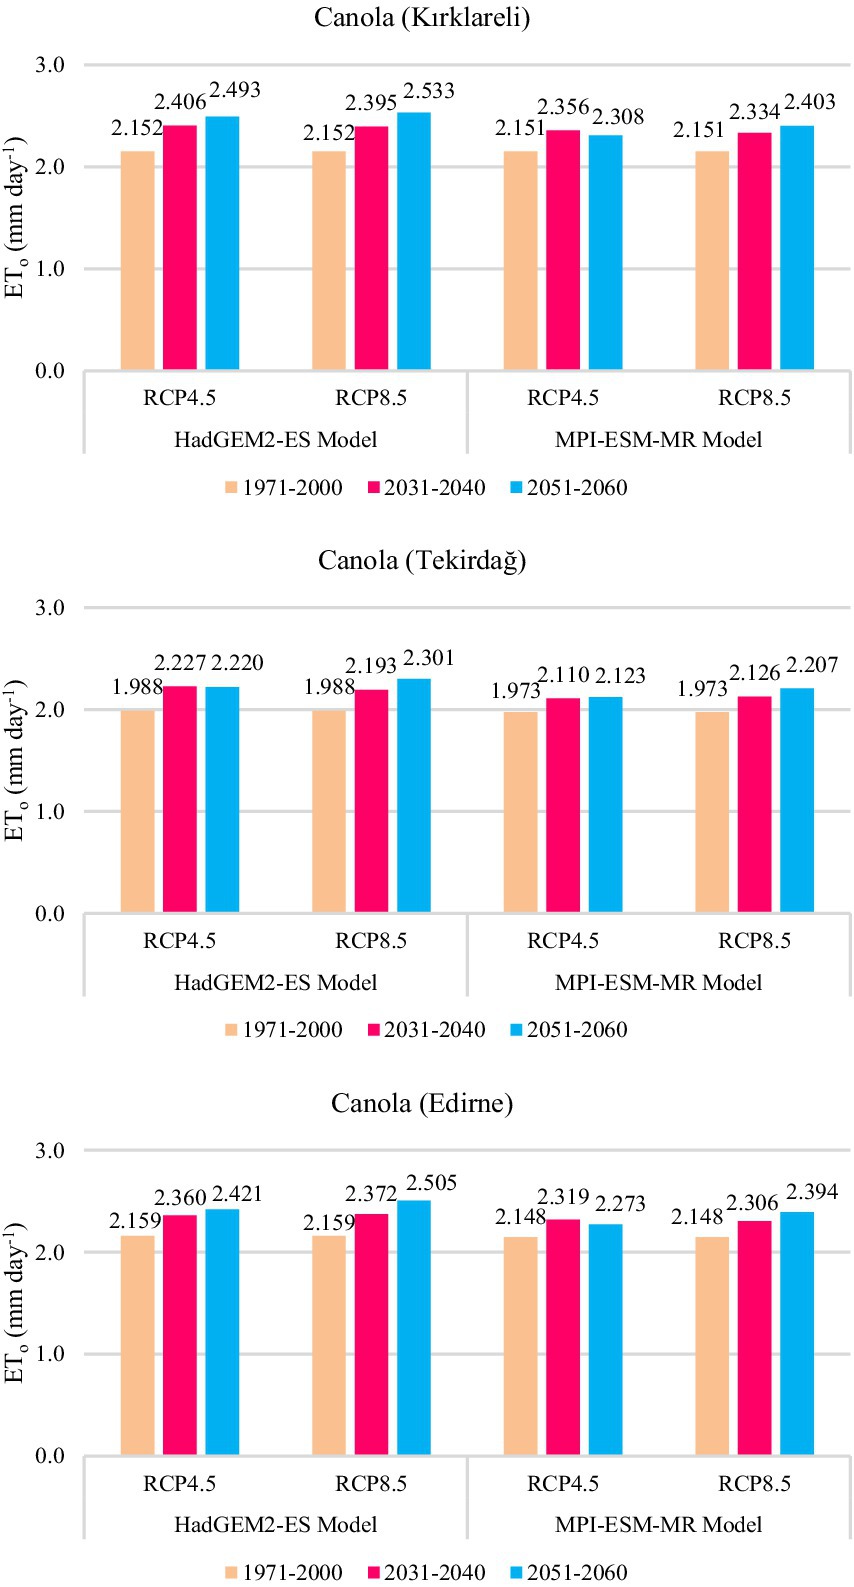
Figure 4. ETo values for canola during the vegetation period based on the HadGEM2-ES and MPI-ESM-MR models for the reference period (1971–2000) and future periods (2031–2040 and 2051–2060).
In this part of the study, ETc calculated for wheat and canola in the TR21 Thrace Region was evaluated using CROPWAT 8.0. ETc in the TR21 Thrace Region is predicted to increase in both models, scenarios, and periods compared to the reference period (Table 5; Figures 5, 6). For wheat, this increase is predicted to be between 5.7 and 15.1% in Edirne, 7.4 and 17.0% in Kırklareli, and 7.4 and 15.6% in Tekirdağ (Table 5). For canola, it is projected to range from 6.3 to 15.2% in Edirne, 6.7 to 17.0% in Kırklareli, and 7.4 to 16.1% in Tekirdağ (Table 5). For both wheat and canola, the highest ETc is predicted for the period 2051–2060 (wheat: 595 mm season−1 and canola: 464 mm season−1) in Edirne, resulting from the HadGEM2-ES model RCP8.5 scenario, the lowest ETc is predicted for the period 2031–2040 (wheat: 438 mm season−1 and canola: 374 mm season−1) in Tekirdağ, based on the MPI-ESM-MR model RCP8.5 scenario (Figures 5, 6). The largest change in both wheat and canola compared to the reference period was projected in Kırklareli under the HadGEM2-ES model RCP8.5 scenario for the period 2051–2060 (wheat: 17.0% and canola: 17.0%), while the smallest change in wheat was projected in Edirne under the MPI-ESM-MR model RCP4.5 scenario for the period 2051–2060 (5.7%; Table 5). The smallest change in canola was projected in Edirne for the period 2031–2040 (6.3%) as a result of the MPI-ESM-MR model RCP8.5 scenario (Table 5).
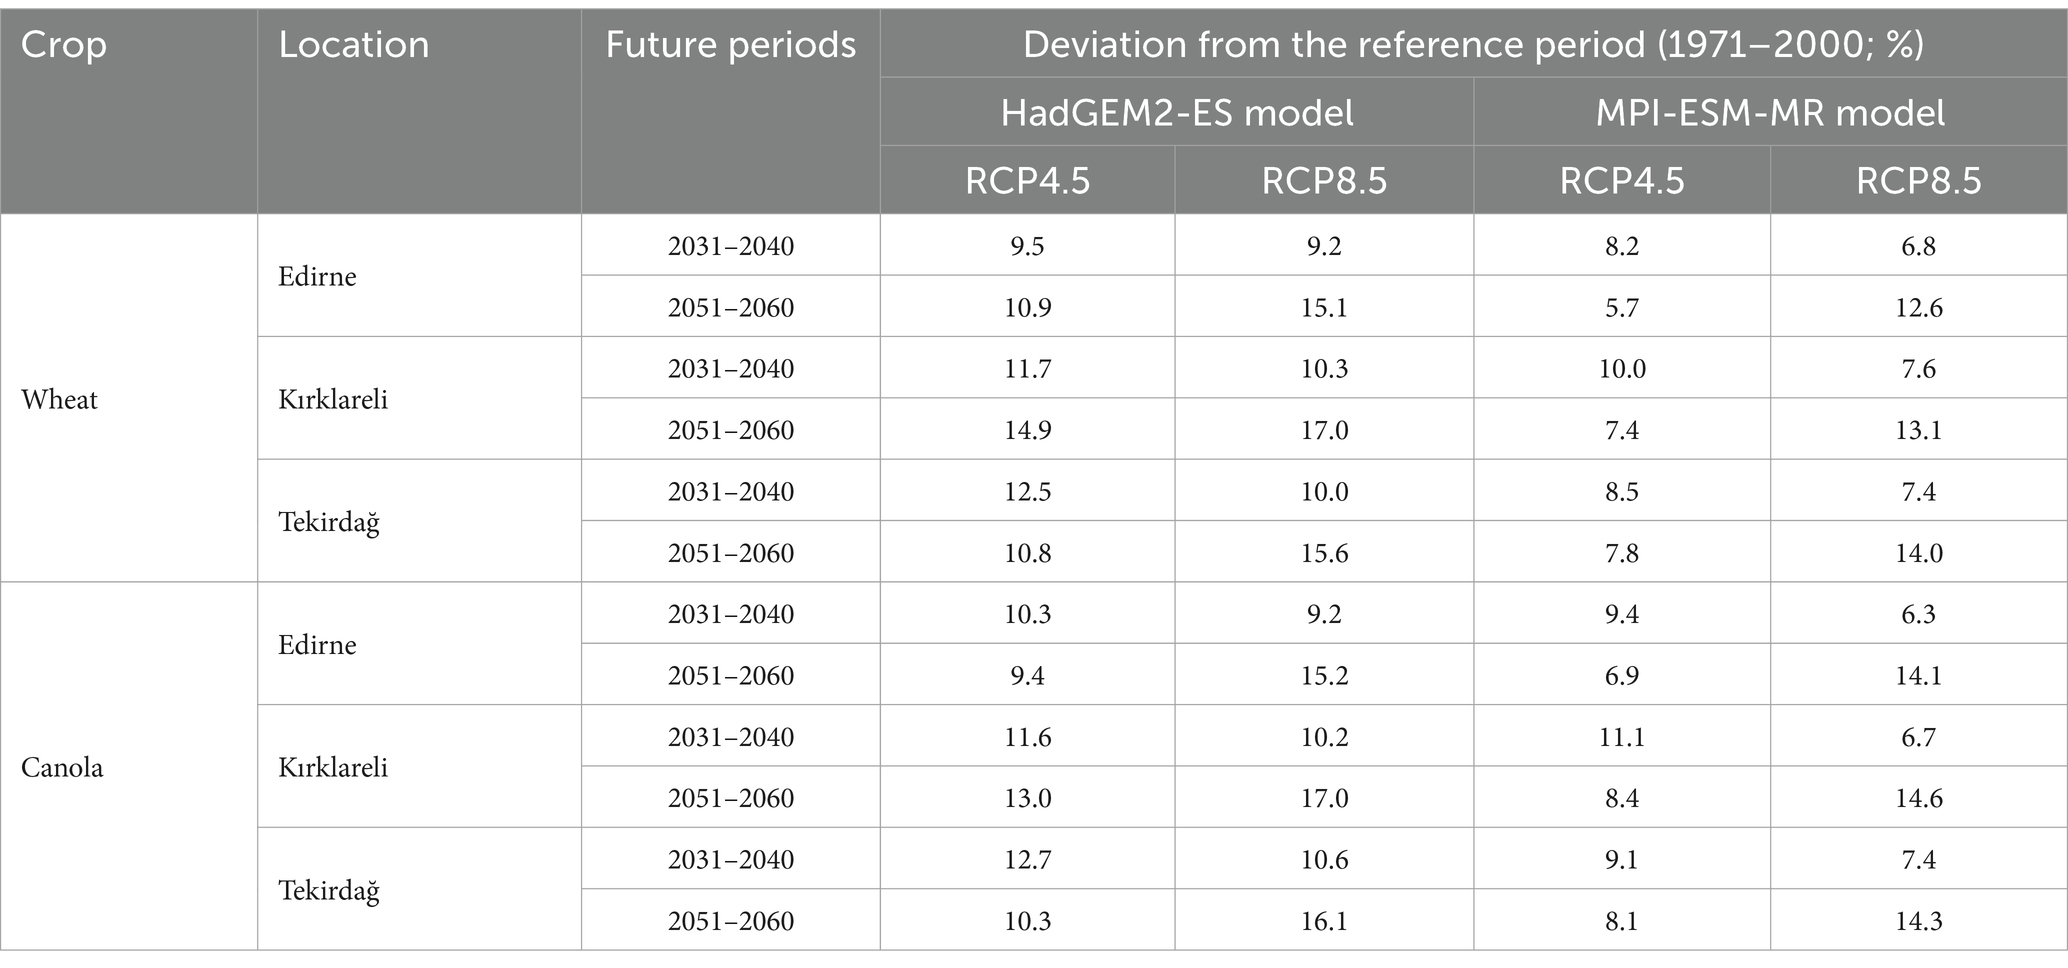
Table 5. Changes in ETc values for the HadGEM2-ES and MPI-ESM-MR models during the reference period (1971–2000) and in the future periods (2031–2040 and 2051–2060) for wheat and canola growing periods.
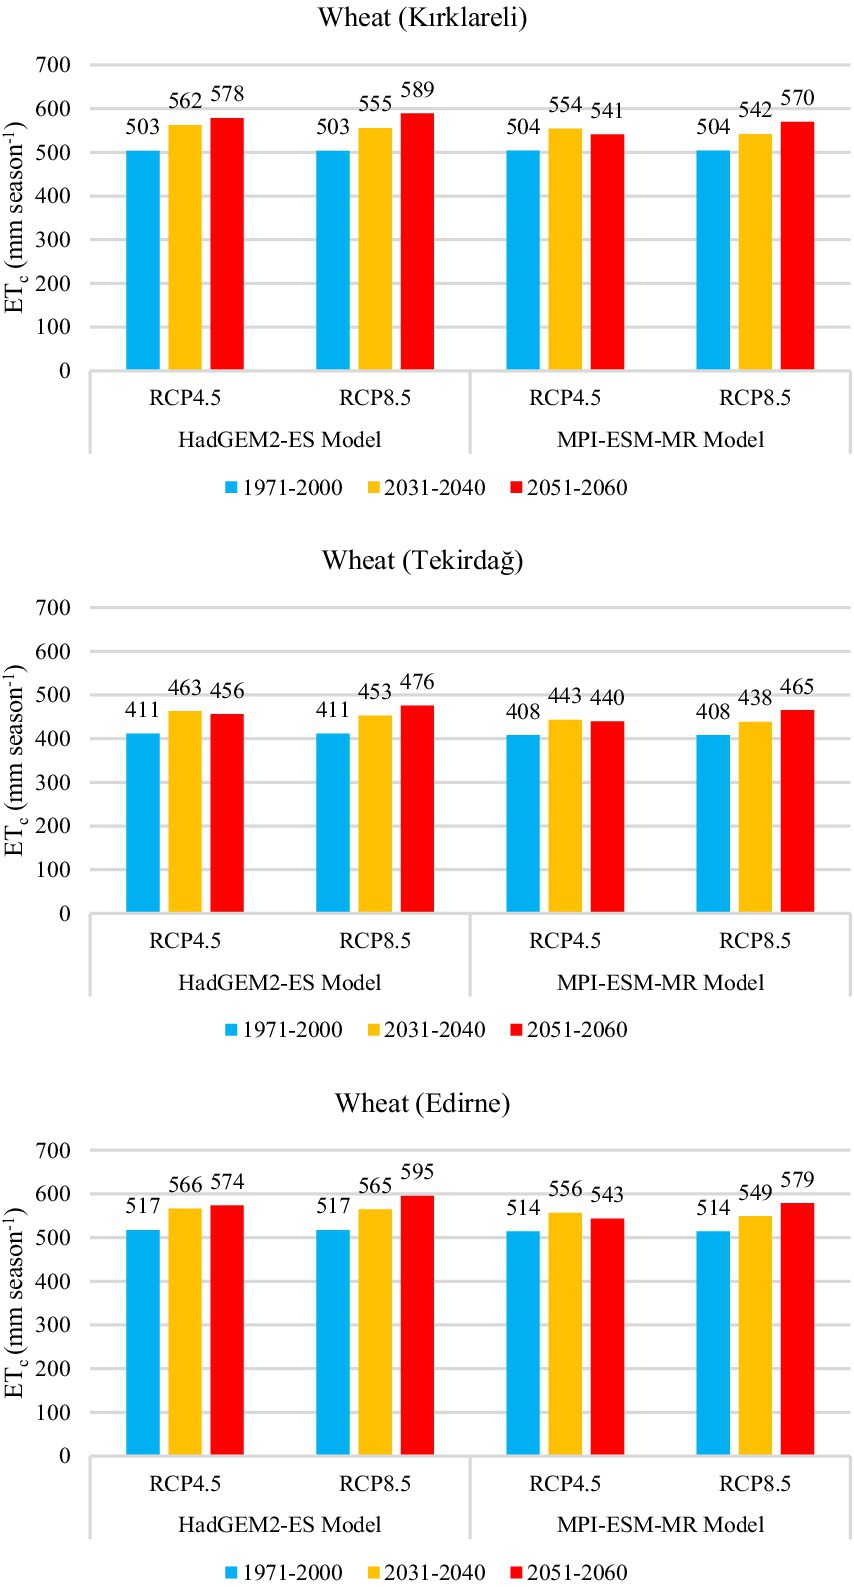
Figure 5. ETc values for wheat from the HadGEM2-ES and MPI-ESM-MR models during the reference period (1971–2000) and future periods (2031–2040 and 2051–2060).
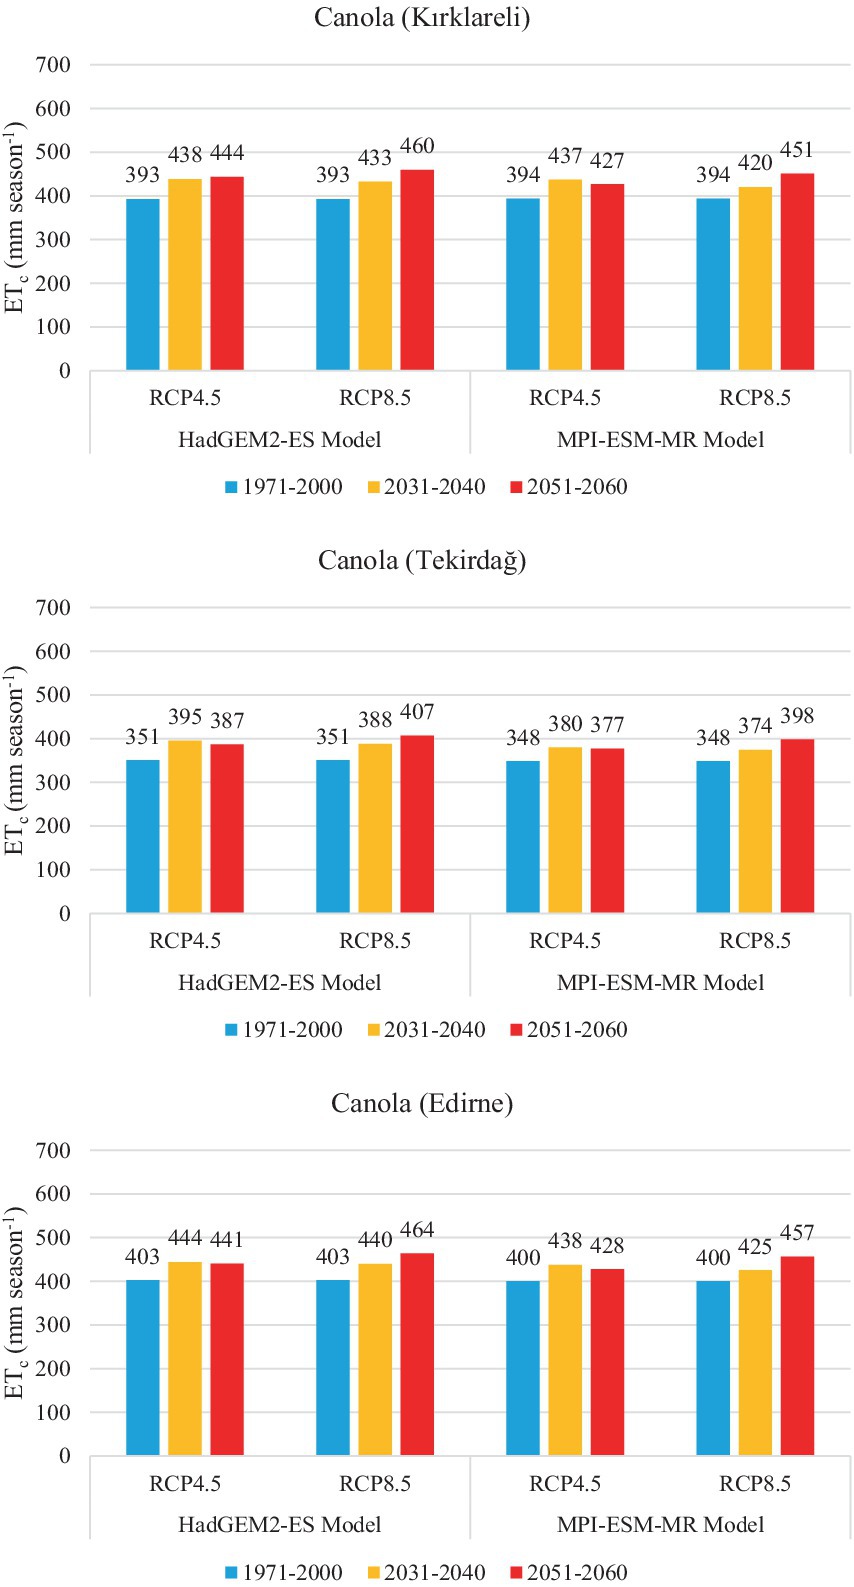
Figure 6. ETc values for canola from the HadGEM2-ES and MPI-ESM-MR models during the reference period (1971–2000) and future periods (2031–2040 and 2051–2060).
At this stage of the research, it was requested to compare ETo, ETc, and IWR values in the same period with the reference period of the model (1971–2000). However, since data on ETo and IWR values could not be found, only ETc values could be compared. For Türkiye as a whole, the General Directorate of Agricultural Research and Policies (GDARP) published a book titled Plant Water Consumption of Irrigated Crops in Türkiye (RTMAFGDARP, 2017). The values in this book represent the accepted reference values derived from compiling previous studies and averaging their conclusions. This book provides information on the plant water consumption of agricultural crops based on climate zones.
In this section, the 1980–2010 climate data published by GDARP for Türkiye is compared with the average ETc values for 1971–2000 calculated using the HadGEM2-ES and MPI-ESM-MR models. In Tekirdağ, the HadGEM2-ES and MPI-ESM-MR models estimated ETc values for wheat to be 4 and 5% lower, respectively, than the GDARP data. For canola, the estimated ETc values from the HadGEM2-ES and MPI-ESM-MR models were 3 and 2% higher, respectively. This indicates that ETc values calculated by modeling can yield lower results for wheat and slightly higher results for canola compared to GDARP data. In Edirne, ETc values estimated by the HadGEM2-ES and MPI-ESM-MR models were significantly higher for both wheat and canola compared to GDARP data. According to the HadGEM2-ES model, the ETc value increased by 16% for wheat and 15% for canola. The MPI-ESM-MR model calculated even higher ETc values, with increases of 16% for wheat and 14% for canola. In Kırklareli, both the HadGEM2-ES and MPI-ESM-MR models showed increases in all ETc values compared to GDARP data, with values 8% higher for wheat and 6% higher for canola. Overall, no significant differences were observed between the HadGEM2-ES and MPI-ESM-MR models. However, the modeling results predicted higher ETc values compared to GDARP data, especially in Edirne. Wheat consistently had higher ETc values than canola across all provinces. In addition to the model configurations, this may be due to the fact that HadGEM2-ES and MPI-ESM-MR are based on the 1971–2000 period, while GDARP is based on the period 1980–2010. Considering climate change processes, it is likely that the climatic conditions of different periods have an impact on plant water consumption.
In this part of the study, the IWR calculated using CROPWAT 8.0 was evaluated. The IWR for both wheat and canola is predicted to decrease only in Tekirdağ under the MPI-ESM-MR model RCP4.5 scenario for the 2051–2060 period, while it is predicted to increase in all other calculations (Table 6). This change in wheat is projected to range from 1.7 to 32.0% in Edirne, 4.7 to 35.8% in Kırklareli, and − 2.4 to 31.6% in Tekirdağ (Table 6). For canola, this change is predicted to vary between 6.0 to 42.5% in Edirne, 7.2 to 48.8% in Kırklareli, and − 2.5 to 40.8% in Tekirdağ (Table 6). The highest IWR for wheat in Edirne occurs during the 2051–2060 period (321.3 mm season−1) due to the HadGEM2-ES model RCP8.5 scenario (Figure 7).
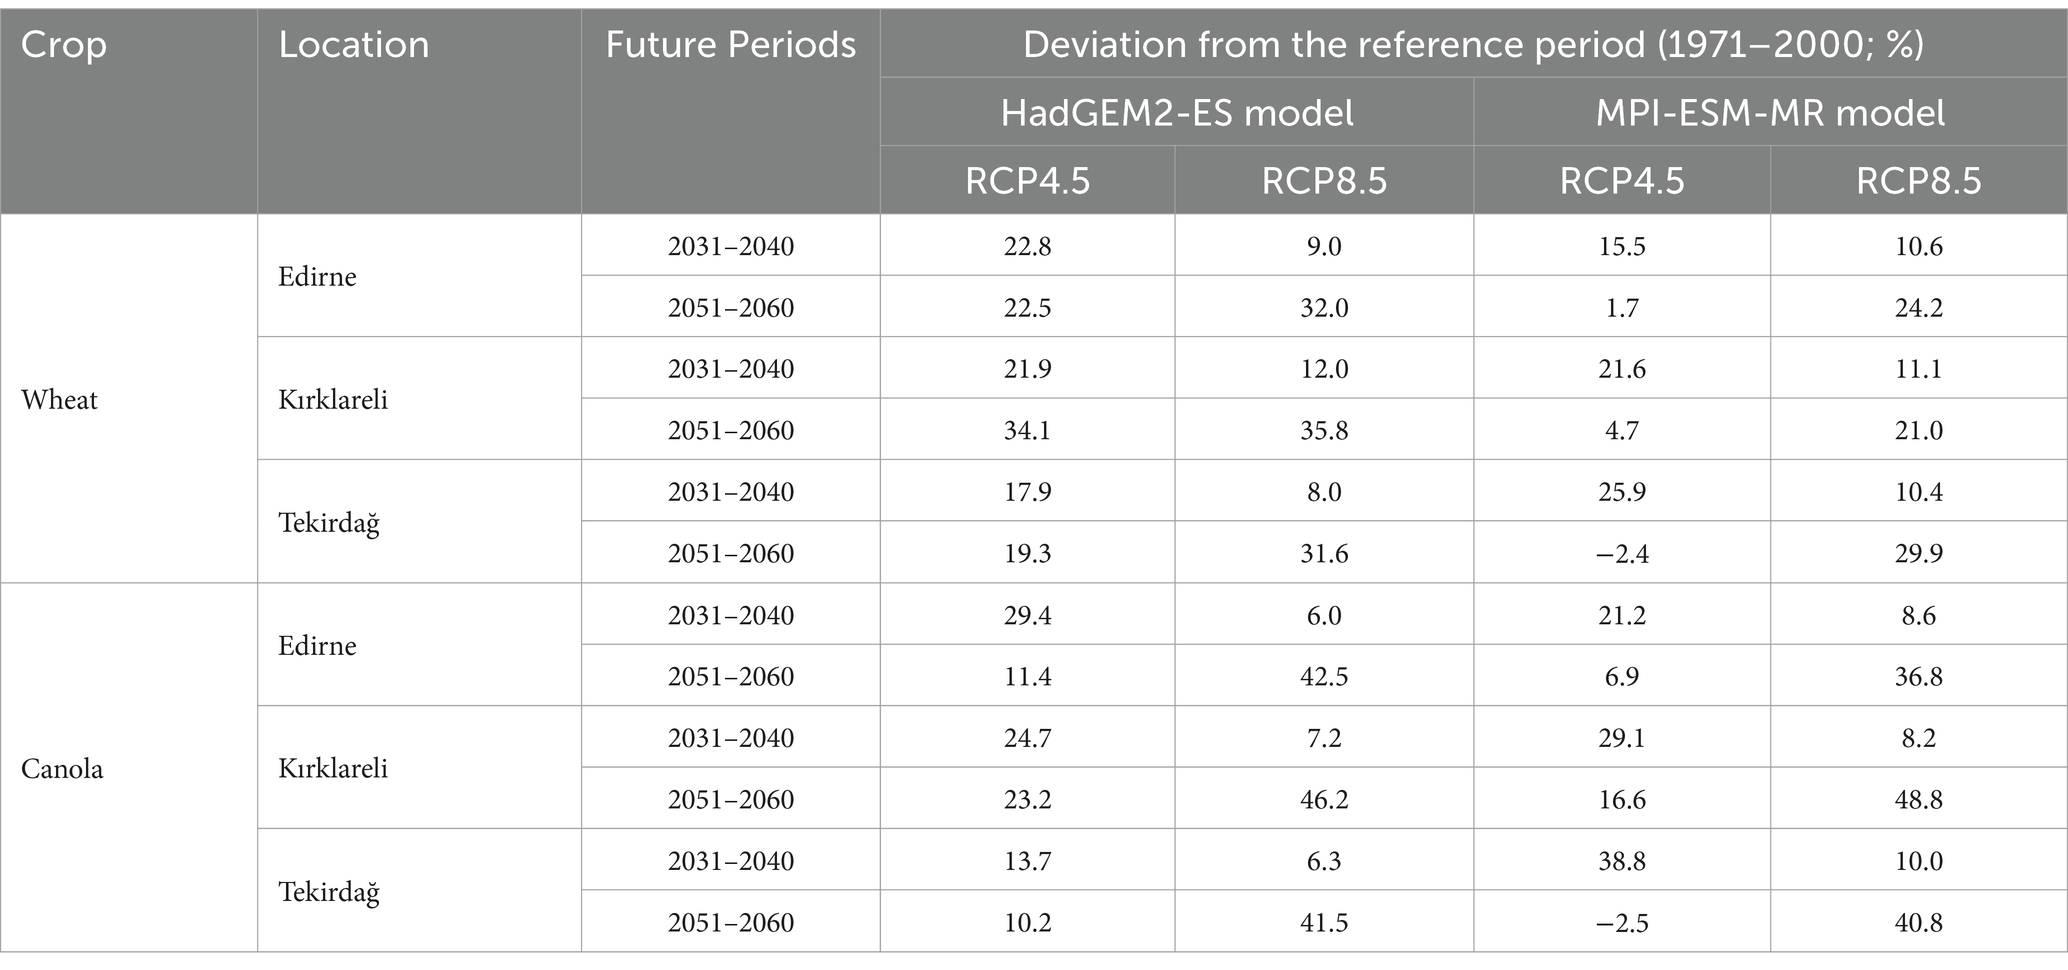
Table 6. Changes in HadGEM2-ES and MPI-ESM-MR model IWR values for the reference period.
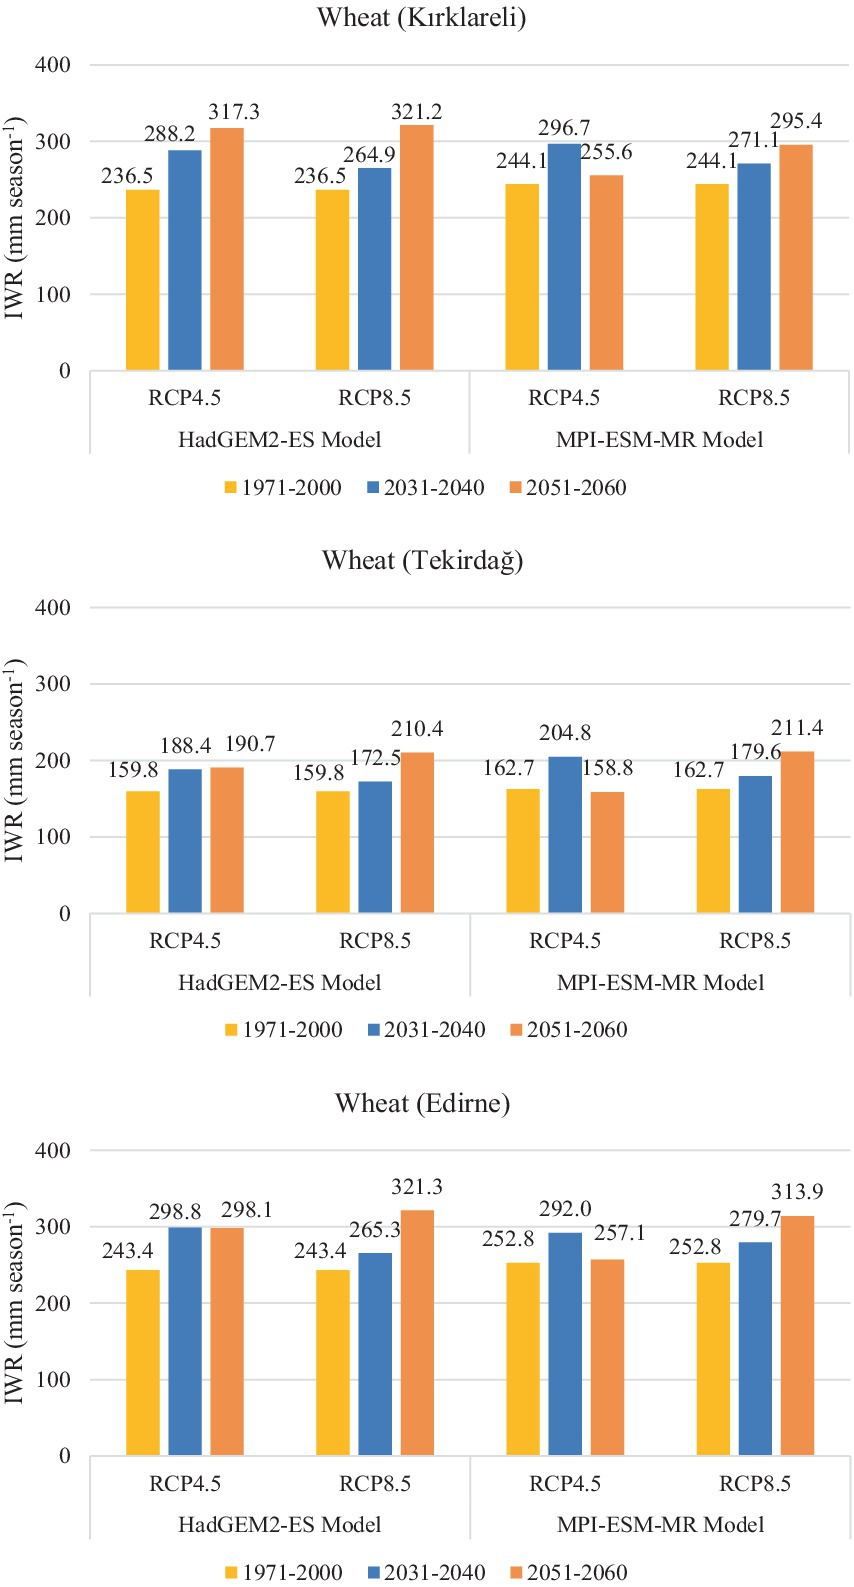
Figure 7. IWR values for the HadGEM2-ES and MPI-ESM-MR models during the reference period (1971–2000) and future periods (2031–2040 and 2051–2060) for wheat.
The highest IWR for canola occurred during the period 2051–2060 (238.6 mm season−1) in Kırklareli, resulting from the MPI-ESM-MR model RCP8.5 scenario (Figure 8). The lowest IWR for wheat and canola also took place during 2051–2060 (158.8 mm season−1 for wheat and 106.5 mm season−1 for canola) due to the HadGEM2-ES model RCP4.5 scenario in Tekirdağ (Figures 7, 8). Additionally, the largest change for wheat compared to the reference period was observed in 2051–2060, showing a change of 35.8% attributed to the HadGEM2-ES model RCP8.5 scenario in Kırklareli (Table 6). The most significant change for canola compared to the reference period also occurred in the 2051–2060 period in Kırklareli, with an increase of 48.8% due to the HadGEM2-ES model RCP8.5 scenario (Table 6). The smallest changes for both wheat and canola compared to the reference period are projected for 2051–2060, with decreases of −2.4% and − 2.5% in Tekirdağ, resulting from the MPI-ESM-MR model RCP4.5 scenario, respectively (Table 6).
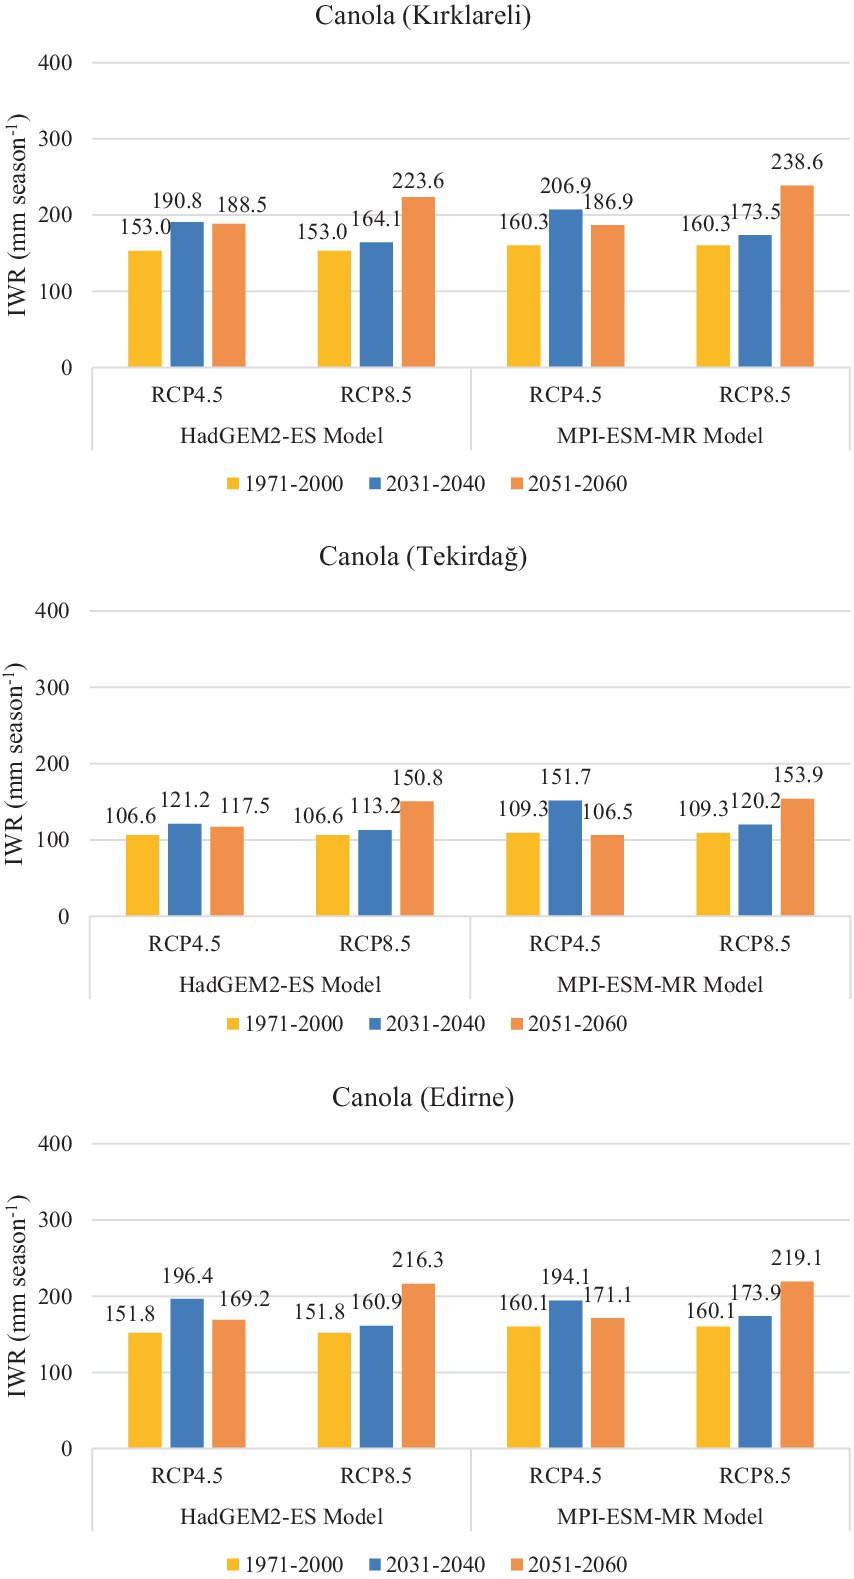
Figure 8. IWR values for canola from the HadGEM2-ES and MPI-ESM-MR models during the reference period (1971–2000) and the future periods (2031–2040 and 2051–2060).
The results are summarized in Table 7. Accordingly, ETo is predicted to range from 2.396 to 2.906 mm day−1 (4.5–17.1%) for wheat and from 2.110 to 2.533 mm day−1 (5.8–17.7%) for canola in the TR21 Thrace Region. ETc for wheat was projected to vary between 595 and 438 mm season−1 (5.7–17.0%), while ETc for canola was projected to range from 374 to 464 mm season−1 (6.3–17.0%). IWR for wheat was predicted to range from 158.8 to 321.3 mm season−1 (−2.4–35.8%), and for canola, IWR was predicted to vary between 106.5 and 238.6 mm season−1 (−2.5–48.8%).
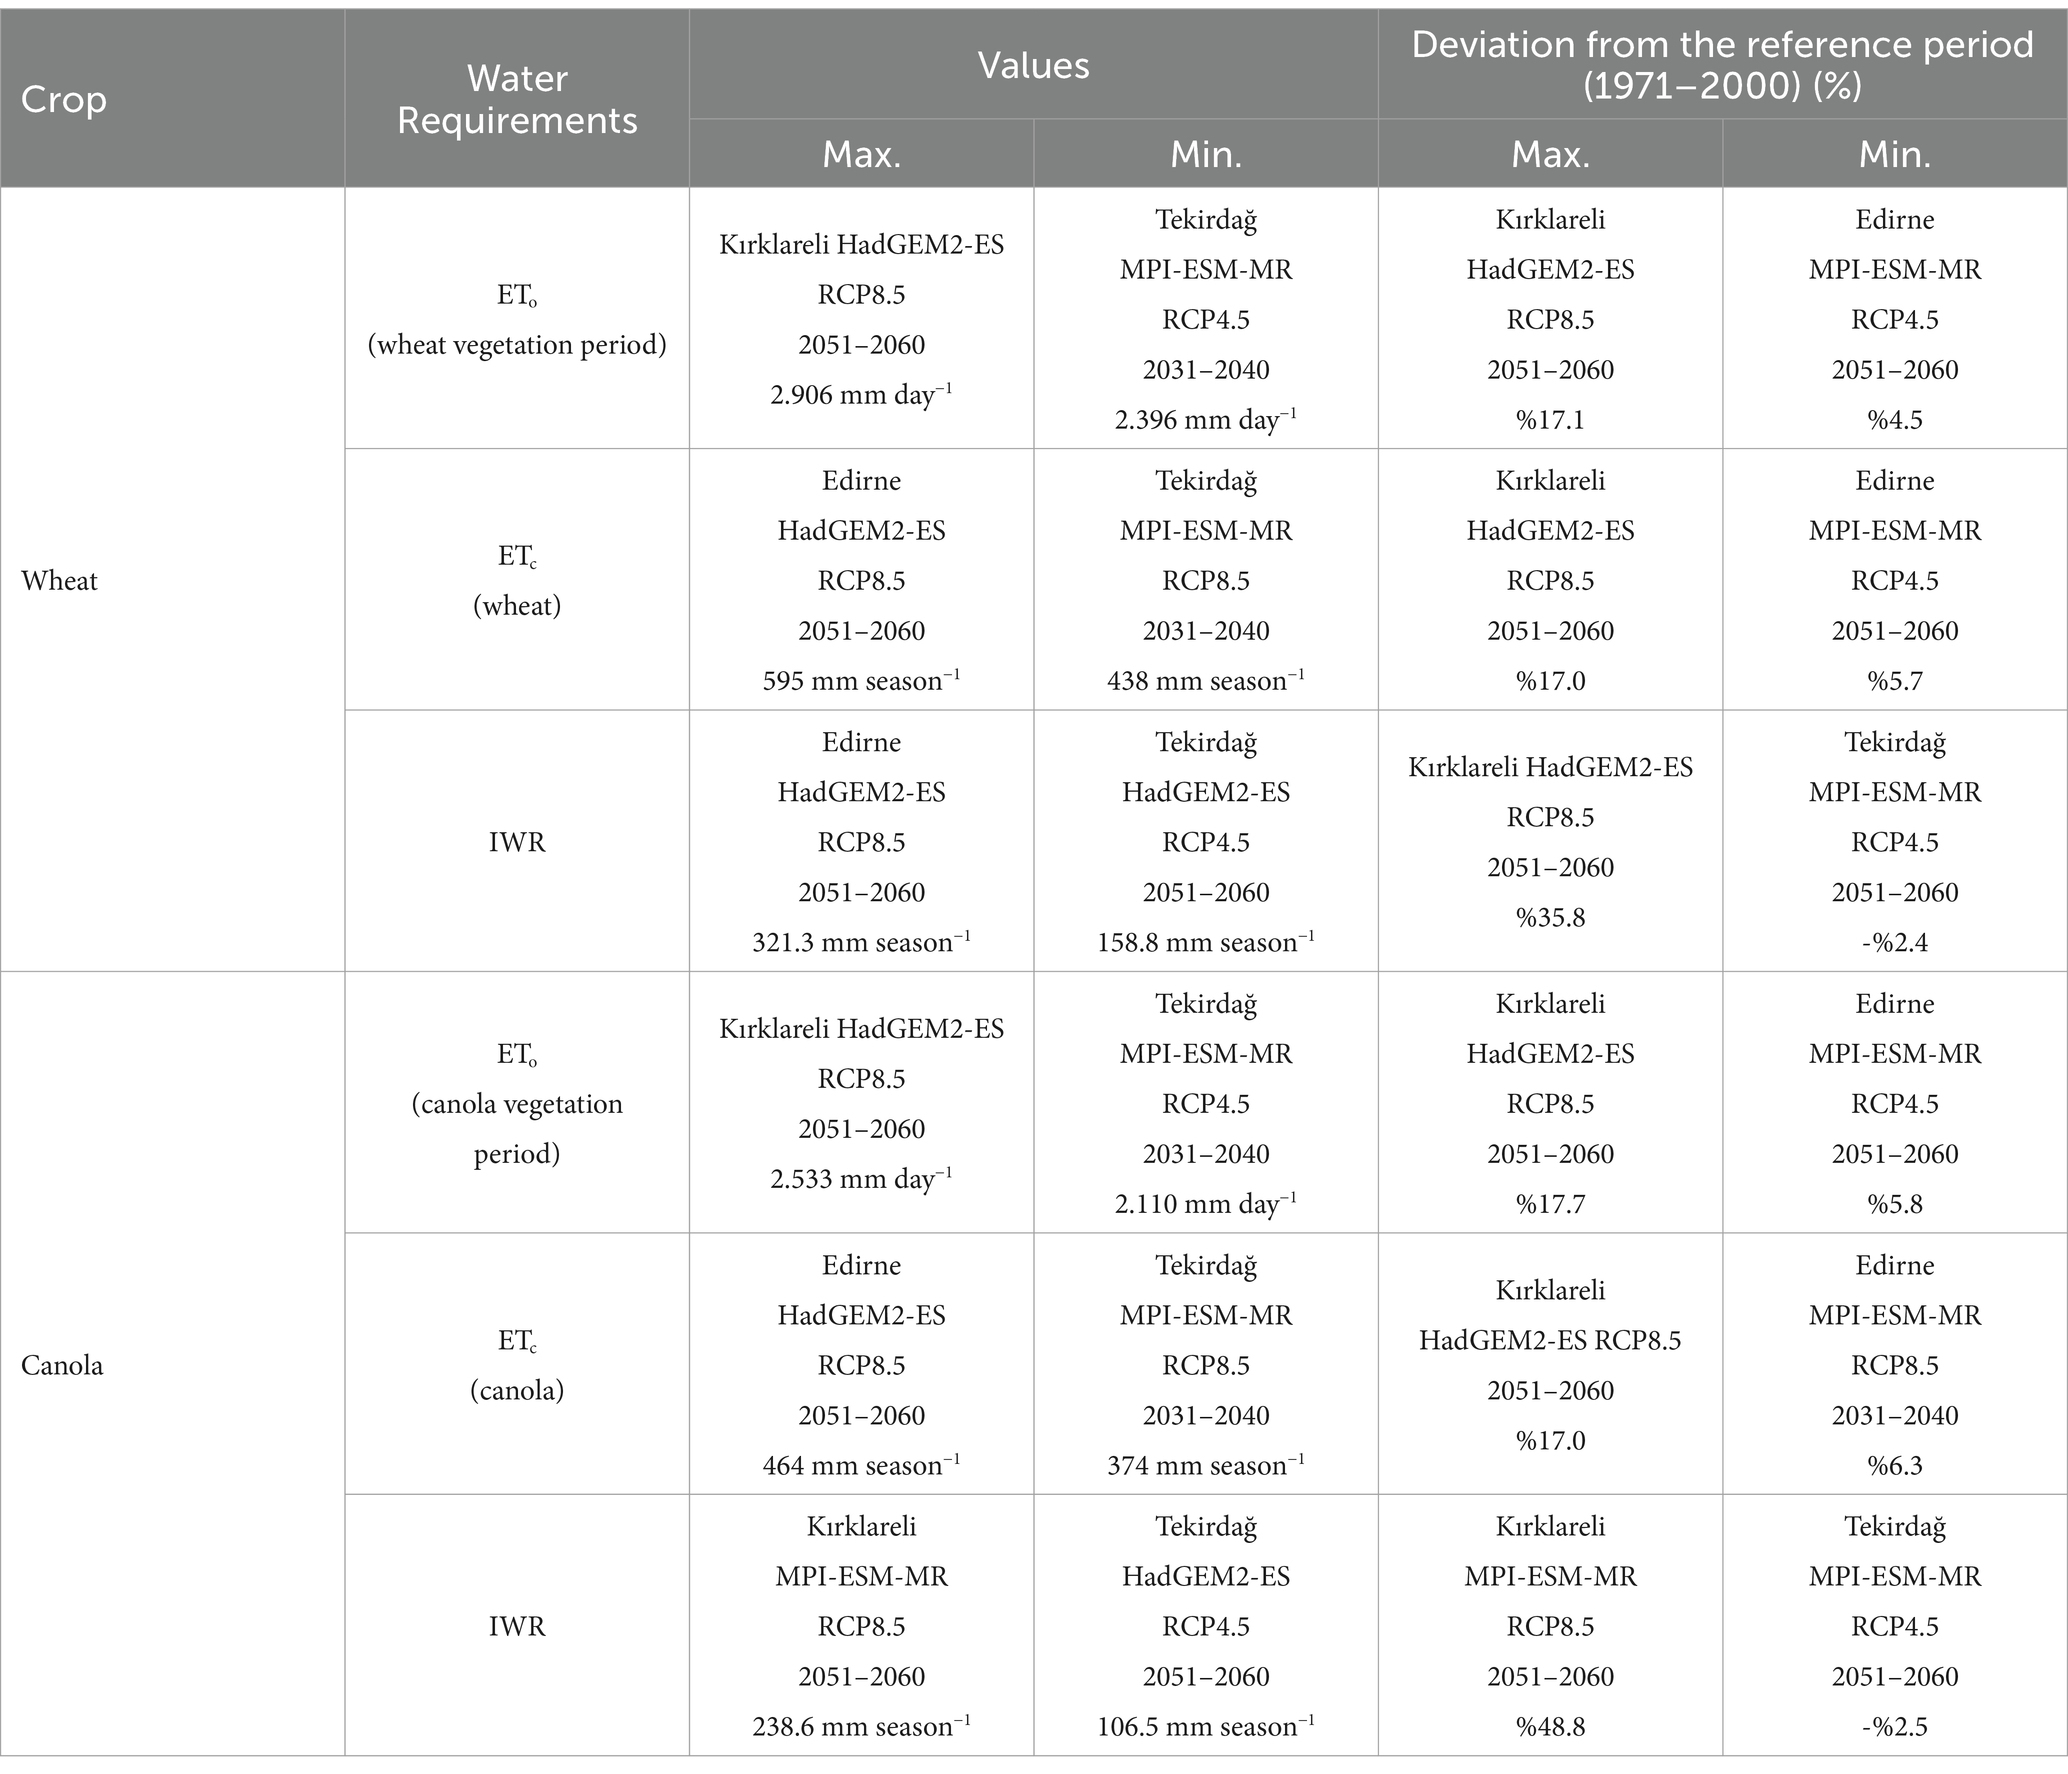
Table 7. General evaluation of ETo (wheat and canola during the growing period), ETc (wheat and canola), and IWR.
In the TR21 Thrace Region, climate change is predicted to negatively affect the ETo and water consumption of wheat and canola during their growing periods, leading to an increase compared to the reference period. Irrigation water demand is projected to increase in all periods except for one in both models. Overall, the general trend indicates an increase.
ETo, ETc, and IWR values for reference (1971–2000) and future short (2031–2040) and long (2051–2060) periods are compared for wheat and canola in the TR 21 Thrace Region (Table 8). ETo values range from 12 to 14% in Edirne, 11 to 14% in Kırklareli, and 11 to 13% in Tekirdağ. ETc values vary from 21 to 23% in Edirne and Kırklareli and 14 to 15% in Tekirdağ. IWR values range from 30 to 43% in Edirne, 19 to 41% in Kırklareli, and 26 to 38% in Tekirdağ. When comparing the results obtained from wheat and canola, it is predicted that ETo will be 11 to 14%, ETc will be 14 to 23%, and IWR will be 19 to 43% higher in wheat than in canola.
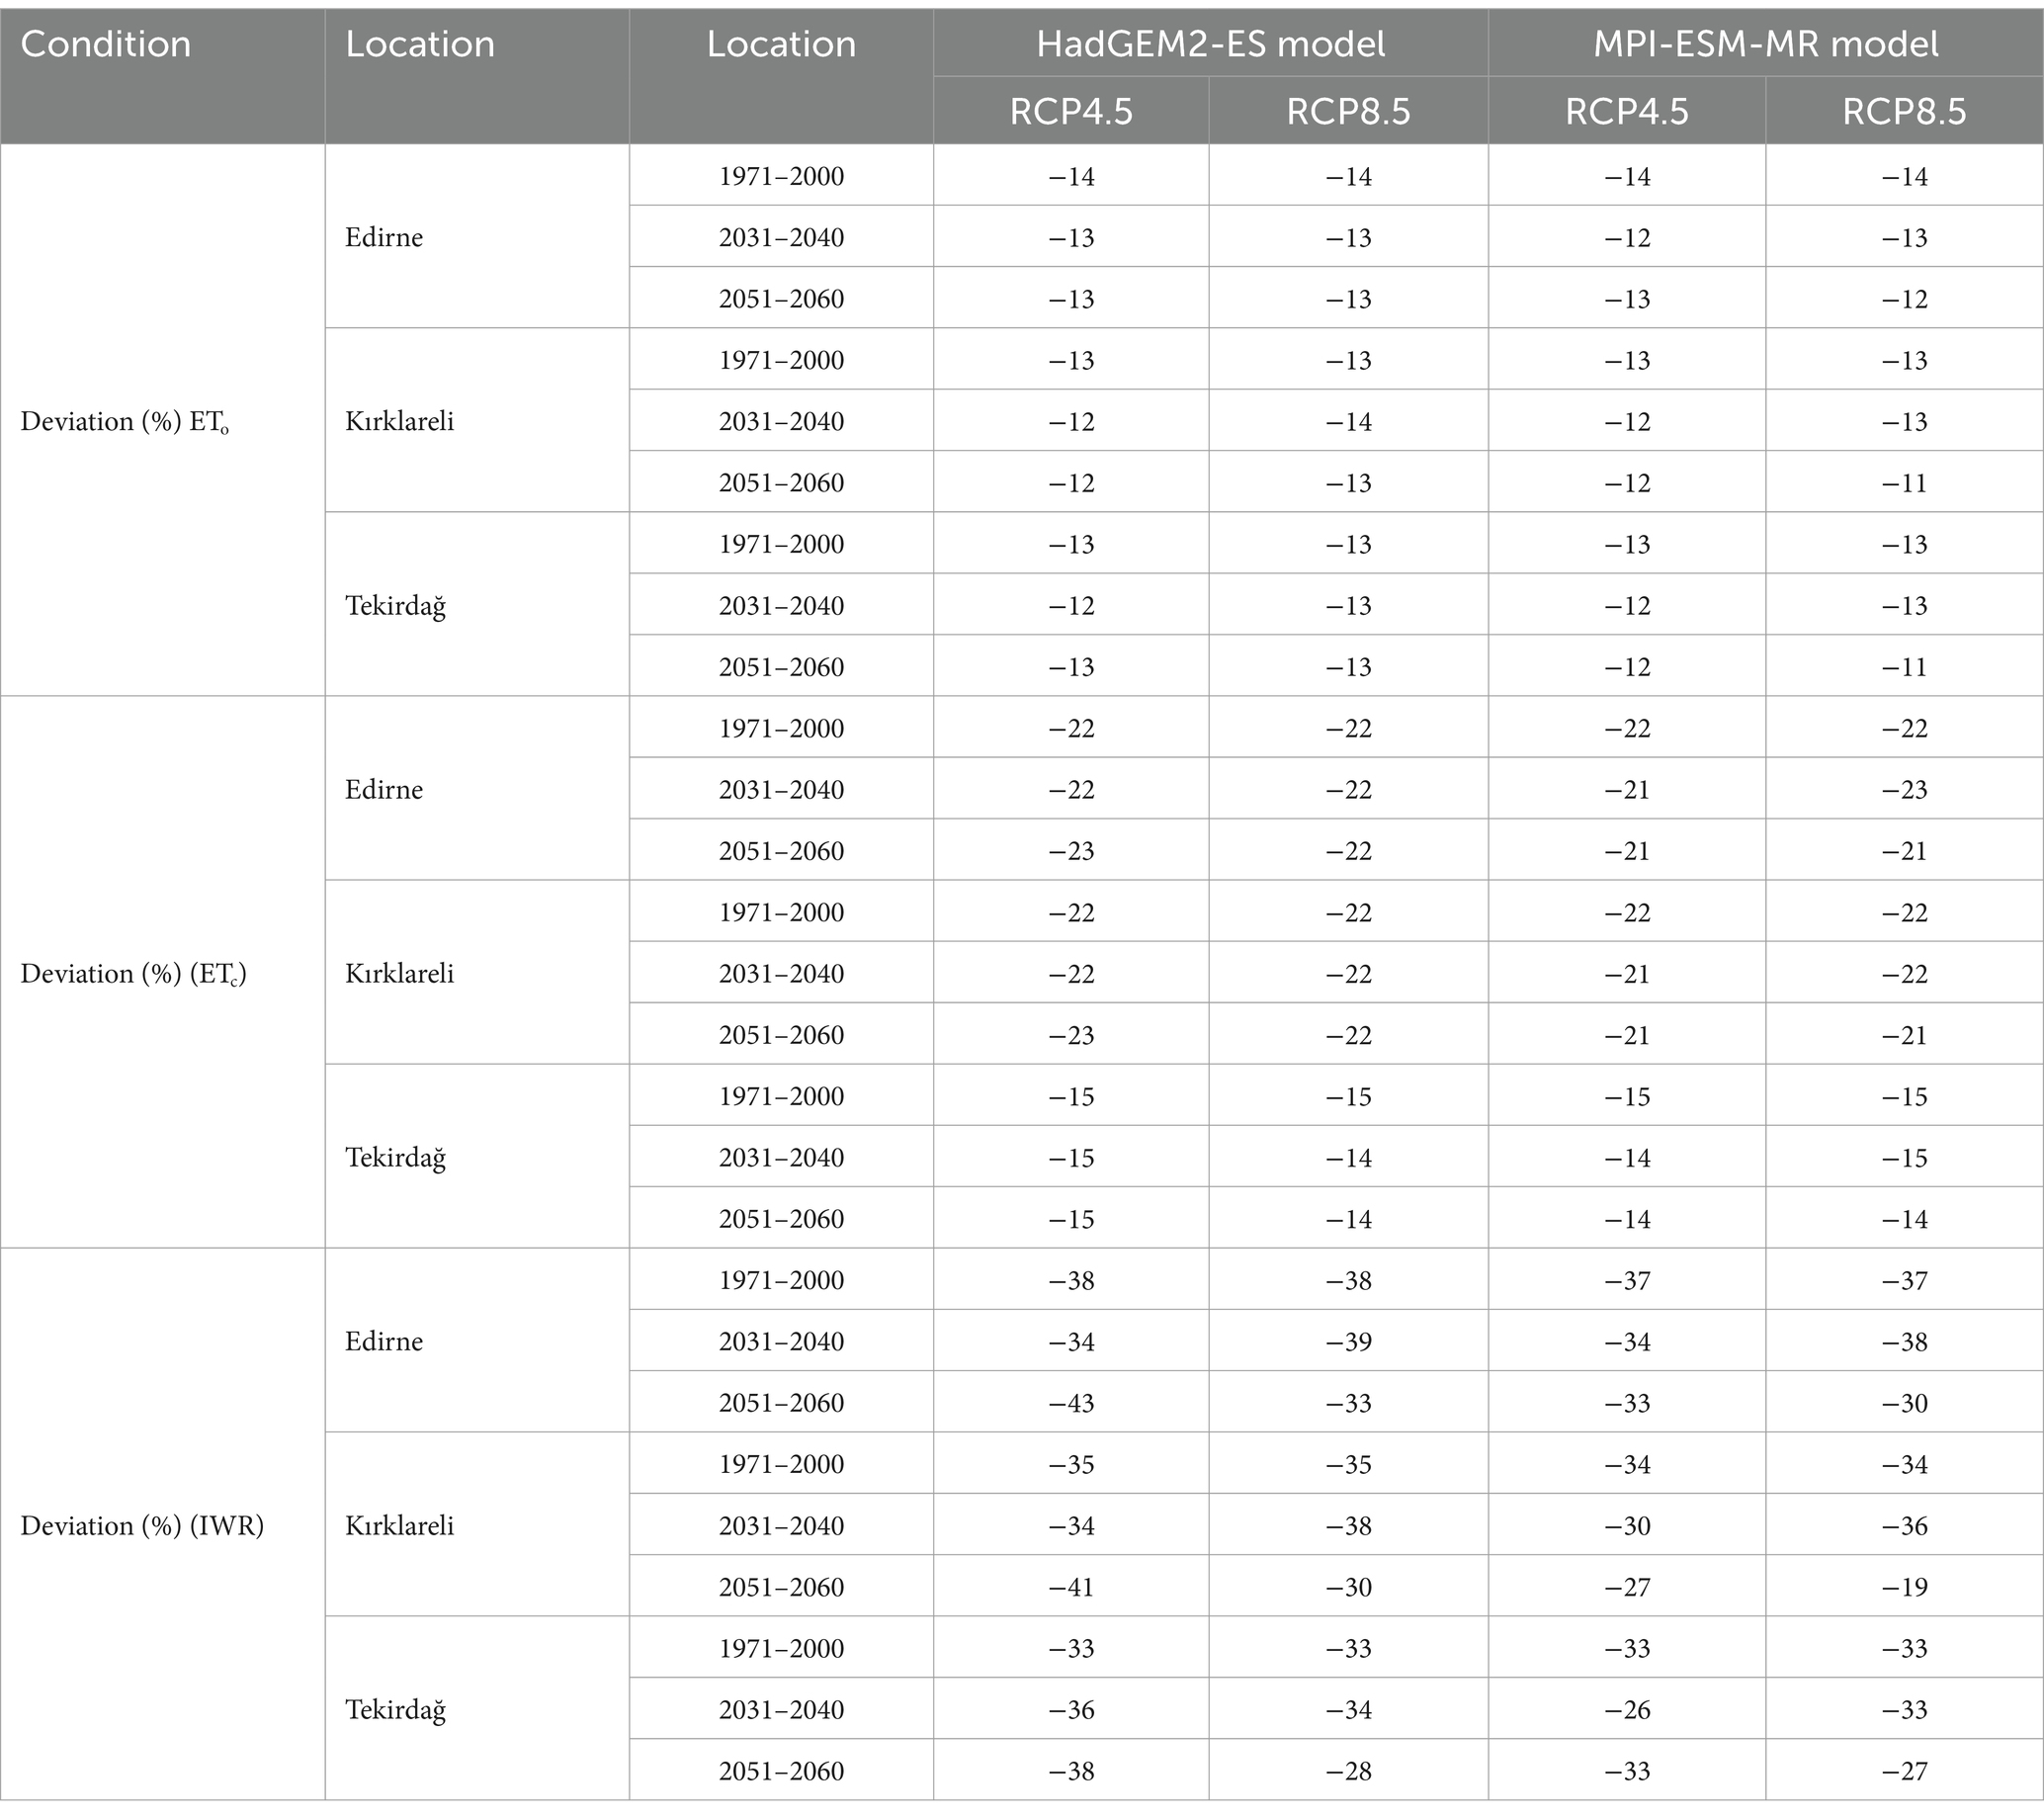
Table 8. Comparison of wheat and canola in terms of ETo (during the growing period), ETc, and IWR.
The correlations between ETo, ETc, IWR, and temperature for wheat and canola differ by province in the HadGEM2-ES and MPI-ESM-MR models (Figure 9). In general, a strong positive correlation was found between ETo and temperature, indicating that an increase in ETo with rising temperature is expected. According to the HadGEM2-ES model, a strong correlation is observed in the provinces of Tekirdağ, Kırklareli, and Edirne for wheat (0.70–0.80), whereas in the MPI-ESM-MR model, the correlation decreases to a moderate level (0.56) in Kırklareli and Edirne. For canola, a high correlation was observed in all provinces in the HadGEM2-ES model, while in Tekirdağ, the MPI-ESM-MR model shows a range of 0.71–0.76; however, in Kırklareli and Edirne using the MPI-ESM-MR model, the correlation values decrease to a moderate level (0.49–0.51).
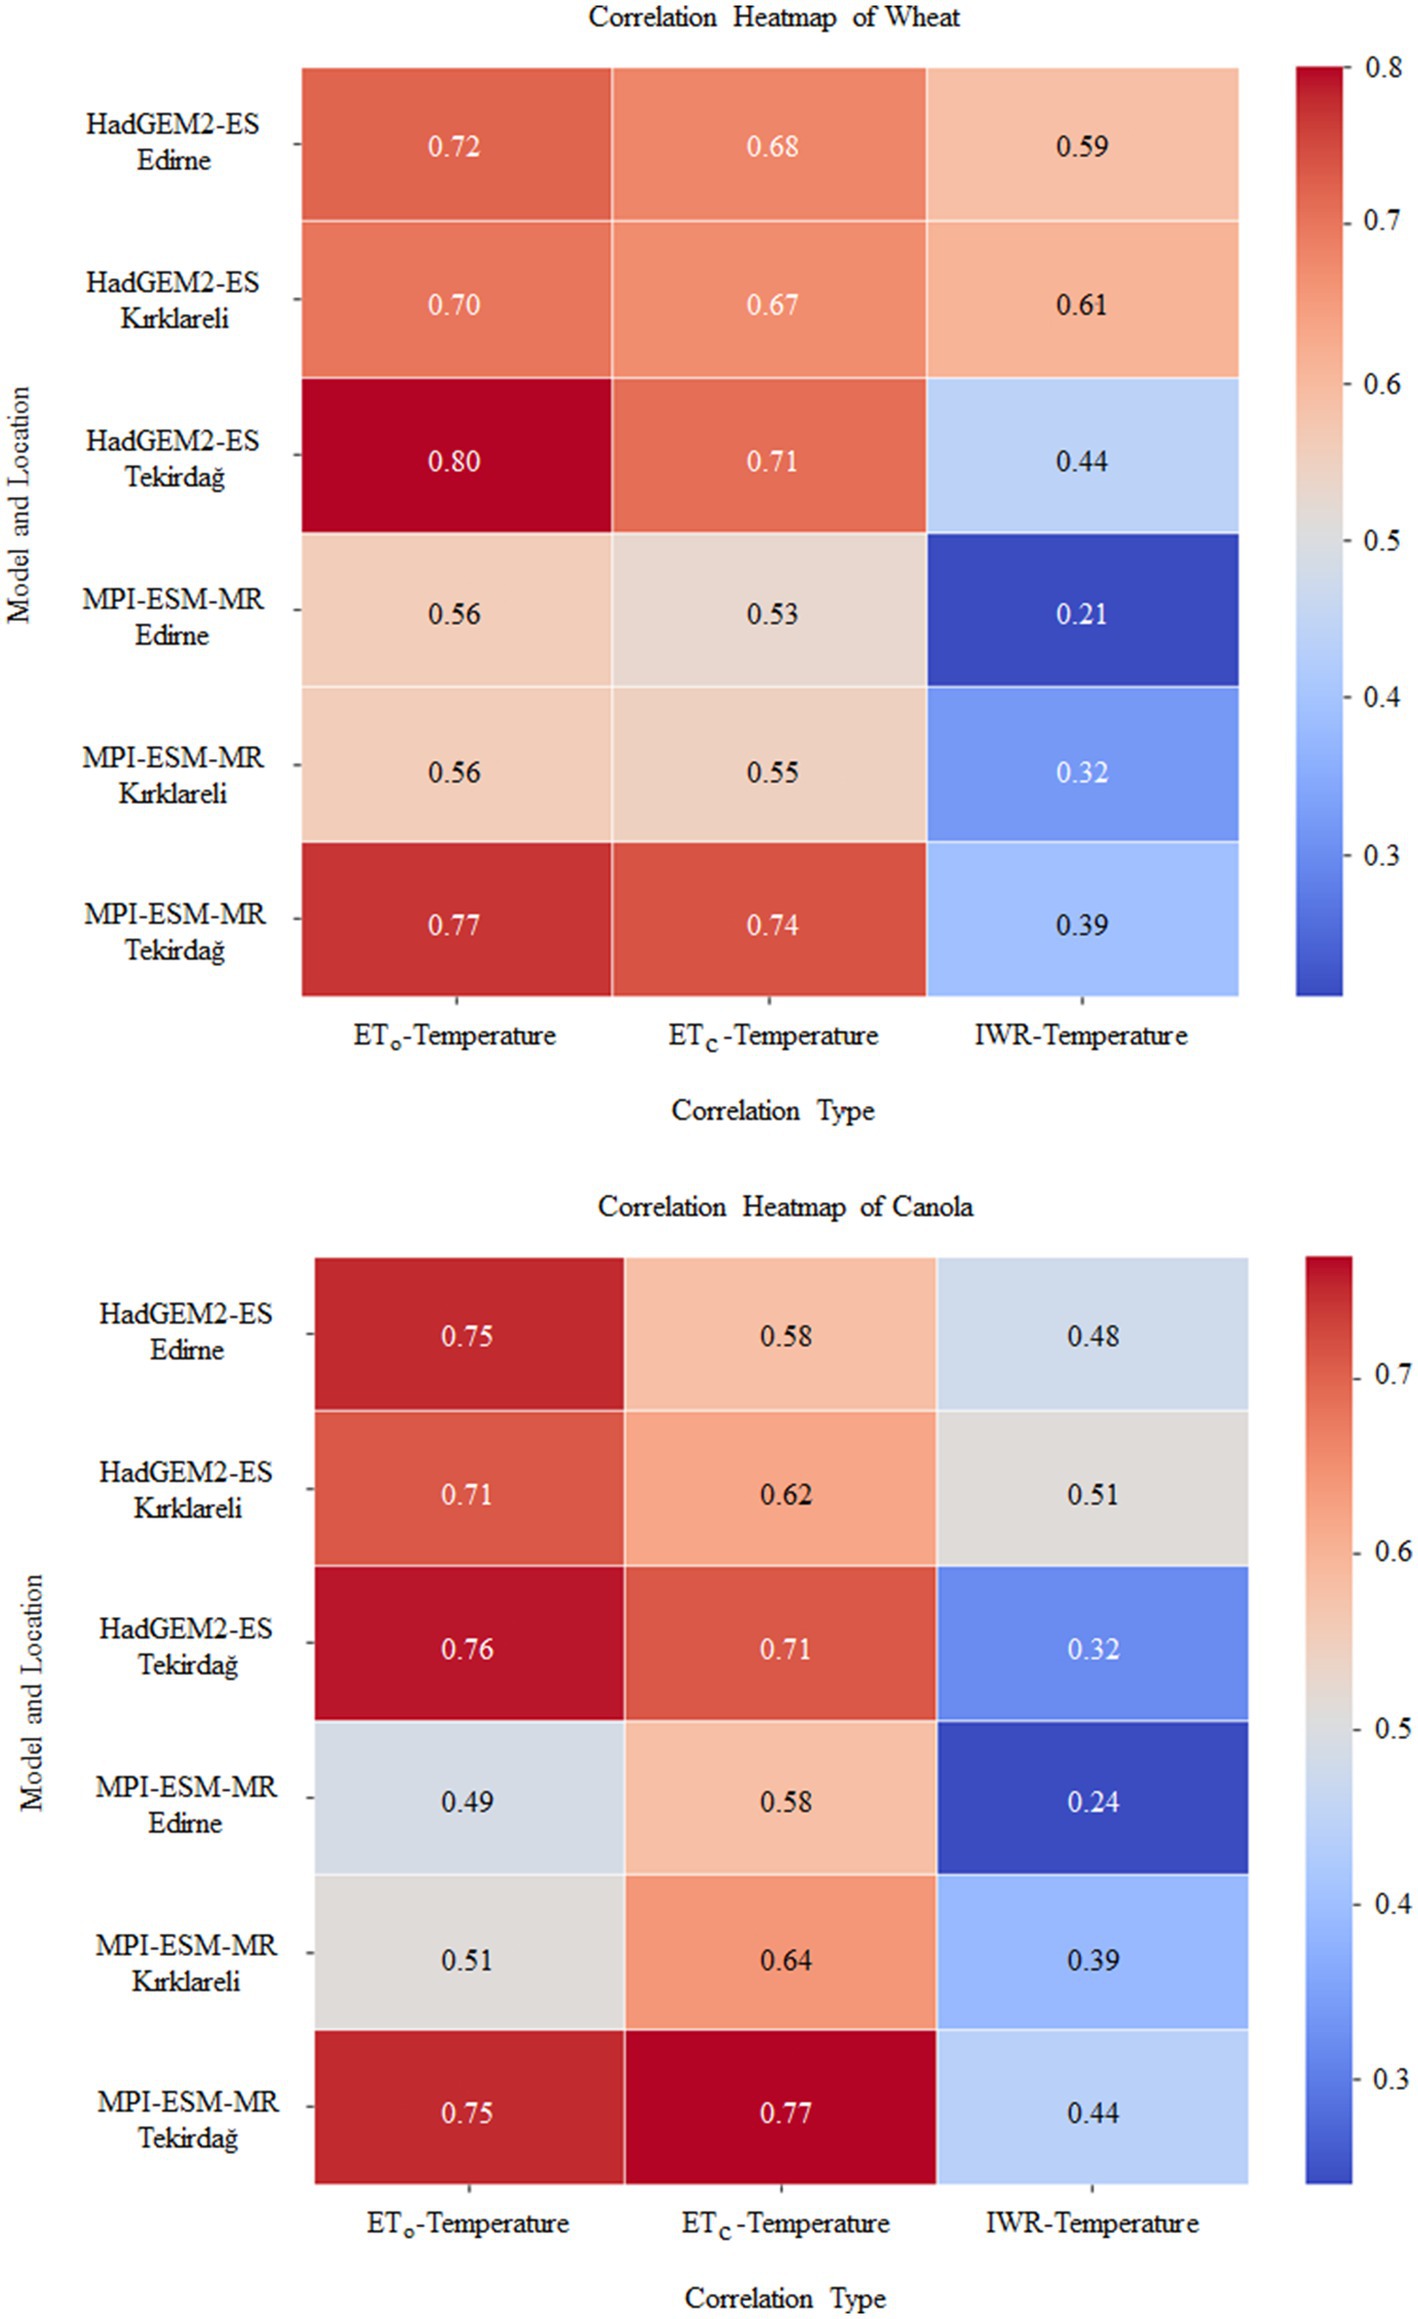
Figure 9. Heatmap showing the correlation between wheat and canola.
The relationship between ETc and temperature is generally positive. In the HadGEM2-ES model for wheat, a strong correlation was observed in Tekirdağ (0.71), while moderate to strong correlations were observed in Kırklareli and Edirne (0.67–0.68). In the MPI-ESM-MR model, the correlation remains strong in Tekirdağ (0.74) and moderate in the other two provinces (0.53–0.55). Similar trends were observed for canola, with the highest correlation values (0.71–0.77) in both models in Tekirdağ. These results support that the increase in temperature accelerates evaporation and transpiration processes, thereby increasing the water requirement of plants.
The relationship between IWR and temperature was found to be weaker than that between ETo and ETc. In the HadGEM2-ES model, the correlations for wheat were moderate in Tekirdağ (0.44) and moderate to strong in Kırklareli and Edirne (0.59–0.61). In the MPI-ESM-MR model, these correlations were lower and weak in Kırklareli and Edirne (0.21–0.32). A similar trend was observed for canola, with Kırklareli showing the highest correlation according to the HadGEM2-ES model (0.51), while the effect of temperature changes on IWR was found to be very low in Tekirdağ (0.32). Generally, the correlation between IWR and temperature was lower in the MPI-ESM-MR model, indicating that irrigation demand is not only dependent on temperature but also influenced by other factors such as rainfall regimes, soil properties, and agricultural practices.
As a result, when the relationship between temperature and ETo, ETc, and IWR was evaluated, the result was ETo > ETc > IWR. The findings reveal that temperature’s influence on ETo and ETc is strong; however, it is not the only factor determining IWR. Therefore, it is suggested that not only temperature increases but also other climatic and soil characteristics should be considered in future water management planning.
In this study conducted in the TR21 Thrace Region, climate forecast results from the ClimateWater project were used. Accordingly, in Edirne, Kırklareli, and Tekirdağ, temperature increases and periodic fluctuations in precipitation are predicted in both models and scenarios for the short (2031–2040) and long (2051–2060) periods. Possible temperature increases are projected to range between 1.08°C and 2.90°C, while changes in precipitation are projected to vary between −13.70 and 11.46 mm (Hanedar et al., 2019). In another study conducted in this region, Deveci (2015) evaluated the reference period (1970–1990) and future A2 SRES scenario outputs of the ECHAM5 General Circulation Model for the Pınarbaşı Basin in the Thrace Region. This study predicted an average temperature increase of 0.12°C between 2016 and 2025, 1.43°C between 2046 and 2055, and 3.05°C between 2076 and 2085 compared to the model reference years (1970–1990). Additionally, total precipitation was projected to increase by 60 mm (9%) between 2016 and 2025, decrease by 91 mm (14%) between 2046 and 2055, and decrease by 78 mm (12%) between 2076 and 2085 (12%). For this region, it is likely that temperatures will rise while precipitation will fluctuate over different periods.
When the results of this study are evaluated, it is predicted that ETo will change between 3.97 mm and 5.06 mm (4.5 and 17.1%) during the wheat growing period compared to the reference period (1971–2000) and in the next short-term (2031–2040) and long-term (2051–2060) periods. In canola, ETo is expected to vary between 2.533 and 2.110 mm day−1 (5.8–17.7%). Therefore, the increase in ETo with rising temperatures is considered a natural process. Deveci (2015) conducted an experiment in 2012 and found that while the average ETo value was 3.0 mm day−1 in 2012, it was predicted to increase to 3.2 mm day−1 (+7%) between 2016 and 2025, 3.6 mm day−1 (+20%) between 2046 and 2055, and 4.0 mm day−1 (+33%) between 2076 and 2085. Similarly, Azlak and Şaylan (2019) investigated the impact of climate change on ET in three cities of the Thrace Region (Edirne, Kırklareli, and Tekirdağ). Using model outputs from the ECHAM-5 model under A1B, they estimated that ET would increase by 9–14% in the future period (2015–2040) compared to the past period (1975–2010) as a result of climate change.
Azlak (2015) showed that evaporation in Kırklareli, Edirne, and Tekirdağ will increase by 10–15% in the future period (2015–2040) compared to the past period (1975–2010) within the framework of climate change. Arabi and Candoğan (2022) estimated ETo values for 18 meteorological stations in the Marmara Region using monthly climate data between 1990 and 2020 and identified statistically significant increasing trends in ETo values in Edirne, Kırklareli, and Tekirdağ. Deveci and Konukcu (2024), in their study conducted in Pınarbaşı Basin in the TR21 Thrace Region, estimated that ETo would increase by 9% (3.6 mm day−1) in 2046–2055 and 21% (4.0 mm day−1) in 2076–2085 based on the RegCM3 Regional Climate Model A2 scenario output, compared to the reference period (1970–1990). In addition, in the same study, they calculated that ETo would increase by 0.1 mm day−1 for every 1°C rise in temperature. When the studies in the region are evaluated, it is evident that ETo will increase despite differences in reference periods, model results used, future period ranges, and selected scenarios. The proportional variations observed are due to these methodological differences. The results are in line with other studies conducted in the region. Goyal (2004), in a 32-year study (1971–2002) of long-term climate data in Rajasthan (India), found that a 20% increase in temperature (with a maximum rise of 8°C) resulted in a 14.8% increase in total ET. Tewabe et al. (2022) determined that between 2000 and 2016 in Ethiopia, ET ranged from 4.86–3.14 mm day−1 in Koga and 4.67–2.36 mm day−1 in Rib. Goodarzi et al. (2019) determined that ETo would increase by approximately 2.5 and 4.1% under RCP4.5 and RCP8.5 scenarios, respectively. Goodarzi et al. (2019) determined that there would be approximately a 2.5 and 4.1% increase in ETo RCP4.5 and RCP8.5 scenarios, respectively.
Irmak et al. (2012) examined the effect of climate data on reference crop water consumption over a 116-year period (1893–2008) in the Platte River Basin in Nebraska, United States, and found that ETo, precipitation, and relative humidity were significantly (p < 0.05) inversely correlated, while mean temperature, maximum temperature, vapor pressure deficit, solar radiation, and net radiation were significantly and positively correlated. In Northwest Bangladesh, Acharjee and Mojid (2023) found that in five different climate models and two different scenarios (RCP4.5 and RCP8.5), ETo would increase during the wheat growing period compared to the reference period 1980–2013, with a more pronounced increase under climate change conditions. These findings indicate a strong and reliable correlation link between temperature and ETo.
This study investigated the impacts of climate change on ETo, ETc, and IWR during the developmental stages of wheat and canola crops in the TR21 Thrace Region. The findings reveal that, based on the HadGEM2-ES and MPI-ESM-MR models, increases are expected in all future periods (2031–2040 and 2051–2060) and scenarios (RCP4.5 and RCP8.5) compared to the reference period (1971–2000). In particular, a significant increase in ETo and ETc is projected due to the direct impact of rising temperatures. This indicates that temperature increase is a key factor when assessing the impacts of climate change on agricultural water management.
In the study, it was determined that IWR for wheat would vary between 158.8 mm and 321.3 mm (−2.4 to 35.8%), while the IWR for canola would range from 106.5 mm to 238.6 mm (−2.5 to 48.8%). The ETc for wheat was predicted to range from 595 to 438 mm day−1 (5.7 to 17.0%), whereas ETc for canola was predicted to range from 374 to 464 mm day−1 (6.3 to 17.0%). It can be stated that ETc and IWR are expected to increase with the predicted temperature rises in the region (1.08°C–2.90°C). Compared to the reference period, a decrease in IWR of 2.4% for wheat and 2.5% for canola, respectively, was predicted only in Tekirdağ during the long period (2051–2060) as a result of the MPI-ESM-MR model RCP4.5 scenario. The underlying reason for this is believed to be the following: compared to other periods within the scope of the research, the temperature in Tekirdağ increased by 1.34°C during this period, while the largest increase in precipitation was estimated to be 11.46 mm (Hanedar et al., 2019). This situation, where the increase in precipitation partially offsets the temperature rise, demonstrates that temperature and precipitation factors should be considered together in relation to IWR. IWR was projected to increase by up to 35.8 and 48.8% for wheat and canola, respectively, with these increases being more pronounced under high temperature and low precipitation conditions. It can be concluded that this rise in precipitation, rather than the rise in temperature, alleviates the demand for IWR. Özkul et al. (2008) estimated that plant water requirements (potential evapotranspiration) will increase by approximately 10, 15, and 30% for the years 2030, 2050, and 2,100, respectively, in the Gediz and Büyük Menderes basins. Similarly, Şen et al. (2008) predicted a decrease in effective precipitation and, consequently, a decline in water resources in the Seyhan Basin, alongside an increase in plant water requirements. Acharjee and Mojid (2023) found that the average irrigation requirement for wheat, based on climate models, would be 5.7 and 13.9% higher in the 2050s and 2080s, respectively, than during the base period under moderate climate change. They also projected that the highest increase in irrigation requirements (17.5%) would occur in the 2080s under rapid climate change. Makar et al. (2022) estimated that ETc for wheat would increase in the future period (2021–2050) compared to the reference period (1991–2020), while IWR for wheat would increase by 3.9%. Ewaid et al. (2019) found that total gross irrigation, total net irrigation, and IWR for wheat in Iraq were 343.8 mm, 240.7 mm, and 1,142 mm dec−1 for the period 1970–2000, respectively.
In a study conducted in the Shaheed Benazirabad District of Sindh Province, Pakistan, researchers found that the IWR for wheat was 402.5 mm during 2017–2021. Similarly, Soomro et al. (2023) found that the ETc for wheat was 418.9 mm, while IWR was 407.6 mm during the same period in Hyderabad, Pakistan. Tewabe et al. (2022) also found that the IWR for wheat was 379.9 mm season−1 in Koga and 376.9 mm season−1 in Rib. Goodarzi et al. (2019), using two climate change scenarios (RCP4.5 and RCP8.5) and 20 GCM models in Iran, projected rising temperatures and decreasing precipitation in both the reference (1976–2005) and future periods (2017–2046). They suggested that irrigation water demands will increase significantly, averaging an 18% rise for some crops. Among these, barley, cumin, onion, wheat, and fodder crops in the current crop pattern will be particularly sensitive to these changes, leading to a significant increase in their water demand. When all these results are evaluated, it is possible to say that the increase in ETc and IWR values is possible.
Wheat and canola are two important agricultural crops that differ in terms of growth duration, water consumption, and physiological characteristics. Wheat is adapted to cool climates and has a growing period of approximately 220–280 days (RTMAFGDARP, 2017; Aykanat and Barut, 2018; Mızrak, 2021; FAO, 2024a). Its highest water requirement occurs during the emergence, spike, and milking periods, consuming approximately 450–650 mm of water in a growing season (Orta et al., 2002; Aykanat and Barut, 2018; Dundar and Topak, 2021; FAO, 2024a). In this study, ETc values for wheat were calculated at an average of 510.2 mm, aligning with results obtained from the literature. Canola, an oilseed crop, has a growing period of approximately 180–250 days, depending on environmental conditions (Tıraş, 2009; RTMAFGDARP, 2017). It requires approximately 200–500 mm of water in a growing season (Tan, 2009), with water demand peaking during vegetative growth, flowering, and seed formation periods. Water shortages during these critical periods may cause yield losses (Jensen et al., 1996; Tahir et al., 2007; Dogan et al., 2011). In this study, ETc values for canola averaged 409.1 mm, demonstrating results consistent with previous research literature.
The findings also indicate that wheat is a more water-intensive crop compared to canola. ETo, ETc, and IWR values were estimated to be 11–14%, 14–23%, and 19–43% higher for wheat than for canola, respectively. This difference is likely linked to the longer growth period of wheat. Additionally, the physiological structures of plants affect transpiration processes and water losses. For example, while the narrow and elongated leaves of wheat reduce transpiration losses due to their small surface area, the large leaf surface of canola enhances transpiration rates. These results highlight that the differences between wheat and canola should be taken into account in agricultural irrigation planning. This is especially important in regions where wheat has higher IWR, as efficient management of water resources is critical.
Climate change directly affects global water resources and agricultural production, leading to an increase in irrigation water requirements. Future water and food security depend on the impact of climate change on irrigation water demand (Döll, 2002). Studies show that drought and rising temperatures exacerbate water scarcity by increasing irrigation demand. For example, studies on the Gidabo reservoir found that irrigation water demand could increase by 26 to 39% under the RCP4.5 and RCP8.5 scenarios (Mana et al., 2023). Similarly, a global-scale analysis indicated that water demand for irrigation will increase due to future climate change conditions and that a large share of available water resources will need to be diverted to irrigation (Makar et al., 2022). However, smart irrigation management can facilitate adaptation to changing climate conditions. Technologies such as soil moisture sensors, remote sensing, and artificial intelligence-based irrigation scheduling can contribute to both the conservation of water resources and the sustainability of agricultural production by increasing water use efficiency (Ahmed et al., 2023). Therefore, to adapt to climate change and manage water resources sustainably, the transition from traditional irrigation systems to smart irrigation practices should be encouraged (Rosa, 2022).
In this study, the effects of climate change on the irrigation water requirements for wheat and canola in the TR21 Thrace Region were modeled using CROPWAT 8.0. The HadGEM2-ES and MPI-ESM-MR model’s reference period (1971–2000) and future short (2031–2040) and long (2051–2060) periods under RCP4.5 and RCP8.5 scenario results were used for modeling. As a result, the effects of climate change on ETo, ETc, and IWR were determined.
Climate change has a significant impact on the consumption of water resources. In the TR21 Thrace Region, it is estimated that the water consumption of ETo, wheat, and canola during the plant development period will be negatively affected by climate change and will increase relative to the reference period. The general trend indicates an increase in water requirements. The irrigation water requirement is predicted to rise in all periods except for one in both models. In this exceptional period, the high amount of precipitation has led to a decrease in irrigation requirements. Therefore, future water management planning should consider not only the increase in temperature but also changes in precipitation patterns. When comparing the results for wheat and canola, it is determined that the ETo, ETc, and IWR—irrigation water requirements—of wheat are higher than those of canola during the development period. Specifically, the ETo value of wheat is predicted to be 11–14% higher, the ETc value 14–23% higher, and the IWR value 19–43% higher than that of canola. These results emphasize the need to consider the differences between wheat and canola in agricultural irrigation planning. In this context, precision irrigation management systems should be widely adopted to enhance water use efficiency, and especially, water-saving drip irrigation methods should be encouraged.
The findings highlight the impact of climate change on agricultural irrigation and water management on a global scale. The study results indicate a strong connection between rising temperatures and ETo, ETc, and IWR. As temperatures increase, evapotranspiration rates and irrigation requirements are projected to rise. However, changes in precipitation patterns may alter the extent of this impact; during certain periods, increased precipitation may reduce irrigation needs, while in other periods, more severe drought conditions may occur. Nonetheless, changes in precipitation could affect this relationship and partially decrease irrigation requirements. In this context, the adoption of drought-resistant wheat and canola varieties is viewed as an effective strategy to reduce future water demand. Additionally, conservation tillage practices, such as no-till farming, which helps retain soil moisture and improve water-use efficiency, should be widely promoted.
Currently, wheat and canola cultivation in the TR21 Thrace Region is near its potential yield and does not require irrigation. This study provides significant insights into the effects of climate change on irrigation water requirements, offering valuable guidance for farmers, agricultural experts, local administrators, planners, and decision-makers in water resource management and climate change adaptation. However, further research is needed to refine climate projections and comprehensively evaluate their impact on irrigation management. Conducting comprehensive analyses across different climate scenarios and crop species will support the development of sustainable agricultural practices and improve water resource management.
The raw data supporting the conclusions of this article will be made available by the authors without undue reservation.
HD: Conceptualization, Data curation, Formal analysis, Investigation, Methodology, Resources, Visualization, Writing – original draft, Writing – review & editing. BÖ: Conceptualization, Investigation, Methodology, Resources, Writing – original draft, Writing – review & editing. TE: Conceptualization, Writing – original draft, Writing – review & editing.
The author(s) declare that no financial support was received for the research and/or publication of this article.
The authors declare that the research was conducted in the absence of any commercial or financial relationships that could be construed as a potential conflict of interest.
The author(s) declare that no Gen AI was used in the creation of this manuscript.
All claims expressed in this article are solely those of the authors and do not necessarily represent those of their affiliated organizations, or those of the publisher, the editors and the reviewers. Any product that may be evaluated in this article, or claim that may be made by its manufacturer, is not guaranteed or endorsed by the publisher.
Acharjee, T. K., and Mojid, M. A. (2023). Irrigation requirement of wheat under future climate change in Northwest Bangladesh. Water Conservation Sci. Eng. 8, 1–9. doi: 10.1007/s41101-023-00213-z
Ahmed, Z., Gui, D., Murtaza, G., Yunfei, L., and Ali, S. (2023). An overview of smart irrigation management for improving water productivity under climate change in drylands. Agronomy 13:2113. doi: 10.3390/agronomy13082113
Akalın, M. (2014). The climate change impacts on agriculture: adaptation and mitigation strategies for these impacts. Hitit University J. Soc. Sci. Institute 7, 351–377.
Arabi, C., and Candoğan, B. N. (2022). Spatial and temporal change of reference crop evapotranspiration in Marmara region. Int. J. Agricul. Wildlife Sci. 8, 268–281. doi: 10.24180/ijaws.1080376
Aydın-Kandemir, F., and Yıldız, D. (2022). Assessment of crop water requirements by using cropwat for sustainable water resources management in agriculture (Akhisar-Manisa, Turkey). Int. J. Water Manag. Diplomacy 1, 5–20.
Aykanat, S., and Barut, H. (2018). Technical comparison of different sowing methods and irrigation in wheat cultivation. Int. J. Eastern Mediterranean Agricul. Res. 1, 131–142.
Azlak, M. (2015). Possible effects of climate change on evaporation. MSc. Thesis, İstanbul Technical University, İstanbul.
Azlak, M., and Şaylan, L. (2019). Estimating the climate change impact on reference evapotranspiration in the Thrace region of Turkey. Soil Water J., 77–85. doi: 10.21657/topraksu.655273
Bernstein, L., Bosch, P., Canziani, O., Chen, Z., Christ, R., Davidson, O., et al. (2008). Climate change 2007: Synthesis report: An assessment of the intergovernmental panel on climate change. Geneva, Switzerland: IPCC.
ClimateWater (2016). Climate change impact on water resources project. Republic of Türkiye ministry of agriculture and forestry, general directorate of water management. Ankara, Türkiye. Available online at: https://www.tarimorman.gov.tr/SYGM/Belgeler/iklim%20de%C4%9Fi%C5%9Fikli%C4%9Finin%20su%20kaynaklar%C4%B1na%20etkisi/Iklim_Nihai%20Rapor_YoneticiOzeti.pdf (Accessed January 16, 2024).
Collins, W. J., Bellouin, N., Doutriaux-Boucher, M., Gedney, N., Hinton, T., Jones, C. D., et al. (2008). “Evaluation of hadGEM2 model” in Hadley Centre technical note 74 (Exeter, UK: Met Office). Available at: https://www.inscc.utah.edu/~reichler/publications/papers/Collins_08_MetOffice_74.pdf
Deveci, H. (2015). Modelling the effect of climate change on surface water resources, soil water profile and plant yield in Thrace region. Ph.D. Thesis, Tekirdağ Namık Kemal University, Türkiye.
Deveci, H. (2025). "Determination of the accuracy of average temperature values obtained from different climate models in TR21 Thrace region", in: 9th international conference on global practice of multidisciplinary scientific studies, 868–884.
Deveci, H., and Konukcu, F. (2024). Modeling the effect of climate change on evapotranspiration in the Thrace region. Atmosfera 15:1188. doi: 10.3390/atmos15101188
Dogan, E., Copur, O., Kahraman, A., Kirnak, H., and Guldur, M. E. (2011). Supplemental irrigation effect on canola yield components under semiarid climatic conditions. Agric. Water Manag. 98, 1403–1408. doi: 10.1016/j.agwat.2011.04.006
Döll, P. (2002). Impact of climate change and variability on irrigation requirements: a global perspective. Clim. Chang. 54, 269–293. doi: 10.1023/a:1016124032231
Dundar, M. A., and Topak, R. (2021). Evaluation of irrigation productivity using different irrigation strategies for winter wheat. J. Bahri Dagdas Crop Res. 10, 124–137.
Edward, J., and Hertel, K. (2011). "Procrop canola growth and development. Publication of state of new south wales through department of primary industries ".
Ewaid, S. H., Abed, S. A., and Al-Ansari, N. (2019). Crop water requirements and irrigation schedules for some major crops in southern Iraq. WaterSA 11:756. doi: 10.3390/w11040756
FAO (2024a). Food and agriculture organization. Wheat. Available online at: https://www.fao.org/land-water/databases-and-software/crop-information/wheat/en/ (Accessed July 16, 2024).
FAO (2024b). Food and agriculture organization. Cropwat. FAO Irrigation and Drainage Paper No. 66. Rome, Italy. Available online at: https://www.fao.org/land-water/databases-and-software/cropwat/en/ (Accessed August 19, 2024).
Gıdık, B. (2012). Characterization of genetic diversity in canola plant, grown in Trakya region, by molecular markers. MSc. Thesis, Hitit University, Türkiye.
Goodarzi, M., Abedi-Koupai, J., and Heidarpour, M. (2019). Investigating impacts of climate change on irrigation water demands and its resulting consequences on groundwater using CMIP5 models. Ground Water 57, 259–268. doi: 10.1111/gwat.12771
Goyal, R. K. (2004). Sensitivity of evapotranspiration to global warming: a case study of arid zone of Rajasthan (India). Agric. Water Manag. 69, 1–11. doi: 10.1016/j.agwat.2004.03.014
Güler, M., Kara, T., and Dok, M. (2005). Using geographic information systems (GIS) techniques to determine potential rapeseed (Brassica Napus L.) production area in middle black sea region. J. Agricul. Faculty of Ondokuz Mayıs University 20, 44–49.
Gültaş, H.T. (2013). Determinantion of soil-water–atmospheric relations for rapeseed (Brassica napus L.). Ph.D. Thesis, Namık Kemal University, Türkiye.
Gürkan, H., Demir, Ö., Atay, H., Eskioğlu, O., Yazıcı, B., Demircan, M., et al. (2015). "Temperature and precipitation projections of MPI-ESM-MR model according to RCP4.5 and RCP8.5 scenarios", in: VII. Atmospheric sciences symposium with international participation, 1–12.
Hanedar, A., Ferat, Ç., Erdem, G., Konukcu, F., Altürk, B., and Albut, S. (2019). “TR21 region climate assessment: current situation and projections” in Effects of climate change and adaptation strategies in TR21 Thrace region. eds. F. Konukcu, S. Albut, and B. Altürk. 1st ed (Tekirdağ: Tekirdağ Namık Kemal University), 1–22.
Irmak, S., Kabenge, I., Skaggs, K. E., and Mutiibwa, D. (2012). Trend and magnitude of changes in climate variables and reference evapotranspiration over 116-yr period in the Platte River basin, Central Nebraska–USA. J. Hydrol. 420-421, 228–244. doi: 10.1016/j.jhydrol.2011.12.006
Jensen, C. R., Mogensen, V. O., Mortensen, G., Fieldsend, J. K., Milford, G. F. J., Andersen, M. N., et al. (1996). Seed glucosinolate, oil and protein contents of field-grown rape (Brassica Napus L.) affected by soil drying and evaporative demand. Field Crop Res. 47, 93–105. doi: 10.1016/0378-4290(96)00026-3
Makar, R. S., Shahin, S. A., El-Nazer, M., Wheida, A., and Abd El-Hady, M. (2022). Evaluating the impacts of climate change on irrigation water requirements. Sustain. For. 14:14833. doi: 10.3390/su142214833
Mana, T. T., Abebe, B. W., and Hatiye, S. D. (2023). Effect of climate change on reservoir water balance and irrigation water demand: a case of gidabo irrigation project, Rift Valley basin, Ethiopia. Environ. Monit. Assess. 195:866. doi: 10.1007/s10661-023-11484-3
Max-Plank-Institut für Meterologie (MPI) (2024). MPI-ESM. Available online at: https://mpimet.mpg.de/en/research/modeling (Accessed June 06, 2024).
Met Office (2024). HadGEM2 family: Met office climate prediction model. Available online at: https://www.metoffice.gov.uk/research/approach/modelling-systems/unified-model/climate-models/hadgem2 (Accessed September 24, 2024).
MIART (2024). Ministry of internal affairs of the republic of Türkiye. Inventory of civil administrative departments of Türkiye. Available online at: https://www.e-icisleri.gov.tr/Anasayfa/MulkiIdariBolumleri.aspx (Accessed July 20, 2024).
Mızrak, G. (2021). Wheat from soil to table. Ankara, Türkiye: Union of Chambers of Agriculture of Türkiye.
Moss, R. H., Edmonds, J. A., Hibbard, K. A., Manning, M. R., Rose, S. K., van Vuuren, D. P., et al. (2010). The next generation of scenarios for climate change research and assessment. Nature 463, 747–756. doi: 10.1038/nature08823
Orta, A. H., Şehirali, S., Başer, İ., Erdem, T., Erdem, Y., and Yorgancilar, Ö. (2002). Water - yield relation and water- use efficiency of winter wheat in Western Turkey. Cereal Res. Commun. 30, 367–374. doi: 10.1007/bf03543431
Özalp, A. (2010). Economic analysis of pomegranate production in Antalya. MSc. Thesis MSc., Akdeniz University, Antalya, Türkiye.
Özkul, S., Fıstıkoğlu, O., and Harmancıoğlu, N. (2008). "Assessment of the impact of climate change on water resources on the Büyük Menderes and Gediz basins", in: TMMOB 2nd water policy congress, 309–322.
Pachauri, R. K., Allen, M. R., Barros, V. R., Broome, J., Cramer, W., Christ, R., et al. (2014). Climate change 2014: Synthesis report. Contribution of working groups i, ii and iii to the fifth assessment report of the intergovernmental panel on climate change. Geneva, Switzerland: IPCC.
Reta, B. G., Hatiye, S. D., and Finsa, M. M. (2024). Crop water requirement and irrigation scheduling under climate change scenario, and optimal cropland allocation in lower Kulfo catchment. Heliyon 10:e31332. doi: 10.1016/j.heliyon.2024.e31332
Rosa, L. (2022). Adapting agriculture to climate change via sustainable irrigation: biophysical potentials and feedbacks. Environ. Res. Lett. 17, 1–14. doi: 10.1088/1748-9326/ac7408
RTMAFGDARP (2017). Republic of Türkiye ministry of agriculture and forestry general directorate of agricultural research and policies. Plant water consumption of irrigated plants in Türkiye. Ankara, Türkiye. Available online at: https://www.tarimorman.gov.tr/TAGEM/Belgeler/yayin/Tu%CC%88rkiyede%20Sulanan%20Bitkilerin%20Bitki%20Su%20Tu%CC%88ketimleri.pdf (Accessed December 22, 2024).
RTMFWAGDWM (2015). Republic of Türkiye ministry of forestry and water affairs general directorate of water management. Impact of climate change on water resources project. Türkiye climate change projections report volume 1. Ankara, Türkiye. Available online at: https://iklimportal.gov.tr/Library/Detail/CfDJ8CuYF_1DddVNnSMW43t05Qf-n4lPr5zpU0lSHwlKucc4ey0MB_b4zwT5P1Ij19rPoBfn1NW8Zw-4EwxcGHSc6GdpQgAMH-K_QSqvLt7yRH2_rtWxlj1u2fy5vfWL_x2hmA?type=CfDJ8CuYF_1DddVNnSMW43t05QcFm1Plqi6h-xCipufv2vEfAFI_SDjyWC9rnmVDmlVJ1FeZqe322BgNef6q2Ir-xVgCh-80zedAS5_-QxF5-8xDfO2tYTKjxJIIeVnWF6cVSw (Accessed February 24, 2024).
Selçuk, E.B. (2021). Evaluation of the impact of global warming and climate change on temperature and reference evapotranspiration: The case of Malatya Province. MSc. Thesis, İnönü University, Türkiye.
Şen, B., Topcu, S., Giorgi, F., Xunqiang, B., Kanıt, E., and Dalkılıç, T. (2008). "Climate change and agricultural water in Seyhan Basin effects on use", in: TMMOB 2nd water policy congress, 71–82. Available at: https://www.dpi.nsw.gov.au/__data/assets/pdf_file/0004/516181/Procrop-canola-growth-and-development.pdf
Sensoy, S., Demircan, M., Ulupınar, U., and Balta, I. (2008). Türkiye climate. Available online at: https://www.mgm.gov.tr/FILES/genel/makale/13_turkiye_iklimi.pdf (Accessed September 19, 2024).
Soomro, S., Solangi, G. S., Siyal, A. A., Golo, A., Bhatti, N. B., Soomro, A. G., et al. (2023). Estimation of irrigation water requirement and irrigation scheduling for major crops using the cropwat model and climatic data. Water Prac. Technol. 18, 685–700. doi: 10.2166/wpt.2023.024
Steduto, P., Hsiao, T. C., Fereres, E., and Raes, D. (2012). Crop yield response to water. Italy: FAO Rome.
Sun, J., Wang, G., Sun, X., Lin, S., Hu, Z., and Huang, K. (2020). Elevation-dependent changes in reference evapotranspiration due to climate change. Hydrol. Process. 34, 5580–5594. doi: 10.1002/hyp.13978
Tahir, M., Ali, A., Nadeem, M. A., Tanveer, A., and Sabir, Q. (2007). Performance of canola (Brassica Napus L.) under different irrigation levels. Pak. J. Bot. 39, 739–746.
Tan, A. Ş. (2009). Yield potential of some rapeseed (canola) cultivars in Menemen conditions. Anadolu J. Aegean Agricul. Res. Institute 19, 1–32.
Tewabe, D., Abebe, A., Tsige, A., Enyew, A., and Worku, M. (2022). Determination of crop water requirements and irrigation scheduling of wheat using cropwat at Koga and rib irrigation scheme, Ethiopia. Indian J. Ecol. 49, 363–371. doi: 10.55362/IJE/2022/3530
Thomson, A. M., Calvin, K. V., Smith, S. J., Kyle, G. P., Volke, A., Patel, P., et al. (2011). RCP4.5: a pathway for stabilization of radiative forcing by 2100. Clim. Chang. 109, 77–94. doi: 10.1007/s10584-011-0151-4
TSMS (2024a). Turkish state meteorological service. Long-term monthly averages climate data. Available online at: https://www.mgm.gov.tr/veridegerlendirme/il-ve-ilceler-istatistik.aspx?m=EDIRNE (Accessed May 31, 2024).
TSMS (2024b). Turkish state meteorological service. Long-term monthly averages climate data. Available online at: https://www.mgm.gov.tr/veridegerlendirme/il-ve-ilceler-istatistik.aspx?m=KIRKLARELI (Accessed May 31, 2024).
TSMS (2024c). Turkish state meteorological service. Long-term monthly averages climate [Online]. Available at: https://www.mgm.gov.tr/veridegerlendirme/il-ve-ilceler-istatistik.aspx?m=TEKIRDAG (Accessed May 31, 2024).
Unakıtan, G., and Abdikoğlu, D.İ. (2014). "Supply response of wheat: case of Trakya region", in: XI. National Agricultural Economics Congress, 805–810.
Yetik, A. K., and Şen, B. (2023). Evaluation of the impacts of climate change on irrigation requirements of maize by cropwat model. Gesunde Pflanzen 75, 1297–1305. doi: 10.1007/s10343-022-00751-x
Keywords: crop water requirement, CROPWAT model, irrigation water requirement, reference evapotranspiration, water resources management, HadGEM2-ES model, MPI-ESM-MR model, climate change
Citation: Deveci H, Önler B and Erdem T (2025) Modeling the effects of climate change on the irrigation water requirements of wheat and canola in the TR21 Thrace Region using CROPWAT 8.0. Front. Sustain. Food Syst. 9:1563048. doi: 10.3389/fsufs.2025.1563048
Edited by:
Matteo Balderacchi, Independent Researcher, Piacenza, ItalyReviewed by:
Jemmy Jonson Sula Dethan, Artha Wacana Christian University, IndonesiaCopyright © 2025 Deveci, Önler and Erdem. This is an open-access article distributed under the terms of the Creative Commons Attribution License (CC BY). The use, distribution or reproduction in other forums is permitted, provided the original author(s) and the copyright owner(s) are credited and that the original publication in this journal is cited, in accordance with accepted academic practice. No use, distribution or reproduction is permitted which does not comply with these terms.
*Correspondence: Huzur Deveci, aHV6dXJkZXZlY2lAbmt1LmVkdS50cg==
Disclaimer: All claims expressed in this article are solely those of the authors and do not necessarily represent those of their affiliated organizations, or those of the publisher, the editors and the reviewers. Any product that may be evaluated in this article or claim that may be made by its manufacturer is not guaranteed or endorsed by the publisher.
Research integrity at Frontiers
Learn more about the work of our research integrity team to safeguard the quality of each article we publish.