
94% of researchers rate our articles as excellent or good
Learn more about the work of our research integrity team to safeguard the quality of each article we publish.
Find out more
ORIGINAL RESEARCH article
Front. Sustain. Food Syst., 18 February 2025
Sec. Sustainable Food Processing
Volume 9 - 2025 | https://doi.org/10.3389/fsufs.2025.1553250
 Xiaochen Chen1,2,3
 Biyun Yang1Xiping Du2,4,5,6Qingyan Li6,7
 Zhipeng Li2,4,5,6Yuanfan Yang2,4,5,6
 Zedong Jiang2,4,5,6
 Yanbing Zhu2,4,5,6
 Hui Ni1,2,4,5,6Xiongping Miao1*
Photosynthetic pigments such as phycobiliproteins and chlorophyll a are important quality indicators of seaweeds. In this study, multivariate nonlinear regression (MNLR) models were developed and validated for the rapid determination of photosynthetic pigments in Porphyra haitanensis based on colorimetric parameters (L*, a*, b*). The contents of phycoerythrin, phycocyanin, allophycocyanin and chlorophyll a in P. haitanensis were within 1.499–8.882 mg/g, 1.402–7.634 mg/g, 0.315–1.623 mg/g, and 0.340–2.160 mg/g, respectively. The L*, a*, and b* values were within 13.47–32.97, −1.88 to 2.74, and 0.23–4.61, respectively. This study indicated that the pigment contents of P. haitanensis, especially phycoerythrin and phycocyanin, could be effectively predicted based on color parameters with R2 of 0.901 and 0.701, respectively. The MNLR model also showed that the relative errors of phycoerythrin and phycocyanin content prediction were less than 10 and 20%, respectively. However, the prediction of allophycocyanin and chlorophyll a proved to be more challenging and the model showed limited predictive power. This discovery may make it easier to employ non-destructive techniques to evaluate the phycoerythrin and phycocyanin content of P. haitanensis and other seaweeds, which is important for the expanding Porphyra industry as it may enable a rapid assessment of Porphyra quality. This finding demonstrates the potential of visual analysis for quality assessment of Porphyra, as well as the convenience and non-destructive nature of the method. Future research should focus on improving the model and developing accurate and rapid quality control methods for the industrialization and scientific application of Porphyra.
Seaweeds are one of the richest resources in the ocean and are currently considered the most important marine plant resources with ecological and economic significance (Rengasamy et al., 2020). Seaweeds enrich nutrients such as proteins, carbohydrates, fiber, minerals, and vitamins, making them a significant dietary source (Rajapakse and Kim, 2011). In addition, seaweeds contain numerous bioactive chemicals with health benefits (Sharifuddin et al., 2015). Among them, the major photosynthetic pigments, including chlorophyll a (Chla) and phycobiliproteins, are important indicators for evaluating the quality of seaweeds, which have various bioactivities such as antioxidant, anti-inflammatory, anti-obesity, and anticancer activities (Munier et al., 2014).
The red algae Porphyra haitanensis is extensively cultivated along the southeast coast of China (Wu et al., 2020). P. haitanensis can be harvested several times from October of one year to the March of the next year (Ji et al., 2022). It has been reported that phycobiliproteins are abundant in Porphyra (Dumay et al., 2014). The content of photosynthetic pigments in Porphyra varies and is closely related to environmental conditions, including temperature, irradiation intensity, nitrogen content and harvesting time (Celis-Pla et al., 2022; Vahtmae et al., 2018). With the rapid development of the global Porphyra industry, Porphyra has become utilized in various industries, such as food, medicine and cosmetics, and has become a key component of these industries (Munier et al., 2014). Therefore, finding a rapid, accurate and non-destructive method for the determination of photosynthetic pigments content in Porphyra is extremely important for the quality assessment and rational utilization of Porphyra.
Commonly used extraction of photosynthetic pigments are solvent extraction techniques such as maceration, ultrasound-assisted extraction, enzyme-assisted extraction and microwave extraction (Duppeti et al., 2017). Conventional methods for the determination of photosynthetic pigments include UV–visible spectrophotometry, high-performance liquid chromatography, and liquid chromatography-mass spectrometry (Che et al., 2023). Tan et al. (2020) have proposed a method for the determination of phycobiliproteins from Arthrospira sp. using freeze-thawing extraction and UV–visible spectrophotometric analysis. Juin et al. (2015) have developed the determination of phycobiliproteins from Porphyridium purpureum using microwave-assisted extraction and UV–visible spectrophotometric analysis. Although these conventional methods, which are involved in pigment extraction and chemical measurement, are stable and accurate, they are inefficient, environmentally polluting, and heavily dependent on laboratory analysis (Che et al., 2023). Thus, these conventional methods cannot be used for nondestructive analysis of photosynthetic pigments in seaweeds to assess seaweed quality on a large scale.
Color, as an important index for evaluating the quality of seaweeds, is closely related to the content of photosynthetic pigments (Vázquez-Nion et al., 2013). Phycobiliproteins can be classified as phycoerythrin (PE, λmax ~ 565 nm), phycocyanin (PC, λmax ~ 620 nm) and allophycocyanin (APC, λmax ~ 650 nm), based on their light-absorbing properties (Zhao et al., 2019). According to the type and number of chromophores, PE, PC, and APC appear scarlet, blue, and indigo blue, respectively (Che et al., 2023). The ratio and concentration of phycobiliproteins to Chla determine the color of seaweeds (Vázquez-Nion et al., 2013). The L*a*b* color as established by the Commission International de L’Eclairage (CIELAB) is widely used to evaluate color characteristics in the food industry because it covers the entire visible spectrum of the human eye (Sant’Anna et al., 2013). For the CIELAB color scale, L*, a*, and b* indicate the psychometric index of lightness from black to white, from green to red, and from blue to yellow, respectively (Sant’Anna et al., 2013). Vázquez-Nion et al. (2013) correlated colorimetric parameters with Chla, total carotenoids and phycobiliprotein content in cyanobacterium to develop a simple non-destructive assessment method based on color measurements. This method quantifies color and provides a non-invasive quality assessment method that can be applied to Porphyra. Furthermore, statistical analyses such as principal component analysis (PCA), partial least squares regression (PLSR), and multiple linear regression (MLR) have been widely used to progressively correlate psychometric indices with pigment content in fruits and vegetables (Dos Santos et al., 2023). For example, Rigolon et al. (2020) have developed a MLR model based on colorimetric parameters (L*, a*, b*, C*, and h*) that accurately predicted the content of anthocyanin (R2 = 0.99) in blackberry, blueberry and jaboticaba skin. Zeng et al. (2022) established MLR models to predict biliverdin and protoporphyrin content in eggshells using the CIELAB color scale. Therefore, these studies establish a correlation between color, photosynthetic pigments, and quality, which is expected to lead to the development of a regression model between colorimetric parameters and photosynthetic pigments in Porphyra, laying a scientific foundation for seaweed applications.
Based on recent research advances, this study aimed to explore the potential of using color characteristics to assess the Porphyra quality. This was done by combining colorimetric parameters (L*, a*, and b*) with multivariate nonlinear regression (MNLR) models in order to predict the photosynthetic pigments (PE, PC, APC, and Chla) content of Porphyra from different origins and harvesting times. Through detailed analysis and validation, the ultimate goal of this research is to develop a rapid, convenient, and non-destructive method to assess the quality of Porphyra. This method provides a reliable and rapid quality assessment solution for the Porphyra industry, with the potential to improve quality control and production efficiency, laying the groundwork for wider applications.
A total of 110 samples of P. haitanensis were harvested within October 2021 and March 2023 from six cities in China (Ningde, Xiapu, Dongshan, Quanzhou, Shantou, and Shanghai). Among them, samples 1–30 were harvested within October 2021 and March 2022 from Ningde City (Fujian, China). Samples 31–50 were harvested within October 2021 and March 2022 from Xiapu City (Fujian, China). Samples 51–70 were harvested within October 2021 and March 2022 from Dongshan City (Fujian, China). Samples 71–90 were harvested within October 2022 and March 2023 from Xiapu City (Fujian, China). Samples 91–95 were obtained within October 2021 and March 2022 from Quanzhou City (Fujian, China). Samples 95–100 were obtained within October 2021 and March 2022 from Shantou City (Guangdong, China). Samples 101–105 were obtained within October 2022 and March 2023 from Shanghai City (China). Samples 106–110 were obtained within October 2022 and March 2023 from Shantou City (Guangdong, China). All of the fresh samples were commercially purchased from the local bases or markets, and immediately dried at 60 ± 2°C to the water content within 6–8%, followed by preservation in freezer before analysis. Among them, samples 1–100 were used to develop the model, and the remaining 10 samples were used for model validation. The specific experimental flow was shown in Figure 1.
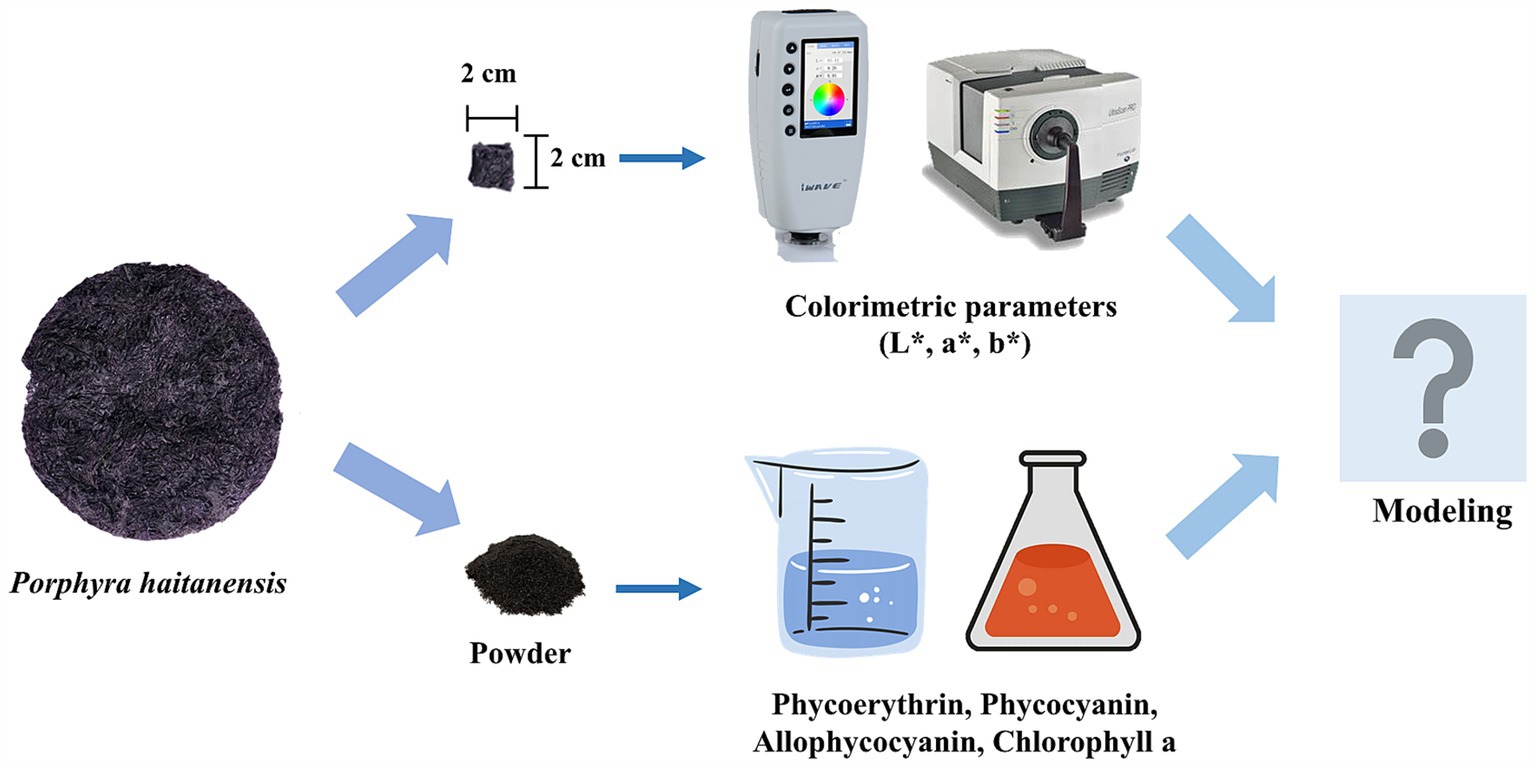
Figure 1. Workflow of rapid determination of photosynthetic pigments in P. haitanensis based on colorimetric parameters.
To determine color, all P. haitanensis samples were cut into 2 cm × 2 cm (length×width) pieces of 5 mm thickness. Colorimetric parameters were measured using a WSC-S colorimeter (Shanghai Shenguang Instrument Co., Ltd., China). The CIELAB color scale was used to measure the L*, a*, and b* values. L*, a*, and b* indicate lightness from black (0) to white (100), green (−80) to red (100), and blue (−80) to yellow (100), respectively. For each sample, the results were expressed as an average of three measurements.
To ensure the effective extraction of pigments, the P. haitanensis was pulverized into powder using a JP-500C blender (Kefeng Instrument Co., Zhengzhou, China), then sieved through a 60 mesh, and stored at 4°C in the dark until the extraction of photosynthetic pigments. The Chla, PE, PC and APC exhibited λmax values of 650–700 nm, 565 nm, 620 nm, and 650 nm, respectively (Prabha et al., 2023). The close proximity of the maximum absorption wavelengths of PE, PC, and APC poses a potential challenge to accurate determination. To mitigate this issue, specific extraction methods were employed to extract the pigments individually prior to analysis.
The Chla was extracted and analyzed according to Ritchie (2006). The dry P. haitanensis powder (0.1 g) was mixed with 15 mL of 90% acetone solution in the dark at 4°C for 20 min, then centrifuged at 10,000 rpm for 10 min to obtain the supernatant to determine the absorbance at 630 nm. The content of Chla was analyzed using Equation 1.
The phycobiliproteins were extracted according to Niu et al. (2010) with minor modifications. Dry P. haitanensis powder (1 g) was mixed with 40 mL of 0.01 M phosphate buffer (pH 6.8) and frozen at −20°C for 6 h. Thereafter, the frozen samples were thawed at 30°C for 20 min until completely thawed (freeze-thawing 1). The freeze–thaw process was repeated five times. The thawed sample was centrifuged at 8,000 rpm for 30 min to obtain the supernatant. Considering that phycobiliproteins can be separated from the extracts using sulfate precipitation at varying concentrations of sulfate. Different concentrations of ammonium sulfate were utilized to prepare PE, PC, and APC individually. The same extract underwent sulfate precipitation with gradually increasing concentrations to prepare PE, PC, and APC.
The PE was prepared from the extract using the method of Shi et al. (2015) with minor modification. In short, the above-mentioned supernatant was precipitated with 20% saturated ammonium sulfate for 12 h at room temperature (25°C), followed by centrifugation at 8,000 rpm for 30 min. The resultant supernatant was further precipitated with 45% saturated ammonium sulfate for 12 h. The PE was obtained by centrifuging at 10,000 rpm for 30 min, and then fully dissolved in 0.01 M phosphate buffer (pH 6.8). Finally, the content of PE was analyzed using Equation 2.
The PC was prepared from the extract using the method of Zhao and Tang (2012). The above-mentioned supernatant was precipitated with 40% saturated ammonium sulfate for 24 h at room temperature (25°C). The PC was obtained via centrifuging at 8,000 rpm for 30 min. The precipitate was fully dissolved in 0.01 M phosphate buffer (pH 6.8). The content of PC was analyzed using Equation 3.
The APC was prepared according to Zhang et al. (2011). the above-mentioned supernatant was precipitated with 20% saturated ammonium sulfate for 12 h at room temperature (25°C), followed by centrifugation at 8,000 rpm for 30 min. The resultant supernatant was further precipitated with 35% saturated ammonium sulfate for 12 h. APC was obtained by centrifuging at 10,000 rpm for 30 min and was fully dissolved in 0.01 M phosphate buffer (pH 6.8). The content of APC was analyzed using Equation 4 (Soni et al., 2006).
MNLR model as Equation 5 was used to correlate the photosynthetic pigment content in P. haitanensis using the colorimetric parameters (Torres-Sánchez et al., 2020).
Where b0–b9 are fitting constants, X1, X2, and X3 are the variables (L*, a*, and b*), Y is the indicator value of photosynthetic pigments (Chla, PE, PC, and APC).
In order to quantify the predictive quality of the models, the following metrics were employed: determination coefficient (R2) (Carvalho et al., 2020), root mean square error (RMSE) (Carvalho et al., 2020), mean absolute percent error (MAPE) (Che et al., 2023) and relative error (Er) (Liu et al., 2021). The R2, RMSE, MAPE, and Er were analyzed using Equations 6–9 respectively.
Where n means the number of cases, yi means the experimental value, zi means the predicted value, means the average value of experimental values.
Pearson’s correlation coefficient was used to assess the relationships between photosynthetic pigment contents and CIELAB colorimetric parameters in P. haitanensis followed by t-test, with significant correlation set at p < 0.05. IBM SPSS Statistics 20.0 and GraphPad Prism 8 were used to perform statistical analyses of the data. Residual plot, data normality and heteroscedasticity were tested using Shapiro–Wilk test and Breusch-Pagan test by Python, respectively.
Table 1 shows the colorimetric parameters and photosynthetic pigment contents of the 100 samples at different harvesting times and origins. Among the pigments, PE (1.499–8.882 mg/g) had the highest content, followed by PC (1.402–7.634 mg/g), Chla (0.363–2.214 mg/g), and APC (0.315–1.623 mg/g). The contents of PE, PC, APC, and Chla in this study were similar to those of Che et al. (2023) who found that the PE, PC, APC, and Chla contents of wild Porphyra samples were within the range of 0.939–6.229, 0.589–4.650, 0.294–1.838, and 0.299–0.845 mg/g, respectively. In addition, the most abundant photosynthetic pigment was PE, which is consistent with a study reported by Lin and Stekoll (2011). Moreover, PE, PC, APC, and Chla values had large variations among P. haitanensis harvested at different times and locations (Table 1), which is consistent with previous reports that photosynthetic pigment content in Porphyra could be varied depending on different growth stage, radiation intensity, temperature, carbon source, pH, and NaCl concentration (Assuncao et al., 2023).
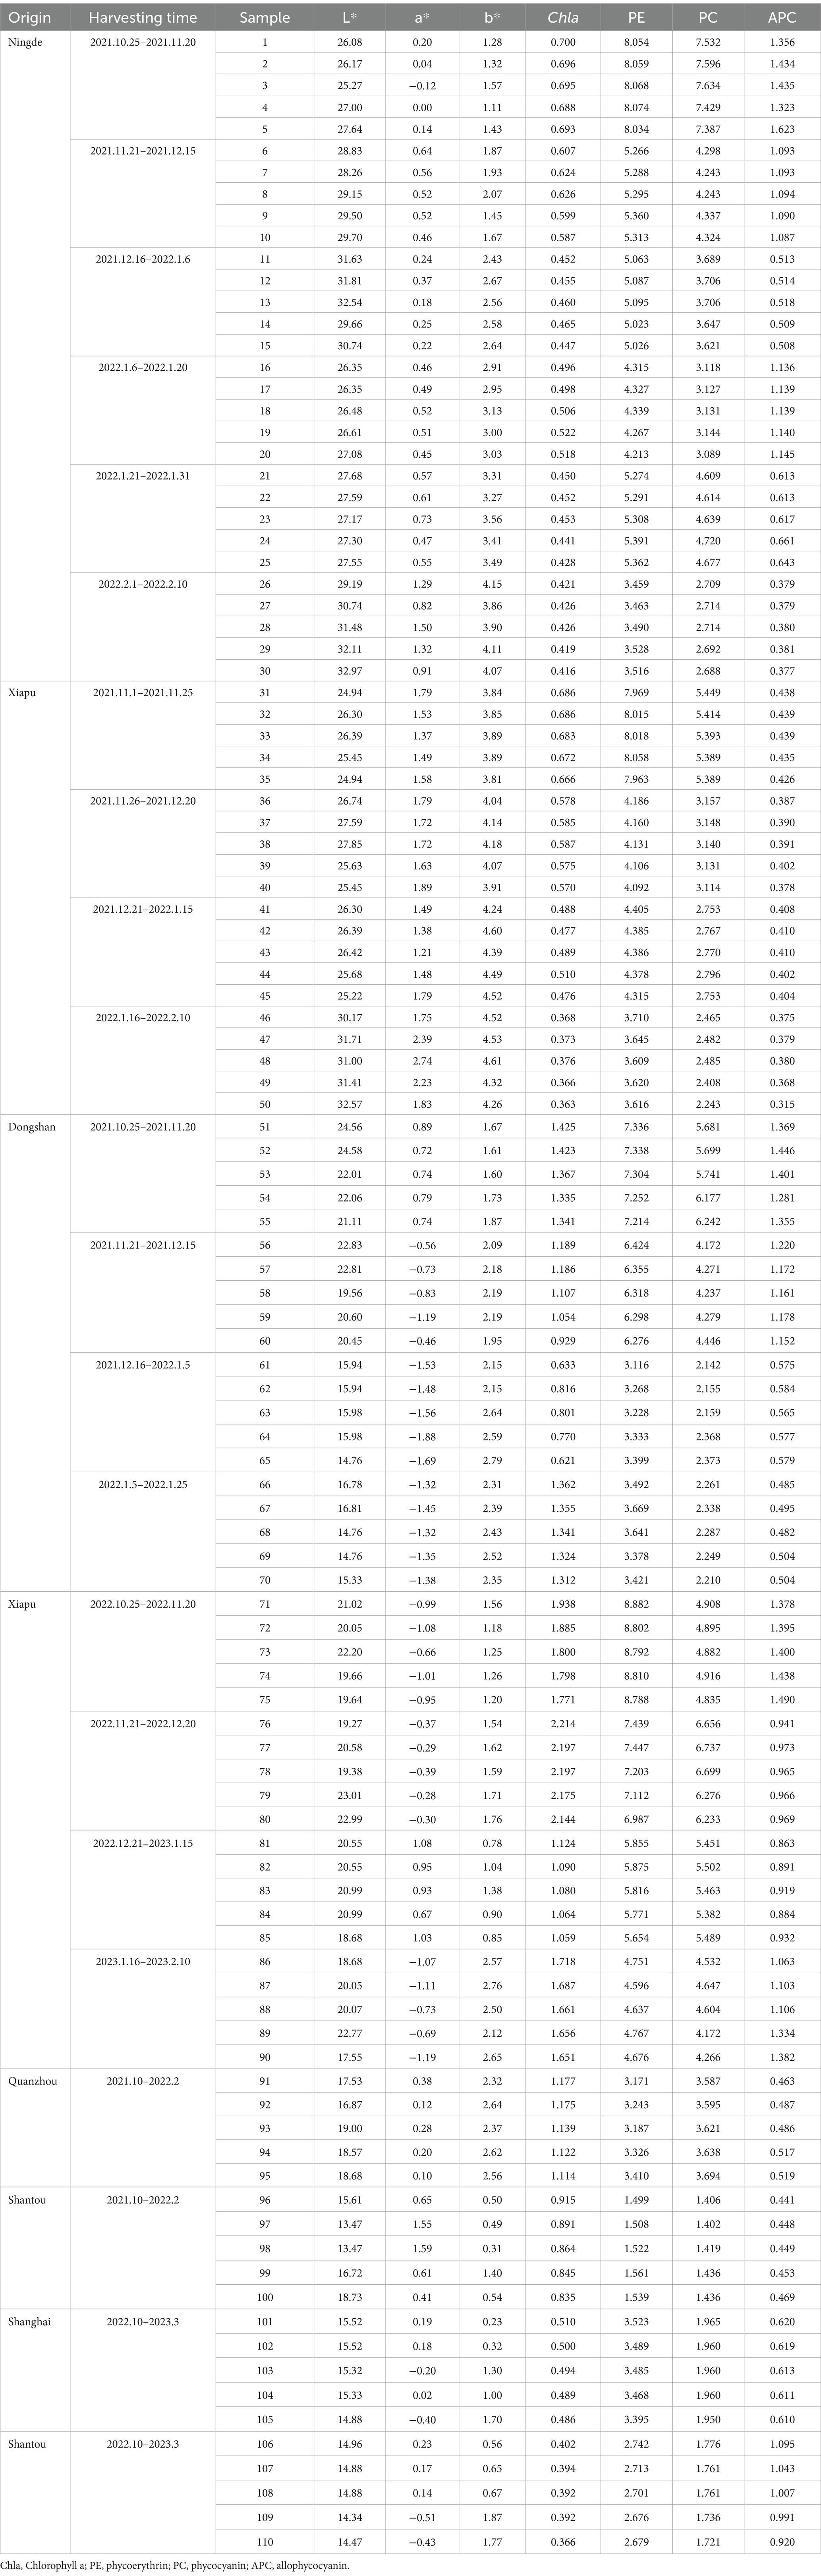
Table 1. P. haitanensis samples used for modeling (total n = 110).
As shown in Table 1, the lightness value (L*) ranged from 13.47 to 32.97 CIELAB units, the red and green value (a*) ranged from −1.88 to 2.74 CIELAB units, and the yellow and blue value (b*) ranged from 0.23 to 4.61 CIELAB units. Hwang et al. (2013) indicated that the colorimetric parameters (L*, a*, and b*) of P. haitanensis are 37.02 ± 1.38, 0.44 ± 0.11, and 1.47 ± 0.12, respectively. Xu et al. (2021) showed the P. haitanensis that were dried with vacuum freeze-drying (VFD), hot-air drying (HD), microwave drying (MD) and shade drying (SD), had L*, a*, and b* values within the range of 18.46 ~ 32.93, −0.25 ~ 1.20, and −0.35 ~ 7.22, respectively. In comparison, the colorimetric parameters (L*, a*, and b*) measured in this study were consistent with those reported by Hwang et al. (2013) and Xu et al. (2021). The colorimetric parameter (L*, a*, and b*) values varied among the 100 samples (Table 1). The variation could be attributed to the growth stage, radiation intensity, temperature, carbon source, pH and NaCl concentration, which can affect the production of photosynthetic pigments of Porphyra (Assuncao et al., 2023). Interestingly, this study revealed that the a* and b* values of P. haitanensis that was harvested at the same place, had upward trends with the increasing harvesting time, which has not been reported in previous studies, indicating a potential approach to evaluate the harvesting time of P. haitanensis that are harvested at the same place.
Pearson’s correlation coefficients were calculated to objectively assess the correlations among CIELAB colorimetric parameters and photosynthetic pigment contents (Table 2). The colorimetric parameters (L*, a*, and b*) were negatively correlated with the contents of photosynthetic pigments (Chla, PE, PC, and APC). Among them, all L*, a*, and b* values strongly correlated with Chla content. In particular, the b* value was negatively correlated with the content of each photosynthetic pigment. The correlation coefficients of b* for Chla, PE, PC, and APC were −0.573, −0.252, −0.367, and −0.596, respectively. Pearson’s correlation coefficients also indicated that the increase in photosynthetic pigment content led to a decrease in colorimetric parameters. Vázquez-Nion et al. (2013) found that the pigment contents in cyanobacteria were strongly correlated with colorimetric parameters, and that an increase in pigment contents led to a significant decrease in L* and a* values and an increase in the b*value. Sanmartín et al. (2015) have reported that the Chla, PC and APC contents in Nostoc sp. were positively correlated with b*, while L* and a* values were negatively correlated with Chla, PE, PC, and APC. In comparison, this study indicated that the photosynthetic pigments (Chla, PE, PC, and APC) of P. haitanensis were correlated with colorimetric parameters, similar to previous studies (Sanmartín et al., 2015; Vázquez-Nion et al., 2013). However, the correlation trends in this study were different from those of cyanobacteria (Sanmartín et al., 2015; Vázquez-Nion et al., 2013), which might be ascribed to that P. haitanensis phycobiliproteins and Chla concentrations were different from those of other seaweeds.
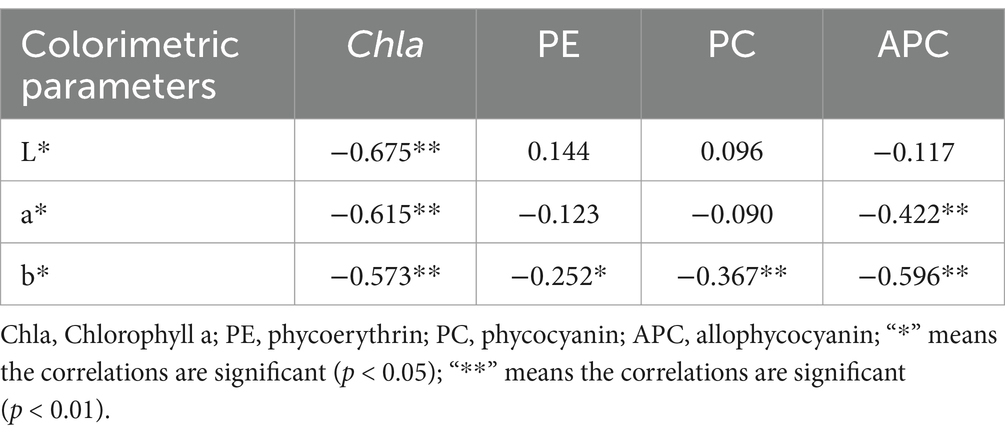
Table 2. Pearson’s correlation coefficient among CIELAB colorimetric parameters and photosynthetic pigment contents of P. haitanensis.
For MNLR analysis, the contents of photosynthetic pigments (Chla, PE, PC, and APC) and colorimetric parameters (L*, a*, and b*) were used as the dependent and independent variables, respectively. As shown in residual plots (Supplementary material), the modeling data of Chla and APC did not conform to normal distribution. However, the modeling data of PE and PC conformed to normal distribution and the residuals of the model were randomly distributed near the zero line without obvious patterns or trends, indicating a better model fit. Shapiro–Wilk test and Breusch-Pagan test were used to check the normality and homoscedasticity of residuals (Table 3), the modeling data of PE and PC conforming to normal distribution and no heteroscedasticity in the variances, but Chla and APC showed the opposite results.
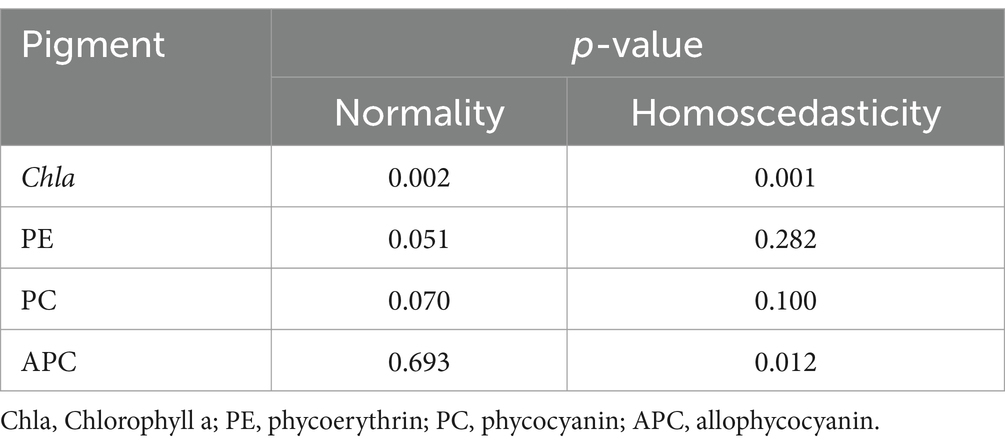
Table 3. The test for normality and heteroscedasticity in the modeling data for the pigment of P. haitanensis.
As shown in Table 4, the MNLR models had R2 values of 0.644, 0.644, 0.823, and 0.717 for PE, PC, APC, and Chla, respectively. The RMSE values were 1.127, 0.929, 0.162, and 0.272 mg/g for PE, PC, APC, and Chla, respectively. The MAPE values were 18.60, 19.19, 18.64, and 22.10% for PE, PC, APC, and Chla, respectively. The higher the R2 value and the lower the RMSE and MAPE values of the model, the better the model fit and the more accurate the prediction (Gu et al., 2022). According to professional evaluation standards, the model can predict photosynthetic pigments from various sources with high accuracy when the MAPE value is less than 10%; the model has good accuracy when the MAPE value is within the range of 10–20%; the model has reasonable predictions when the MAPE value is within the range of 20–50%; the model has bad predictions when the MAPE value is above 50% (Meade, 1983). Therefore, the models of PE, PC and APC might have the desirable fit, according to the MAPE values within the range of 10–20%; while the Chla model has a low accuracy for predicting Chla content due to MAPE value over 20%.
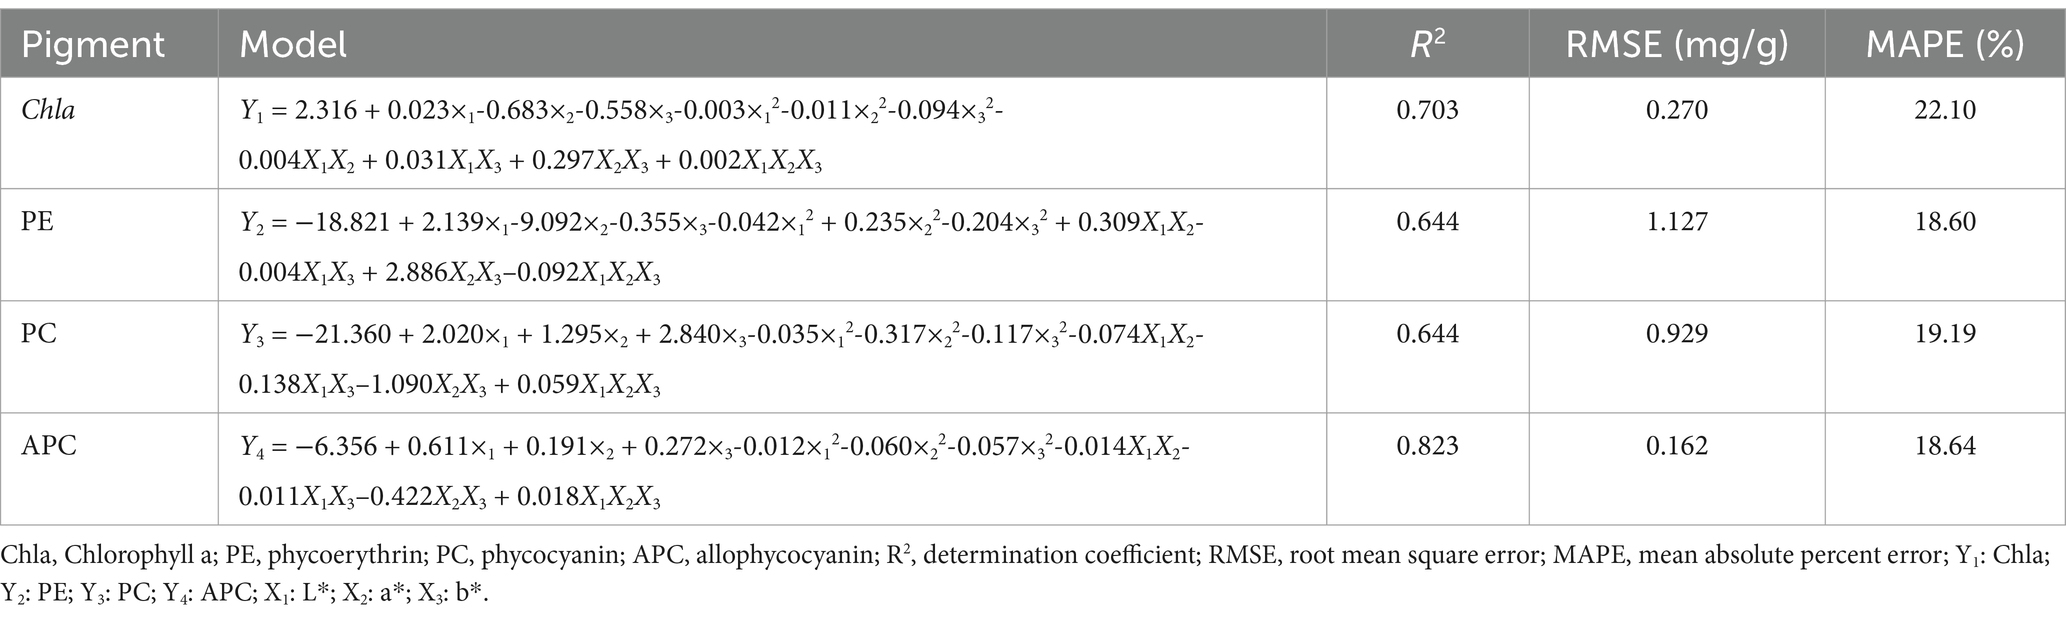
Table 4. The multiple non-linear regression (MNLR) models between the color space and pigment of P. haitanensis.
Ten samples in Table 1 were used to validate the MNLR models for estimating Chla, PE, PC and APC contents of P. haitanensis based on colorimetric parameters (L*, a*, and b*). Figure 2 shows the deviations between the measured and predicted values based on the fitted models for Chla, PE, PC, and APC. For PE, the R2, RMSE and MAPE were 0.901, 0.136 mg/g and 0.48%, respectively. For PC, the R2, RMSE and MAPE were 0.595, 0.075 mg/g and 0.06%, respectively. For APC, the R2, RMSE and MAPE were 0.823, 0.162 mg/g and 18.64%, respectively. Although the R2 for APC was greater than 0.8, the MAPE was higher than 10%, indicating a large difference between the predicted and measured values. For Chla, the R2 was 0.145, indicating insufficient prediction. In addition, the MNLR models of PE and PC showed a prediction error of less than 20% (Table 5), indicating a high prediction accuracy. In contrast, the MNLR models of APC and Chla had prediction errors of over 50% (Table 5), indicating unsatisfactory prediction.
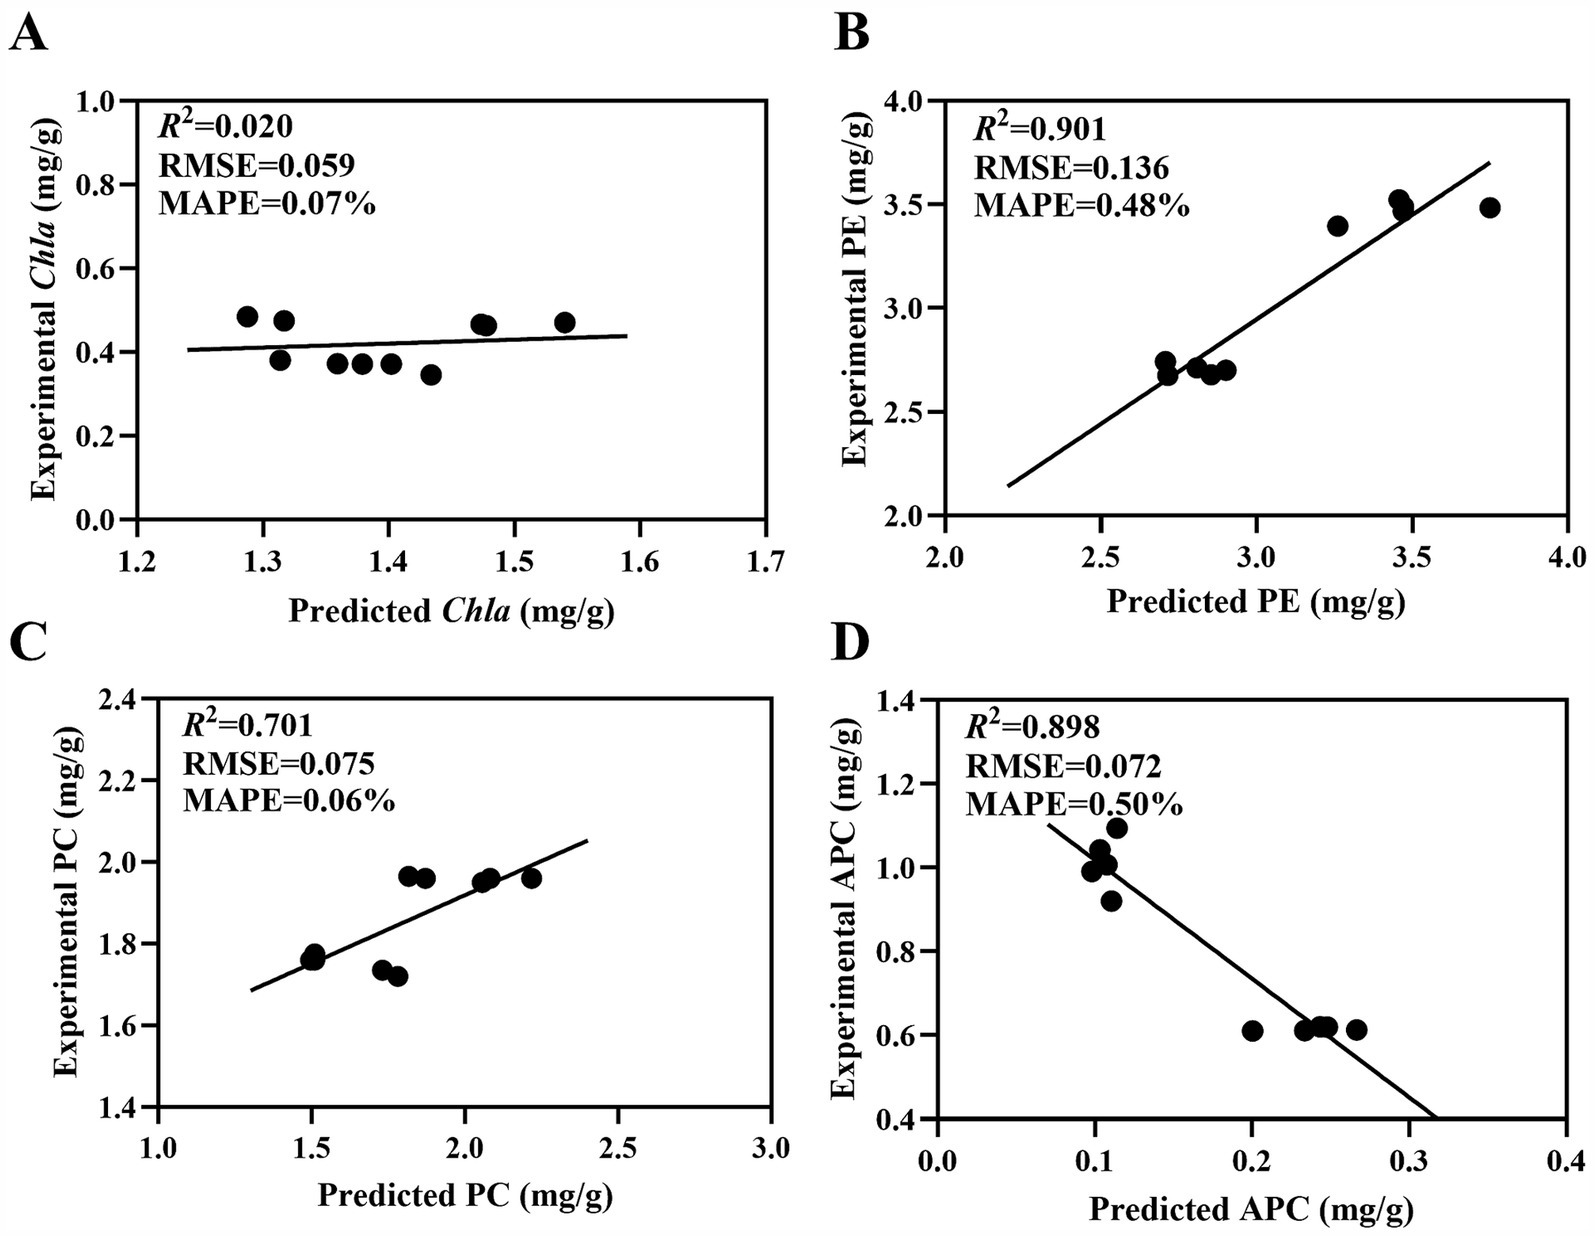
Figure 2. Predicted vs. measured values of (A) Chla, (B) PE, (C) PC, and (D) APC of P. haitanensis. Scatter diagrams and residual analysis plots of reference value vs. the predicted value of PE, PC, APC, and Chla contents in field samples using the MNLR models. R2: determination coefficient; RMSE: root mean square error; MAPE: mean absolute percent error.
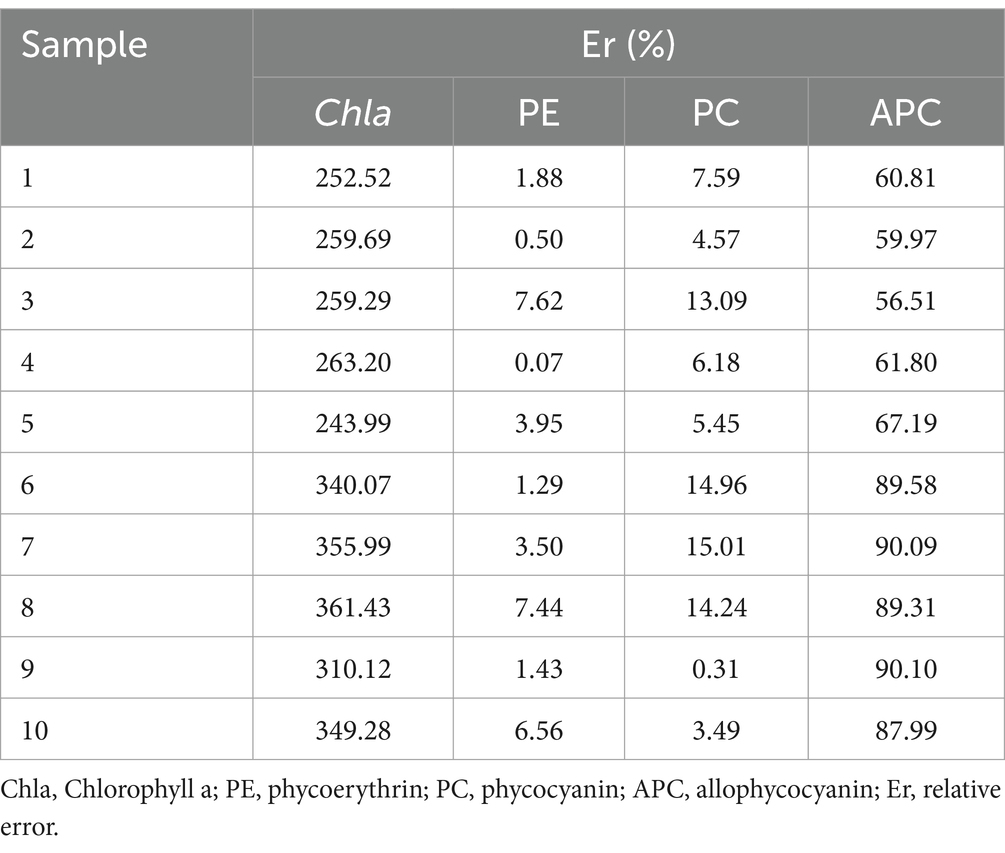
Table 5. Relative error for MNLR models of P. haitanensis between the predicted values and experimental values.
In previous studies, Vázquez-Nion et al. (2013) developed linear regression equations to predict Chla and total carotenoid content based on CIELAB color parameters. Zeng et al. (2022) established multivariate linear equations to predict biliverdin and protoporphyrin content in eggshells using the CIELAB color scale. Gila et al. (2023) developed a simple colorimetric method with MLR model for the fast and accurate estimation of carotenoid and Chla contents in virgin olive oils. Furthermore, spectroscopic techniques have also been used to determine pigment content. For example, Che et al. (2023) developed prediction models for analyzing PE, PC, APC, and Chla contents in P. yezoensis based on hyperspectral imaging technology using PLSR analysis. Duppeti et al. (2017) proposed a quantitative analysis of chlorophyll a and total carotenoids from Chlorella vulgaris, Nostoc muscorum and their mixed culture via diffuse reflectance spectroscopy. Falcioni et al. (2022) used multivariate and machine learning algorithms based on attenuated total reflectance Fourier transform infrared spectroscopy to predict the pigments in Lettuce.
In this study, MNLR models were developed to predict both PE and PC contents with satisfactory stability and accuracy based on colorimetric parameter analysis (Figure 2), indicating that the two phycobiliproteins might be detected via nondestructive measurement of the colorimetric parameters. Compared with spectroscopic techniques and traditional chemical analysis methods, the prediction of phycobiliproteins in P. haitanensis based on the determination of colorimetric parameters has various advantages, including low cost, simple operation, non-destructive manner and fast results. In addition, the present study provides new insights distinct from previous studies that focused solely on predicting carotenoid and Chla contents using colorimetric parameters. Consequently, these findings facilitate the development of novel approaches for nondestructive evaluation of P. haitanensis quality as well as other seaweeds.
The main pigments in red algae are PE and PC, which exhibit high variability depending on the different growth environments and harvesting stages (Che et al., 2023). PE is a rare macromolecular pigment-protein complex that spontaneously emits orange fluorescence. It possesses potential functions such as anti-allergy, immunomodulatory, regulation of intestinal microbiota, and induction of apoptosis in cancer cells (Li et al., 2022). As the second most abundant pigment in phycobiliproteins, PC has been extensively utilized as an active ingredient in food additives, health foods, pharmaceuticals, and cosmetics, owing to its ability to enhance human immunity and promote animal blood cell regeneration (Yu et al., 2017). Therefore, this study presents MNLR models for the rapid, simple, and nondestructive analysis of PE and PC contents in P. haitanensis. These models may contribute to the evaluation of bioactive quality not only for P. haitanensis but also for other seaweeds and their products using nondestructive approaches.
Limitations of this study include the relatively small sample size (100 modeling samples, 10 validation samples), which may affect the generalization of the model and lead to a decrease in model stability. Based on the residual analysis, it was found that the MNLR models using colorimetric parameters (L*, a*, b*) are not applicable to predict Chla and APC. In addition, this technique relies primarily on color features, which may overlook other important visual or non-visual features.
Future research directions should continue to explore the modeling of Chla and APC. Machine learning techniques such as Random Forest, Support Vector Regression, LASSO Regression, and Elastic Net Regression combined with colorimetric parameters (L*, a*, and b*) were used to establish mathematical models for predicting the content of Chla and APC. In addition, investigating the effects of environmental factors such as temperature, nitrogen content, and carbon dioxide concentration on the photosynthetic pigment content of Porphyra can improve the accuracy of prediction models. Combining specific environmental conditions with colorimetric parameters can provide a more comprehensive understanding of the quality characteristics of Porphyra and provide a basis for the culture, application and promotion of Porphyra, as well as a promising avenue of research.
This study investigated the photosynthetic pigment content and color of P. haitanensis from different harvesting times and origins. The contents of PE, PC, APC, and Chla in P. haitanensis were 1.499–8.882 mg/g, 1.402–7.634 mg/g, 0.315–1.623 mg/g, and 0.340–2.160 mg/g, respectively. The L*, a*, and b* values were 13.47–32.97, −1.88 to 2.74 and 0.23–4.61, respectively. The MNLR models based on colorimetric parameters were shown to accurately predict the contents of PE and PC with relative errors of less than 10 and 20%, respectively. MNLR models were successfully developed and validated for the first time for non-destructive analysis of PE and PC of P. haitanensis based on colorimetric parameters. Future research should focus on improving the model and developing accurate and rapid quality control methods for the industrialization and scientific application of Porphyra.
The original contributions presented in the study are included in the article/Supplementary material, further inquiries can be directed to the corresponding author.
XC: Conceptualization, Data curation, Formal analysis, Investigation, Methodology, Visualization, Writing – original draft. BY: Investigation, Supervision, Visualization, Writing – review & editing. XD: Formal analysis, Funding acquisition, Investigation, Writing – review & editing. QL: Formal analysis, Investigation, Visualization, Writing – review & editing. ZL: Formal analysis, Investigation, Writing – review & editing. YY: Supervision, Visualization, Writing – review & editing. ZJ: Supervision, Visualization, Writing – review & editing. YZ: Resources, Supervision, Writing – review & editing. HN: Formal analysis, Funding acquisition, Investigation, Writing – review & editing. XM: Investigation, Supervision, Visualization, Writing – review & editing.
The author(s) declare that financial support was received for the research, authorship, and/or publication of this article. This work was supported by the National Key R&D Program of China (2023YFD2100603).
The authors declare that the research was conducted in the absence of any commercial or financial relationships that could be construed as a potential conflict of interest.
All claims expressed in this article are solely those of the authors and do not necessarily represent those of their affiliated organizations, or those of the publisher, the editors and the reviewers. Any product that may be evaluated in this article, or claim that may be made by its manufacturer, is not guaranteed or endorsed by the publisher.
The Supplementary material for this article can be found online at: https://www.frontiersin.org/articles/10.3389/fsufs.2025.1553250/full#supplementary-material
Assuncao, J., Amaro, H. M. M., Tavares, T., Malcata, F. X., and Guedes, A. C. (2023). Effects of temperature, pH, and NaCl concentration on biomass and bioactive compound production by Synechocystis salina. Life (Basel) 13:187. doi: 10.3390/life13010187
Carvalho, D. G., Ranzan, L., Trierweiler, L. F., and Trierweiler, J. O. (2020). Determination of the concentration of total phenolic compounds in aged cachaca using two-dimensional fluorescence and mid-infrared spectroscopy. Food Chem. 329:127142. doi: 10.1016/j.foodchem.2020.127142
Celis-Pla, P. S. M., Trabal, A., Navarrete, C., Troncoso, M., Moenne, F., Zuniga, A., et al. (2022). Daily changes on seasonal ecophysiological responses of the intertidal brown macroalga Lessonia spicata: implications of climate change. Front. Plant Sci. 13:941061. doi: 10.3389/fpls.2022.941061
Che, S., Du, G., Zhong, X., Mo, Z., Wang, Z., and Mao, Y. (2023). Quantification of photosynthetic pigments in Neopyropia yezoensis using hyperspectral imagery. Plant Phenomics 5:0012. doi: 10.34133/plantphenomics.0012
Dos Santos, D. P., Sena, M. M., Almeida, M. R., Mazali, I. O., Olivieri, A. C., and Villa, J. E. L. (2023). Unraveling surface-enhanced Raman spectroscopy results through chemometrics and machine learning: principles, progress, and trends. Anal. Bioanal. Chem. 415, 3945–3966. doi: 10.1007/s00216-023-04620-y
Dumay, J., Morancais, M., Munier, M., Le Guillard, C., and Fleurence, J. (2014). Chapter eleven - Phycoerythrins: valuable proteinic pigments in red seaweeds. Adv. Bot. Res. 71, 321–343. doi: 10.1016/B978-0-12-408062-1.00011-1
Duppeti, H., Chakraborty, S., Das, B. S., Mallick, N., and Kotamreddy, J. N. R. (2017). Rapid assessment of algal biomass and pigment contents using diffuse reflectance spectroscopy and chemometrics. Algal Res. 27, 274–285. doi: 10.1016/j.algal.2017.09.016
Falcioni, R., Moriwaki, T., Gibin, M. S., Vollmann, A., Pattaro, M. C., Giacomelli, M. E., et al. (2022). Classification and prediction by pigment content in lettuce (Lactuca sativa L.) varieties using machine learning and ATR-FTIR spectroscopy. Plants (Basel) 11:3413. doi: 10.3390/plants11243413
Gila, A. M., Aguilera, M. P., Sánchez-Ortiz, A., Jiménez, A., and Beltrán, G. (2023). A rapid estimation of pigment content in virgin olive oils by a solvent-free method. Eur. J. Lipid Sci. Technol. 125:2300042. doi: 10.1002/ejlt.202300042
Gu, C., Ji, S., Xi, X., Zhang, Z., Hong, Q., Huo, Z., et al. (2022). Rice yield estimation based on continuous wavelet transform with multiple growth periods. Front. Plant Sci. 13:931789. doi: 10.3389/fpls.2022.931789
Hwang, E. S., Ki, K. N., and Chung, H. Y. (2013). Proximate composition, amino acid, mineral, and heavy metal content of dried laver. Prev. Nutr. Food Sci. 18, 139–144. doi: 10.3746/pnf.2013.18.2.139
Ji, C., Pan, C., Huang, H., Tao, F., Lin, S., Chen, S., et al. (2022). Effects of origin and harvest period on characterisation, structure and antioxidant activity of polysaccharides derived from Porphyra haitanensis. Int. J. Food Sci. Technol. 57, 123–136. doi: 10.1111/ijfs.15349
Juin, C., Chérouvrier, J. R., Thiéry, V., Gagez, A. L., Bérard, J. B., Joguet, N., et al. (2015). Microwave-assisted extraction of phycobiliproteins from Porphyridium purpureum. Appl. Biochem. Biotechnol. 175, 1–15. doi: 10.1007/s12010-014-1250-2
Li, C., Wu, H., Xiang, W., Wu, H., Wang, N., Wu, J., et al. (2022). Comparison of production and fluorescence characteristics of phycoerythrin from three strains of Porphyridium. Food Secur. 11:2069. doi: 10.3390/foods11142069
Lin, R., and Stekoll, M. S. (2011). Phycobilin content of the conchocelis phase of alaskan porphyra (Bangiales, Rhodophyta) species: responses to environmental variables. J. Phycol. 47, 208–214. doi: 10.1111/j.1529-8817.2010.00933.x
Liu, Q., Ma, C., Wei, K., Tu, K., and Pan, L. (2021). Quantitative determination of sugar profiles in peach fruit during storage by an integrating sphere system. J. Food Compos. Anal. 98:103843. doi: 10.1016/j.jfca.2021.103843
Meade, N. (1983). Industrial and business forecasting methods, Lewis, C.D., borough green, Sevenoaks, Kent: Butterworth, 1982. J. Forecast. 2, 194–196. doi: 10.1002/for.3980020210
Munier, M., Jubeau, S., Wijaya, A., Morancais, M., Dumay, J., Marchal, L., et al. (2014). Physicochemical factors affecting the stability of two pigments: R-phycoerythrin of Grateloupia turuturu and B-phycoerythrin of Porphyridium cruentum. Food Chem. 150, 400–407. doi: 10.1016/j.foodchem.2013.10.113
Niu, J. F., Chen, Z. F., Wang, G. C., and Zhou, B. C. (2010). Purification of phycoerythrin from Porphyra yezoensis Ueda (Bangiales, Rhodophyta) using expanded bed absorption. J. Appl. Phycol. 22, 25–31. doi: 10.1007/s10811-009-9420-2
Prabha, S., Vijay, A. K., Devarajan, A., and George, B. (2023). Concurrent purification of phycobiliproteins from Leptolyngbya sp. and their selective enhancement in response to different wavelengths of LED light. Bioresour. Technol. Rep. 21:101299. doi: 10.1016/j.biteb.2022.101299
Rajapakse, N., and Kim, S. K. (2011). Nutritional and digestive health benefits of seaweed. Adv. Food Nutr. Res. 64, 17–28. doi: 10.1016/b978-0-12-387669-0.00002-8
Rengasamy, K. R., Mahomoodally, M. F., Aumeeruddy, M. Z., Zengin, G., Xiao, J., and Kim, D. H. (2020). Bioactive compounds in seaweeds: an overview of their biological properties and safety. Food Chem. Toxicol. 135:111013. doi: 10.1016/j.fct.2019.111013
Rigolon, T. C. B., de Barros, F. A. R., Vieira, É., and Stringheta, P. C. (2020). Prediction of total phenolics, anthocyanins and antioxidant capacity of blackberry (Rubus sp.), blueberry (Vaccinium sp.) and Jaboticaba (Plinia cauliflora (Mart.) Kausel) skin using colorimetric parameters. Food Sci. Technol. 40, 620–625. doi: 10.1590/fst.34219
Ritchie, R. J. (2006). Consistent sets of spectrophotometric chlorophyll equations for acetone, methanol and ethanol solvents. Photosynth. Res. 89, 27–41. doi: 10.1007/s11120006-9065-9
Sanmartín, P., Villa, F., Polo, A., Silva, B., Prieto, B., and Cappitelli, F. (2015). Rapid evaluation of three biocide treatments against the cyanobacterium Nostoc sp PCC 9104 by color changes. Ann. Microbiol. 65, 1153–1158. doi: 10.1007/s13213-014-0882-3
Sant’Anna, V., Gurak, P. D., Ferreira Marczak, L. D., and Tessaro, I. C. (2013). Tracking bioactive compounds with colour changes in foods - a review. Dyes Pigments 98, 601–608. doi: 10.1016/j.dyepig.2013.04.011
Sharifuddin, Y., Chin, Y. X., Lim, P. E., and Phang, S. M. (2015). Potential bioactive compounds from seaweed for diabetes management. Mar. Drugs 13, 5447–5491. doi: 10.3390/md13085447
Shi, Y., Pei, F., Zhou, L. Y., Yang, F. M., and Hu, Q. H. (2015). Optimization of phycoerythrin extraction from lavers by mixed enzymes using response surface methodology. Food Sci. 36, 51–57. doi: 10.7506/spkx1002-6630-201506010
Soni, B., Kalavadia, B., Trivedi, U., and Madamwar, D. (2006). Extraction, purification and characterization of phycocyanin from Oscillatoria quadripunctulata—isolated from the rocky shores of bet-Dwarka, Gujarat, India. Process Biochem. 41, 2017–2023. doi: 10.1016/j.procbio.2006.04.018
Tan, H. T., Khong, N. M. H., Khaw, Y. S., Ahmad, S. A., and Yusoff, F. M. (2020). Optimization of the freezing-thawing method for extracting phycobiliproteins from Arthrospira sp. Molecules 25:3894. doi: 10.3390/molecules25173894
Torres-Sánchez, R., Martínez-Zafra, M. T., Castillejo, N., Guillamón-Frutos, A., and Artés-Hernández, F. (2020). Real-time monitoring system for shelf life estimation of fruit and vegetables. Sensors 20:1860. doi: 10.3390/s20071860
Vahtmae, E., Kotta, J., Orav-Kotta, H., Kotta, I., Parnoja, M., and Kutser, T. (2018). Predicting macroalgal pigments (chlorophyll a, chlorophyll b, chlorophyll a + b, carotenoids) in various environmental conditions using high-resolution hyperspectral spectroradiometers. Int. J. Remote Sens. 39, 5716–5738. doi: 10.1080/01431161.2017.1399481
Vázquez-Nion, D., Sanmartín, P., Silva, B., and Prieto, B. (2013). Reliability of color measurements for monitoring pigment content in a biofilm-forming cyanobacterium. Int. Biodeterior. Biodegrad. 84, 220–226. doi: 10.1016/j.ibiod.2012.05.037
Wu, Y. T., Huo, Y. F., Xu, L., Xu, Y. Y., Wang, X. L., and Zhou, T. (2020). Purification, characterization and antioxidant activity of polysaccharides from Porphyra haitanensis. Int. J. Biol. Macromol. 165, 2116–2125. doi: 10.1016/j.ijbiomac.2020.10.053
Xu, D. L., Sun, N., Xuan, S. F., Wang, C., Huang, T., Li, C., et al. (2021). Effect of different drying methods on the physicochemical properties and phycobiliprotein structure of Porphyra haitanensis. Int. J. Food Eng. 17, 111–120. doi: 10.1515/ijfe-2020-0081
Yu, P., Wu, Y. T., Wang, G. W., Jia, T. M., and Zhang, Y. S. (2017). Purification and bioactivities of phycocyanin. Crit. Rev. Food Sci. Nutr. 57, 3840–3849. doi: 10.1080/10408398.2016.1167668
Zeng, L., Xu, G., Jiang, C., Li, J., and Zheng, J. (2022). Research note: L*a*b* color space for prediction of eggshell pigment content in differently colored eggs. Poult. Sci. 101:101942. doi: 10.1016/j.psj.2022.101942
Zhang, H. B., Chen, T. F., Jiang, J., Wong, Y. S., Yang, F., and Zheng, W. J. (2011). Selenium-containing allophycocyanin purified from selenium-enriched Spirulina platensis attenuates AAPH-induced oxidative stress in human erythrocytes through inhibition of ROS generation. J. Agric. Food Chem. 59, 8683–8690. doi: 10.1021/jf2019769
Zhao, M. R., Sun, L., Fu, X. J., and Chen, M. (2019). Phycoerythrin-phycocyanin aggregates and phycoerythrin aggregates from phycobilisomes of the marine red alga Polysiphonia urceolata. Int. J. Biol. Macromol. 126, 685–696. doi: 10.1016/j.ijbiomac.2018.12.109
Zhao, Y. J., and Tang, Y. C. (2012). Separation, purification and anti-aging activity of phycocyanin from Porphyra yezoensis. Food Sci. 33, 94–97.
MNLR – Multivariate nonlinear regression
Chla – Chlorophyll a
PE – Phycoerythrin
PC – Phycocyanin
APC – Allophycocyanin
R2 – Determination coefficient
RMSE – Root mean square error
MAPE – Mean absolute percent error
Er – Relative error
X1 – L*
X2 – a*
X3 – b*
bi – The fitting constant of particle i
Y1 – The content of chlorophyll a
Y2 – The content of phycoerythrin
Y3 – The content of phycocyanin
Y4 – The content of allophycocyanin
n – The number of cases
yi – The experimental value of particle i
zi – The predicted value of particle i
– The average value of experimental values
Keywords: Porphyra haitanensis, phycobiliproteins, chlorophyll a, colorimetric parameters, multiple non-linear regression, model
Citation: Chen X, Yang B, Du X, Li Q, Li Z, Yang Y, Jiang Z, Zhu Y, Ni H and Miao X (2025) Rapid prediction of Porphyra photosynthetic pigments based on colorimetric parameters. Front. Sustain. Food Syst. 9:1553250. doi: 10.3389/fsufs.2025.1553250
Edited by:
Guadalupe Virginia Nevárez-Moorillón, Autonomous University of Chihuahua, MexicoReviewed by:
Hany El-Mesery, Jiangsu University, ChinaCopyright © 2025 Chen, Yang, Du, Li, Li, Yang, Jiang, Zhu, Ni and Miao. This is an open-access article distributed under the terms of the Creative Commons Attribution License (CC BY). The use, distribution or reproduction in other forums is permitted, provided the original author(s) and the copyright owner(s) are credited and that the original publication in this journal is cited, in accordance with accepted academic practice. No use, distribution or reproduction is permitted which does not comply with these terms.
*Correspondence: Xiongping Miao, c3pteHAyMDAzQDE2My5jb20=
Disclaimer: All claims expressed in this article are solely those of the authors and do not necessarily represent those of their affiliated organizations, or those of the publisher, the editors and the reviewers. Any product that may be evaluated in this article or claim that may be made by its manufacturer is not guaranteed or endorsed by the publisher.
Research integrity at Frontiers
Learn more about the work of our research integrity team to safeguard the quality of each article we publish.