 Xiaonan Wang*
 Yi Lu
Yi Lu- School of Economics and Management, Nanjing Agricultural University, Nanjing, China
Introduction: Major food-importing countries are characterized by highly concentrated import sources, which easily exposes them to risks of food supply shortages due to over-reliance on a limited number of source countries.
Methods: Using China’s soybean imports as a case study, this study proposes a novel analytical framework that specifically addresses the unique characteristics of agricultural products. A multi-objective optimization model is employed to both validate the framework’s rationality and explore optimization schemes for China’s import source layout.
Results and discussion: The results indicate that, first, neglecting seasonal factors in optimizing China’s soybean import source layout may increase fluctuations in soybean import quantities. The import optimization considering seasonal factors can reduce risks at equivalent costs while ensuring import stability. Second, increased soybean export availability from Russia or Kazakhstan can further reduce risks at equivalent costs while ensuring the stability of soybean imports. This study establishes an analytical framework for optimizing import layout that conforms to the unique characteristics of agricultural products, aiming to achieve sustainable food supply and ensure food security in importing countries.
1 Introduction
Ensuring food security is a top priority for national stability and people’s livelihoods (Zhao and Qu, 2024; Hamulczuk et al., 2023). In the face of the uneven distribution of global food production and consumption, international trade has become an important means to ensure global food security (Wassénius et al., 2023). According to the World Trade Organization (WTO), one in every six people worldwide depends almost entirely on international trade for their food supply, a proportion that could rise to 50% by 2050 (WTO, 2021). At the same time, countries highly dependent on food imports exhibit geographically concentrated sourcing patterns (e.g., China, Indonesia and Malaysia import soybeans, Vietnam and Egypt import corn). In the context of growing uncertainties in international food markets (Chen et al., 2023), this highly concentrated import pattern could easily expose importing countries to risks of food supply shortages due to over-reliance on a limited number of source countries.
World soybean production and exports are highly concentrated in the United States, Brazil and Argentina. From 2001 to 2022, the soybean production concentration and export concentration of these three countries are 80 and 90%, respectively. At present, China is the world’s largest soybean consumer, with a self-sufficiency rate of less than 20%. After China’s accession to the WTO, its soybean imports expanded significantly—from 13.94 million tons in 2001 to 91.08 million tons in 2022, with an average annual growth rate of 9.35%. Meanwhile, although the number of source countries for China’s soybean imports increased from 9 in 2011 to 15 in 2022, the concentration of China’s soybean imports from the United States and Brazil did not decrease but instead increased, rising from 81.69% in 2011 to 92.14% in 2022. For China, adjusting soybean import sources to reduce concentration and diversify risks remains a pressing and ongoing challenge. Thus, China’s soybean import market serves as a representative case study for this issue.
Some scholars have explored strategies to reduce food import risks in relevant countries. Le Mouël et al. (2023) and Kiloes et al. (2024) respectively used a biomass balance model and a systems thinking approach to explore feasible ways of reducing import dependence in the Middle East and North Africa, and in Indonesia. Ritzel et al. (2024) proposed a multifactorial and standardized import vulnerability index for monitoring food supply security in food-importing countries. Faced with the hidden risks stemming from China’s highly concentrated soybean import sources, scholars have conducted research on adjusting and optimizing China’s soybean import source layout. Some scholars have explored possible ways to adjust and optimize China’s soybean import source layout by developing single-dimension risk indices, including: dependence degree of exporting countries (Zhao et al., 2021), disruption risks at crucial points in trade routes (Wang, 2017, 2018), import dependence risks (Liu, 2015) and import concentration risks (Li et al., 2022). However, optimization frameworks based on single-dimension risk index often lack comprehensive consideration. Some scholars have realized the necessity to establish multi-dimensional import risk index system. Wei et al. (2021) and Liu et al. (2024) analyzed the optimization path of China’s soybean import source layout under the objective of minimizing import risks by constructing a soybean import risk index system. In the field of energy research, which is the same primary product as soybean, abundant empirical studies have investigated the risks and costs of energy imports (Ge et al., 2024; Sun et al., 2022; Geng et al., 2017), providing valuable insights for optimizing import source layout of agricultural products. Based on this, Lu et al. (2022) further investigated the optimization of China’s soybean imports source layout by simultaneously considering both import risk and cost objectives. Ge et al. (2025) proposed that product quality should not be neglected alongside import risk and cost, subsequently discussing the optimization strategy of China’s soybean import source layout from the triple objective of minimum risk, lowest cost and highest quality. On the whole, past studies have examined China’s soybean import source optimization by focusing on single-dimension risk, comprehensive import risk indices, considering both import risk and cost, and considering risk, cost and quality.
Calculations based on UN Comtrade statistics reveal that China mainly imports soybeans from major producing countries such as Brazil and Argentina in the southern hemisphere from April to September, and from major producing countries such as the United States in the northern hemisphere from October to March of the following year. This demonstrates that China’s soybean imports from southern and northern hemisphere countries exhibit a distinct seasonal pattern. Therefore, any adjustment of China’s soybean import source layout is likely to affect the seasonal distribution of soybean imports in a year,1 thereby impacting the stability of its soybean import supply. Lin et al. (2015) have also indicated that we should pay attention to the differences in production seasons and export time among import source countries, and promote the seasonal diversification of import sources, rather than just expanding import source channels. However, few studies have considered the significance of seasonal factors in optimizing soybean import source layout. Ignoring seasonal factors could impact the scientific decision-making process for soybean import source layout optimization, potentially leading to biased decision-making. In addition, import risk is likely to increase due to the highly concentrated import pattern but there is a certain economic rationality (Ye, 2018). That is, by adjusting and optimizing import source layout, import risks can be reduced while import costs may increase. Therefore, the optimization of soybean import source layout should not ignore import costs while paying attention to import risks, so as to prevent excessive increase of import costs.
This study takes the optimization of China’s soybean import source layout as a research case. The findings aim to provide possible references for China to diversify import risks, while offering new insights and perspectives on optimizing food import source layout for countries facing similar challenges. Specifically, this study first analyzes the seasonal characteristics of global soybean production and China’s soybean import patterns. Then, a risk assessment index system for China’s soybean imports is established to measure import risks from various source countries. Finally, an analytical framework is created considering seasonal factors to optimize the layout of soybean import sources, discussing the optimization under actual situation. Given that global soybean production and exports remain concentrated in a few countries, seasonal factors may leave limited room for adjustments and optimizations. Therefore, the optimization of soybean import source layout under the scenario of increasing soybean supply capacity of related source countries is further discussed.
2 Seasonal characteristics of global soybean production and soybean import pattern in China
2.1 Analysis of seasonal characteristics of global soybean production
As shown in Table 1, major soybean-producing countries in the southern hemisphere (e.g., Brazil and Argentina) start planting in September or October and harvesting in March of the following year. In contrast, northern hemisphere producers such as the United States and Canada start planting in April or May and harvesting in August, September or October. Since soybeans are a bulk agricultural product that incur high storage costs, exporting countries tend to prioritize large-quantity exports during their domestic production seasons, while reducing soybean exports during non-production seasons due to increased costs. This results in seasonal characteristics in soybean exports between northern and southern hemisphere countries. From 2020 to 2022, soybean production in the southern hemisphere exceeded that of the northern hemisphere among the seven countries listed in Table 1, with supply levels from March to May surpassing those from August to October.

Table 1. Soybean production status in major producing countries worldwide.
2.2 Analysis of soybean import pattern in China
Overall, since joining the WTO, China’s soybean imports have increased continuously, and the number of source countries has risen gradually from 8 in 2001 to 15 in 2022 (see Table 2). Although China has reduced the market concentration of the top three suppliers by diversifying its import sources, the decline is relatively modest. Specifically, the three-country concentration ratio (CR3) decreased from 99.77% in 2001 to 96.15% in 2022. It is worth noting that the proportion of China’s soybean imports from the United States and Brazil has increased rather than decreased, rising from 63.75% in 2001 to 92.14% in 2022. This suggests that the rise in the number of soybean import source countries has failed to effectively reduce market concentration.
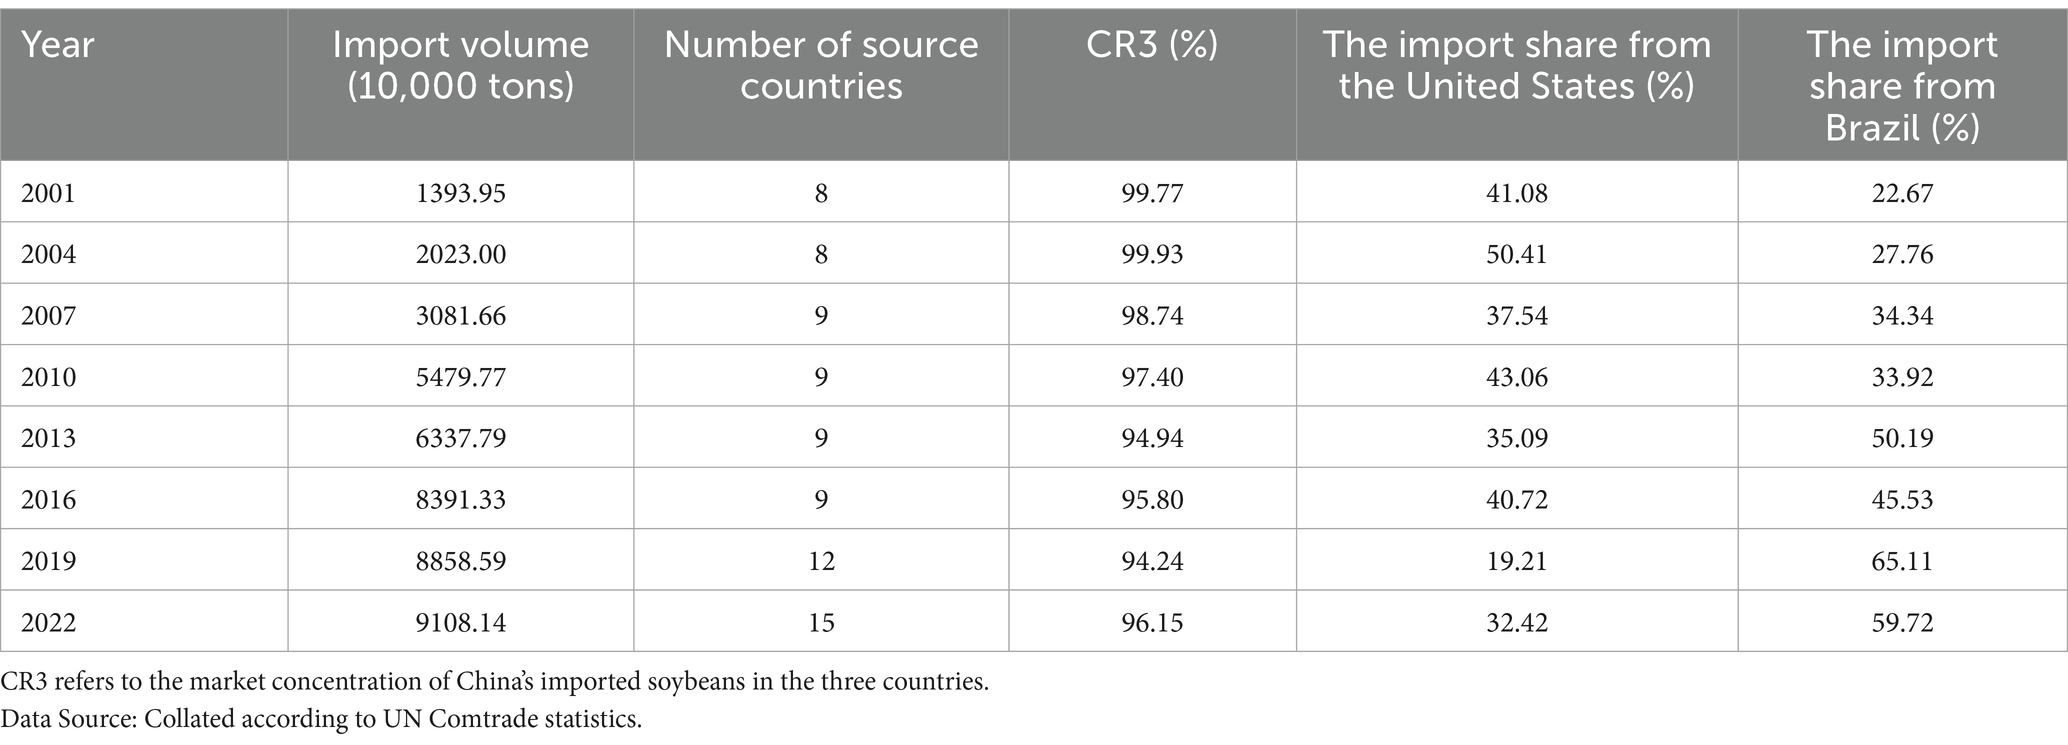
Table 2. Number of soybean import source countries and import market concentration in China from 2001 to 2022.
Seasonally, China’s soybean imports from the southern and northern hemisphere show obvious seasonal characteristics (as shown in Supplementary Figure 1). Specifically, China’s soybean imports from northern hemisphere countries such as the United States and Canada are mainly concentrated in the first and fourth quarters, while imports from southern hemisphere countries such as Brazil and Argentina are mainly concentrated in the second and third quarters. This is mainly affected by the seasonal characteristics of soybean production in each source country.
Given the seasonal characteristics of China’s soybean imports from the southern and northern hemispheres, it is necessary to clarify the concentration of China’s soybean imports from each hemisphere, respectively. As can be seen from Table 3, since joining the WTO, China has gradually increased the number of soybean source countries in the southern and northern hemispheres, from 2 and 6 in 2001 to 5 and 10 in 2022, respectively. However, China’s soybean imports from the southern hemisphere are still mainly concentrated in Brazil, while those from the northern hemisphere are still mainly concentrated in the United States, with an even more pronounced concentration in the northern hemisphere. This highly concentrated import pattern in both southern and northern hemispheres could exacerbate the risk of seasonal supply shortages for China.
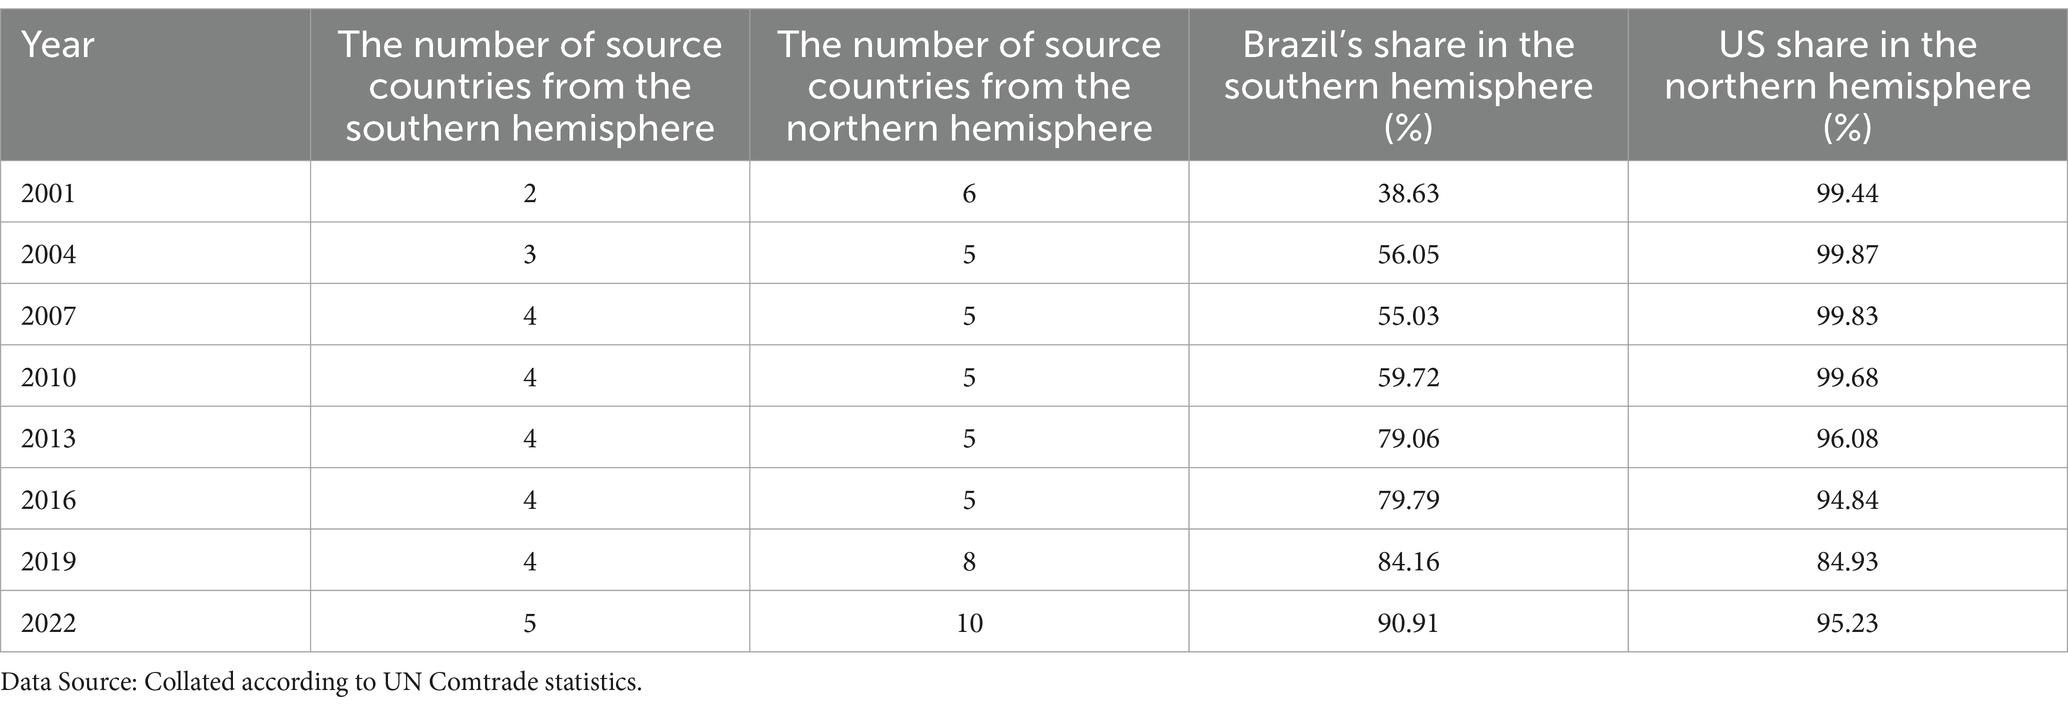
Table 3. Number of source countries and market concentration of China’s soybean imports from the southern and northern hemispheres from 2001 to 2022.
3 Risk analysis of soybean import in China
3.1 Import risk evaluation index system
The upstream and downstream stages of a supply chain are interconnected. Any problem in any stage can affect safe operation of the entire supply chain and may even lead to supply chain interruption. Therefore, independent risk evaluation of any stage is not enough to comprehensively evaluate product import risks. Based on the studies of Ding and Xu (2022) and Zhang et al. (2013), this study develops an evaluation system for China’s soybean import risk from a supply chain perspective. It mainly includes the supply stage risk of whether international grain is “available,” the transportation stage risk of whether international grain is “accessible,” and the demand stage risk representing the dependence of importing countries on international grain.
3.1.1 Risks in the supply stage
Resource availability, domestic political situations in exporting countries, and bilateral relations between importing and exporting countries are the main factors that determine supply stage risks (Zhang et al., 2013; Kong et al., 2019; Ge et al., 2024).
The soybean availability risk in exporting countries reflects their soybean export capacity. Although market thickness reflects the proportion of a country’s soybean production allocated to exports, this measure alone proves insufficient. Even with high market thickness, minimal production cannot substantiate strong export capacity. Therefore, following the methodology of Chen et al. (2021b), this study uses the product of the source country’s soybean market thickness and its share of global soybean exports to represent this country’s soybean availability. As shown in Equation 1.
Where ARi represents the soybean availability risk of import source country i. Ei represents the soybean export quantity from import source country i, Pi represents the soybean production of import source country i, and Ew represents the total world export quantity of soybeans. The higher the value of , the higher the availability. The inverse value of indicates the availability risk.
If the political situation in exporting country is unstable, the products imported from that country may face the risk of disruption. Therefore, the political risk of exporting country plays a critical role in determining product supply security for importing country. As shown in Equation 2.
Where PRi represents the political risk of import source country i. The political situation of a country can be quantified through the political risk rating of import source country i, with values ranging from 0 to 100. The higher the value, the higher the political stability. Transforming it into (100/ICRGi) stands for political risk.
In the context of deepening economic globalization, international trade and economic interactions are highly dependent on bilateral relations. China’s foreign trade environment is complex and volatile, as trade flows are frequently constrained by events related to bilateral relations (Wang et al., 2021). Therefore, the relationship between trading partners is a key determinant of the supply security for the importing country’s products. As shown in Equation 3.
Where BRi represents the bilateral relations risk between China and import source country i. BRi is measured by the absolute distance of the ideal voting point in the United Nations General Assembly between China and import source country i. The smaller the value, the closer the bilateral relationship between the two countries.
3.1.2 Risks in the transport stage
Transportation risk mainly reflects the possibility of supply interruption caused by various factors during the transportation process. It is used to measure the risk existing in the transportation route from import source country to importing country. This study mainly measures the transportation risk through the transportation distance and passage risks of key transportation nodes. As shown in Equation 4.
Where TRi represents the transportation risk from import source country i to China. First, the longer the transportation distance, the greater the uncertainty and potential risks. Di represents the route distance from import source country i to China, Dmax represents the longest route distance from the selected soybean import source countries to China, and then the risk brought by the transportation distance is indicated by (Di/Dmax). Second, the Strait of Malacca is vital to ensure the security of China’s soybean imports.2 MR and MRmax respectively represent the average political-military index and the maximum average political-military index of Singapore, Malaysia, and Indonesia, the three countries jointly managing the strait. α is a dummy variable, the shipping route passes through the Strait of Malacca, α = 1, otherwise, α = 0. The higher the political-military index value, the lower the political-military risk. To be consistent with the direction of other values, following the approach of Zhang et al. (2013), the passage risk of the Strait of Malacca is denoted by (MRmax/MR) α . Third, factors such as geopolitical conflicts, extreme weather disasters and human-induced damage may lead to interruptions in key transportation nodes. Therefore, the more transportation nodes passed through, the higher the transportation risk incurred (Li et al., 2015). Ni represents the number of key transportation nodes passing from import source country i to China,3 Nmax represents the maximum number of key transportation nodes from the selected soybean import source countries to China, and (Ni/Nmax) represents the risk of passing through the transportation node.
3.1.3 Risks in the demand stage
The measurement of import dependence risk is based on the study of Wei et al. (2021), incorporating bidirectional dependency analysis between importing and exporting countries. The dependency level Mi of the importing country on source country i is expressed as the product of the following three indicators. First, the ratio of soybean imports of the importing country to its domestic soybean production. Second, the share of soybeans imported by an importing country from an exporting country in its total imports. Third, the share of the quantity of soybeans exported by the exporting country in the world market. The dependency level Ei of source country i on the importing country is expressed as the product of the following three indicators. First, the ratio of soybean exports from the exporting country to its domestic production. Second, the share of the exporting country’s exports to a destination country in its total exports. Third, the world market share of imported soybeans by importing countries. If Mi/Ei > 1, it indicates that the importing country is more dependent on the exporting country; if Mi/Ei < 1, it indicates that the exporting country is more dependent on the importing country.
3.2 Analysis of import risk
Based on the evaluation index system of China’s soybean import risk constructed above, this study uses the entropy method4 to weight each index and calculates the risk of China’s soybean import from each source country. This process lays the foundation for optimizing the soybean import sources layout. According to the UN Comtrade statistics, the soybean exports of the United States, Brazil, Argentina, Canada, Uruguay, Russia, and Ukraine have all ranked in the global top ten since 2015. Moreover, China’s soybean imports from these seven countries account for over 99% of its total soybean imports. Therefore, this study calculates the risk of China’s soybean imports from these seven countries from 2011 to 2020. Annual soybean import and export data of various countries are sourced from the UN Comtrade database; annual soybean production of various countries are sourced from the FAO database; annual country risk of various countries and political-military index of related countries are sourced from the International Country Risk Guide (ICRG) published by PRS. The data for calculating bilateral relations is sourced from the United Nations General Assembly Voting Data. Based on the maritime shipping routes for the import of China’s agricultural products, the Netpas Distance software is used to calculate the route distances and the number of key transportation nodes from various import source countries’ ports to China’s ports.
As shown in Table 4, firstly, from 2011 to 2020, the risk of importing soybeans from the United States and Brazil was higher than that from other countries. This was mainly because China’s dependency risk on soybean imports from these two countries was significantly higher than its dependency risk on imports from other countries. Secondly, while China faces the highest risk when importing soybeans from Brazil among southern hemisphere source countries, the northern hemisphere’s highest risk originates from the United States. Finally, the risk of China’s soybean imports from Brazil showed an upward trend, peaking in 2018. This was mainly driven by the US-China trade disputes in 2018, which prompted a significant shift in imports to Brazil, further intensifying China’s dependence on Brazil. Meanwhile, due to the seasonal characteristics of soybean production, changes in China’s soybean import source layout are likely to affect the seasonal distribution of soybean imports quantity within a year. If China mainly imports soybeans from northern hemisphere source countries, the imports will primarily be concentrated in the first and fourth quarters; if imports are dominated by southern hemisphere source countries, they will primarily be concentrated in the second and third quarters. This will affect the stability and continuity of soybean supply in China. This indicates that optimizing China’s soybean import source layout should not only consider risks faced during the supply, transport and demand stages but also account for import quantity fluctuations caused by such changes.
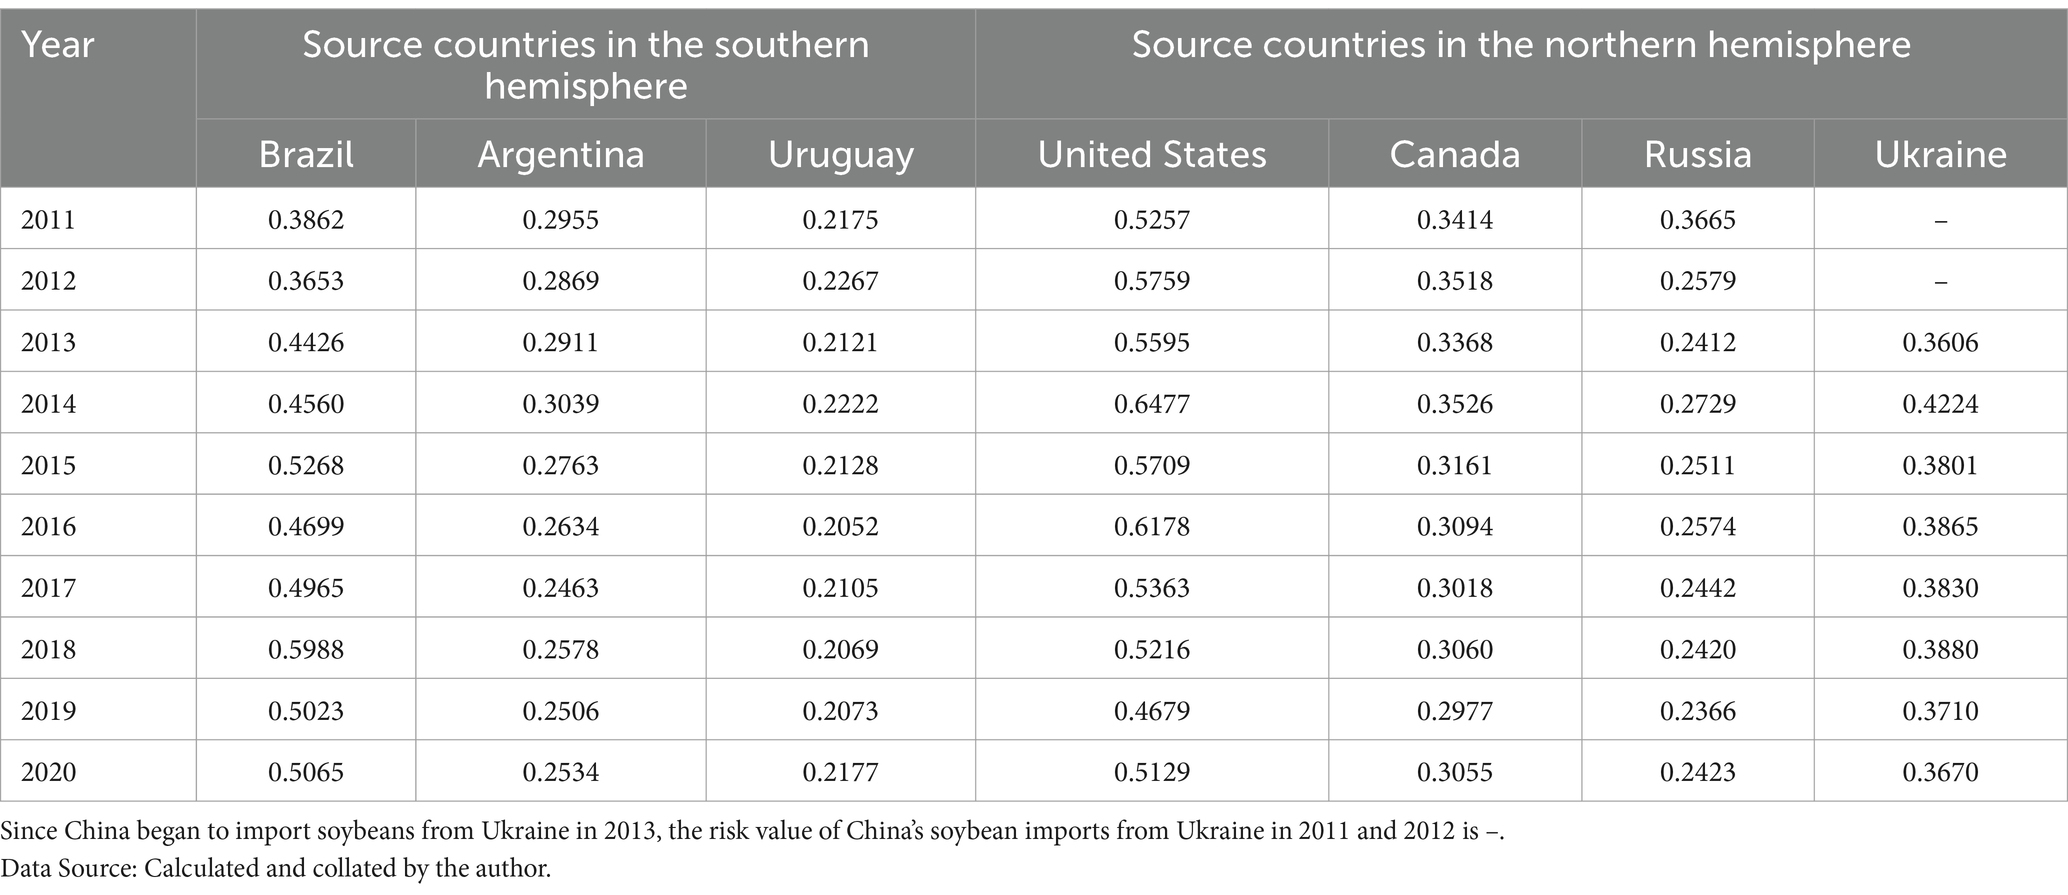
Table 4. The risk of China’s soybean import from various source countries.
4 Methods
While optimizing the layout of soybean import sources to reduce import risks, it is critical to ensure that import costs do not rise substantially. The multi-objective optimization models can address situations where multiple objectives need to be optimized, even when these objectives are measured in different units. Additionally, the impact of changes in import source layout on fluctuations of import quantities mainly depends on the direction and extent of such changes (Lin et al., 2015). If changes of import source layout lessen the proportion difference of importing countries’ imports from source countries in opposite seasons, this could smooth annual import fluctuations. Conversely, if such changes widen the proportion difference of importing countries’ imports from source countries in opposite seasons, this may aggravate annual import fluctuations. Therefore, it is necessary to control the difference in the proportion of soybean imports from the northern and southern hemispheres within a certain range to ensure import stability for China. It is essential to incorporate seasonal factors into the optimization model. A multi-objective optimization model can balance the proportional distribution of China’s soybean imports between the northern and southern hemispheres through constraint settings. Based on this, this study employs a multi-objective optimization model to explore the optimization problem of China’s soybean import source layout considering seasonal factors while focusing on import risk and cost objectives.
Firstly, regarding the objective of import risk, Modern Portfolio Theory (MPT) holds that investors can minimize risks through portfolio diversification (Markowitz, 1952). This theory provides an important theoretical basis for diversifying product import risks. Specifically, product imports should not rely on a single source but diversify across multiple suppliers to reduce supply failure risks caused by over-dependence on one country (Ge and Fan, 2013). These principles demonstrate that import source concentration is a critical factor in assessing import risks. Further, the import risk objective is set as the product of country-specific import risks and import source concentration (Kong et al., 2019; Ge et al., 2024). Among them, China’s soybean import risk from various source countries is the risk value quantified through the entropy method mentioned earlier, as shown in Equation 5.
Secondly, regarding the objective of import cost, the objective function of soybean import cost is defined as the sum of the import prices from various source countries multiplied by their import quantities, divided by China’s total annual soybean import volume. Each stage in the trade process (from producers to consumers) incurs trade costs. Due to the unique characteristics of agricultural products, agricultural trade costs are generally higher than those of manufactured goods. Therefore, trade costs are an important factor affecting a country’s agricultural imports (Wang and Liu, 2020). Following the methodology of Li et al. (2015), this study calculates the average price of China’s soybean imports from various source countries using the CIF (Cost, Insurance and Freight) price, which covers production and trade cost, as shown in Equation 6.
Finally, this study considers four constraints, as shown in Equation 7. First, soybean imports to China from each source country must not exceed the exporting country’s soybean supply. Second, the total soybean imports from all source countries must equal the total soybean imports to China. Third, China’s soybean imports plus domestic production minus inventory should be greater than or equal to its domestic soybean demand, meaning the actual soybean supply must satisfy domestic demand. Fourth, China should control the difference in the proportion of soybean imports from the northern and southern hemispheres to remain within a certain range, thereby ensuring the stability of soybean imports in China (taking seasonal factors into account in this model).
Based on this, the expressions for the two objective functions (objective 1 minimizes import risk, objective 2 minimizes import cost) and the constraints are as follows.
Where Ri represents the risk value of China’s import of soybeans from source country i calculated based on entropy value above. qi is the decision variable, representing the amount of soybeans imported by China from source country i. Q represents the total amount of soybeans imported by China. represents the concentration of China’s soybean import sources. αi represents the average price of soybeans imported from source country i in China. ai and bi represent the lower and upper limits of China’s soybean imports from source country i, respectively. P and D represent China’s soybean production and consumption in that year, and S is China’s soybean inventory. is and in respectively represent the source countries of China’s soybean imports located in the southern and northern hemisphere. and represent the amount of soybeans imports from source countries in the southern hemisphere and northern hemisphere to China, respectively. c represents the upper limit on the absolute difference between the proportions of soybean imports to China from the southern and northern hemispheres. During the 10 years preceding the US-China trade disputes (2008–2017), the absolute difference between the proportions of soybean imports to China from the southern and northern hemispheres did not exceed 30%. Subsequently, this difference value rose to over 50% influenced by the US-China trade disputes. In 2021 and 2022, it decreased to around 30%. This to some extent indicates that controlling the absolute difference in China’s soybean import shares from the southern and northern hemispheres below 30% helps ensure import stability. Therefore, this study proposes setting c at 30%.
Compared with solving the optimal value using a single-objective decision model, the essence of multi-objective decision lies in coordinating multiple objectives to find a set of optimal solutions. NSGA-II is an improvement of the Non-dominated Sorting Genetic Algorithm (NSGA) proposed by Deb et al. (2002) over Srinvas and Deb (1994). NSGA-II proposed a fast non-dominated sorting operator, introduced the save elite strategy, and replaced the shared parameter with crowding distance, thus solving the three disadvantages of NSGA. At the same time, NSGA-II is widely used in multi-objective optimization problems because of its low computational complexity, even distribution of individuals in Pareto solutions, the ability to ensure the best individuals are not lost, and easy programming (Yu et al., 2020). Previous studies have also shown that NSGA-II has better optimization effect than Multi-Objective Differential Evolution (MODE) algorithm and Multi-Objective Particle Swarm Optimization (MPSO) algorithm (Elarbi et al., 2018; Dhanalakshmi et al., 2011; Li and Zhang, 2009). Therefore, this study will use NSGA-II algorithm to solve the multi-objective optimization model of China’s soybean imports. Moreover, this study selects seven countries including the United States, Brazil, Argentina, Canada, Uruguay, Russia, and Ukraine, to investigate the optimization of China’s soybean import source layout. When optimizing China’s soybean import source layout, the data used consists of annual data from both China and the aforementioned seven countries. Annual soybean import and export volumes and values of various countries are sourced from the UN Comtrade database; annual data on soybean production, consumption, and inventory in China are sourced from the FAO database. The source of other data is the same as above.
5 Results and discussion
The Pareto frontier generated by NSGA-II contains numerous non-inferior solutions, posing challenges for decision-makers in identifying the optimal solution (Lin and Yeh, 2012; Chen et al., 2021a). Each point on the Pareto optimal frontier, which comprises multiple non-inferior solutions, corresponds to an import portfolio. Existing studies mainly determine optimal import quantities from each source country by calculating the mean value across all frontier solutions (Li et al., 2014, 2015). Therefore, this study will use the above method to calculate China’s optimized import quantities from each source country. This method will also be used in the subsequent simulation analysis.
5.1 Benchmark analysis
Due to space constraints, this study mainly presents and analyzes soybean import optimization results in 2020. It can be seen from Table 5 that, first, compared with China’s actual soybean import portfolio in 2020, the optimized import portfolio neglecting seasonal factors while focusing on both risk and cost objectives reduces risks at equivalent costs from 0.6187 to 0.5872. However, this optimization amplifies the disparity in import proportions between the southern and northern hemispheres. Second, compared with China’s actual soybean import portfolio in 2020, the optimized import portfolio considering seasonal factors while focusing on both risk and cost objectives reduces risks at equivalent costs from 0.6187 to 0.4779. The difference in the proportion of soybeans imported from the southern and northern hemisphere to China decreases from 46.37 to 21.79% (calculations show that the coefficient of variation for China’s monthly soybean import quantity5 decreases from 0.2743 to 0.1696, indicating that considering seasonal factors helps reduce import fluctuations). Third, compared with the import optimization portfolio neglecting seasonal factors, the import optimization portfolio considering seasonal factors reduces risks at equivalent costs from 0.5872 to 0.4779. The difference in the proportion of soybeans imported from the southern and northern hemisphere to China decreases from 49.62 to 21.79% (helping reduce import fluctuations). Additionally, the proportion of China’s soybean imports from the southern hemisphere concentrated in Brazil decreased from 84.17 to 80.65%, while the proportion from the northern hemisphere concentrated in the United States decreased from 92.33 to 91.22%. Overall reliance on the United States and Brazil decreased from 86.22 to 84.78%. The above analysis shows that the import optimization portfolio considering seasonal factors can reduce risks at equivalent costs while ensuring the stability of soybean imports. It can also reduce the concentration of China’s soybean imports from Brazil in the southern hemisphere and from the United States in the northern hemisphere, as well as the overall reliance on both countries. However, the extent of this reduction is limited. Notably, seasonal factors may leave more limited room for optimizing imports from the United States.
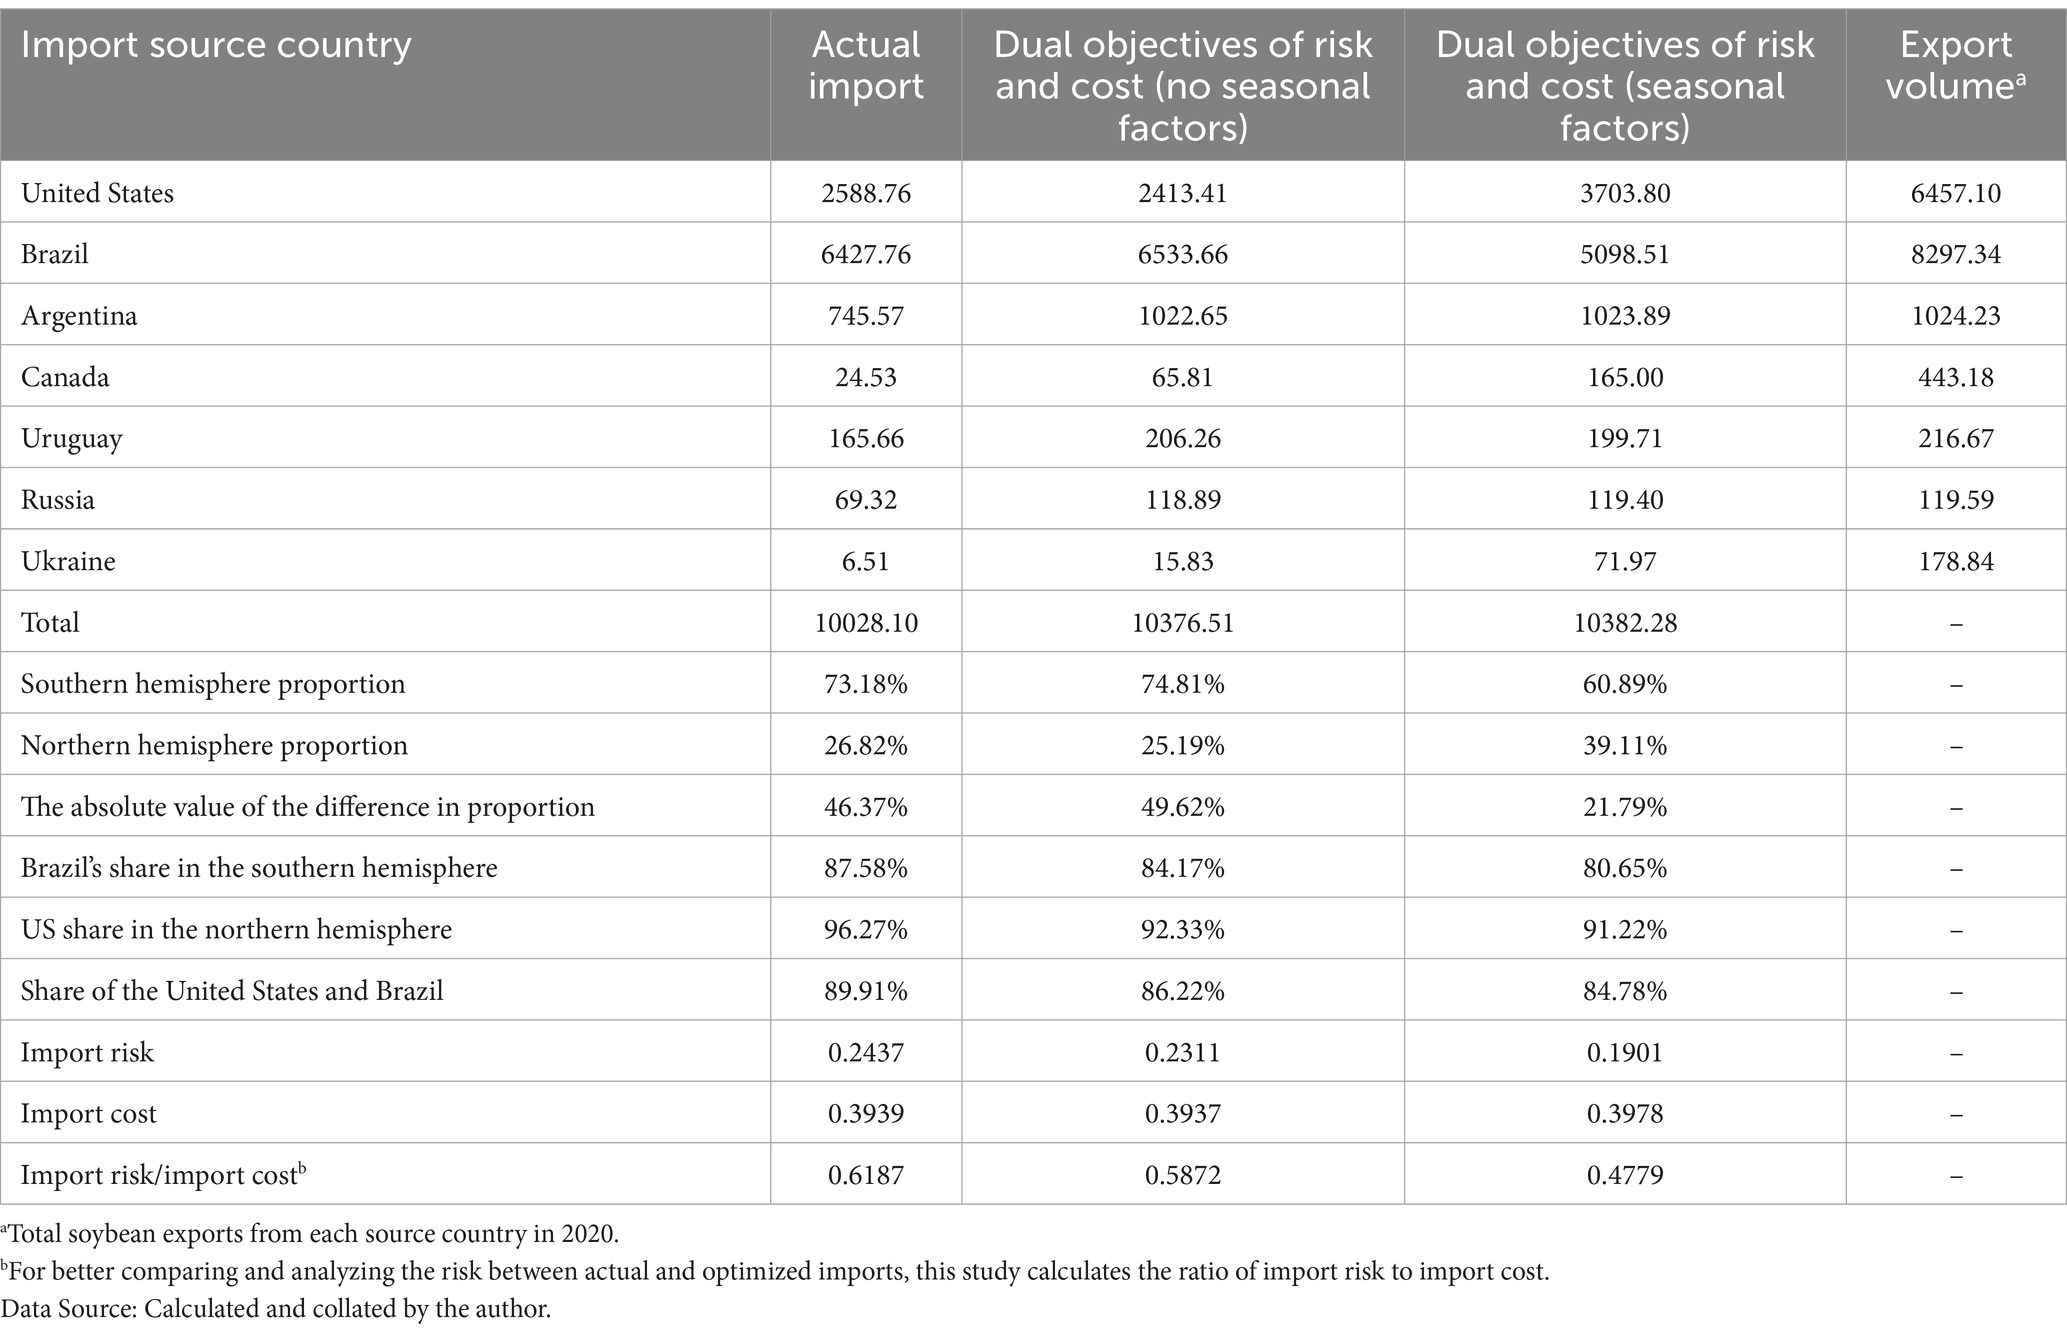
Table 5. China’s actual and optimized soybean import portfolio in 2020 (10,000 tons).
In addition, the economic and trade frictions between China and the United States have significantly impacted the bilateral trade. Agricultural product trade is a key focus of economic and trade negotiations between the two nations, with soybeans being of utmost importance (Yu et al., 2021). In April 2018, the United States imposed a 25% tariff on $50 billion worth of goods imported from China. On July 6, 2018, China officially started implementing a 25% tariff on $34 billion worth of imported goods from the United States, including soybeans (HS code: 12019010). Based on this, in order to eliminate the impact of US-China trade disputes on the multi-objective optimization model results of China’s soybean imports in 2020, taking 2015 (before the US-China trade disputes occurred) as an example, further related analysis is carried out (as shown in Table 6). Specifically, first, compared with China’s actual soybean import portfolio in 2015, the optimized import portfolio neglecting seasonal factors while focusing on both risk and cost objectives reduces risks at equivalent costs from 0.4691 to 0.4430. However, this optimization amplifies the disparity in import proportions between the southern and northern hemispheres (calculations show that the coefficient of variation for China’s monthly soybean import quantity increases from 0.1841 to 0.2641, indicating that ignoring seasonal factors would aggravate import fluctuations). Second, compared with China’s actual soybean import portfolio in 2015, the optimized import portfolio considering seasonal factors while focusing on both risk and cost objectives reduces risks at equivalent costs from 0.4691 to 0.3845, and the difference in the proportion of soybeans imported from the southern and northern hemisphere almost does not change. Third, compared with the import optimization portfolio neglecting seasonal factors, the import optimization portfolio considering seasonal factors reduces risks at equivalent costs from 0.4430 to 0.3845. The difference in the proportion of soybeans imported from the southern and northern hemisphere to China decreases from 44.33 to 26.20% (helping reduce import fluctuations). Similarly, seasonal factors may leave more limited room for optimizing imports from the United States. It can be seen from the analysis that the optimization results of China’s soybean import in 2015 are basically consistent with those in 2020.6 This can illustrate the universality of the analysis on the optimization of China’s soybean import source layout in 2020.
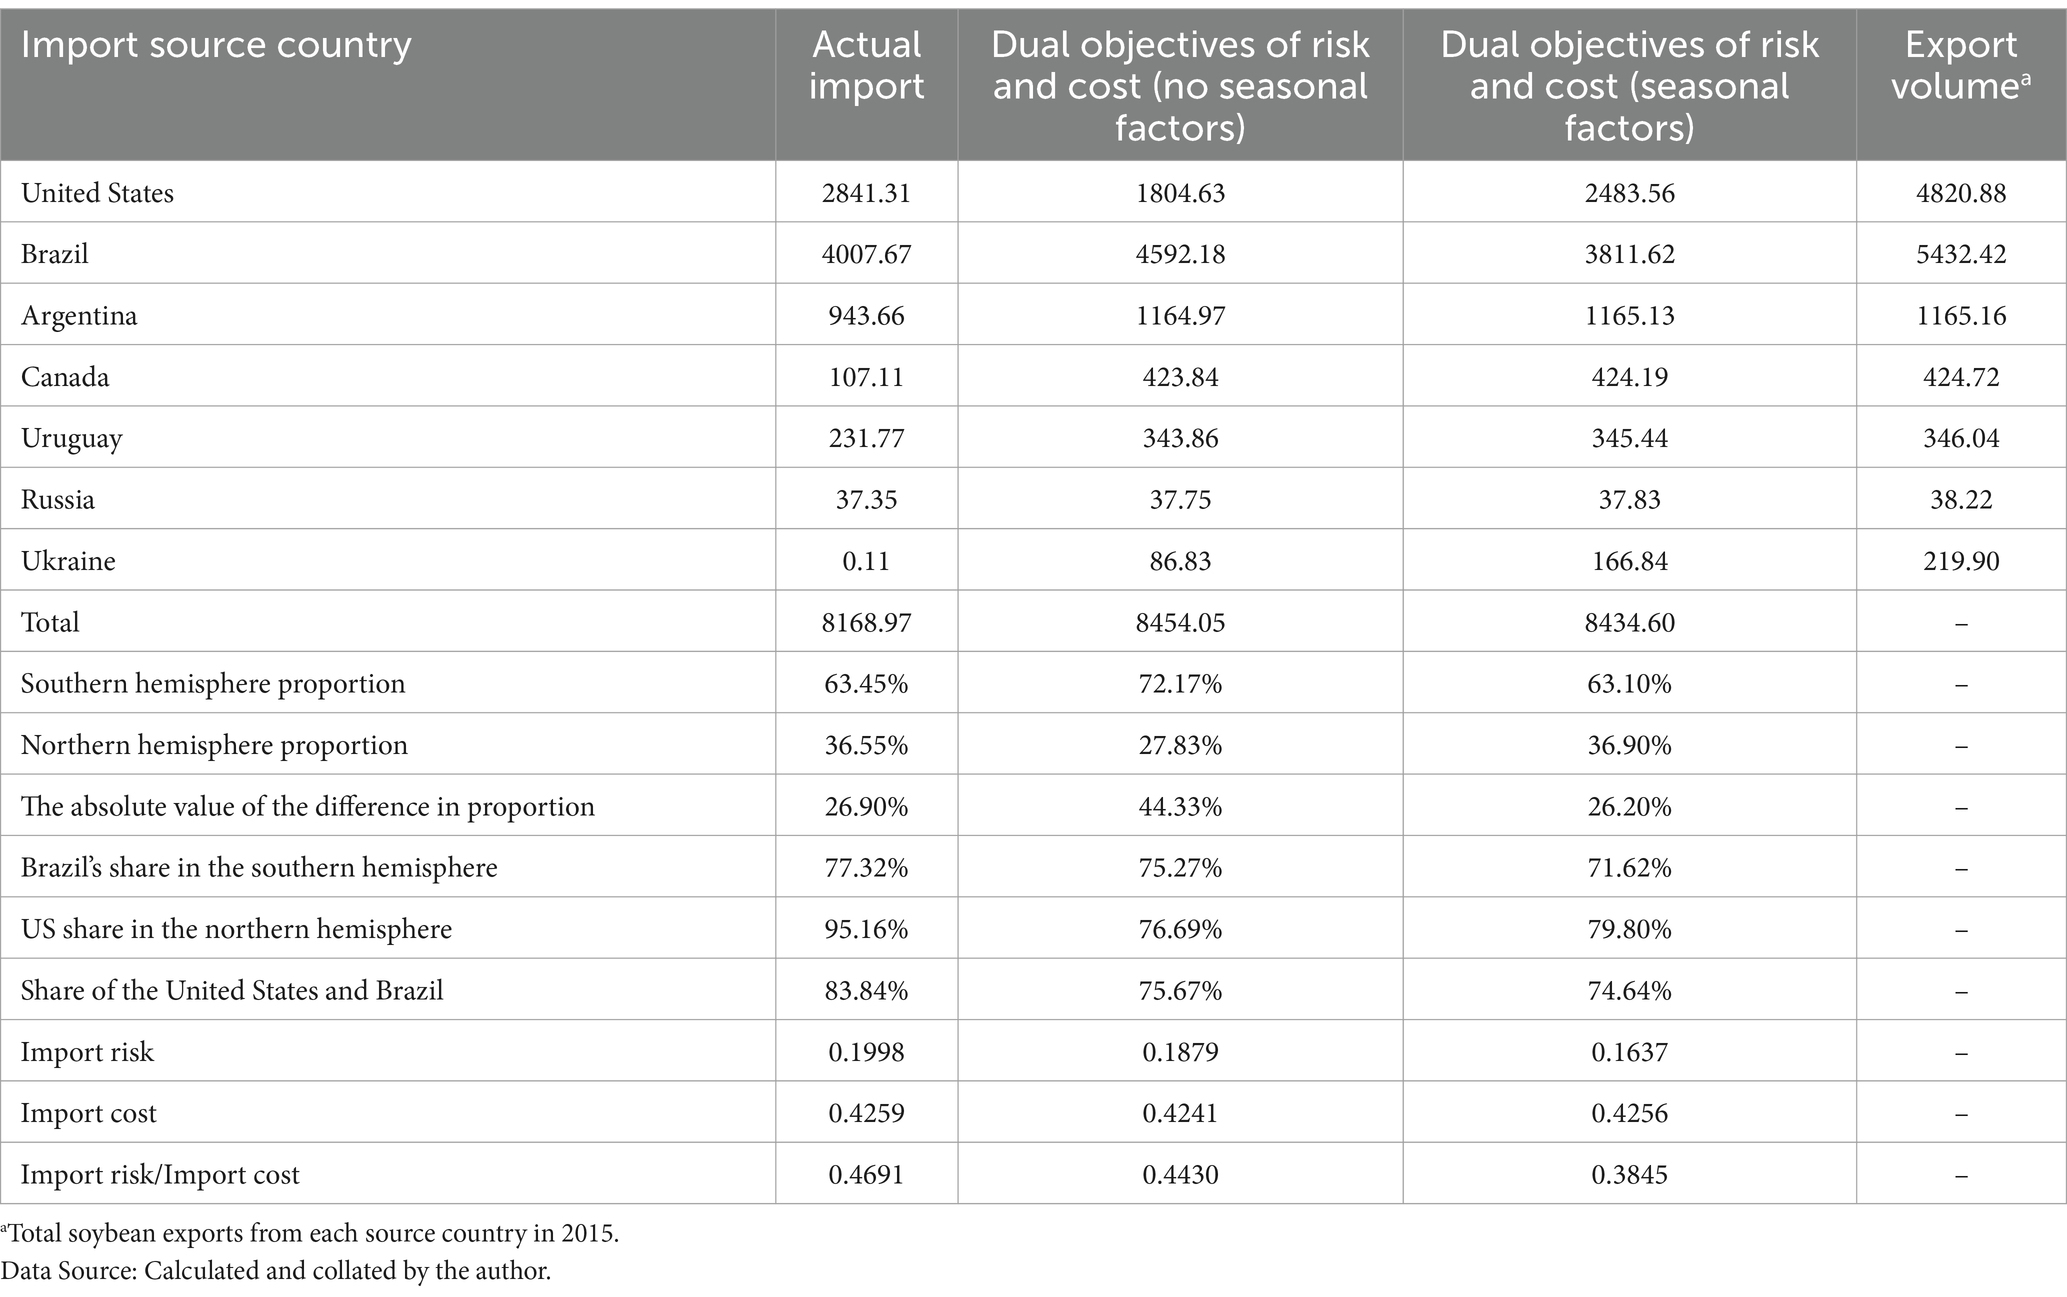
Table 6. China’s actual and optimized soybean import portfolio in 2015 (10,000 tons).
5.2 Extensibility analysis
Currently, even if the import source layout is optimized, China’s soybean imports from the southern hemisphere are more concentrated in Brazil, and imports from the northern hemisphere are more concentrated in the United States, with the latter being more prominent. Meanwhile, seasonal factors may leave more limited room for optimizing imports from the United States. Therefore, this section will explore the impact of increased soybean export supply capacity of relevant source countries in the northern hemisphere on the optimization of China’s soybean import source layout.
5.2.1 Feasibility analysis
A country’s agricultural resource endowment is a crucial factor determining its potential for agricultural exports, and the bilateral relationship between two countries is a key factor determining the smooth conduct of trade. Both Russia and Kazakhstan are countries along the “Belt and Road” initiative, have established good trade relations with China, and possess abundant agricultural resources. Moreover, both Russia and Kazakhstan serve as nations along the China Railway Express, with the potential to complement multinational grain transportation that relies heavily on maritime shipping. Therefore, this study will analyze the optimization of China’s soybean import source layout under scenarios of increasing soybean supply from Russia and Kazakhstan based on the calculation of soybean production potential in both countries.
5.2.2 Scheme setting
This study estimates the potential for increasing soybean production through yield improvement in Russia, and the potential for production growth through both yield improvement and area expansion in Kazakhstan. The Global Agro-Ecological Zones (GAEZ) model, developed jointly by the Food and Agriculture Organization of the United Nations (FAO) and the International Institute for Applied Systems Analysis (IIASA), is a model used to assess crop production potential. In the GAEZ v4 model, calculating potential yields of crops for each country requires setting parameters such as crop type, Representative Concentration Pathways (RCPs), time period, water supply conditions, input levels, CO2 fertilization effects, and others. The potential yield of soybeans in RCPs4.5, 2020s, high input level under rain-fed condition and considering the CO2 fertilization effect is selected as the basis for estimating the soybean production potential of Russia and Kazakhstan. According to Table 7, soybean production in Russia and Kazakhstan increased by 100 and 500% respectively, with soybean production potentials reaching 4.5672 million tons and 1.2934 million tons.
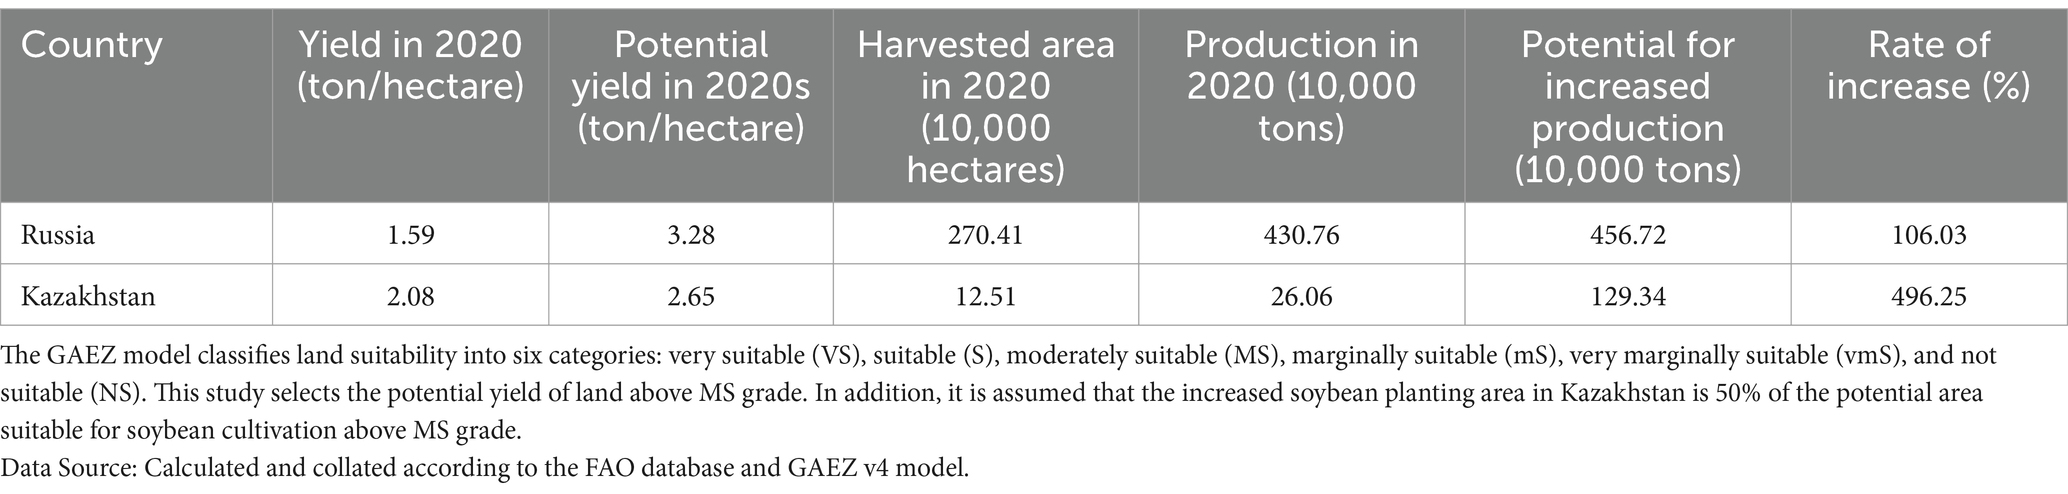
Table 7. Soybean production potential in Russia and Kazakhstan.
Based on this, two simulation scenarios are set in this study, using actual soybean imports in 2020 as the benchmark scenario.
Scenario 1: Increased soybean export availability from Russia. The export quantity under increased soybean export supply capacity is calculated as the sum of Russia’s potential soybean production increase and its 2020 soybean export quantity.
Scenario 2: Increased soybean export availability from Kazakhstan. The export quantity under increased soybean export supply capacity is calculated as the sum of Kazakhstan’s potential soybean production increase and its 2020 soybean export quantity.
5.2.3 Simulation result analysis
This section analyzes the impacts of the above two scenarios on optimizing China’s soybean import source layout (as shown in Table 8). Specifically, compared with the optimized import portfolio under actual conditions, increased soybean export availability from Russia or Kazakhstan can reduce risks at equivalent costs while balancing the proportion of soybean imports from the northern and southern hemispheres in China. The reason may be that increased soybean exports from Russia and Kazakhstan could diversify China’s import portfolio away from over-reliance on the United States and Brazil. Since the risks associated with importing soybeans from Russia and Kazakhstan are significantly lower than those from the United States and Brazil, this diversification effectively mitigates China’s overall soybean import risks. Meanwhile, this not only helps to further reduce China’s risk of seasonal supply shortages in the first and fourth quarters caused by over-reliance on the United States but also helps to further reduce China’s supply shortages risks stemming from dependence on both the United States and Brazil. These effects are more pronounced when Russian soybean supply increases.7
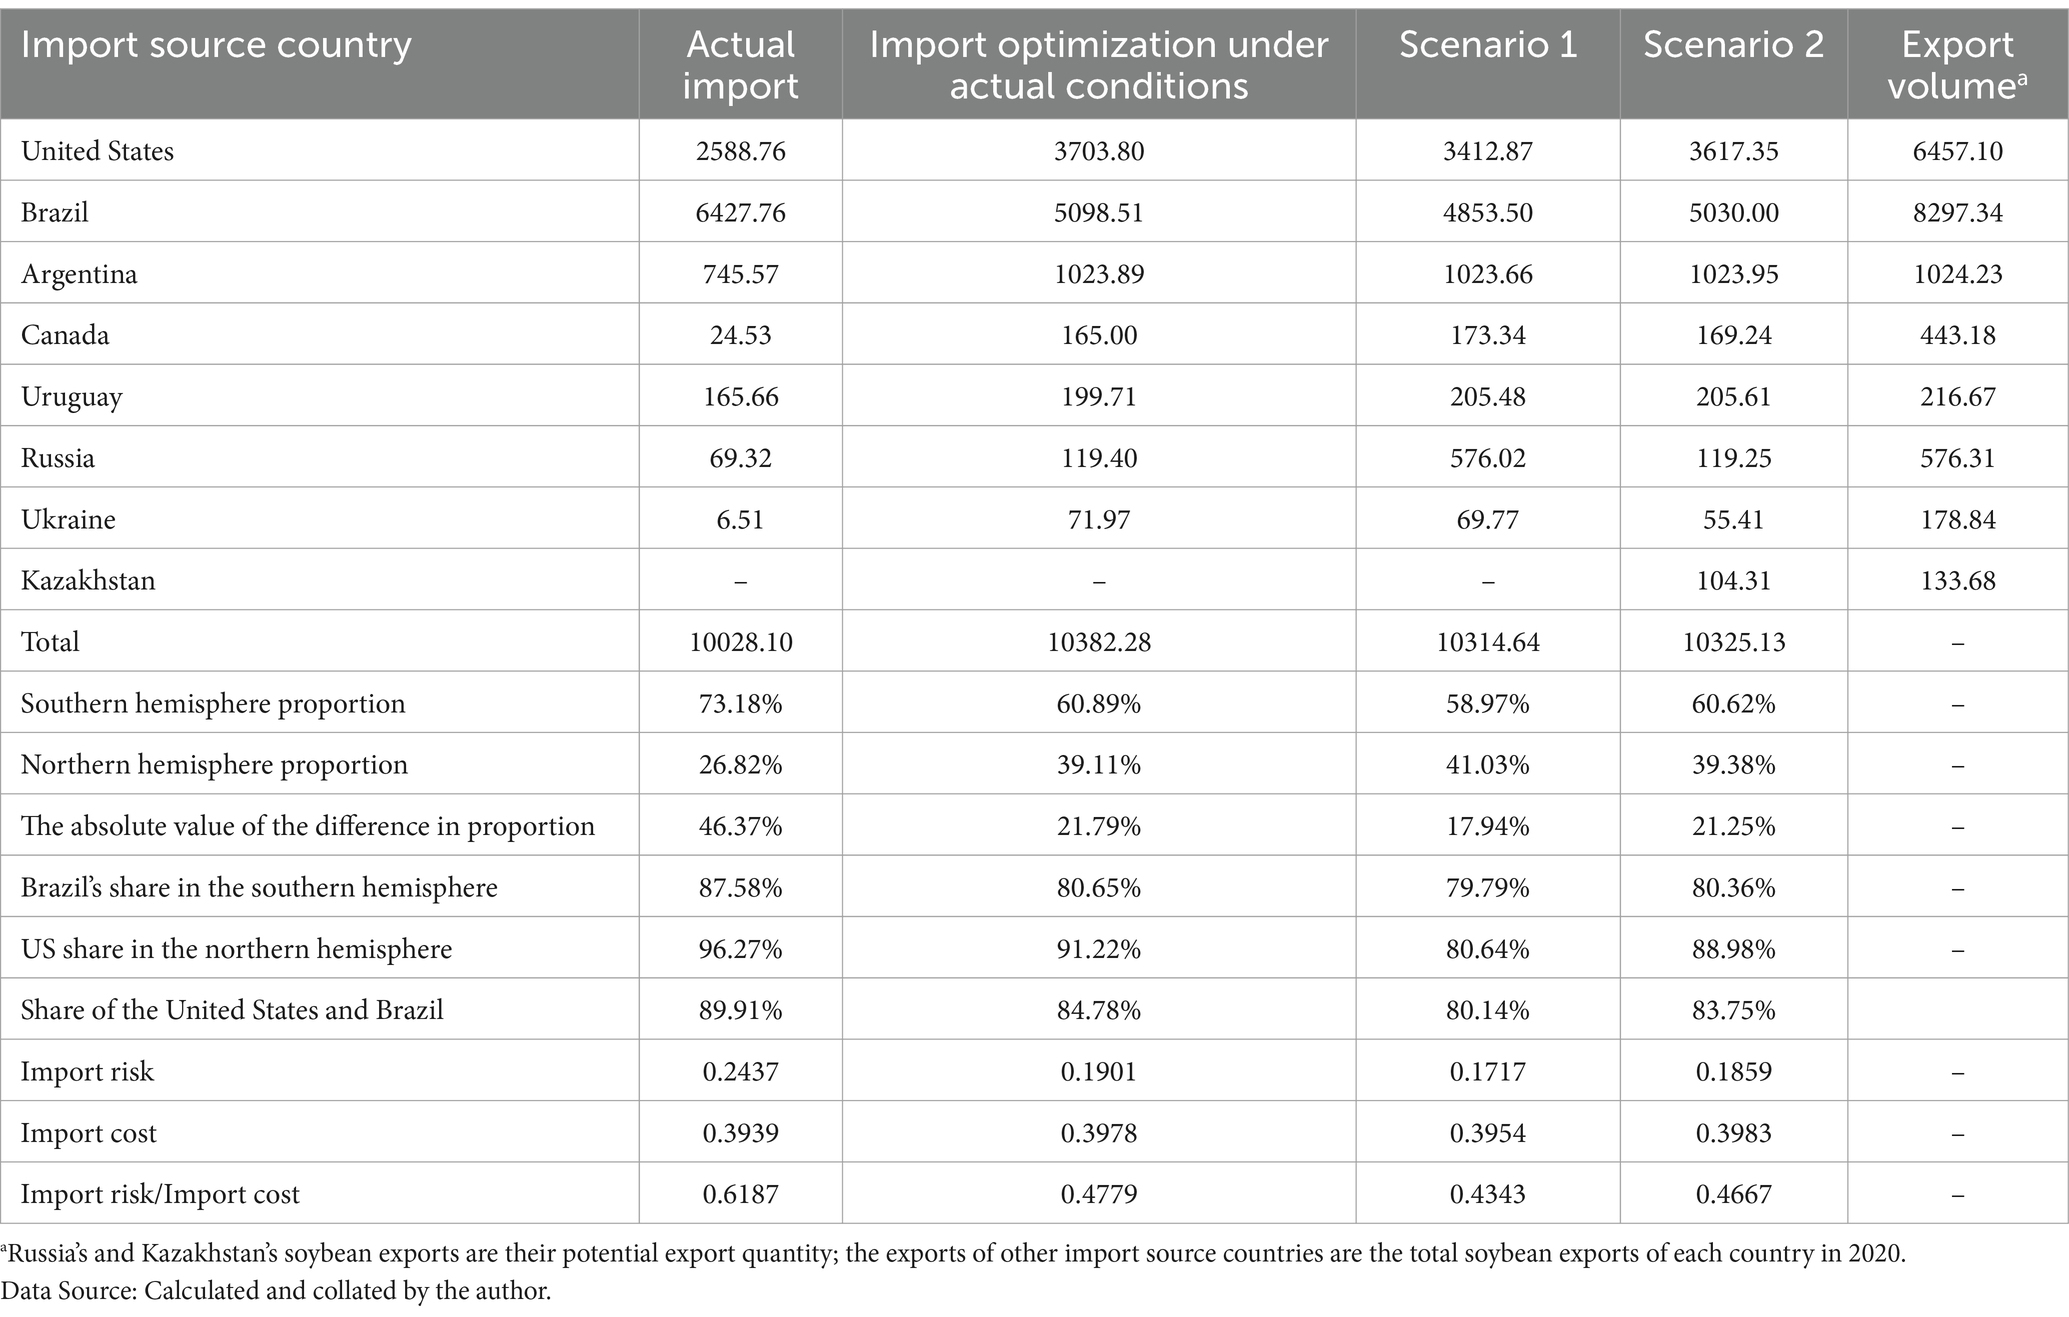
Table 8. The optimized soybean import portfolio for China under the scenario of increased soybean supply from Russia and Kazakhstan (10,000 tons).
6 Conclusion
Taking China’s soybean imports as a case study, this study establishes an analytical framework for optimization of soybean import source layout considering seasonal factors. Based on this framework, the study explores the optimization of soybean import source layout both in the current context and under scenarios of increasing soybean supply capacity of Russia and Kazakhstan. The main conclusions are as follows. Firstly, neglecting the importance of seasonal factors in optimizing China’s soybean import source layout may exacerbate fluctuations in import quantities, thereby affecting the stability of soybean import supply. The import optimization considering seasonal factors could reduce risks at equivalent costs while ensuring import stability. Secondly, increased soybean export availability from Russia or Kazakhstan can further reduce risks at equivalent costs while ensuring the stability of soybean imports. The findings of this study are expected to provide a decision-making basis for optimizing soybean import source layout in China, as well as new insights and perspectives for other food-importing countries to avoid supply shortages risks.
Based on the above research conclusions, the following policy recommendations are proposed. (1) Importing countries should maintain good economic and trade relations with major grain-exporting countries to ensure stable grain supply. Governments should encourage and guide domestic agricultural enterprises to build sustainable partnerships with both public institutions and private-sector stakeholders in grain-exporting countries. Concurrently, strategic initiatives should be implemented to foster synergistic cooperation between domestic agribusinesses and multinational agricultural corporations, with phased approaches to developing a stable and reliable grain distribution network. (2) It is crucial to emphasize the role of seasonal factors in optimizing grain import source layout. While diversifying import risks, it is also essential to ensure import stability. To achieve this, internationally competitive agricultural enterprises should be cultivated. These entities can be guided to establish bilateral agricultural cooperation with countries possessing production potential. By investing in infrastructure, providing technical assistance, and improving agricultural labor skills, grain production capacity can be enhanced, thereby securing the reliability of imported grain supplies. Furthermore, implementing a just-in-time approach by reducing storage time could help save grain storage costs and reduce grain losses. Concurrently, enterprises should be encouraged to rationally arrange seasonal import plans according to the concentrated season of soybean production and export in each source country, thereby optimizing supply chain efficiency. (3) Enhancing domestic grain supply capacity through scientific and technological advancements can effectively reduce the excessive dependence on the global grain market. By improving domestic yield levels, the yield gap with the world’s major grain-producing countries could be narrowed. Concurrently, research and promotion of new technologies and varieties may partially mitigate constraints imposed by limited arable land. For example, China’s recent implementation of maize-soybean strip intercropping technology has effectively increased soybean production by expanding the planting area. Specifically, governments should strengthen support for domestic soybean industry, promote the cultivation of excellent soybean varieties. While improving the technical level of soybean production through technological innovation, infrastructure and agricultural technology training should also be improved to synchronously improve the technical efficiency of soybean production.
This study still has some limitations. Firstly, the optimization analysis of import source layout is mainly based on historical data, and no scenario analysis has been carried out for emergencies such as the economic and trade frictions between China and the United States, or changes in China’s soybean production and demand. Therefore, future research will explore the impact of such emergencies on the layout of soybean import sources and associated import risks. Secondly, the current transportation risk index mainly considers the transportation distance from each source country to China and the risk through the transportation node. However, it does not account for the diversity of transportation modes. In future research, we will further explore potential alternatives to maritime shipping. For example, the China Railway Express is expected to complement multinational grain transportation that relies heavily on maritime shipping. Subsequently, we aim to develop a scientific methodology for integrating transport mode diversity into the construction of transportation risk index. In addition, the analytical framework for optimizing food import layouts developed in this study will be used to explore source layout optimization for other food-importing countries in future research, thereby assisting these countries in achieving sustainable food supply.
Data availability statement
The original contributions presented in the study are included in the article/Supplementary material, further inquiries can be directed to the corresponding author.
Author contributions
XW: Conceptualization, Data curation, Formal analysis, Funding acquisition, Investigation, Methodology, Project administration, Resources, Software, Supervision, Validation, Visualization, Writing – original draft, Writing – review & editing. YL: Data curation, Software, Writing – review & editing.
Funding
The author(s) declare that financial support was received for the research and/or publication of this article. Funding for this research was provided by National Natural Science Foundation of China (No. 72442023), National Natural Science Foundation of China (No. 72303104), China Postdoctoral Science Foundation funded project (No. 2023 M731722), Fundamental Research Funds for the Central Universities of Ministry of Education of China (No. SKYC2023002), Philosophy and Social Sciences Research Foundation of the Jiangsu Higher Education Institutions of China (No. 2023SJYB0062) and High Level Innovation and Entrepreneurial Research Team Program in Jiangsu Province (KYCX23_0834).
Conflict of interest
The authors declare that the research was conducted in the absence of any commercial or financial relationships that could be construed as a potential conflict of interest.
Generative AI statement
The authors declare that no Gen AI was used in the creation of this manuscript.
Publisher’s note
All claims expressed in this article are solely those of the authors and do not necessarily represent those of their affiliated organizations, or those of the publisher, the editors and the reviewers. Any product that may be evaluated in this article, or claim that may be made by its manufacturer, is not guaranteed or endorsed by the publisher.
Supplementary material
The Supplementary material for this article can be found online at: https://www.frontiersin.org/articles/10.3389/fsufs.2025.1549463/full#supplementary-material
Footnotes
1. ^Excessive geographic concentration of soybean imports in either hemisphere may exacerbate annual import fluctuations. Conversely, achieving balanced geographic distribution between northern and southern hemisphere sources could mitigate such supply fluctuations.
2. ^In 2020, 65% of China’s total soybean imports were transported through the Strait of Malacca (Li et al., 2022), where 60% of global pirate attacks occur (Zhang et al., 2013).
3. ^As the risk of passage through the Strait of Malacca has been considered, the statistics on the number of key transportation nodes no longer include the Strait of Malacca.
4. ^The entropy method is an objective evaluation method based on information entropy theory, which determines the weights of various indices based on the variation degree of each index’s data.
5. ^Due to the US-China trade disputes in 2018, China’s monthly proportion of soybean imports from various source countries in 2017 was used as the reference for calculating monthly import shares. Then, the monthly soybean imports were determined based on both these historical proportions and optimized import volumes that accounted for seasonal factors, risks and costs.
6. ^The optimization results of China’s soybean imports in 2017 are basically consistent with those in 2015, which can better support the conclusions of this study.
7. ^Supplementary Figure 2 shows the average values of Pareto optimal solutions in 2020.
References
Chen, H., Li, X., Lu, X., Sheng, N., Zhou, W., Geng, H., et al. (2021a). A multi-objective optimization approach for the selection of overseas oil projects. Comput. Ind. Eng. 151:106977. doi: 10.1016/j.cie.2020.106977
Chen, S., Song, Y., Ding, Y., Zhang, M., and Nie, R. (2021b). Using long short-term memory model to study risk assessment and prediction of China’s oil import from the perspective of resilience theory. Energy 215:119152. doi: 10.1016/j.energy.2020.119152
Chen, S., Zhang, Y., Zhu, Y., Ma, L., and Zhao, J. (2023). The battle of crops: unveiling the shift from grain to non-grain use of farmland in China? Int. J. Agric. Sustain. 21:2262752. doi: 10.1080/14735903.2023.2262752
Deb, K., Pratap, A., Agarwal, S., and Meyarivan, T. (2002). A fast and elitist multiobjective genetic algorithm: NSGA-II. IEEE Trans. Evol. Comput. 6, 182–197. doi: 10.1109/4235.996017
Dhanalakshmi, S., Kannan, S., Mahadevan, K., and Baskar, S. (2011). Application of modified NSGA-II algorithm to combined economic and emission dispatch problem. Int. J. Electr. Power Energy Syst. 33, 992–1002. doi: 10.1016/j.ijepes.2011.01.014
Ding, C., and Xu, X. (2022). Research on security risks of international food supply chain and countermeasures. Economist 6, 109–118. doi: 10.16158/j.cnki.51-1312/f.2022.06.005
Elarbi, M., Bechikh, S., Gupta, A., Ben Said, L., and Ong, Y. (2018). A new decomposition-based NSGA-II for many-objective optimization. IEEE Trans. Syst. Man Cybern. Syst. 48, 1191–1210. doi: 10.1109/TSMC.2017.2654301
Ge, F., and Fan, Y. (2013). Quantifying the risk to crude oil imports in China: an improved portfolio approach. Energy Econ. 40, 72–80. doi: 10.1016/j.eneco.2013.06.009
Ge, M., Liu, X., and Gao, Y. (2025). Research on multi-objective optimization strategy of China’s soybean import market layout. Issues Agric. Econ. 2, 126–144. doi: 10.13246/j.cnki.iae.2025.02.006
Ge, M., Liu, X., Tu, J., and Zhao, S. (2024). Optimizing the layout of China’s petroleum import market from the perspective of overall risk and cost. Econ. Geogr. 44, 97–107. doi: 10.15957/j.cnki.jjdl.2024.03.010
Geng, J., Ji, Q., Fan, Y., and Shaikh, F.. (2017). Optimal LNG importation portfolio considering multiple risk factors. J. Clean. Prod. 151, 452–464. doi: 10.1016/j.jclepro.2017.03.053
Hamulczuk, M., Pawlak, K., Stefańczyk, J., and Gołębiewski, J. (2023). Agri-food supply and retail food prices during the Russia-Ukraine conflict’s early stage: implications for food security. Agriculture 13:2154. doi: 10.3390/agriculture13112154
Kiloes, A. M., Puspitasari Sulistyaningrum, A., Khaririyatun, N., Mulyono, D., Prabawati, S., et al. (2024). Unravelling the provisioning system of a strategic food commodity to minimise import dependency: a study of garlic in Indonesia. Food Policy 123:102604. doi: 10.1016/j.foodpol.2024.102604
Kong, Z., Lu, X., Jiang, Q., Dong, X., Liu, G., Elbot, N., et al. (2019). Assessment of import risks for natural gas and its implication for optimal importing strategies: a case study of China. Energy Policy 127, 11–18. doi: 10.1016/j.enpol.2018.11.041
Le Mouël, C., Forslund, A., Marty, P., Manceron, S., Marajo-Petitzon, E., Caillaud, M., et al. (2023). Can the Middle East-North Africa region mitigate the rise of its food import dependency under climate change. Reg. Environ. Chang. 23:52. doi: 10.1007/s10113-023-02045-y
Li, J., Sun, X., Wang, F., and Wu, D. (2015). Risk integration and optimization of oil-importing maritime system: a multi-objective programming approach. Ann. Oper. Res. 234, 57–76. doi: 10.1007/s10479-014-1550-5
Li, J., Tang, L., Sun, X., and Wu, D. (2014). Oil-importing optimal decision considering country risk with extreme events: a multi-objective programming approach. Comput. Oper. Res. 42, 108–115. doi: 10.1016/j.cor.2011.10.010
Li, T., Xu, Y., and Zhong, Y. (2022). Research on the risk solution and strategy of excessive concentration of grain import in China. Economist 8, 106–118. doi: 10.16158/j.cnki.51-1312/f.2022.08.007
Li, H., and Zhang, Q. (2009). Multiobjective optimization problems with complicated pareto sets, MOEA/D and NSGA-II. IEEE Trans. Evol. Comput. 13, 284–302. doi: 10.1109/TEVC.2008.925798
Lin, Y. K., and Yeh, C. T. (2012). Multi-objective optimization for stochastic computer networks using NSGA-II and TOPSIS. Eur. J. Oper. Res. 218, 735–746. doi: 10.1016/j.ejor.2011.11.028
Lin, D., Zhu, J., Zhang, S., and Wu, G. (2015). Empirical analysis on causes of decline and fluctuation in China’s soybean import: a source distribution perspective. J. Int. Trade 3, 108–117. doi: 10.13510/j.cnki.jit.2015.03.011
Liu, L. (2015). Import dependence risk analysis of major grain varieties in China based on the perspective of food security. J. Agrotechn. Econ. 11, 37–46. doi: 10.13246/j.cnki.jae.2015.11.004
Liu, K., Mu, Y., and Wang, H. (2024). China’s soybean import risk diversification and source optimization: based on substitution and dependence perspectives. China Oils Fats 1, 1–12. doi: 10.19902/j.cnki.zgyz.1003-7969.230456
Lu, Y., Chen, Y., and Hong, Y. (2022). Optimization of China’s soybean import layout considering risk and cost. Econ. Geogr. 42, 104–114. doi: 10.15957/j.cnki.jjdl.2022.12.011
Ritzel, C., Möhring, A., and von Ow, A. (2024). Vulnerability assessment of food imports-conceptual framework and empirical application to the case of Switzerland. Heliyon 10:e27058. doi: 10.1016/j.heliyon.2024.e27058
Srinvas, N., and Deb, K. (1994). Multi-objective optimization using non-dominated sorting in genetic algorithms. Evol. Comput. 2, 221–248. doi: 10.1162/evco.1994.2.3.221
Sun, X., Hao, J., and Li, J. (2022). Multi-objective optimization of crude oil-supply portfolio based on interval prediction data. Ann. Oper. Res. 309, 611–639. doi: 10.1007/s10479-020-03701-w
Wang, S. (2017). The risk of key points in global food trade and China’s food security. J. Int. Econ. Coop. 11, 20–28.
Wang, S. (2018). Physical accessibility of food and food security. Issues Agric. Econ. 6, 38–48. doi: 10.13246/j.cnki.iae.20180523.002
Wang, M., and Liu, H. (2020). Trade cost, agricultural productivity and China’s agricultural imports. J. Int. Trade 11, 78–93. doi: 10.13510/j.cnki.jit.2020.11.006
Wang, X., Qin, K., and Zhou, Q. (2021). Bilateral relations, regional trade agreements, and agricultural trade: an analysis based on Chinese data. Ind. Econ. Rev. 12, 132–145. doi: 10.14007/j.cnki.cjpl.2021.03.009
Wassénius, E., Porkka, M., Nyström, M., and Jørgensen, P. S. (2023). A global analysis of potential self-sufficiency and diversity displays diverse supply risks. Glob. Food Sec. 37:100673. doi: 10.1016/j.gfs.2023.100673
Wei, Y., Zhang, H., and Zhu, J. (2021). An analysis of dependence risk and market layout optimization for soybean import of China under the new development pattern. Chinese Rural Econ. 12, 66–86.
WTO. (2021). DG Okonjo-Iweala highlights vital role of trade for global food security. Available online at: https://www.wto.org/english/news_e/news21_e/dgno_06jul21_e.htm (Accessed 6 July 2021).
Ye, X. (2018). Trade frictions expose long-term problems: the stability and reliability of bulk agricultural imports need to be improved. Finance Econ. Available online at: https://www.sohu.com/a/242134420_135869.
Yu, D., Gao, L., and Zhao, S. (2020). Reliable emergency facility location with disruption and fortification considerations. Oper. Res. Manage. Sci. 29, 53–61.
Yu, J., Han, X., and Ren, J. (2021). Diversion effect and creation effect: a case study of Sino-US economic and trade frictions. Int. Econ. Trade Res. 37, 20–33. doi: 10.13687/j.cnki.gjjmts.2021.01.002
Zhang, H., Ji, Q., and Fan, Y. (2013). An evaluation framework for oil import security based on the supply chain with a case study focused on China. Energy Econ. 38, 87–95. doi: 10.1016/j.eneco.2013.03.014
Zhao, Y., and Qu, M. (2024). Construction and system evolution analysis of China’s food security indicator system. Front. Sustain. Food Syst. 8:1363340. doi: 10.3389/fsufs.2024.1363340
Keywords: market layout, import risk, seasonal factors, supply potential, multi-objective optimization model
Citation: Wang X and Lu Y (2025) Optimization of grain import market layout in the context of food security: a study of soybean in China. Front. Sustain. Food Syst. 9:1549463. doi: 10.3389/fsufs.2025.1549463
Edited by:
Jason Grant, Virginia Tech, United StatesReviewed by:
Zhanar Nurgazina, Hainan University, ChinaChen Chen, Beijing Forestry University, China
Yongli Zhang, Northwest Normal University, China
Copyright © 2025 Wang and Lu. This is an open-access article distributed under the terms of the Creative Commons Attribution License (CC BY). The use, distribution or reproduction in other forums is permitted, provided the original author(s) and the copyright owner(s) are credited and that the original publication in this journal is cited, in accordance with accepted academic practice. No use, distribution or reproduction is permitted which does not comply with these terms.
*Correspondence: Xiaonan Wang, d2FuZ3hpYW9uYW45MDdAMTYzLmNvbQ==