 Agathe Crosnier
 Gino Baudry
 Laurence Jeangros
 Philippe Thalmann
- 1Laboratory of Environmental and Urban Economics (LEURE), École Polytechnique Fédérale de Lausanne (EPFL), Lausanne, Switzerland
- 2Faculty of Business and Economics (HEC Lausanne), Entreprise for Society Center (E4S), University of Lausanne, Lausanne, Switzerland
Introduction: The implementation of “farm to fork” solutions, taking into account the entire food value chain, is necessary to address the wide range of issues arising from agri-food systems. On the production side, organic farming is one of the main alternatives proposed. However, the interactions between the expansion of organic agriculture and the generalization of dietary changes according to dietary guidelines at the country level have not yet been considered.
Methods: This paper presents a commodity-based modeling of Swiss domestic food production in 2050, derived in four scenarios to compare the environmental impacts of organic and business-as-usual production as well as of two dietary guidelines, namely the EAT-Lancet and the Swiss Food Pyramid. A Life Cycle Assessment approach is then used to assess the environmental impacts through climate, ecosystems, soil and resource depletion.
Results: All scenarios showed lower impacts compared to the current situation projected for 2050, mainly due to dietary changes. Despite lower yields, 100% organic production remains feasible if combined with dietary changes. Organic farming can be more impactful than conventional farming.
Discussion: The results highlight that the implementation of the best diet and alternative production method may trigger unforeseen interactions and emphasize the need for a systemic approach.
1 Introduction
Food consumption has enormous environmental, social and economic impacts. Agri-food systems are responsible for 34% of global greenhouse gas emissions (Crippa et al., 2021) and contribute to exceeding most planetary boundaries (Campbell et al., 2017). To address the multiple and sometimes conflicting issues arising from agri-food systems, it is necessary to implement “farm to fork" solutions that consider the entire food value chain. This involves deep changes, such as shifting food consumption habits toward more sustainable diets, e.g. reducing the amount of animal-based products, food waste and over-consumption, and shifting production toward more sustainable practices. In addition, production and consumption need to be aligned in a way that is relevant to the local context in order to promote synergies and limit trade-offs in terms of sustainability.
On the production side, organic agriculture (OA) is one of the main alternatives being used to address these challenges. The impact of OA has been assessed by: comparative studies of conventional and organic agriculture for specific products (Cederberg and Mattsson, 2000; Thomassen et al., 2008); sustainability assessments of specific products in European countries (Arfini and Bellassen, 2019); studies focusing on one environmental impact category (Lorenz and Lal, 2016), and; meta-analyses of environmental impacts providing qualitative results (Mondelaers et al., 2009; Tuomisto et al., 2012). Although OA is commonly perceived as having less harmful environmental impacts compared to conventional agriculture due to the prohibition of soluble mineral fertilizers, synthetic herbicides and pesticides, the scientific literature is less convinced (Lorenz and Lal, 2016). It highlights insufficient evidence and overestimation of the benefits of OA in modeling studies (Tuomisto et al., 2012). Furthermore, no comprehensive quantitative modeling and comparison of OA at a country, farm to fork, and commodity level has been developed, probably due to the recent emergence of life cycle data for agri-food systems, especially regarding alternative farming practices. This study therefore represents a first attempt to model the environmental impacts of the widespread generalization of OA at the country level, taking into account the evolution of dietary patterns.
The sustainability of agri-food systems depends to a large extent on food consumption. In the study, we considered two diets, namely the EAT-Lancet diet and the Swiss Food Pyramid (SFP) diet. The EAT-Lancet provides guidelines for an optimal diet for human health and environmental sustainability at the global level, while the SFP provides guidelines mainly focused on health for the Swiss context. The EAT-Lancet recommendations are often used as guidelines for a healthy and sustainable diet and suggest a strong reduction of red meat, partly replaced by poultry, which is a common trend already observed in high-income countries (Proviande, 2022; OECD and FAO, 2023). However, more than two thirds of Switzerland's agricultural land consists of grassland (Agroscope, 2023), which is used to feed ruminants. This calls into question the appropriateness of the EAT-Lancet recommendations in Switzerland, as sustainable and economically viable alternatives for the use of grassland have yet to be found. Past experience has shown that alpine pastures are at risk of being abandoned unless large-scale political action is taken (Price et al., 2015). Alternatively, the Swiss Climate Strategy for Agriculture and Food 2050 (OFAG et al., 2023) sets the ambitious goal for the Swiss population to follow the SFP guidelines by 2050. The two diets are different, but both aim for health and environmental sustainability in their own way, which may not be equally appropriate for an organic farming system. Differences in the environmental impacts of these diets should therefore be compared.
Switzerland is one of the countries with the highest share of organic area in the world, with 17% in 2020 (Federal Statistical Office, 2022). This is twice the European level (Federal Statistical Office, 2022) and 14 times the global level (FiBL and IFOAM, 2018). Nevertheless, it is worth mentioning the EU's commitment to the Biodiversity Strategy 2030, which aims for at least 25% organic area by 2030 (FiBL, 2023). In Switzerland, although a simultaneous change in production and consumption has been proposed, more emphasis is placed on dietary change than on the production system, as stated in the Climate Strategy for Agriculture and Food 2050 (OFAG et al., 2023). A report focusing on Switzerland analyzes different scenarios in terms of environmental impact, such as the separate adoption of the SFP diet or the total reduction of food waste (Agroscope, 2017). Another report examines the feasibility of adopting organic agriculture on a global scale and concludes that a farm-to-fork approach is needed, in particular dietary changes (Muller et al., 2017). However, the interactions between the expansion of organic agriculture and the generalization of dietary shifts at the country level have not yet been considered.
To fill this gap, we investigate the widespread adoption of different production methods and diets, evaluated in terms of environmental impacts. To this end, we develop a commodity-based model of the Swiss agri-food system in 2050 and assess the environmental impacts in nine categories using a Life Cycle Assessment (LCA) approach. This methodology allows us to address the entire primary food production with a high level of granularity and differentiation within production.
2 Materials and methods
2.1 Scenario narratives
In addition to the four scenarios designed to investigate the suitability of different dietary guidelines and production methods, we modeled the reference year 2018 to represent the current situation in Switzerland (Reference 2018) and projected it to 2050 to provide a relevant comparison (ConvBASE). For food waste and production losses, a reduction of three quarters compared to 2018 levels is considered, in line with the objectives of the Swiss Confederation (Suisse, 2022). To allow a relevant comparison between the scenarios, we consider the same self-sufficiency rate (SSR) as in the Reference 2018 scenario. The share of organic land in 2050 is extrapolated from 1996–2022 data. Table 1 summarizes the scenarios considered and their rationale. Figure 1 shows the different diets considered.
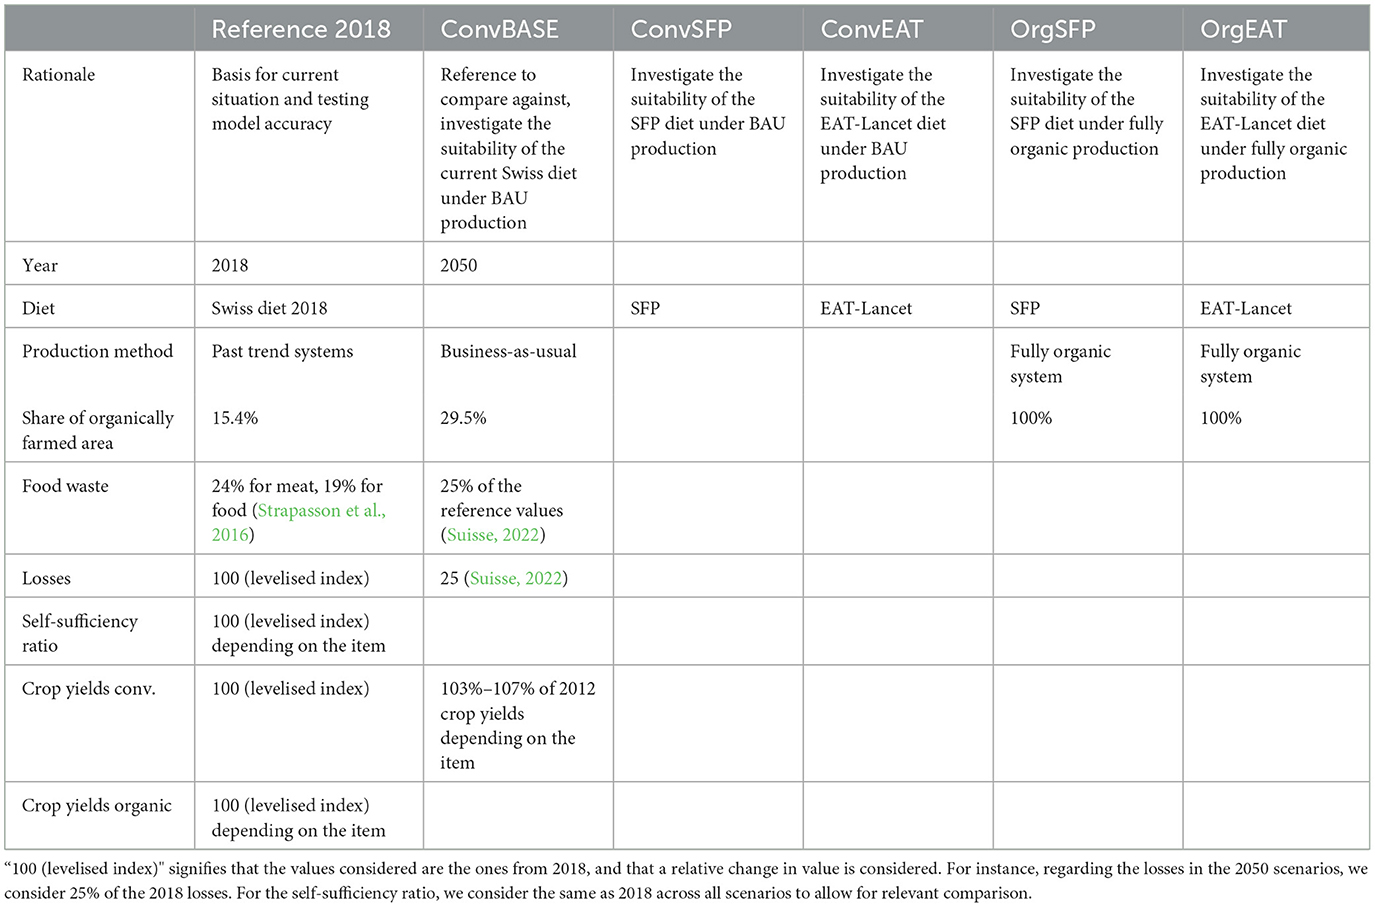
Table 1. Summary of the scenario rationales and modeling choices regarding diet, production method, share of organically farmed area, food waste, losses, self-sufficiency ratio and crop yields.
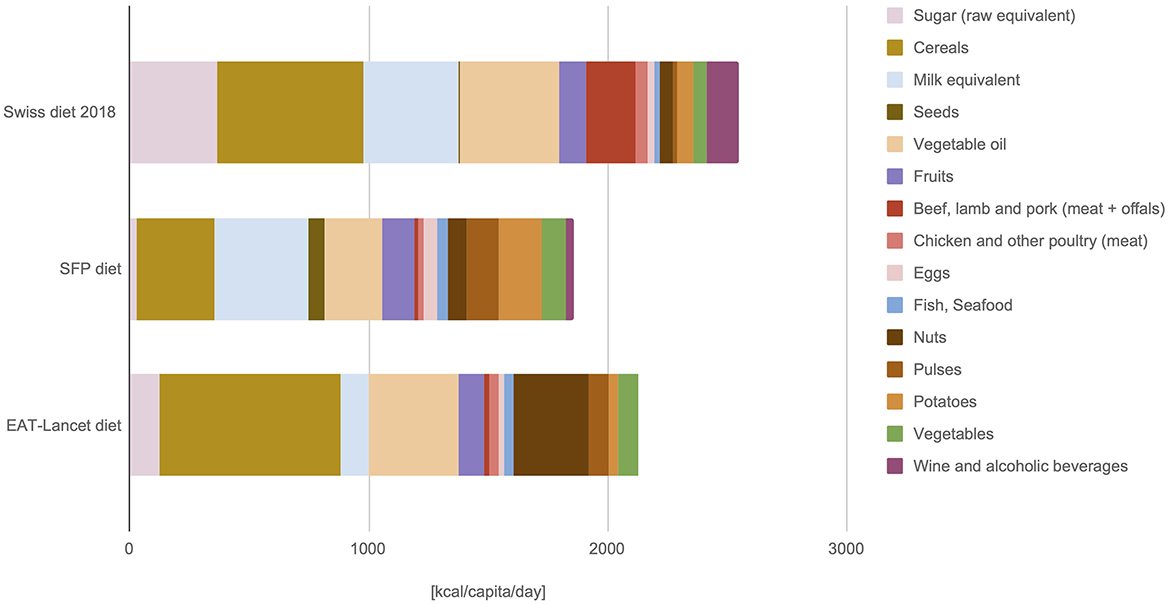
Figure 1. Diet comparison, expressed in (kcal/capita/day), between the 2018 Swiss diet (excluding food waste) (FAOSTAT, 2023b) based on the food supply and accounting for food waste (Strapasson et al., 2016), and the SFP and EAT-Lancet diets (excluding food waste). As the SFP diet does not always provide detailed categories, assumptions are detailed in the Section 2.
2.2 Data collection
The reference year chosen is 2018 as it is the year of the most recent national land use measurements (Office Fédéral de la Statistique, 2021). These data were used to estimate the arable land in 2050 based on a linear extrapolation with data from 1979/1985–2013/2018. The data for production, import, export, stocks, food, feed, losses, processed and other uses (non-food) quantities were extracted from the FAO Food Balance Sheets (FBS) (FAOSTAT, 2023b). For detailed information on crops and livestock products, such as area harvested, yield, and animals produced/slaughtered, the FAO's Crops and Livestock Products dataset has been used (FAOSTAT, 2023a).
2.3 Fork to farm modeling
The modeling of production in 2050 follows a fork to farm approach, represented as flowcharts in Figures 2–4. Additional details are provided below. It was decided not to include non-food biomass in the scope of this study.
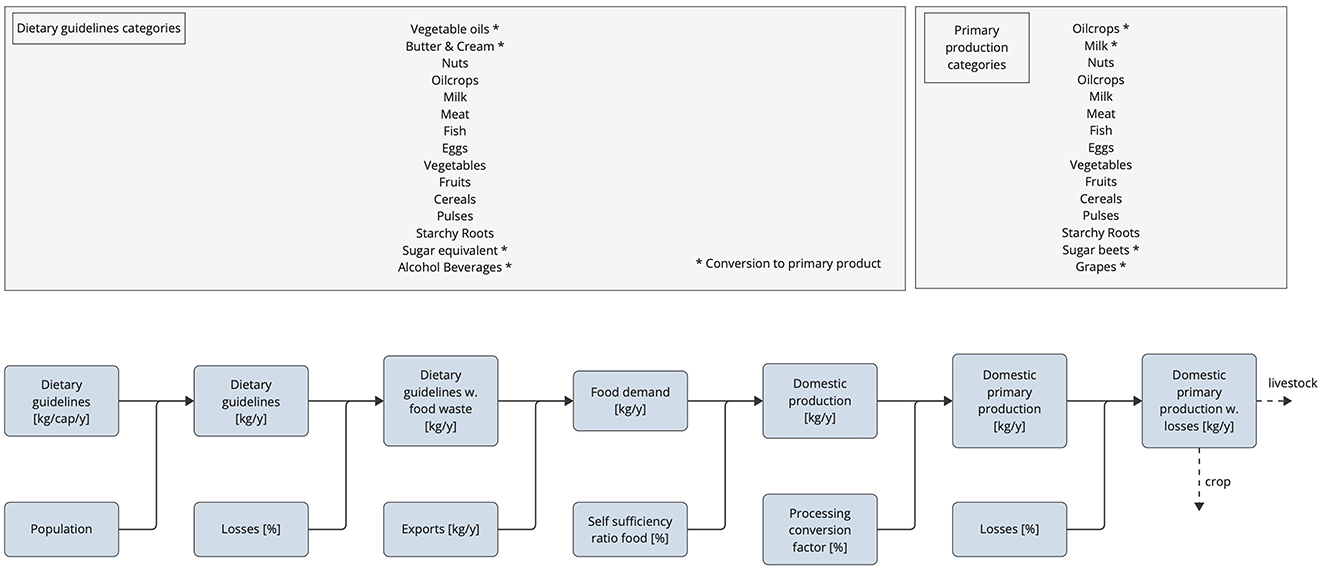
Figure 2. Flowchart: from diet to domestic production with food categories considered at each step.
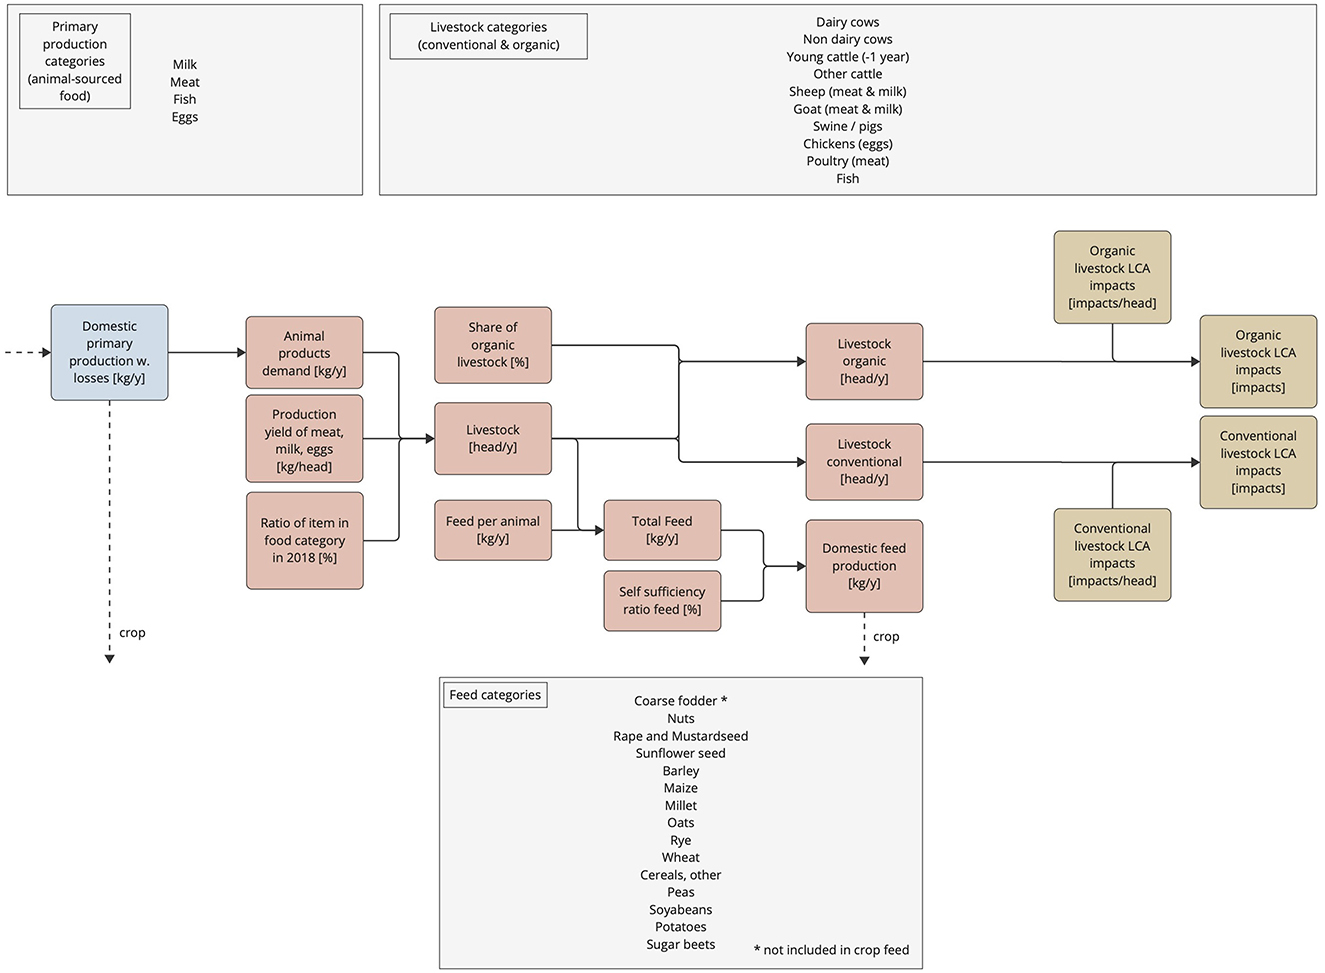
Figure 3. Flowchart: from livestock demand to livestock impacts with food and livestock categories considered at each step.
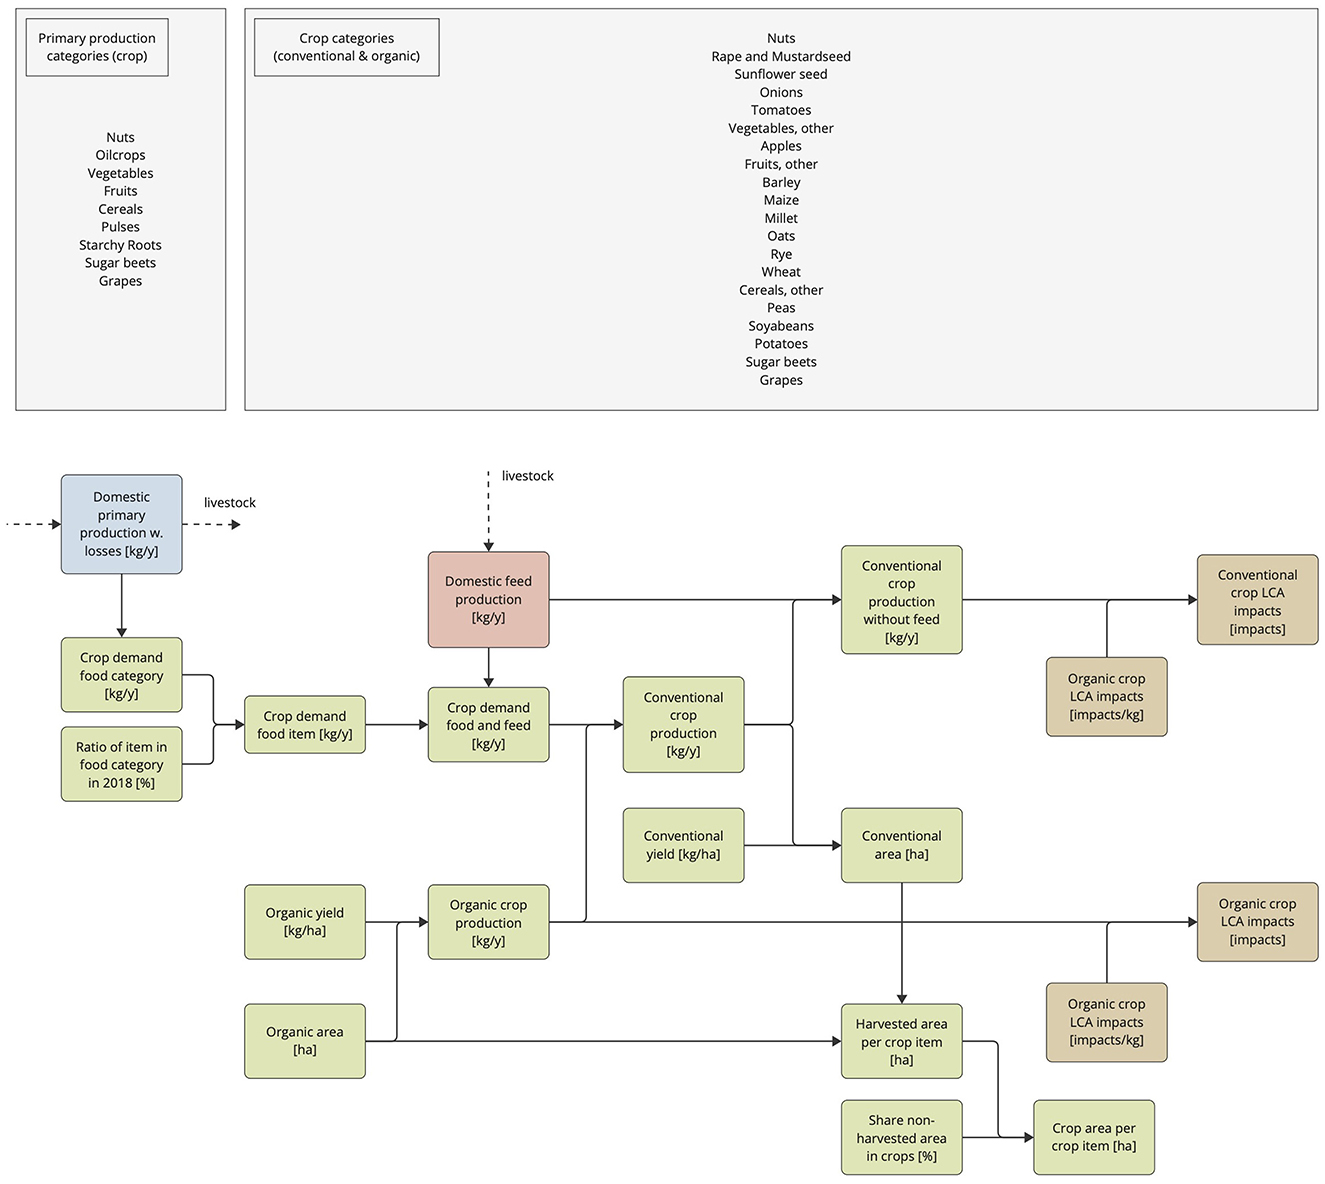
Figure 4. Flowchart: from crop demand to crop impacts with food and crop categories considered at each step.
2.3.1 Population
The Federal Statistical Office projects a population of 10,440,600 people in 2050 (Federal Statistical Office, 2020).
2.3.2 Diet
Based on the scenario, the diet is calculated as follows for each product considered. We assume that there is no overconsumption of food, i.e. that the dietary recommendations are followed, and that the diet is representative of the average person, without accounting for age and gender differentiation.
Since the SFP Diet does not provide strict recommendations, an extrapolation was made based on the average value and average frequency of meals. For example, the SFP diet suggests one serving of sugary or salty treats or alcohol per day (OSAV, 2023). Since savory treats are too complex to generalize based on primary products, they are not considered. This leads to the assumption that a person will consume either one portion of sugary treats per day—e.g. 20 g of hazelnut chocolate spread (OSAV, 2023), accounting for 15 g of sugar (Confédération Suisse and FSVO, 2023)—or one portion of alcohol—e.g. 1 dl of wine (OSAV, 2023). Therefore, a person will consume half of each serving per day, i.e. 7.5 g of sugar and 0.5 dl of wine. The dietary recommendations considered or extrapolated from the Swiss food pyramid are shown in Figure 1 and in the Supplementary material.
2.3.3 Food waste
According to a study, 24% of food and 19% of meat is wasted at the consumer level (Strapasson et al., 2016). The future agricultural policy report (Suisse, 2022) states that food waste at the final consumption level should be reduced by three quarters compared to 2020. Therefore, the food waste at the final consumption level considered in 2050 will be 4.75% for meat and 6% for other food products.
2.3.4 Self-sufficiency ratio and domestic production
We use the FAO's formula to compute the self-sufficiency ratio (SSR) (FAO, 2016). “Production" refers to the production within the country's boundary.
Exports in 2050 were calculated by linearly extrapolating the FBS data from 2010 to 2022. If the projected export quantity in 2050 was negative, the export quantity was set to zero. The results are presented in the Supplementary material.
The production within Switzerland's boundary (referred to as “production") is computed through the following formula:
2.3.5 Primary product production
The Supplementary material summarizes the item, the corresponding primary product, and the food processing conversion factors. Sugar beets are considered the only primary product of sugar, as they represent the vast majority of sugar production in Switzerland.
2.3.6 Losses
We define losses as food waste occuring post-farm and pre-retail. Losses during and pre-harvest are not included due to data limitations. The future agricultural policy report (Suisse, 2022) states that food losses from production to retail should be reduced by three quarters compared to 2020. Therefore, based on the FBS “Losses,” the proportion of losses in relation to total food production for 2020 is calculated for each item category. The loss share for 2050 is then obtained by reducing the 2020 share by three quarters.
2.3.7 Livestock production
Figure 3 represents the flowchart from animal product demand to livestock impacts, including feed demand. The first step is to calculate the production yield of meat, milk or egg per animal, which can be calculated from the produced item mass—based on Livestock Products 2018 (FAOSTAT, 2023a)—and the slaughtered/producing animals—based on different sources summarized in the Supplementary material. Then, the proportion of each product in the total mass of the item must be determined. For example, milk can come from cows, sheep, or goats. Therefore, the ratio of each type of milk to the total milk production is considered. The results are shown in the Supplementary material. For the “Meat" category, the total does not add up to 100% because offal is included in the total meat considered. The results are shown in the Supplementary material. As there is no Swiss target for organic livestock, a linear extrapolation was performed to calculate the share of organic livestock in 2050 based on data from 1999 to 2022 (Office Fédéral de la Statistique (OFS), 2013). The results can be found in the Supplementary material.
2.3.8 Feed
The Agristat report provides the amount of feed (dry matter) used for each type of animal in 2018 (Erdin, 2023). By dividing the amount of feed (dry matter) per animal category by the number of animals in 2018, the amount of feed (dry matter) required per animal can be calculated. The same report then shows the proportions of the components of animal feed—roughage, concentrates and other feed—for each animal category, as can be seen in the Supplementary material. Based on the FBS 2018, “other feed" includes crop production such as cereals, starchy roots and sugar crops, but also milk and seafood. The share of each item in the total “other feed" is shown in the Supplementary material. Milk has not been included in feed because it creates a never-ending loop: animals need milk as feed, so more animals are needed, so more milk is needed, and so on. As for the feed SSR, 73% of the feed needed in Switzerland in 2018 was produced within the country's borders (Confédération Suisse and FSVO, 2023). This value is therefore taken into account in the scenarios projected for 2050.
2.3.9 Crop production
Figure 4 represents the flowchart from crop demand to its associated environmental impacts. The production required for food and feed was calculated using the following formula:
In order to calculate the organic production per item for the business-as-usual scenarios, it is first necessary to estimate the area dedicated to organic agriculture, as well as the conventional and organic yields in 2050. Then the organic production was calculated from the yield, and the conventional mass was subtracted from the total and organic production.
The data for organic production per crop type could not be found, so further calculations are needed. The organic area per crop type for 2018 comes from the Swiss Confederation (Office Fédéral de la Statistique (OFS), 2023). The relative organic yields per crop type are derived from several sources and can be found in the Supplementary material. Since the actual yields (taking into account the organic and conventional production) for each crop item are then known (FAOSTAT, 2023a), the organic and conventional yields for each crop item can be derived as follows. “T” stands for “total,” “C” for “conventional” and “O” for “organic”.
The FAO provides yield projections for 2050 for several countries, several crops, and several scenarios (FAO, 2018). However, data for Switzerland are not available. Given similar historical data patterns, French data were used for irrigated crops under the business-as-usual scenario. The relative evolution between French yields in 2012—provided data year (FAO, 2018)—and 2050 was calculated. The following formula was used to calculate the Swiss yields in 2050. The results are summarized in the Supplementary material.
For the organic yields in 2050, the assumption is conservative and assumes 2018 organic yields—see Supplementary material. However, some items do not have organic yields because they are not produced organically in the BAU scenarios. Therefore, the yield difference between conventional and organic has to be calculated. The value chosen is the average of the item category.
2.3.10 Land use
The next step is to see if the harvested area fits within the land use plans, or if some adjustments such as soil conservation or regeneration are needed. The harvested area can be calculated as follows.
In order to calculate the organic area in 2050, a linear extrapolation was made on the basis of data from the Swiss Federal Statistical Office from 1996 to 2022 (Office Fédéral de la Statistique (OFS), 2013). The result is that in 2050 organic agriculture will cover 29.52% of the Swiss territory. In 2018 it was 15.4% (Office Fédéral de la Statistique (OFS), 2013). For context, the EU Biodiversity Strategy 2050 aims for at least 25% of agricultural land to be farmed organically by 2030 (European Commission, 2020). The following assumption was made: the proportion of crop type within the total organic area remains the same from 2018 to 2050. Thus:
However, not all harvested area is harvested due to temporary fallow, farm buildings and yards. In 2018, the harvested area was equal to 246'572 ha (FAOSTAT, 2023a), while the cultivated area was 297'717 ha (FAOSTAT, 2023c). Therefore, the ratio of harvested area to crop area is 82.8%. This proportion is maintained for the scenarios in 2050. The cropland is thus calculated. Then the land use in 2050 was estimated with a linear extrapolation from the land use area statistics (Office Fédéral de la Statistique, 2021). The results can be found in the Supplementary material. Finally, a comparison was made to calculate the land use difference between the available arable land and the required cropland. Depending on the results, recommendations are given.
2.4 Environmental impact assessment using Life Cycle Assessment
The environmental impact is assessed by matching the item to its corresponding Life Cycle Assessment (LCA) item and multiplying the impact values per production mass or animal head required. For animal-related impacts, the impact values are divided by the lifetime of the animal if greater than one year.
The aim of this paper is to calculate the environmental impacts of the Swiss agri-food system under different diets and production methods. We selected a LCA based approach to obtain a broad quantitative representation of the environmental impacts with a high level of differentiation and granularity within the products, for both conventional and organic production.
2.4.1 Software
To access the databases and calculate the LCIA, LCA software is mandatory. A royalty-free option is OpenLCA, which was used for the free Agribalyse database. SimaPro is the licensed option used for the Ecoinvent database.
2.4.2 LCI databases
The data were calculated from two databases: Ecoinvent and Agribalyse. Ecoinvent is the most popular LCA database and contains LCI data for several industrial sectors, including agriculture. Agribalyse is the French LCI database for the agriculture and food sector, provided by ADEME. The database contains values for French production. The use of French values is a limitation, but relevant as both countries are sufficiently comparable in terms of climate and regulations. The latest version Agribalyse 3.1, published in 2022, requires a license, so the free version Agribalyse 3.0.1 is used.
2.4.3 LCIA method
We chose the E.F 3.0 (adapted) method to calculate the LCIA. This method, consisting of the Product Environmental Footprint (PEF) and the Organization Environmental Footprint (OEF), is the one recommended by the EU for LCA (Damiani et al., 2021).
The impact categories provided by the EF 3.0 method are not all relevant for the agri-food sector. Therefore, impacts need to be scoped accordingly. An environmental impact category is considered relevant if it has been used in at least one of the studies focusing on the impacts of the agri-food sector with an LCA approach (Initiative, 2022; Perotti, 2020). Table 2 summarizes the scoped environmental categories, the corresponding impact area, as well as the impact drivers for cultivation.
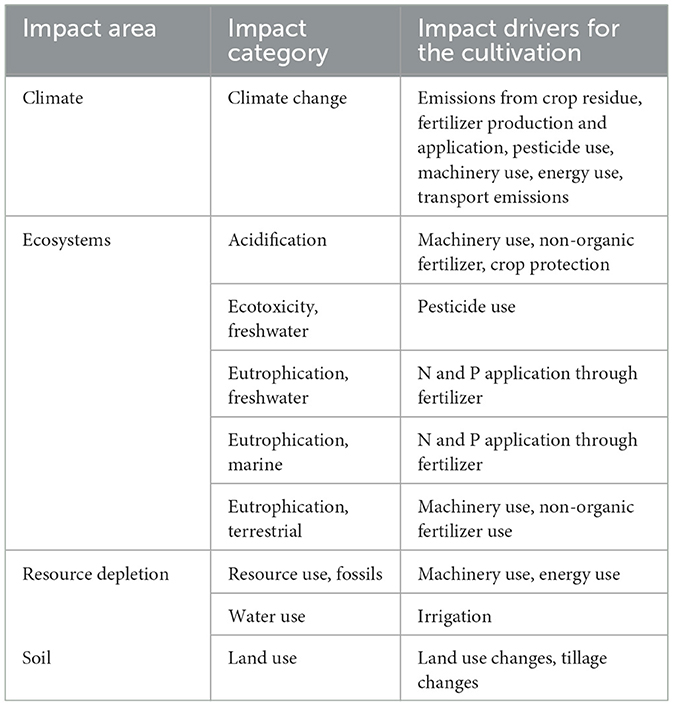
Table 2. Scoped environmental impact categories according to relevance in agri-food systems, alonside main impact drivers for the cultivation.
2.4.4 Selection of products and processes considered
The environmental impacts of the agri-food system occur or are most relevant during production, i.e. the act of preparing the land and raising crops or livestock (Initiative, 2022). For this reason, as well as for reasons of complexity, emphasis is placed on the production process. Tables 3–5 summarize the LCA item considered for each food item.
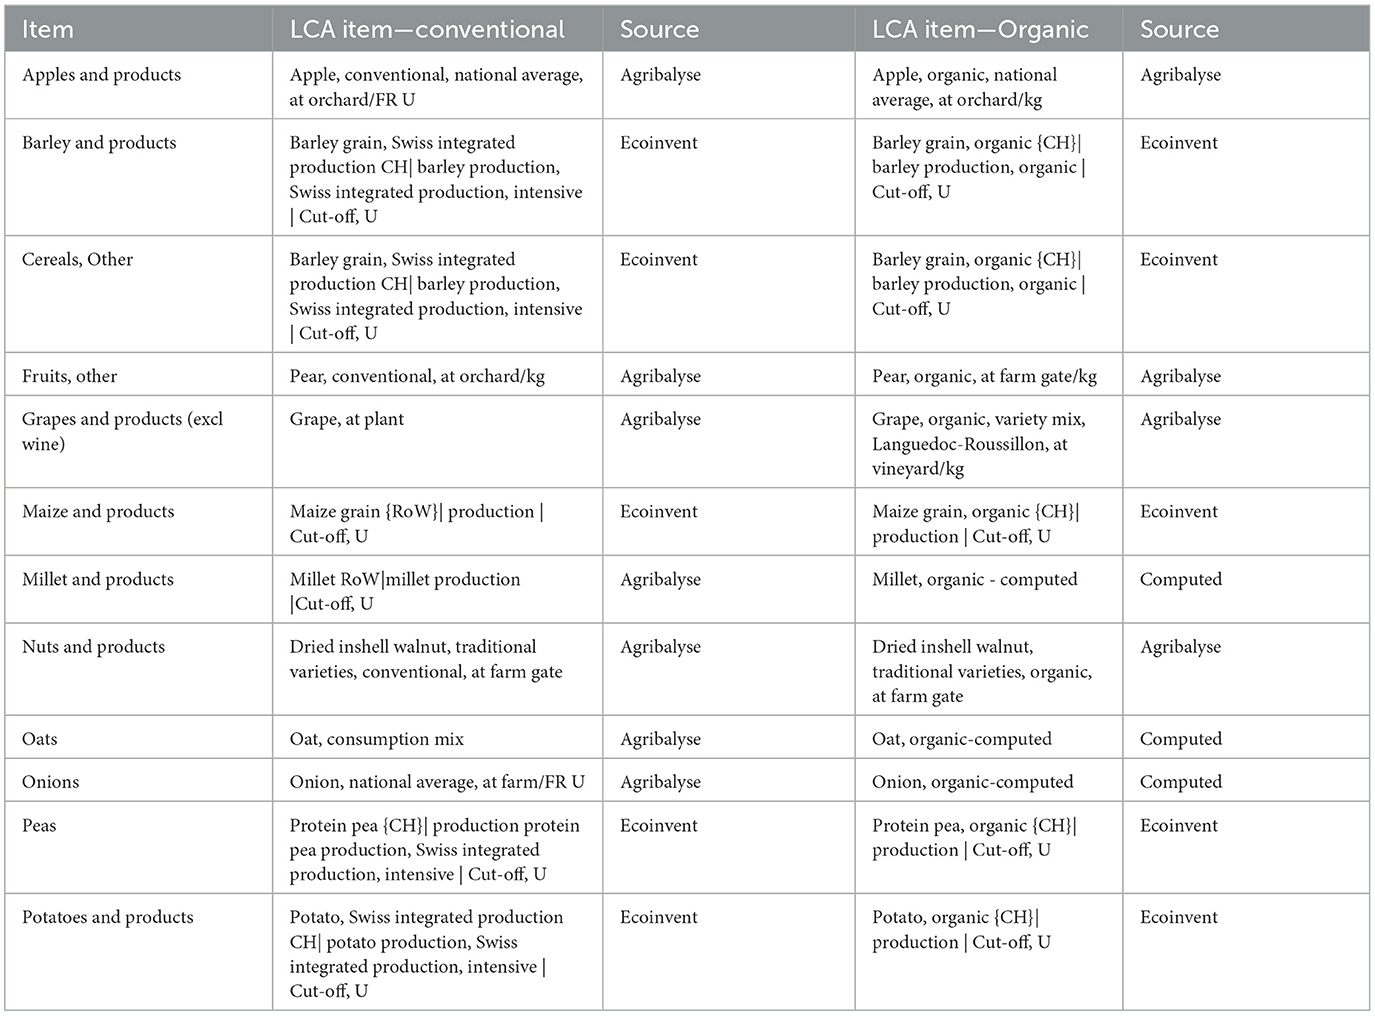
Table 3. LCA item for plants—Part 1.

Table 4. LCA item for plants—Part 2.
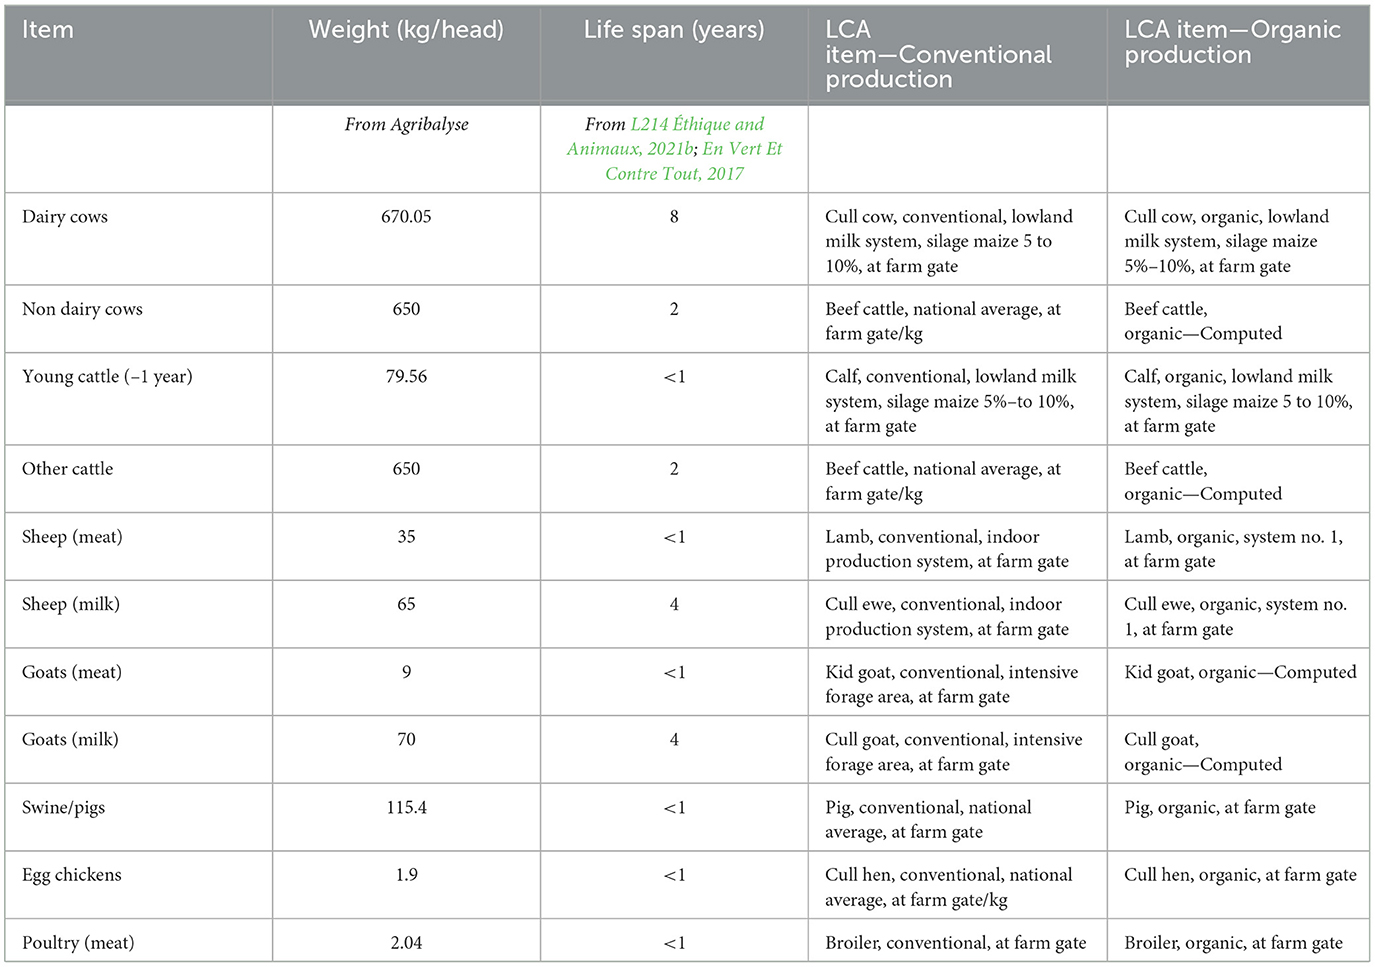
Table 5. LCA item for animals, weights and life spans.
The products that we consider use the Swiss Agricultural Life Cycle Assessment (SALCA) models to calculate direct field and farm emissions relevant for agriculture, such as N and P emissions. The model was calibrated and partly validated for Switzerland and can be applied in regions of similar pedoclimatic conditions (Nemecek et al., 2024).
2.4.4.1 Crop
Impacts have been calculated per kg of product. The selected products are summarized in Tables 3, 4, with most data from Switzerland.
The inventory description varies slightly depending on the item and the category. In general, the time boundary is “from harvest to harvest"—“life cycle of the orchard" for fruits—and the inventory includes:
• The processes of soil preparation and cultivation, sowing, weed control, fertilizatin, pest and pathogen control, harvest;
• The machines and shed or surface used to park them;
• All inputs as seed, fertilizers (mineral and organic), active substances, water for irrigation, fuels as well as the transport to the farm;
• The direct emissions of the fuel combustion, the abrasion of tires and the direct emissions on the field.
The inventory does not include post-harvest processes such as drying, sorting, and storage.
2.4.4.2 Livestock
The choice was made to calculate the impacts per animal head. Weights were taken from Agribalyse and lifespans from various sources (L214 Éthique and Animaux, 2021b; En Vert Et Contre Tout, 2017). As the Agribalyse database provides LCIA impacts per kg live weight, the impacts were then considered based on the total weight of the animal. This is summarized in Table 5. Unfortunately, no LCA data for livestock were available for Switzerland, so French data were used—though partly derived using the SALCA method (Nemecek et al., 2024).
In general, the time boundary is “from the birth of the animal until it leaves the farm"—the exception of dairy cows will be discussed later—and the inventory includes:
• All inputs as livestock (young animal), feeds, straw, water (watering and cleaning), fuels and energy as well as the transport to the farm;
• The buildings and barns;
• Emissions due to the effluent management and enteric emissions when applicable.
The inventory does not include veterinary products and care, artificial insemination processes, small cleaning materials and all processes that take place outside the farm (slaughtering, processing, conservation, etc.).
For dairy cows, the time boundary in the inventory is one year of production. However, the LCIA impacts for climate change corresponded to the whole life of a dairy cow, so the values were considered as if the time boundary was “from the birth of the animal until it leaves the farm".
2.4.4.3 Fish, seafood
One product that was calculated separately is the item “Fish, Seafood,” which corresponds to “Freshwater Fish" because it is the only fish or seafood produced in Switzerland. Its corresponding LCA item is “Large trout, 2–4 kg, conventional, at farm gate" from Agribalyse. The impacts are calculated per kg of product.
The inventory includes:
• All inputs as fish fry, feeds, fuels and energy well as the transport to the farm;
• The fish ponds;
• Direct emissions to the water.
Some organic LCA items were not available in the LCA databases and were inferred.
2.4.4.4 Livestock
First, the relative impact evolution between conventional and organic livestock was calculated for each impact category and livestock for which both organic and conventional LCA were available. Then, the missing organic LCA item was calculated from its corresponding conventional LCA item, using the average relative impact evolution of the relevant livestock (e.g. cull cow and calf for beef cattle). The results and details are presented in the data. “C" stands for “conventional" and “O" for “organic.”
2.4.4.5 Crop
The same process was used for the missing organic crop LCA items. The average relative impact evolution of the item category—e.g. cereals— was used when available. The results and details are shown in the data.
3 Results
The following Figure 5, Table 6 and Figure 6 show the environmental impacts. The results show that all 2050 scenarios have lower impacts than the ConvBASE current trend scenario for all impact categories, as can be seen in Figure 5. Apart from ConvBASE, the OrgEAT scenario is the most impactful for all impact categories except acidification and freshwater eutrophication, while the least impactful is ConvEAT, close to ConvSFP.
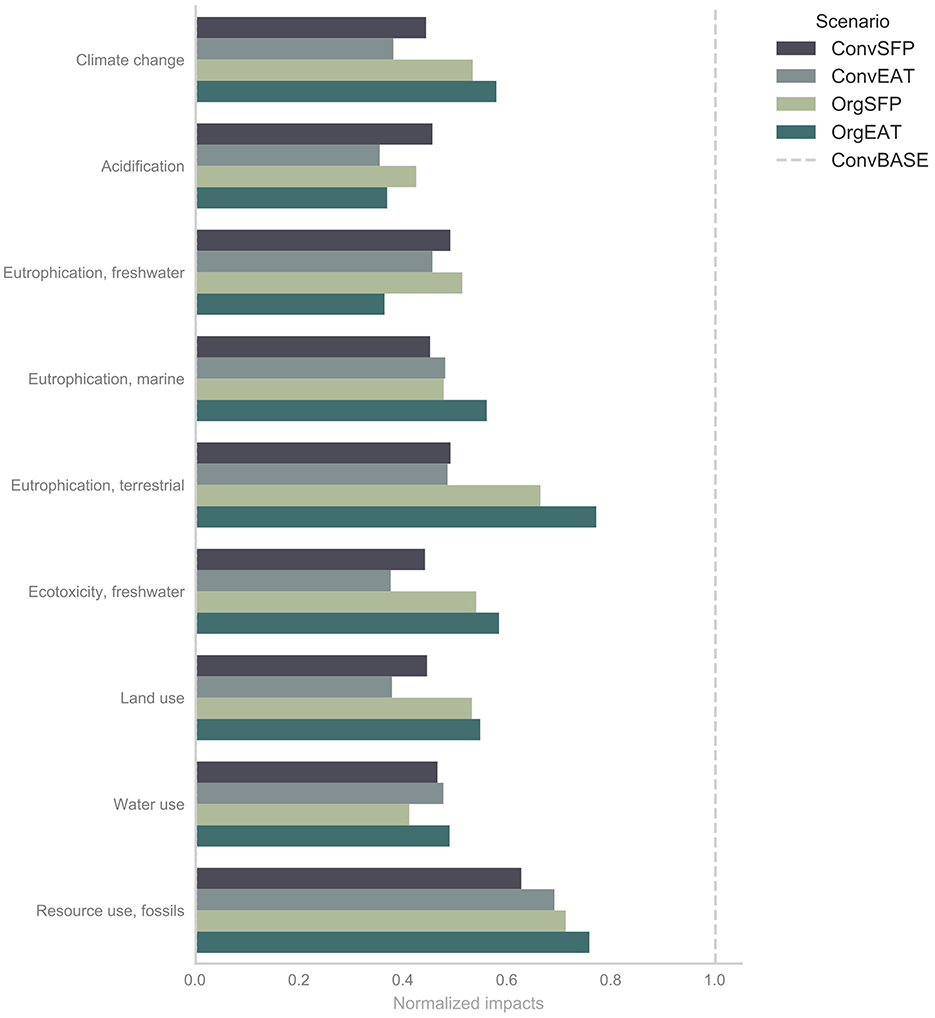
Figure 5. Aligning diets with nutritional guidelines reduces environmental impacts on a wide range of categories. This Figure shows the environmental impact comparison between the scenarios, compared to the current trend scenario ConvBASE, using LCA. The impact assessment for crops and fish only considers food production, as the impact of feed is already included in livestock products. Impacts have been normalized by impact category according to the highest absolute value, in this case those of ConvBASE. Positive values represent detrimental impacts. The higher the value, the greater the impact. For example, the ConvSFP scenario has the highest value for Climate Change, while the ConvEAT scenario has the lowest. Therefore, the scenario with the highest impact on climate change is OrgEAT, while the scenario with the lowest impact is ConvEAT.
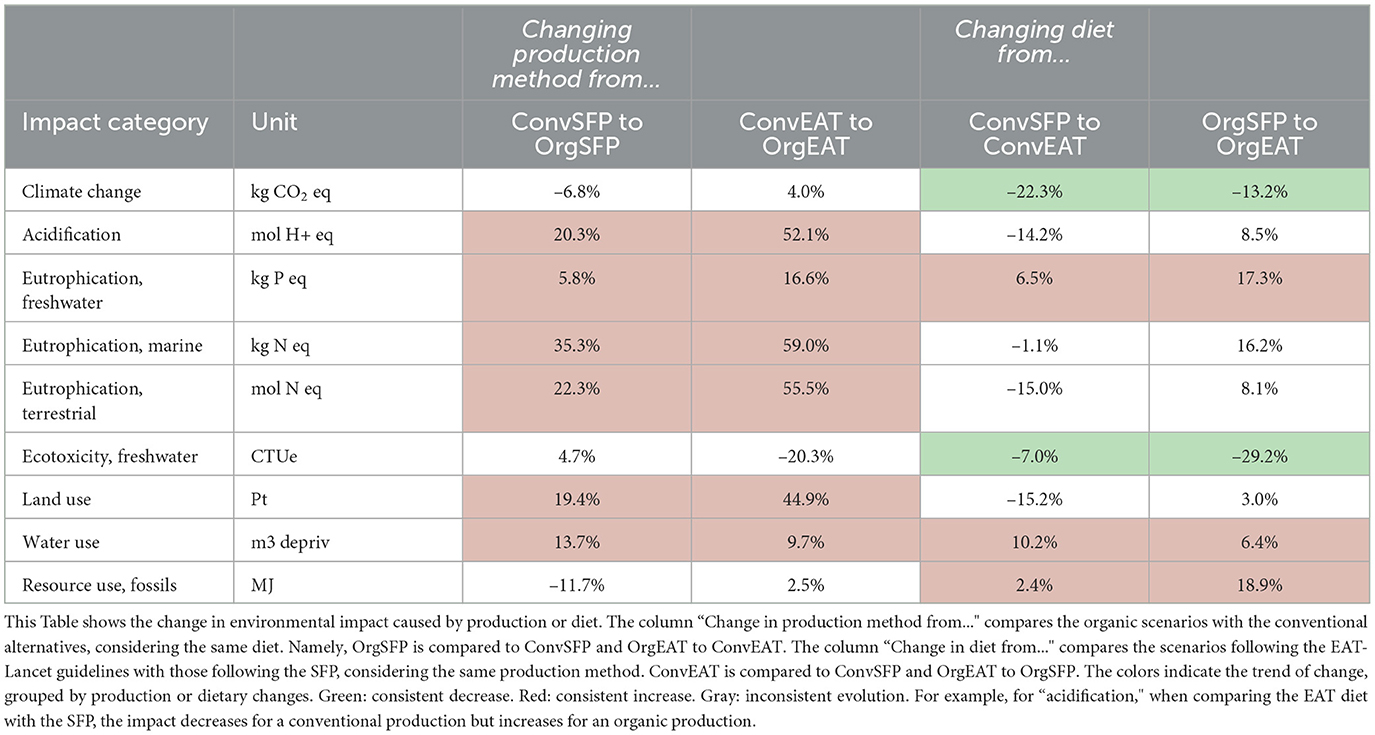
Table 6. Variation in environmental impacts from changing production method or diet (%).
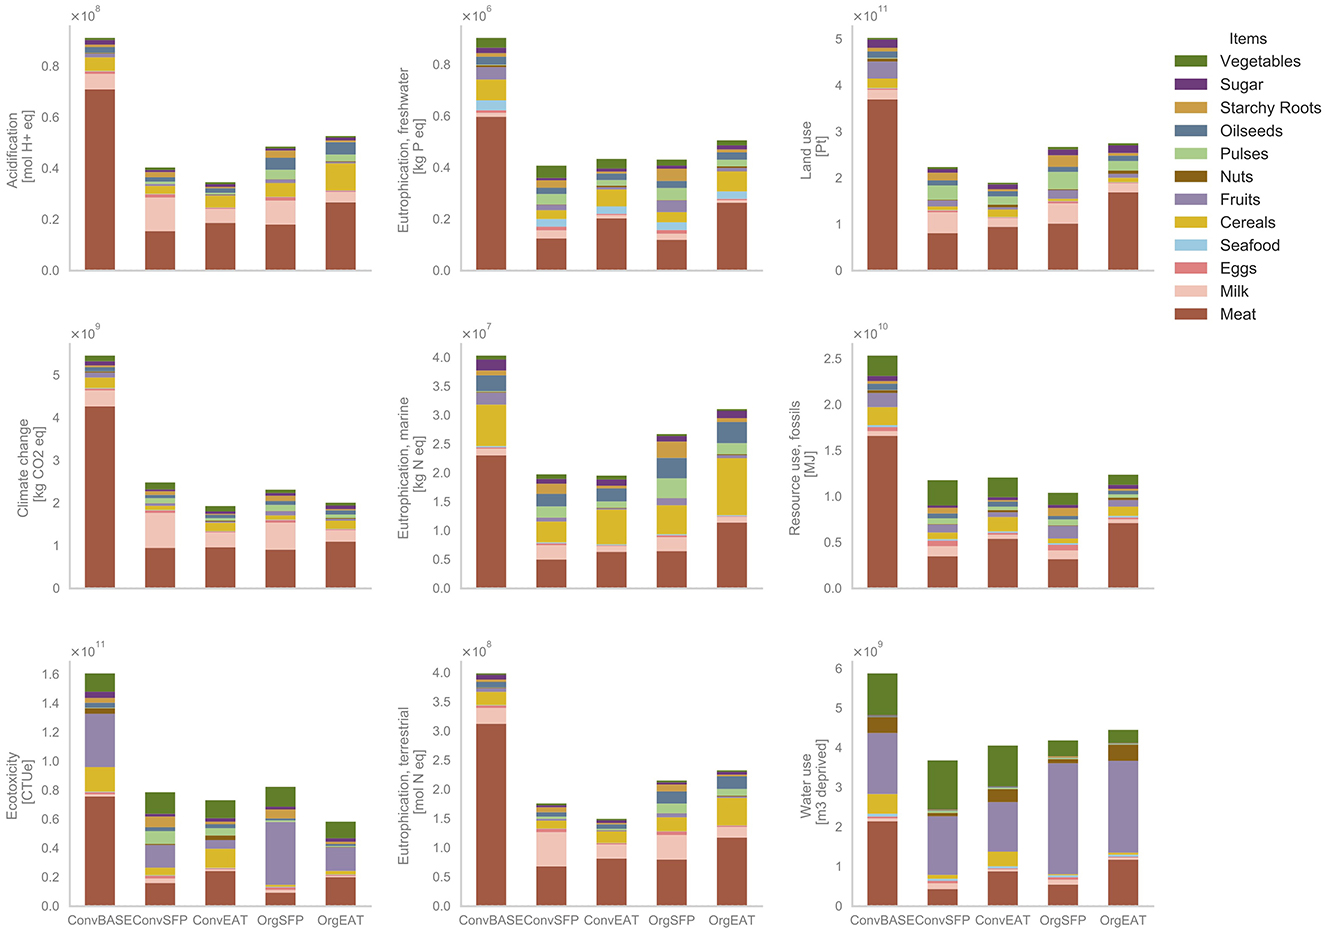
Figure 6. Aligning diets with nutritional guidelines reduces environmental footprints, with animal source food driving a significant share of the impacts. Detailed environmental impacts of the 2050 scenarios, comparing the business-as-usual scenario ConvBASE against consumption and production shifts, aggregated by food categories. The impacts have been assessed with LCA. Non aggregated version and classification in Supplementary material.
3.1 Organic agriculture vs. conventional agriculture
Considering both the SFP and EAT-Lancet diets, a shift from BAU production to OA leads to larger impacts for “acidification,” “eutrophication: freshwater, marine and terrestrial,” “land use" and “water use,” as shown in Figure 5 and detailed in Table 6. For other categories, the relative changes depend on the scenario diet.
3.1.1 Climate
For the SFP diet, the shift from BAU to OA reduces GHG emissions, whereas for the EAT-Lancet diet, emissions increase. Although cattle GHG emissions are lower in OA, poultry emissions are higher (+31.5%). The LCA data show that the direct emissions of organic poultry increase by 136% compared to conventional poultry. The LCA data also show that organic poultry receive more feed (+77.3%) and water (+71.9%), which would lead to more manure production and resulting emissions. Although the amount of feed is different, the total contribution is similar (–1.3% for OA). The case of poultry is peculiar, as other livestock do not show such a large difference in the total amount of feed. For example, organic cull cows are fed 34.8% less concentrate than conventional cows, excluding forage, and total GHG emissions are reduced by 8.9%.
3.1.2 Ecosystems
For both diets, the shift from BAU to OA increases acidification impacts (Table 6). A significant part of this increase is caused by organic poultry. Figure 6 shows that poultry related impacts increase when shifting from BAU to OA, although other livestock impacts are less divergent. For “Ecotoxicity, freshwater,” a shift from BAU to OA reduces impacts for the EAT-Lancet diet, but not for the SFP diet. Although the impacts for most crops and livestock decrease for a fully organic production due to the limitation of synthetic pesticides, they strongly increase for fruits (+320.5% for organic apples, +243.1% for organic grapes), mostly due to the sulfur input used as a fungicide. Considering the SFP or EAT-Lancet diet, the transition from BAU to OA leads to an increase in freshwater, marine and terrestrial eutrophication. Apart from the contribution of poultry, organic systems generally have lower eutrophication potential per unit area due to lower nutrient inputs, but higher per unit product due to lower yields than conventional systems (Tuomisto et al., 2012). One study concluded that more nitrogen was taken up by plants with the mineral fertilizer, while more nitrogen was released to soil and water with the organic fertilizer (Russo et al., 2010). A meta-analysis showed that organic sources resulted in an average of 16% higher losses through leaching of nitrate-N, but there was no significant difference overall (Hina, 2024).
3.1.3 Resource use
The transition to organic reduces the use of fossil resources for most crops and livestock (Table 6) due to greater energy efficiency (Clark, 2020). However, it increases again for organic poultry (+51.1%) due to the high intensity of conventional poultry production. This increase is partly due to energy for heat and electricity (+108%) and feed (+73.4%). In terms of water use, crops account for most of the impacts in all scenarios, especially fruits.
3.1.4 Land use impacts
For OA, the negative impacts are higher due to higher land use resulting from lower yields. For livestock, the impacts increase due to the high contribution of feed. This is particularly the case for poultry, where about 90% of the land use impacts are feed related for both organic and conventional.
3.2 EAT-Lancet vs. swiss food pyramid diet
For both production systems, the EAT-Lancet diet has lower impacts for “Climate change" and “Ecotoxicity, freshwater" and higher impacts for “Eutrophication, freshwater,” “Water use,” and “Resource use, fossils". No regularity can be found for other impact categories, as can be seen in the Table 6.
3.2.1 Climate
Animal Source Food (ASF) is responsible for the majority of GHG emissions in all scenarios. This is expected because enteric fermentation—the digestive process in ruminants that releases methane—and manure management—for both ruminants and non-ruminants—are high-emitting processes. When comparing diets and production methods, the greatest reduction in impact comes from dietary changes, particularly the reduction of livestock products. As detailed in Table 6, the EAT-Lancet diet causes less GHG emissions than the SFP diet due to a lower ASF content.
3.2.2 Ecosystems
In terms of acidification, the EAT-Lancet diet has lower impacts than the SFP for BAU production and higher impacts for organic production (Table 6). ASF are responsible for most of the acidification in all scenarios due to livestock manure, especially poultry manure. The ecotoxicity impacts of the EAT-Lancet diet are lower than those of the SFP diet. This is partly due to the production of grapes for wine for the SFP diet, which is not recommended for the EAT-Lancet diet. Since the main agricultural contribution to ecotoxicity is the use of pesticides, it makes sense that most of the impacts would be related to crops, especially fruits and vegetables. The SFP diet is less impactful than the EAT-Lancet in terms of freshwater and marine eutrophication, for both production methods. For terrestrial eutrophication, the EAT Lancet is less impactful for BAU production and more impactful for OA. Much of this increase is related to poultry, as organic broilers have higher eutrophication impacts than conventional broilers.
3.2.3 Resource use
In terms of “resource use, fossil,” as detailed in Table 6, the EAT-Lancet diet has more impacts than the SFP diet for both production methods, due to a higher number of animals raised indoors, such as poultry, and fewer grazing animals, which require less infrastructure and therefore less energy. Tomatoes represent a significant part of the impacts, as they are considered to be produced in greenhouses in both scenarios. The EAT-Lancet diet uses more water than the SFP. Fruit is a water-intensive crop, as it represents only 3% of the EAT-Lancet diet, but accounts for about 25% of the impacts for BAU production and 50% for OA.
3.2.4 Land use impacts
The EAT-Lancet diet is more impactful regarding “land use" than the Swiss diet.
3.3 Crop area feasibility
The results show that the ConvBASE, ConvSFP, ConvEAT, and OrgEAT scenarios free up 17, 91, 109, and 18 kha of land, respectively, compared to the arable land available in 2050, while the OrgSFP scenario would require an additional 18 kha, which is roughly the same as the arable land available in the Reference 2018 scenario.
4 Discussion
The results support studies showing that organic systems have lower energy requirements (Tuomisto et al., 2012), which can be linked to the lower impacts on “climate change" observed for OA for most crops and livestock. The results also support studies showing that eutrophication and acidification were higher per unit of product in organic systems (Tuomisto et al., 2012). With regard to biodiversity, which is cited by many studies as a key benefit of organic farming (Tuomisto et al., 2012; Mondelaers et al., 2009; de Ponti et al., 2012), the type of LCA measurement does not provide direct information. However, OA is better in terms of “ecotoxicity, freshwater,” which could support lower impacts in terms of biodiversity. A crucial aspect of the debate on the role of OA in future global food production is whether organic farming can produce enough food to feed the world's population (de Ponti et al., 2012). Currently, organic crop yields are on average 80% of conventional yields, with large variations depending on the product and context (de Ponti et al., 2012; FiBL, 2023), and is one of the main challenges for OA (Tuomisto et al., 2012). However, the yield gap between organic and conventional farming is expected to decrease as a result of the learning curve (FiBL, 2023) and the decrease in soil fertility due to conventional farming practices (Schrama et al., 2018). Another key aspect is organic standards. OA is a farming method that has a comprehensive scientific definition and is regulated by various authorities around the world, with standards consisting primarily of technical checklists outlining practices to avoid (Schreefel, 2020). However, these standards often fall short of fully encompassing the aspects at the heart of the organic philosophy and can constrain farmers by the regulations imposed to ensure the supply of organic compliant products (Schreefel, 2020). The Organic 3.0 strategy recognizes this issue and aims to address it by becoming less prescriptive and more descriptive, moving toward outcome-based regulation (Schreefel, 2020; IFOAM, 2017). Organic farming is therefore expected to improve in terms of yields, nutrient management and environmental impact.
With regard to diet, the results highlight the high impact of the current Swiss diet. The results show that ASF account for the majority of the impacts on “climate change,” “acidification" and “eutrophication, terrestrial" for all scenarios. A dietary shift away from ASF could significantly reduce the production-related health burden and ecosystem degradation while limiting carbon emissions (Lucas et al., 2023). This study also shows that the EAT-Lancet recommendations are not always the least impactful. Our results show that the recommended amount of poultry meat to meet protein needs results in more externalities on “eutrophication, freshwater,” “eutrophication, marine,” “water use,” and “resource use, fossil" than the SFP diet, as the latter includes a higher proportion of plant-based protein sources. Reducing red meat consumption is crucial to reduce GHG emissions, but replacing it with poultry does not seem ideal in terms of other impacts, especially when replacing grass-fed cattle in Switzerland. Current poultry farming practices should be reconsidered to meet broader sustainability goals. Depending on management practices and land use considerations, cattle may be less impactful than poultry. The large area of grassland in Switzerland is indeed favorable for grazing animals and other land use impacts are yet to be identified. However, even the SFP diet considers a reduction in meat consumption, and implementing dietary change is a complex issue. In high-income countries, the belief that eating meat is “natural, normal, necessary and nice" is the common rationalization used by people to defend their choice to eat meat (Piazza et al., 2015). Changing such social norms requires the coordinated efforts of civil society, health organizations, and government, as seen in the case of smoking norms (Godfray et al., 2018). In terms of barriers to sustainable eating practices, one study identified the main causes of overconsumption and food waste as lack of nutritional education and poor access to appropriate food resources or reduced availability of freshly produced food (Balan et al., 2022). The findings suggest that technological advances, organizational changes and societal innovations need to be combined to achieve sustainable eating pratices (Davies, 2013).
The scenario analysis is strongly influenced by poultry, especially when fully organic production is combined with the EAT-Lancet diet. First, the environmental impacts of organic poultry exceed those of conventional poultry in most categories. However, the LCA data show that the organic animals receive almost twice as much feed, water and straw. It is often reported by animal welfare organizations that poultry farming is one of the most intensive industries (L214 Éthique and Animaux, 2021a; Vakita, 2023). It may therefore be particularly biased when comparing production methods. Secondly, these differences in environmental impact are further exacerbated by the EAT-Lancet diet and our modeling choices. The EAT-Lancet recommends 29 g/person/day of poultry meat, while the SFP diet recommends 28 g/person/day of meat, from which we extrapolated that 20% would be poultry based on 2018 meat production data.
In terms of land use, moving to a fully organic food system requires more arable land: +43% for the SFP diet and +39% for the EAT-Lancet diet relative to the reference (Figure 7). The EAT-Lancet diet requires less arable land than the SFP diet: –7% for BAU production and –9% for OA production. The ConvBASE, ConvSFP, ConvEAT and OrgEAT scenarios release arable land compared to the available arable land in 2050. Livestock land has not been considered because it may change depending on livestock density, which would introduce animal welfare parameters not considered in this study. The land freed up by crops could be affected as follows:
• Production land to increase the self-sufficiency ratio.
• Biodiversity-promoting areas of high biological quality: to support the Aichi Objectives and Switzerland's goal of reaching one-sixth of the agricultural land dedicated to biodiversity promotion (Suisse, 2022). The freed up land represents 5.3%, 36.5%, 47.3%, and 5.5% of the agricultural land (excluding grassland) of the ConvBASE, ConvSFP, ConvEAT, and OrgEAT scenarios. Therefore, scenarios ConvSFP and ConvEAT allow to successfully reach the Swiss objectives while providing excess land to allocate to other targets, whereas the scenarios ConvBASE and OrgEAT partially meet the objective.
• Forests: to store carbon and to profit of other ecosystems services. Each forest hectare can remove 1–2 tons of CO2 from the atmosphere every year, stored in its biomass (Klaus, 2020). Therefore, the scenarios ConvBASEn ConvSFP, ConvEAT, and OrgEAT could remove up to 35, 182, 220, and 35 kt CO2 per year, which represent 0.65%, 7.4%, 11.4%, and 1.8% of the scenarios respective GHG emissions.
• Energy or fiber crops: to support the decarbonization of other sectors. However, for this solution to be sustainable, careful considerations around the whole agri-food system, both intra and extra agri-food system, should be accounted.
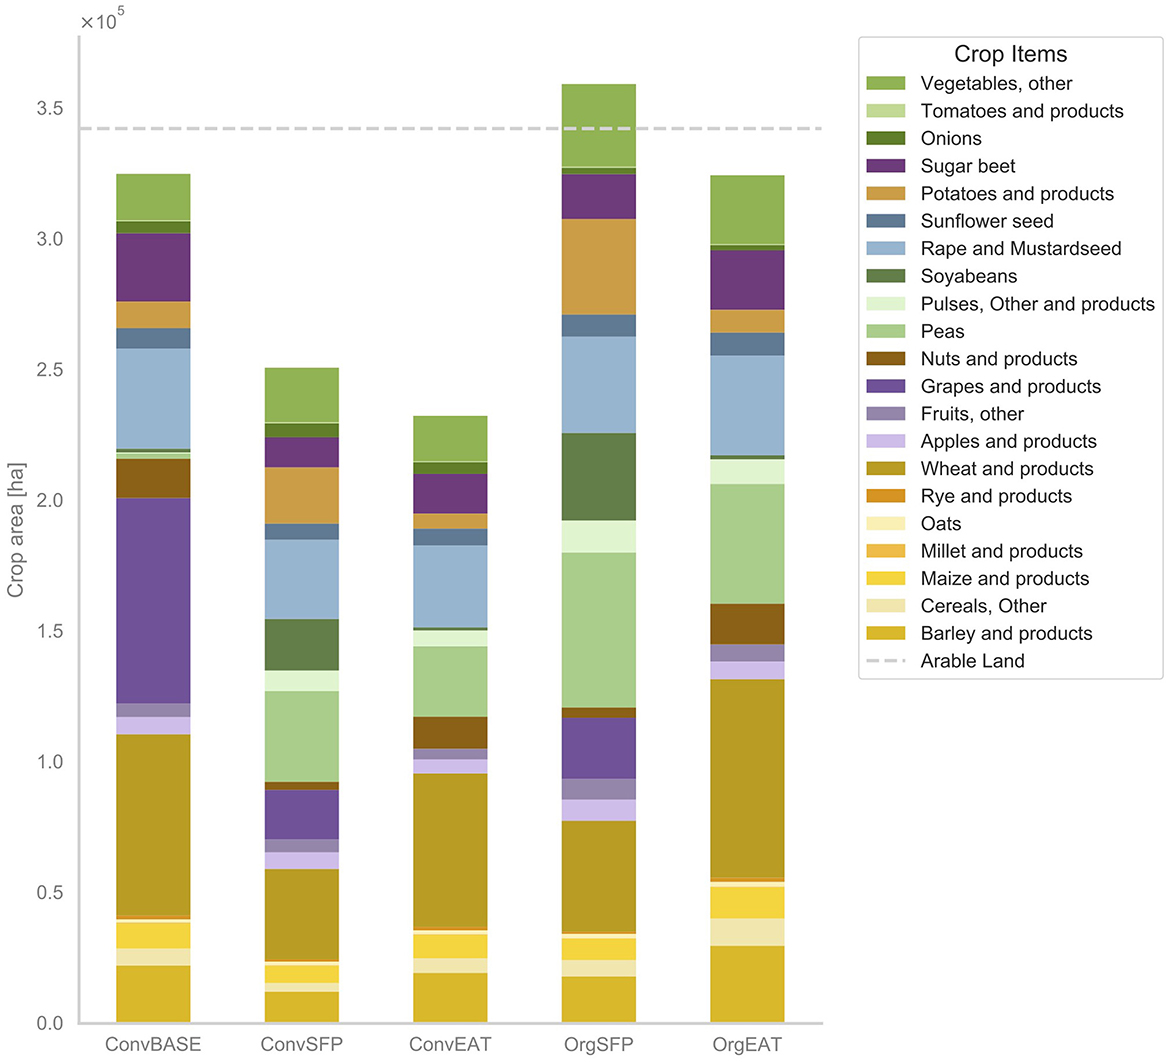
Figure 7. Aligning diets with nutritional guidelines frees-up land for other uses, although a shift toward 100% organic production requires more land. This Figure shows the crop land use for the 2050 scenarios, compared against the projected arable land available in 2050.
In terms of approach, LCA data for agri-food products is relatively new, especially for items produced using unconventional methods. Furthermore, not everything can or should be measured by LCA, such as animal welfare. There is a possibility that a small part of the impact of manure management is double counted, as it is accounted for in livestock LCA items under manure management, but some of it may be used as crop fertilizer, which is accounted for in crop LCA items. However, the calculation of the reference year showed that the assessment was relevant and accurate. In addition, the current state of research on organic agriculture is not sufficient to provide detailed data at the country level for all commodities. Therefore, some assumptions have been made. In addition, the impact of imports is not considered, but is essential to assess the overall sustainability of the scenarios. However, we assume the same level of self-sufficiency in all scenarios to allow for a relevant comparison.
Regarding model testing against references, the impact category used for comparison is “climate change" because the greenhouse gas emissions have already been estimated by the Federal Office for the Environment:
• In 2018, the Swiss agri-food system was responsible for 7.61 Mt CO2 eq (Perotti, 2020).
• In 2018, Swiss livestock-related emissions reached 4.69 Mt CO2 eq, including enteric fermentation and manure management (FOEN, 2023).
The results obtained with our model are:
• 5.14 Mt CO2 eq for livestock emissions, a relative discrepancy of 9.6% with the official estimates;
• 0.01 Mt CO2 eq for fish related emissions;
• 0.79 Mt CO2 eq for crop emissions;
• Total value of 5.93 Mt CO2 eq for the agri-food sector, thus a relative discrepancy of –22.1% with respect to the official estimates.
Livestock emissions are relatively accurate. GHG emissions from crop production are likely to be underestimated because processing and transportation of products are not included and can cause significant emissions (Initiative, 2022). Differences are expected due to differences in data sources.
The results support that changes in both production methods and diets are needed to address the environmental problems of the agri-food system, and that both need to be addressed in a context-sensitive manner. Adherence to dietary guidelines (either SFP or EAT-Lancet) would represent a strong improvement in terms of both environmental and health sustainability. On the production side, however, organic farming may not be the best alternative. Further research and impact quantification is needed on other options such as regenerative agriculture, agroforestry and agroecology. While much emphasis is placed on finding solutions that are less impactful, better alternatives should embody the potential benefits that can be created. Incorporating elements such as legumes into crops could have a significant environmental impact, as legumes contribute to soil fertility and reduce the need for fertilizer. As the climate changes, the inclusion of drought and pest resistant crops such as millet should also be considered as a nature-based solution to address potential productivity losses. Considering the entire value chain, True Cost Accounting for Food (TCAF) is also proposed as a tool to shift consumption and production simultaneously. Overall, the results highlight that the implementation of the best diet and alternative production method may trigger unforeseen interactions and emphasize the need for a systemic approach.
Data availability statement
The datasets presented in this study can be found in online repositories. The complete data is open access: https://github.com/acrosnier/data_diet_OA.
Author contributions
AC: Writing – original draft. GB: Writing – review & editing. LJ: Writing – review & editing. PT: Writing – review & editing.
Funding
The author(s) declare that financial support was received for the research and/or publication of this article. This research was funded in part by the Swiss National Science Foundation (SNSF) [216652].
Conflict of interest
The authors declare that the research was conducted in the absence of any commercial or financial relationships that could be construed as a potential conflict of interest.
Generative AI statement
The author(s) declare that no Gen AI was used in the creation of this manuscript.
Publisher's note
All claims expressed in this article are solely those of the authors and do not necessarily represent those of their affiliated organizations, or those of the publisher, the editors and the reviewers. Any product that may be evaluated in this article, or claim that may be made by its manufacturer, is not guaranteed or endorsed by the publisher.
Supplementary material
The Supplementary Material for this article can be found online at: https://www.frontiersin.org/articles/10.3389/fsufs.2025.1548480/full#supplementary-material
References
Agroscope (2017). Umwelt- und ressourcenschonende Ernährung: Detaillierte Analyse für die Schweiz. Technical report.
Arfini, F., and Bellassen, V. (Eds.) (2019). Sustainability of European Food Quality Schemes: Multi-Performance, Structure, and Governance of PDO, PGI, and Organic Agri-Food Systems. Cham: Springer International Publishing. doi: 10.1007/978-3-030-27508-2
Balan, I. M., Gherman, E. D., Brad, I., Gherman, R., Horablaga, A., Trasca, T. I., et al. (2022). Metabolic food waste as food insecurity factor—causes and preventions. Foods 11:2179. doi: 10.3390/foods11152179
Campbell, B., and Beare, D. E. (2017). Agriculture production as a major driver of the Earth system exceeding planetary boundaries. Ecology and Society. doi: 10.5751/ES-09595-220408
Cederberg, C., and Mattsson, B. (2000). Life cycle assessment of milk production — a comparison of conventional and organic farming. J. Clean. Product. 8, 49–60. doi: 10.1016/S0959-6526(99)00311-X
Clark, S. (2020). Organic farming and climate change: the need for innovation. Sustainability 12:7012. doi: 10.3390/su12177012
Crippa, M., Solazzo, E., Guizzardi, D., Monforti-Ferrario, F., Tubiello, F. N., Leip, A., et al. (2021). Food systems are responsible for a third of global anthropogenic GHG emissions. Nat. Food 2, 198–209. doi: 10.1038/s43016-021-00225-9
Damiani, M., Ferrara, N., and Ardente, F. (2021). Understanding Product environmental Footprint and organisation Environmental footprint methods. Brussels: Publications Office of the European Union.
Davies, A. R. (2013). Food futures: co-designing sustainable eating practices for 2050. EuroChoices 12, 4–11. doi: 10.1111/1746-692X.12029
de Ponti, T., Rijk, B., and van Ittersum, M. K. (2012). The crop yield gap between organic and conventional agriculture. Agric. Syst. 108, 1–9. doi: 10.1016/j.agsy.2011.12.004
Erdin, D. (2023). Agristat: données chiffrées sur l'agriculture et l'alimentation. Union Suisse des Paysans.
Fefereal Office for the Environment FOEN (2023). Greenhouse gas emissions of Switzerland 1990-2021. Bern: FOEN.
FiBL and IFOAM (2018). The world of organic agriculture, statistics and emerging trends 2018. Switzerland: FiBL.
Godfray, H. C. J., Aveyard, P., Garnett, T., Hall, J. W., Key, T. J., Lorimer, J., et al. (2018). Meat consumption, health, and the environment. Science 361:eaam5324. doi: 10.1126/science.aam5324
Hina, N. S. (2024). Global meta-analysis of nitrate leaching vulnerability in synthetic and organic fertilizers over the past four decades. Water. doi: 10.3390/w16030457
IFOAM (2017). Organic 3.0: For Truly Sustainable Farming & Consumption. IFOAM - Organics International.
L214 Éthique and Animaux (2021a). L'élevage des poulets de chair: Conditions de vie et enjeux. Available online at: https://www.l214.com/animaux/poulets/elevage-des-poulets-de-chair/
L214 Éthique and Animaux (2021b). Espérance de vie des animaux utilisés pour la viande, le lait et les æufs. Available online at: https://www.l214.com/animaux/chiffres-cles/esperance-vie-animaux-viande-lait-oeufs/
Lorenz, K., and Lal, R. (2016). “Chapter three - Environmental impact of organic agriculture,” inAdvances in Agronomy, Volume 139 of Advances in Agronomy, ed. D. L. Sparks (San Diego, CA: Academic Press), 99–152. doi: 10.1016/bs.agron.2016.05.003
Lucas, E., Guo, M., and Guillén-Gosálbez, G. (2023). Low-carbon diets can reduce global ecological and health costs. Nat. Food 4, 394–406. doi: 10.1038/s43016-023-00749-2
Mondelaers, K., Aertsens, J., and Van Huylenbroeck, G. (2009). A meta-analysis of the differences in environmental impacts between organic and conventional farming. Br. Food J. 111, 1098–1119. doi: 10.1108/00070700910992925
Muller, A., Schader, C., El-Hage Scialabba, N., Brüggemann, J., Isensee, A., Erb, K.-H., et al. (2017). Strategies for feeding the world more sustainably with organic agriculture. Nat. Commun. 8:1290. doi: 10.1038/s41467-017-01410-w
Nemecek, T., Roesch, A., Bystricky, M., Jeanneret, P., Lansche, J., Stüssi, M., et al. (2024). Swiss agricultural life cycle assessment: a method to assess the emissions and environmental impacts of agricultural systems and products. Int. J. Life Cycle Assess. 29, 433–455. doi: 10.1007/s11367-023-02255-w
OFAG OSAV, and OFEV. (2023). Stratégie climat pour l'agriculture et l'alimentation 2050. Technical report. Office fédéral de l'agriculture OFAG, Office fédéral de la sécurité alimentaire et des affaires vétérinaires OSAV, Office fédéral de l‘environnement OFEV.
Office Fédcral de la Statistique (2021). Statistique de la superficie, utilisation du sol - Cantons et grandes régions selon 46 catégories de base - 1979-1985, 1992–199, 2004-2009, 2013-2018 |Tableau. Office Fédéral de la Statistique OFS.
Office Fédéral de la Statistique (OFS) (2013). Exploitations agricoles et animaux de rente selon le niveau de classification 3 par canton. Office Fédéral de la Statistique OFS. Available online at: https://www.bfs.admin.ch/bfs/fr/home/statistiques/catalogues-banques-donnees.assetdetail.px-x-0702000000_108.html
Office Fédéral de la Statistique (OFS) (2023). Exploitations agricoles et surface agricole utile (SAU) selon le niveau de classification 3 par canton. Available online at: https://www.bfs.admin.ch/asset/fr/31846453
Perotti, A. (2020). Moving Towards a Sustainable Swiss Food System: An Estimation of the True Cost of Food in Switzerland and Implications for Stakeholders. ETH Zürich.
Piazza, J., Ruby, M. B., Loughnan, S., Luong, M., Kulik, J., Watkins, H. M., et al. (2015). Rationalizing meat consumption. The 4Ns. Appetite 91, 114–128. doi: 10.1016/j.appet.2015.04.011
Price, B., Kienast, F., Seidl, I., Ginzler, C., Verburg, P. H., Bolliger, J., et al. (2015). Future landscapes of Switzerland: risk areas for urbanisation and land abandonment. Appl. Geogr. 57, 32–41. doi: 10.1016/j.apgeog.2014.12.009
Proviande (2022). Le Marché de la Viande 2022. Available online at: https://www.proviande.ch/sites/proviande/files/2023-04/Der Fleischmarkt im Überblick 2022.pdf
Russo, M. A., Belligno, A., Wu, J. Y., and Sardo, V. (2010). Comparing mineral and organic nitrogen fertilizer impact on the soil-plant-water system in a succession of three crops. Recent Res. Sci. Technol. 2. Available online at: https://updatepublishing.com/journal/index.php/rrst/article/view/348
Schrama, M., de Haan, J. J., Kroonen, M., Verstegen, H., and Van der Putten, W. H. (2018). Crop yield gap and stability in organic and conventional farming systems. Agric. Ecosyst. Environ. 256, 123–130. doi: 10.1016/j.agee.2017.12.023
Schreefel, L., Schulte, R. P. O., de Boer, I. J. M., Schrijver, A. P., and van Zanten, H. H. E. (2020). Regenerative agriculture – the soil is the base. Glob. Food Secur. 26:100404. doi: 10.1016/j.gfs.2020.100404
Strapasson, A., Woods, J., and Mbuk, K. (2016). Land Use Futures in Europe. Briefing Paper No 17, Imperial College London. Available online at: https://www.imperial.ac.uk/media/imperial-college/grantham-institute/public/publications/briefing-papers/Land-Use-Futures-in-Europe—web-version-v3.pdf
Thomassen, M. A., van Calker, K. J., Smits, M. C. J., Iepema, G. L., and de Boer, I. J. M. (2008). Life cycle assessment of conventional and organic milk production in the Netherlands. Agric. Syst. 96, 95–107. doi: 10.1016/j.agsy.2007.06.001
True Cost Initiative (2022). True Cost Accounting Agrifood Handbook. Technical report. True Cost – From Costs to Benefits Initiative.
Tuomisto, H. L., Hodge, I. D., Riordan, P., and Macdonald, D. W. (2012). Does organic farming reduce environmental impacts? – a meta-analysis of European research. J. Environ. Manag. 112, 309–320. doi: 10.1016/j.jenvman.2012.08.018
Vakita (2023). frLes vrais chiffres de lélevage intensif en France. Available online at: https://www.vakita.fr/fr/elevage-intensif-data
Keywords: farm to fork, environmental impact assessment, healthy diets, sustainable diets, organic agriculture, Life Cycle Assessment
Citation: Crosnier A, Baudry G, Jeangros L and Thalmann P (2025) Environmental impact assessment of nutritional guidelines under organic agriculture in Switzerland. Front. Sustain. Food Syst. 9:1548480. doi: 10.3389/fsufs.2025.1548480
Received: 19 December 2024; Accepted: 06 March 2025;
Published: 26 March 2025.
Edited by:
Shalander Kumar, International Crops Research Institute for the Semi-Arid Tropics (ICRISAT), IndiaReviewed by:
Aida Turrini, Independent Researcher, Scansano, ItalyAdam Canning, James Cook University, Australia
Copyright © 2025 Crosnier, Baudry, Jeangros and Thalmann. This is an open-access article distributed under the terms of the Creative Commons Attribution License (CC BY). The use, distribution or reproduction in other forums is permitted, provided the original author(s) and the copyright owner(s) are credited and that the original publication in this journal is cited, in accordance with accepted academic practice. No use, distribution or reproduction is permitted which does not comply with these terms.
*Correspondence: Agathe Crosnier, YWdhdGhlLmNyb3NuaWVyQGVwZmwuY2g=