 Zhimin Zhang1
 Xiaojuan Wang
94% of researchers rate our articles as excellent or good
Learn more about the work of our research integrity team to safeguard the quality of each article we publish.
Find out more
ORIGINAL RESEARCH article
Front. Sustain. Food Syst., 14 March 2025
Sec. Agricultural and Food Economics
Volume 9 - 2025 | https://doi.org/10.3389/fsufs.2025.1547969
This article is part of the Research TopicEnvironmental Resilience and Sustainable Agri-food System ManagementView all 15 articles
As one of the most significant global challenges of the 21st century, climate change has had a substantial impact on global agricultural production and trade. This paper adopts an empirical approach to examine the impact of climate disaster risk on the welfare of global agricultural trade across 114 countries, as measured by the varieties-corrected terms of trade from 2002 to 2021. The study finds that, over the past two decades, the terms of trade for agricultural products have improved in 50 countries. In contrast, the terms of trade for agricultural products have worsened in 22 countries. Additionally, the terms of trade for 42 countries have exhibited volatility. Moreover, climate disaster risk has the potential to boost agricultural trade welfare in the short term. However, in the long term, such risk leads to supply constraints and lower trade welfare in global markets by disrupting supply chains. Specifically, the agricultural trade welfare of highly open economies, non-high-income countries, and those relying on primary agricultural products is more susceptible to adverse shocks caused by climate disaster risk. This study offers new insights into addressing climate change and ensuring the stability and growth of global agricultural trade welfare.
The phenomenon of climate change has emerged as a significant global challenge, threatening natural ecosystems and posing a substantial risk to socio-economic wellbeing (Hoegh-Guldberg et al., 2019; Smith et al., 2009). It is estimated that the global average temperature in 2022 has already risen by 1.13°C relative to pre-industrial levels. Moreover, the period between 2015 and 2022 is recorded as the warmest eight-year span since the inception of meteorological observation (China Meteorological Administration, 2023). At the same time, there has been a discernible increase in the frequency and intensity of extreme weather events. Over the past five decades, climate-related disasters have accounted for 50% of all natural disasters, resulting in 45% of deaths and up to 74% of economic losses (World Meteorological Organization, 2021).
The risks and challenges posed by climate disasters to agricultural products and trade differ from those affecting other industries due to several factors, including seasonality, cyclicality, and perishability, the high cost and low profitability of agricultural products, and the vulnerability of trade networks (Guo et al., 2023; Carleton and Hsiang, 2016). In the short term, the consequences of climate disasters on agricultural production and trade are diverse and considerable. These events lead to reduced crop yields, a decline in quality, and even complete losses, which in turn, disrupt supply chains, cause price volatility, and affect international trade dynamics for agricultural products. Over the long term, fluctuations in climatic variables impact land productivity and the environmental conditions necessary for crop growth, thereby influencing production patterns and the export competitiveness of agricultural products. Yildirim and Demir (2022) found that flooding resulted in average annualized losses exceeding $230 million for maize, soybeans, and alfalfa crops in Iowa, USA. In particular, the growing frequency and intensifying impact of climate disasters in recent years have heightened volatility in agricultural markets, thereby posing new challenges to global agricultural production and trade.
The ultimate objective of a country’s trade activities is to enhance the welfare of both consumers and producers. The assessment of the welfare effects of trade has consistently constituted a prominent area of research within the field of economics. In contrast to trade flows, which reflect the generation, conversion, exchange, transfer and disappearance of economic values or quantities in international trade over a specified period, the terms of trade serve as a key indicator for measuring a country’s relative position within the international division of labor. They represent the economic welfare derived from a country’s foreign trade on a macro level (Krugman, 2009). Mill (1848) investigated exchange ratios in international trade in Principles of Political Economy with Some of Their Applications, where he first introduced the concept of terms of trade, which describes the relative ratio between the price of a country’s export commodities and the price of its import commodities. Since then, numerous scholars have undertaken research on terms of trade, exploring its formulaic measurement (Feenstra, 1994; Feenstra and Kee, 2004; Broda and Weinstein, 2006); the factors influencing it (Goyal and Kumar, 2021); and the characteristics of its trends (Galstyan and Lane, 2008; Qian et al., 2010), among other related research areas.
The extensive academic attention devoted to the concept of terms of trade underscores its central importance in the field of international trade. However, current research on the terms of trade of agricultural products still suffers from several limitations: First, research on the terms of trade in agriculture often employs the fixed-varieties measurement method. Huang (2008), Li (2009), and Zhang and Yin (2010) used this approach and found that, despite China’s status as a leading agricultural trading nation, the expansion of its agricultural trade volume did not result in corresponding gains in agricultural trade welfare. In fact, during certain periods, China’s agricultural trade welfare exhibited a more pronounced downward trend. However, as Blonigen and Soderbery (2010) and Qian et al. (2010) have pointed out, the fixed-varieties measurement method systematically underestimates the terms of trade compared to the method that accounts for changes in varieties. Xu and Zhu (2017) are among the few studies to focus on the terms of trade of agricultural products from the perspective of variety changes. They employed the varieties-corrected measurement method to assess the changes in China’s agricultural terms of trade from 2002 to 2015. Their findings indicate that China’s agricultural terms of trade improved by an average of 2.47% after accounting for changes in varieties. Furthermore, the long-term trend does not show a significant decline when compared to the fixed-varieties terms of trade. However, fluctuations in global trade policies, frequent climate anomalies, and geopolitical instability in recent years have significantly impacted the dynamics of international agricultural markets and trade, making it difficult for a single-country research framework to comprehensively capture the complexities of the terms of trade. Although the findings of Xu and Zhu (2017) offer valuable insights, they are limited in their ability to fully capture the intricate nuances of contemporary agricultural trade dynamics and their future evolution. There is a pressing need for a comprehensive, scientific assessment of global agricultural trade welfare, using a global perspective and a measurement framework that incorporates the varieties-corrected terms of trade. This approach would provide a robust data foundation for a deeper understanding and more accurate predictions of long-term trends in agricultural trade markets.
Second, regarding factors affecting trade welfare, existing studies predominantly focus on the impacts of endogenous factors such as economic growth patterns, exchange rates, tariffs and export subsidies on a country’s trade welfare (Ganbaatar et al., 2021; Lebre de Freitas, 2023). As Krugman (2009) found, export-oriented growth in other countries contributes to improving the country’s trade welfare; whereas import-oriented growth in other countries can deteriorate the country’s trade welfare. However, the impacts of exogenous factors, such as the negative effects of climate disasters—summarized as climate disaster risk—on trade welfare remain underexplored. Climate change not only profoundly influences global trade patterns but also directly affects the vulnerability and adaptive capacity of national economies. The economic repercussions of climate disasters are critical factors in the sustainability of economic development. By incorporating climate disaster risk into the analytical framework of agricultural trade welfare and examining how climate change affects countries’ economic welfare through agricultural trade markets, this research provides an important reference for the stability of global agricultural markets and national food security strategies.
Against this background, this paper presents a systematic analysis of the impact of climate disaster risk on global agricultural trade welfare. Specifically, it calculates the level of agricultural trade welfare for 114 major agricultural trading countries during the period from 2002 to 2021. This is done by applying the varieties-corrected terms of trade, as proposed by Feenstra (1994) and Qian et al. (2010). The dynamic trends and types of change in each country’s trade welfare are then classified in detail. Additionally, the paper employs an empirical approach to examine the impacts of climate disaster risk on both national and global agricultural trade welfare, as well as the differential impacts on trade welfare across countries and types of agricultural products. In conclusion, the paper offers a comprehensive examination of how climate disaster risk affects global agricultural imports and exports, thereby influencing agricultural trade welfare.
Based on the theoretical analysis framework of the CES model of Feenstra (1994) and Broda and Weinstein (2006), this paper adopts the approach of Qian et al. (2010) and applies the varieties-corrected terms of trade to measure the welfare level of agricultural trade across countries.
It is assumed that the utility derived from trade by the importing country depends on aggregate imports, and the utility derived from trade by the exporting country depends on aggregate exports, following a two-stage CES utility function. In line with Galstyan and Lane (2008), this paper defines the HS 4-digit code as the good level and the HS 6-digit code as the variety level for intra-goods segmentation.
Equations 1, 2 represent the utility measures for the importing and exporting countries, respectively. In Equation 1, γ denotes the elasticity of substitution between imported goods (γ > 1), and refers to the set of goods imported by the importing country in period t. Here, represents the consumer’s preferences for the different goods in during period t. The imports of good i in period t are expressed as: where j denotes the variety, represents the consumer’s preferences for the different varieties of imports in during period t, and represents the elasticity of substitution between imported varieties. represents the import quantity of variety j within good i in period t.
Similarly, Equation 2 represents the utility measure for the exporting country. Here, φ, denotes the elasticity of substitution between exported goods (φ > 0), represents the set of goods exported by the exporting country in period t, and represents the consumer’s preferences for different goods in during period t. The export quantity of each good i in period t is given by: , where j continues to represent the variety, indicates the elasticity of substitution between varieties, and represents consumer’s preferences for different varieties in in period t. represents the export volume of variety j within good i in period
However, the aggregate price level in the form of a CES function contains the information about the elasticity of substitution, making it difficult to directly use for calculating the price index. In response to the challenge, this paper adopts the approach proposed by Sato (1976) and employs the log change weights, as formulated by the following formulae:
In Equations 3–6, and represent the weights of the corresponding goods and varieties, where , assuming that and , which denotes the same set of varieties within good i in periods t and s ( ). and represent the quantity and nominal price of variety j in period t, respectively, and and represent the quantity and nominal price of good i in period t.
In the log change weights, the weight of each variety j of good i is a composite of the share of that variety in periods t and s. This ensures that the weight of each variety in the quantity index aligns with its weight in the price index (Qian et al., 2010). The fixed-varieties price index of good i can be expressed according to Equation 7:
Similarly, the analysis and calculations for varieties are applicable at the good level. The fixed-varieties aggregate export price index (FEI) and the fixed-varieties aggregate import price index (FII) can be derived under the fixed varieties, in conjunction with the log change weights at the good level according to Equations 8, 9. This is subject to the constraint that the preferences for variety j within good i are the same in periods s and t.
The formula of the fixed-varieties terms of trade (FTT) is expressed according to Equation 10:
The fixed-varieties terms of trade include only goods that are imported or exported in both periods s and t, meaning neither the disappearance of old goods nor the emergence of new goods is reflected in it. However, they do affect the real price index, and the fixed-varieties terms of trade cannot accurately measure the minimum expenditure required by consumers to purchase an equivalent amount of utility (Qian et al., 2010).
To address the limitations of the fixed-varieties terms of trade, this paper incorporates a term representing the changes in varieties (the extensive margin) into the original measurement model (Feenstra, 1994). This term is expressed as in the varieties-corrected export price index and in the varieties-corrected import price index. Here, is the share of exports (or imports) of varieties exported (or imported) in period t in the aggregate exports (or imported) in period t, for the varieties both exported (or imported) in periods t and s, while is the share of exports (or imports) of varieties exported (or imported) in period s in the aggregate exports (or imports) in period s, for the varieties both exported (or imported) in periods t and s, with the specific formulae according to Equations 11, 12:
After incorporating the extensive margin, the varieties-corrected aggregate price indices are expressed as follows:
The varieties-corrected terms of trade (VTT) is obtained by combining Equations 13, 14:
In comparison with the conventional measure (FTT), VTT incorporates the changes in varieties. It is evident that the magnitude of terms of trade is influenced by alterations in varieties. Furthermore, the term can be regarded as an index of changes in varieties. The first term on the left side of Equation 15 is referred to as the extensive margin, while the second is known as the intensive margin (Qian et al., 2010).
The trade data used in this study are derived from the CEPII-BACI database, and the HS 6-digit code is employed to categorize agricultural varieties, spanning from HS 01–24. The sample period extends from 2002 to 2021, with the terms of trade measured using 2001 as the base period. The database provides trade flows for 222 countries or territories. However, some countries or territories exhibit a higher incidence of missing data due to political factors (including State Union of Serbia and Montenegro), economic factors (such as the French Southern and Antarctic territories), and various other reasons. Additionally, some countries exhibit minimal trade in agricultural products, making it challenging to accurately calculate their real terms of trade. Consequently, only countries that have ranked among the top 99% of global agricultural trade for 20 consecutive years, amounting to 114 countries, are included in the analysis.
To calculate the terms of trade in the context of changes in varieties, it is essential to provide the elasticity of substitution for exports ( ) and imports ( ). In theory, the two elasticities differ for different products and countries. However, given the large number of countries and products involved in this study, calculating the elasticities for each country-product pair is not feasible within the space constraints of this paper. Therefore, this study follows the approach of Qian et al. (2010) and directly incorporates the elasticity estimates from existing literature into the estimation process. Qian et al. (2010), referencing Broda et al. (2008), propose three combinations of elasticity pairings based on the analysis of market power: low export elasticity of substitution-high import elasticity of substitution, medium export elasticity of substitution-medium import elasticity of substitution, and high export elasticity of substitution-low import elasticity of substitution. In the context of agricultural products, it is important to recognize that their production is highly dependent on specific geographic and climatic conditions, which typically results in a low export elasticity of substitution. Additionally, agricultural products often have relatively low technical barriers to production, making them a significant component of global trade. Many countries seek to diversify their sources of agricultural imports to reduce reliance on specific countries or regions, which results in a high import elasticity of substitution for agricultural products. Accordingly, this paper adopts the combination of low export elasticity of substitution and high import elasticity of substitution to measure the terms of trade for agricultural products.
In determining the export elasticity of substitution, this study refers to the results presented by Broda et al. (2008) on the measurement of export elasticity of substitution for major countries. Additionally, to improve the precision of the analysis, the study distinguishes between developed and developing economies. For developed economies, the export elasticity of substitution is determined by the median value of export elasticities for developed countries or regions with low market power. For developing economies, it is determined by the median value of export elasticities of substitution for developing countries or regions with low market power. For the import elasticity of substitution, Anderson and van Wincoop (2004) suggest a range of 5–10. This study adopts a value of 10 for the import elasticity of substitution, as shown in Table 1.
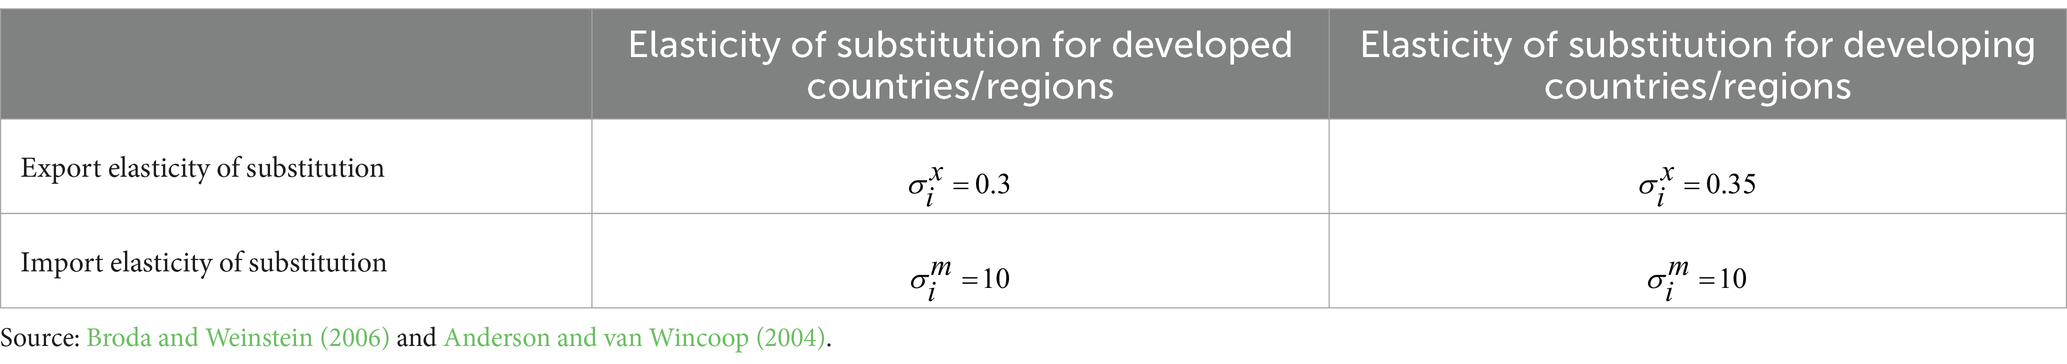
Table 1. Elasticities of substitution.
The exclusion of changes in varieties during the measurement process may lead to significant distortions in terms-of-trade calculations. In theory, without accounting for the extensive margin, the export price index would be underestimated, the import price index overestimated, and the terms of trade would ultimately be undervalued. However, it remains uncertain whether extensive margin significantly affects the terms of trade for agricultural products. To test this hypothesis, the study draws on Gaulier and Mejean (2006) and measures the bias in terms-of-trade calculations according to Equation 16:
As shown in Table 2, the average bias values are all negative, indicating that the fixed-varieties approach results in an underestimation of the global terms of trade for agricultural products. The mean values are greater than 1, suggesting an overall improvement in global terms of trade for agricultural products over the two decades. Additionally, the mean absolute value of the deviations for each year is less than 0.50%, indicating that the intensive margin remains a significant component in measuring the terms of trade for agricultural products.
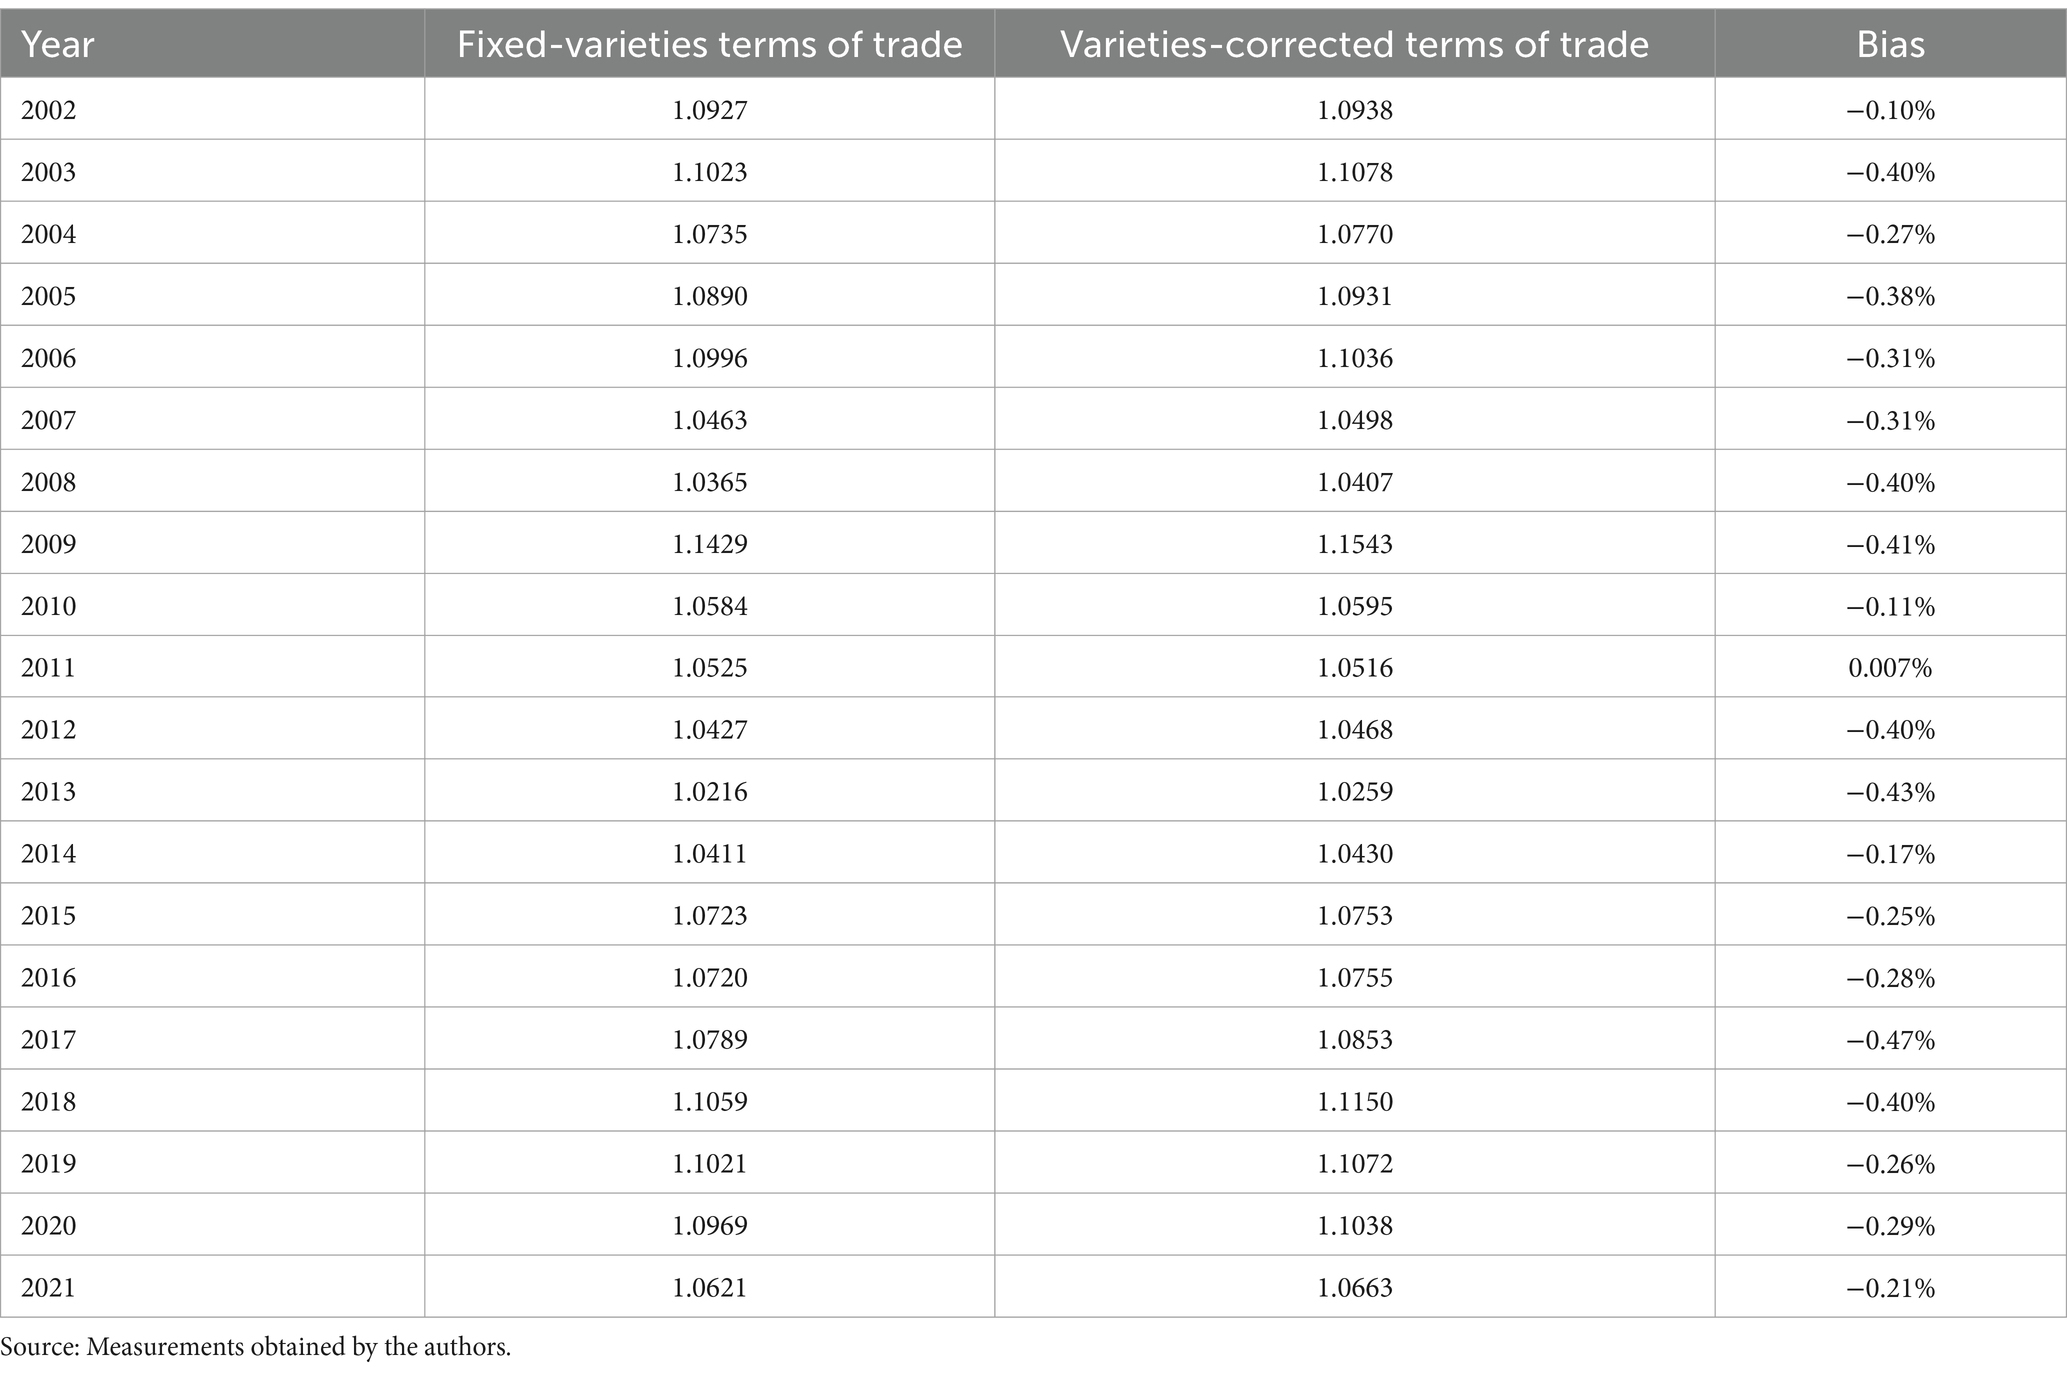
Table 2. Bias in agricultural terms of trade.
To provide a comprehensive analysis on the development and changes in agricultural trade welfare among the sample countries from 2002 to 2021, this study follows the methodology proposed by Deng et al. (2021), which defines a five-year period as the unit of analysis. The investigation period is divided into four intervals. The aim is to calculate the average terms of trade for each country in each period and compare these averages to the base period of 2001. A country is considered to have improved its terms of trade for agricultural products if the average terms of trade for all periods exceed that of the base period. Conversely, a country is classified as having experienced a deterioration in its terms of trade for agricultural products if the average terms of trade for all periods fall below the base period. Finally, a country is categorized as having fluctuating agricultural terms of trade if some periods exceed the base period, while others fall below or remain equal to it.
Among the 114 countries included in the sample, 50 countries (including Mexico, Italy, and Australia) saw improvement in their agricultural terms of trade. In contrast, 22 countries (such as the United States and Canada) experienced a deterioration in their agricultural terms of trade compared to the base period. Additionally, 42 countries (including China and Pakistan) exhibited fluctuating terms of trade. In the next phase of this study, a select number of countries from each group will be chosen as illustrative examples. Due to space constraints, only a small number of representative countries, with significance in terms of trade volume, trade diversity, and influence on the global agricultural markets, will be selected.
To gain deeper insight into the extent of change in agricultural terms of trade, this study calculates the standard deviation of the terms of trade for each country over the specified period. A country is classified as a high-variance country if it has three or more periods in which the standard deviation exceeds 0.1. Similarly, a country is considered a low-variance country if it has three or more periods in which the standard deviation is less than 0.05. The remaining countries are categorized as exhibiting a random pattern.
The results show that 24 countries, including Algeria and Qatar, exhibit high variability in their terms of trade, while 27 countries, including South Korea and the United States, display low variability. The remaining countries display random patterns.
In the group of countries with improving agricultural terms of trade, Mexico (MEX) serves as a typical high-variance country. Mexico’s annual terms of trade for agricultural products consistently exceed 1, indicating ongoing improvement. However, the improvement was accompanied by great volatility. In 2009, Mexico experienced its most significant one-year decline, with a drop in its terms of trade from 1.949 in 2008 to 1.557 in 2009, a reduction of 20%. Despite this fluctuation, Mexico’s agricultural terms of trade have shown a general upward trend. In contrast, Italy (ITA) exemplifies a low-variance agricultural terms of trade country, with only small fluctuations that hover close to the base period level of 2001. Italy’s agricultural terms of trade show only a slight increase, with a maximum rise of just 0.1. Australia (AUS), on the other hand, displays characteristics of a stochastic country, diverging noticeably from the patterns observed in Italy and Mexico. Although Australia’s agricultural terms of trade are not as volatile as Mexico’s, there are noticeable spikes in certain years, such as between 2016 and 2019, when the index rose by 23.1%.
Among the countries experiencing a decline in agricultural trade welfare, the United States (USA) and Canada (CAN) have both seen sustained deterioration in their agricultural terms of trade. However, the magnitude of this decline differs between the two. While Canada’s agricultural terms of trade have shown a slight upward trend, indicating a partial recovery, the United States has experienced a continuous deteriorating trajectory, with deepening over time. An analysis of the time series data reveals that between 2002 and 2016, both the United States and Canada followed similar trends. From 2002 to 2006, their terms of trade were closely aligned. However, since 2006, the disparity between the two countries’ terms of trade has steadily grown, reaching 37.9% by 2021.
In countries with fluctuating agricultural terms of trade, the values alternate above and below 1, making it difficult to identify a clear trend. For example, Pakistan (PAK), a high-variance country, shows significant volatility in its agricultural terms of trade. In contrast, Portugal (PRT) experiences less pronounced fluctuations, with its terms of trade remaining close to 1. China (CHN) falls somewhere in between, with terms of trade that fluctuate around 1. However, the magnitude of China’s fluctuations is smaller than those observed in Pakistan but larger than those observed in Portugal, resulting in a “~”-shaped pattern of changes over time. Table 3 summarizes the classification of the 114 countries, and Figure 1 visually represents the terms of trade for representative countries.
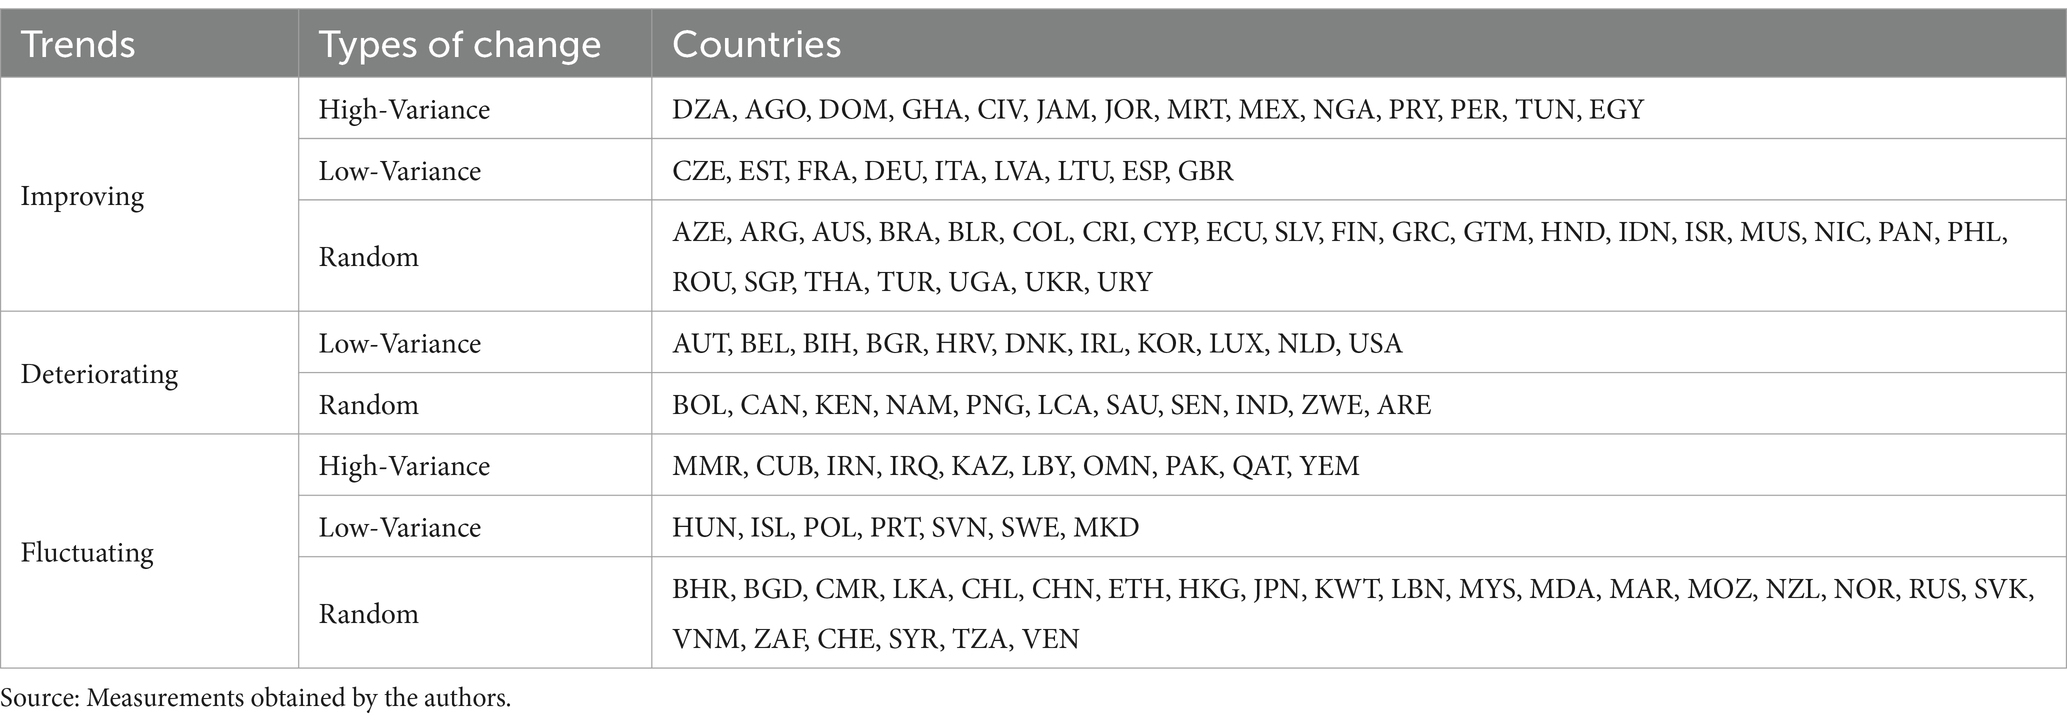
Table 3. Country classification.
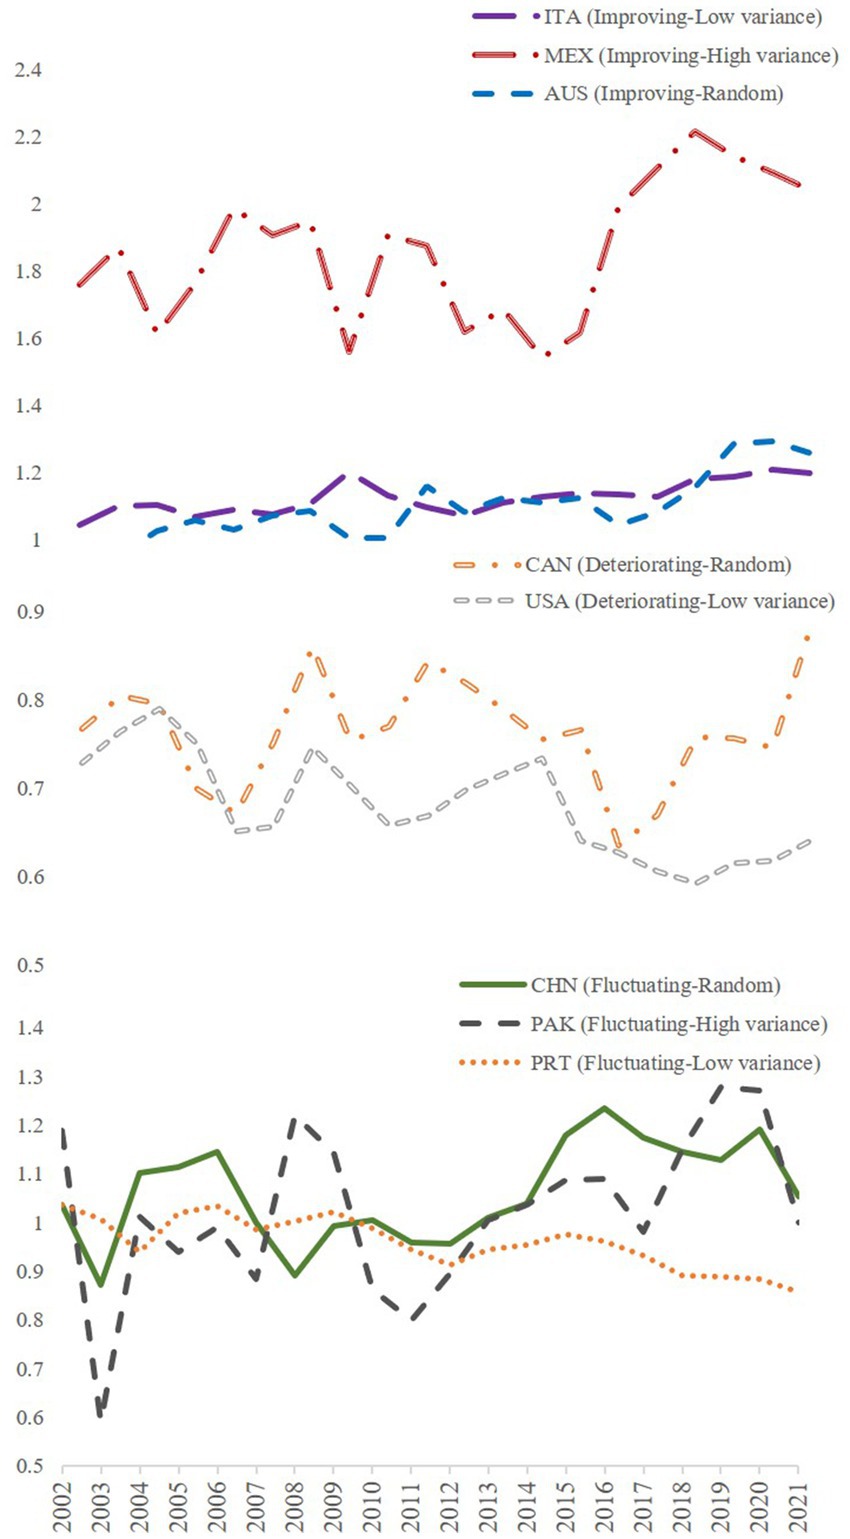
Figure 1. Dynamics of agricultural terms of trade across representative countries (2002–2021).
Climate disasters significantly affect agricultural production, primarily by reducing both crop yields and quality. Events such as droughts, floods, and hurricanes directly harm crops by damaging farmlands, disrupting growth cycles, and lowering photosynthesis efficiency. Furthermore, infrastructure and production facilities can often be severely damaged through various channels, including destruction of irrigation systems, transportation networks, and agricultural machinery, all of which further reduce the agricultural production capacity of affected countries or regions. As a result, agricultural production and exports decrease, leading to an increase in the aggregate export price index. In terms of imports, only when domestic production cannot meet the demand due to disaster-related damage, the affected country is likely to increase its imports to compensate for the shortfall in local production. Consequently, although the aggregate import price index rises, the effect is relatively minor compared to the increase in export price. This can lead to a temporary improvement in agricultural trade welfare for countries experiencing the disasters.
Moreover, climate disasters also have an indirect effect on the agricultural trade welfare of countries not directly affected, a phenomenon known as trade spillovers. When a country experiences a decline in crop yields and quality due to a climate disaster, the global supply of agricultural products decreases, resulting in a situation where demand outpaces supply in global markets. While non-affected countries are not directly impacted by the disaster themselves, they face higher costs and potential supply shortages. Although these countries may attempt to increase their exports to take advantage of emerging markets opportunities, such increases often fail to fully offset the higher import costs due to the global supply shortages. Therefore, while the agricultural aggregate export price index of non-affected countries may rise, the increase in the import costs is more significant, leading to a reduction in their agricultural trade welfare.
Based on this analysis, this study proposes the following hypothesis:
H1: Climate disasters will enhance the agricultural trade welfare of the affected countries in the short term, while reducing the agricultural trade welfare of countries not directly affected on a global scale.
Hypothesis 1 explores how climate disasters influence the global supply and demand for agricultural products, and subsequently, trade welfare. However, significant discrepancies exist between countries in terms of factors such as trade regimes and levels of economic development. This variation makes it difficult to generalize about the impact of climate-related disruptions on agricultural trade welfare across all nations. Thus, it is insufficient to assert that climate disasters have a completely uniform effect on trade welfare. Instead, it is crucial to consider the differences to uncover heterogeneous effects of these disasters on agricultural trade welfare.
A key factor in this analysis is a country’s level of economic openness, which can be assessed by examining its dependence on foreign trade. In countries with high agricultural export dependence, greater reliance on foreign trade strengthens their external linkages and heightens their fluctuations in international agricultural markets. These countries are particularly exposed to external shocks, which can amplify the potential negative effects of climate disasters on their agricultural sectors. As a result, these nations may experience more significant disruptions to agricultural trade welfare compared to countries with lower trade dependence.
At the same time, non-high-income countries often rely heavily on agricultural exports within their economic structures and trade strategies. These countries generally lack sufficient financial and technological resources to effectively counter the impact of climate change. As a result, it is far more challenging for those countries to stabilize agricultural trade welfare following climate disasters compared to wealthier, high-income countries. Based on this reasoning, the study proposes the following hypothesis:
H2: The impact of climate disasters on agricultural trade welfare is more pronounced in countries with high levels of trade openness and low income.
Another important distinction in understanding the impact of climate disasters is the type of agricultural products involved. Primary agricultural products—particularly fish, vegetables, and raw poultry—are highly susceptible to climate disaster risk due to their production being heavily dependent on specific climatic factors. In contrast, processed agricultural products benefit from higher value-added during the transformation process, which enhances their market price and makes their trade welfare more resilient to climate disaster risk. In a vector autoregressive model, Zhang and Zhang (2011) demonstrated that external shocks could increase the price volatility of primary agricultural products by a factor of three to five. Additionally, primary agricultural products often serve as fundamental components in the food supply chains, with relatively low demand elasticity. As a result, even small changes in supply can lead to significant price fluctuations, which in turn affect overall trade welfare. Based on this reasoning, this study proposes the following hypothesis:
H3: The impact of climate disasters on agricultural trade welfare is more pronounced for primary agricultural products.
This paper employs a high-dimensional fixed-effects model to empirically assess the impact of climate disaster risk on the agricultural trade welfare of affected countries. The model is as follows:
In this model, the variables c, k, and t represent country, product (HS 4-digit code) and year, respectively. The dependent variable is TOTckt, which denotes the trade welfare of product k in country c during year t. This encompasses both the fixed-varieties terms of trade (FTT) and the varieties-corrected terms of trade (VTT).
The core explanatory variable is Disasterct, which measures the climate disaster risk experienced by country c in year t. It is constructed through a normalized composite index according to Equation 18:
The data for this variable were obtained from the EM-DAT database and the World Bank.
The control variables include the following: interest rate level (Interest), exchange rate level (Exchange), total agricultural production (Production), and agricultural import tariffs of the affected country (Tariff). The interest rate reflects the financing costs for the country, influencing the investment and production costs in agriculture. The exchange rate is directly related to the competitiveness of international trade, affecting both the price of exports and the cost of imports. Total agricultural production represents the country’s supply capacity, a key determinant of domestic and international market conditions. Import tariffs directly impact the price of imported products and the conditions for market access. The data for these variables were sourced from the World Bank and the Food and Agriculture Organization.
The model employs fixed effects, including the country fixed effects (γc), the product fixed effects (ρk) and the year fixed effects (μt). The country fixed effects control for static characteristics unique to each country, such as geographical conditions. The product fixed effects account for the inherent characteristics of the agricultural products in question, such as their production cycles and market demand stability. The year fixed effects are used to control for global economic dynamics or cyclical events that may influence trade patterns.
This paper builds on previous research that examined the impact of climate disaster risk on the agricultural trade welfare of directly affected countries. Furthermore, it extends the analysis to explore how climate disaster risk affects the agricultural trade welfare of countries not directly impacted by such disasters. The model for non-affected countries is specified as:
In Equation 19, the variables c and v refer to countries that have been affected by a particular phenomenon and those that have not, respectively. TOTvt represents the agricultural trade welfare of country v in year t. Disasterct still denotes the risk of climate disasters experienced by country c in year t. Xct and Yvt denote the control variables at the levels of disaster-affected and non-disaster-affected countries, respectively, and are analogous to the variables defined in Equation 17. The variables δc, θv, and τt represent the fixed effects for disaster-affected countries, non-disaster-affected countries, and years, respectively. A summary of the variables considered in the analysis is presented in Table 4.
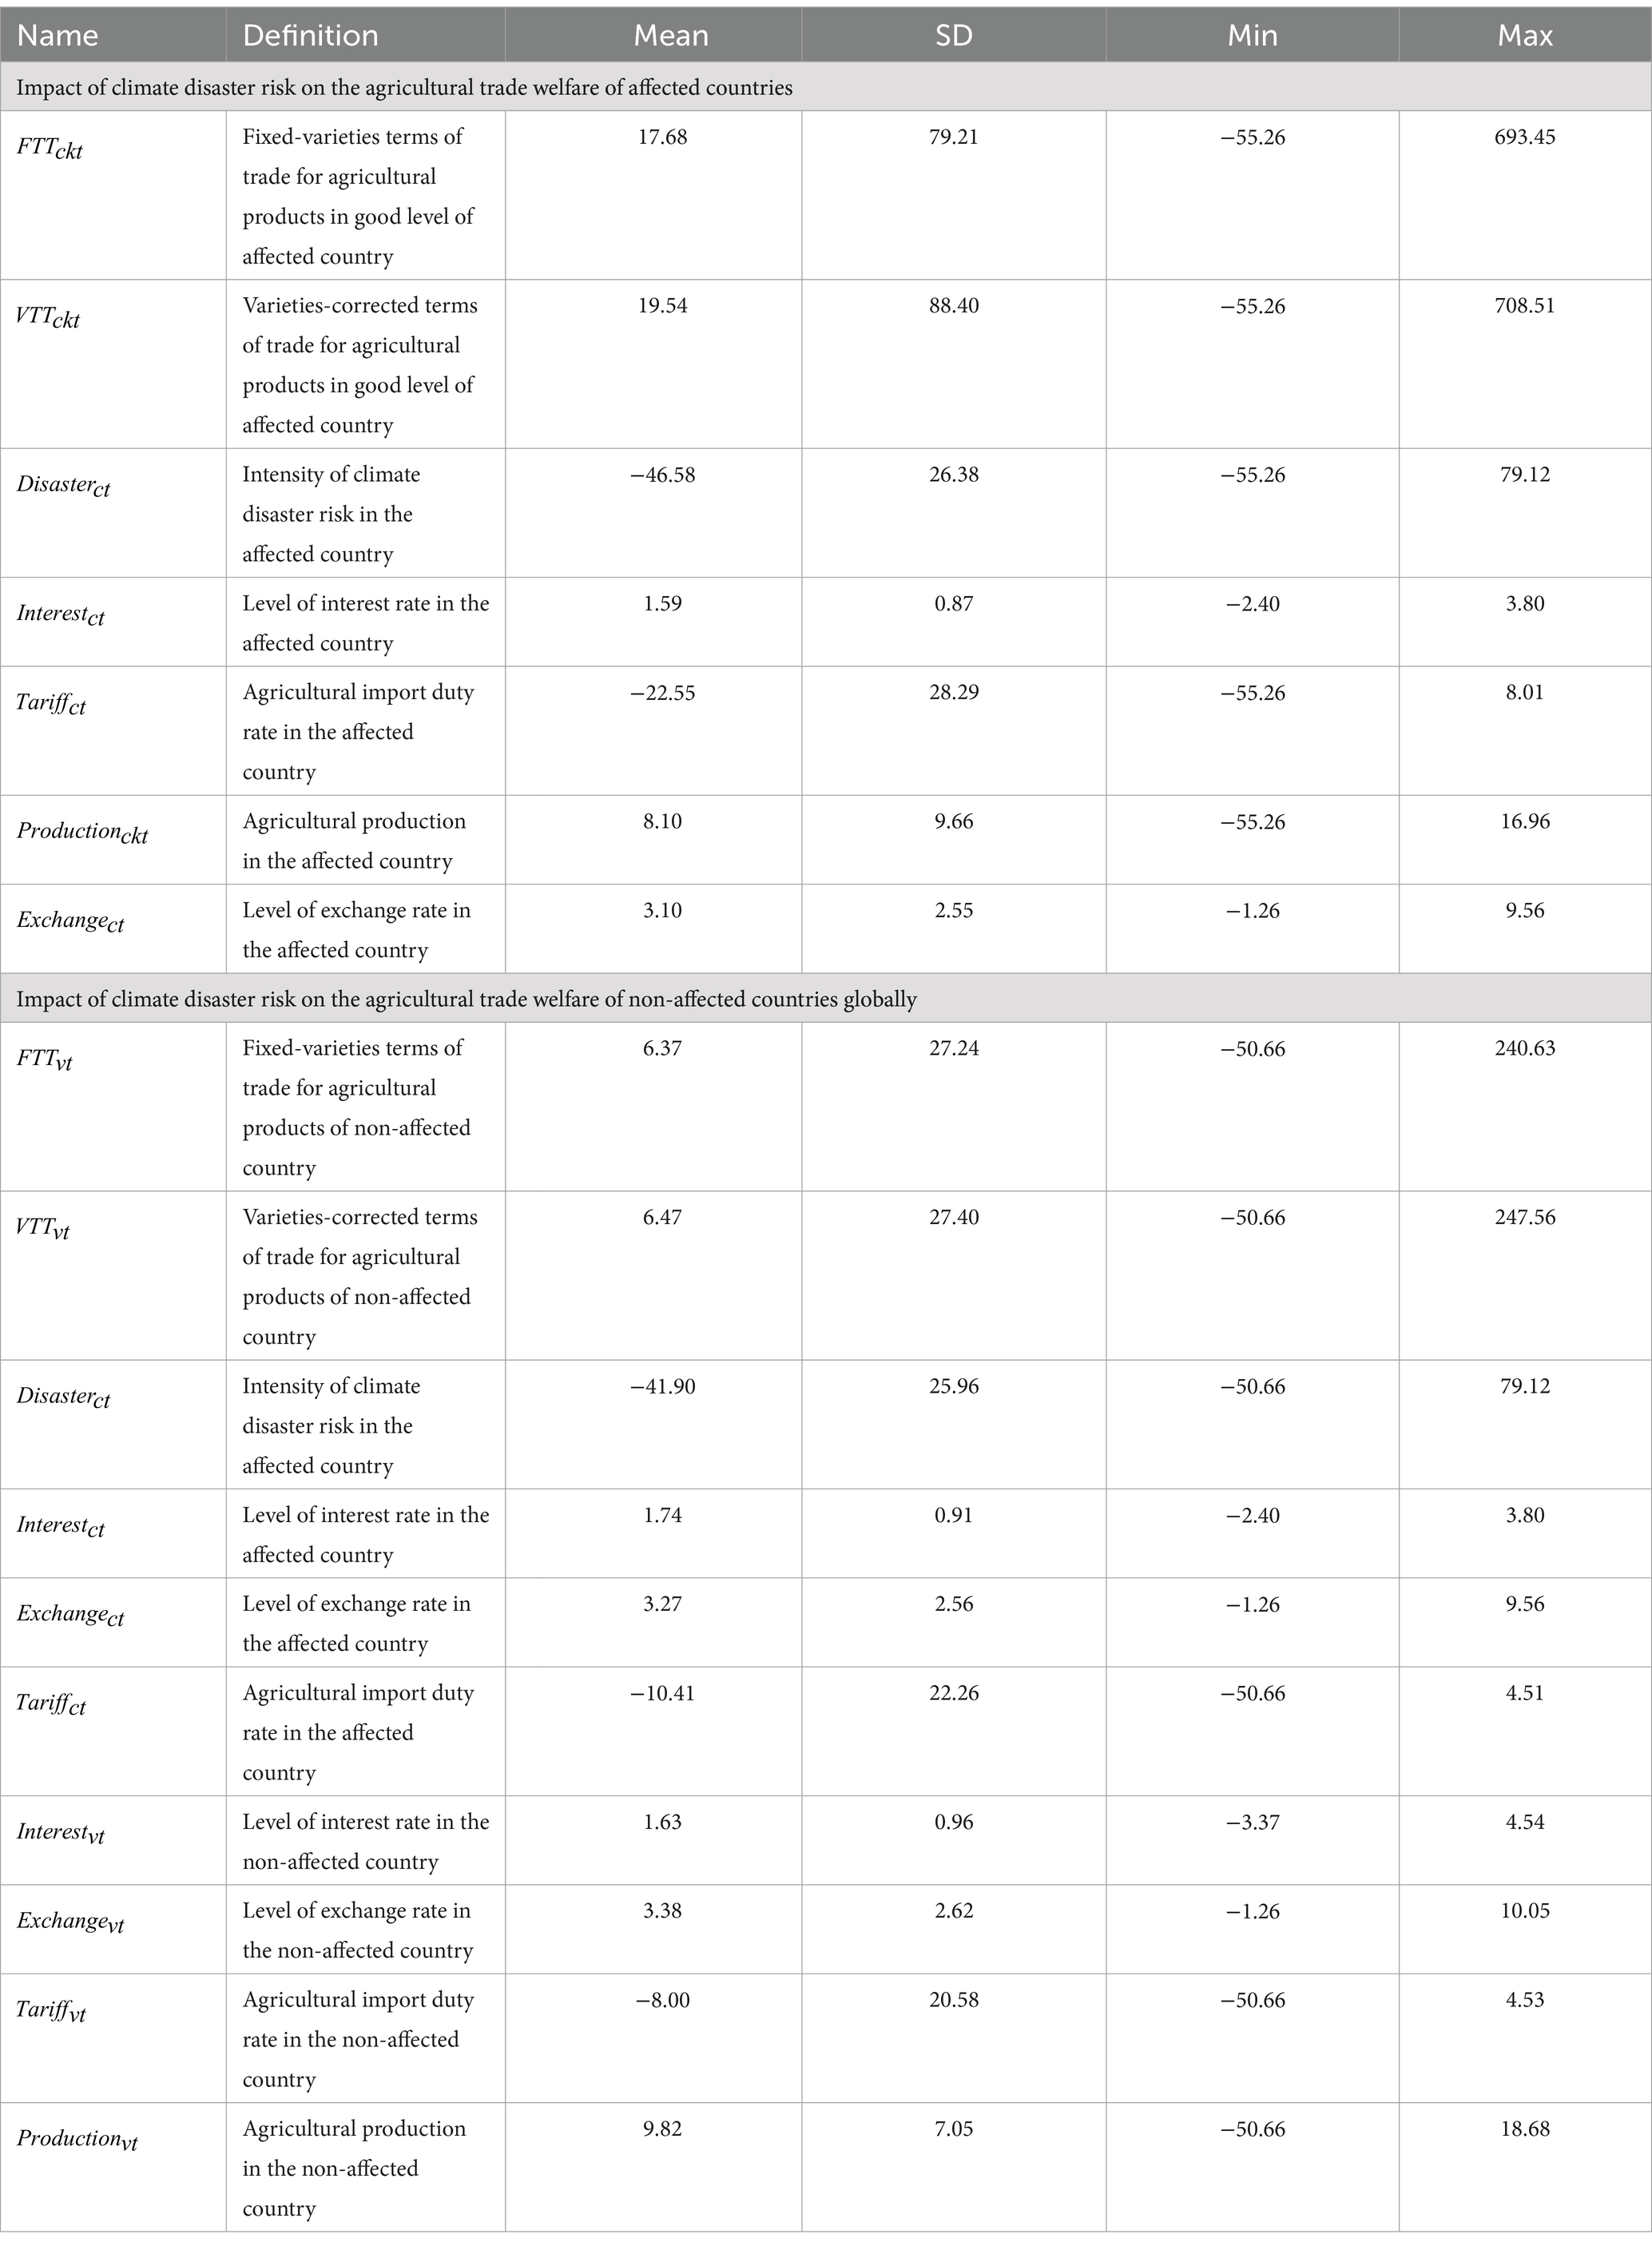
Table 4. Descriptive statistics.
Table 5 presents the impact of climate disaster risk on agricultural trade welfare of affected countries. The results show that both the FTT and VTT improve due to climate disaster risk. Specifically, each 1% increase in the risk of climate disasters leads to a 0.02% increase in the FTT and a 0.03% increase in the VTT for countries directly affected by the disaster, on average. However, for non-affected countries, the impact is markedly negative, with significant reductions in agricultural trade welfare. Each 1% increase in the climate disaster risk leads to a 0.0081% decline in the FTT and 0.0077% decline in the VTT on average, for countries not directly affected by the disaster, with both statistically significant at the 10% level. This negative impact is primarily driven by a reduction in the supply of agricultural products in the affected countries, leading to a rise in export price in the short term. Consequently, at the global level, climate disasters generate supply constraints, thereby resulting in a decline in agricultural trade welfare of non-affected countries as a consequence of disruptions in global agricultural supply chains.
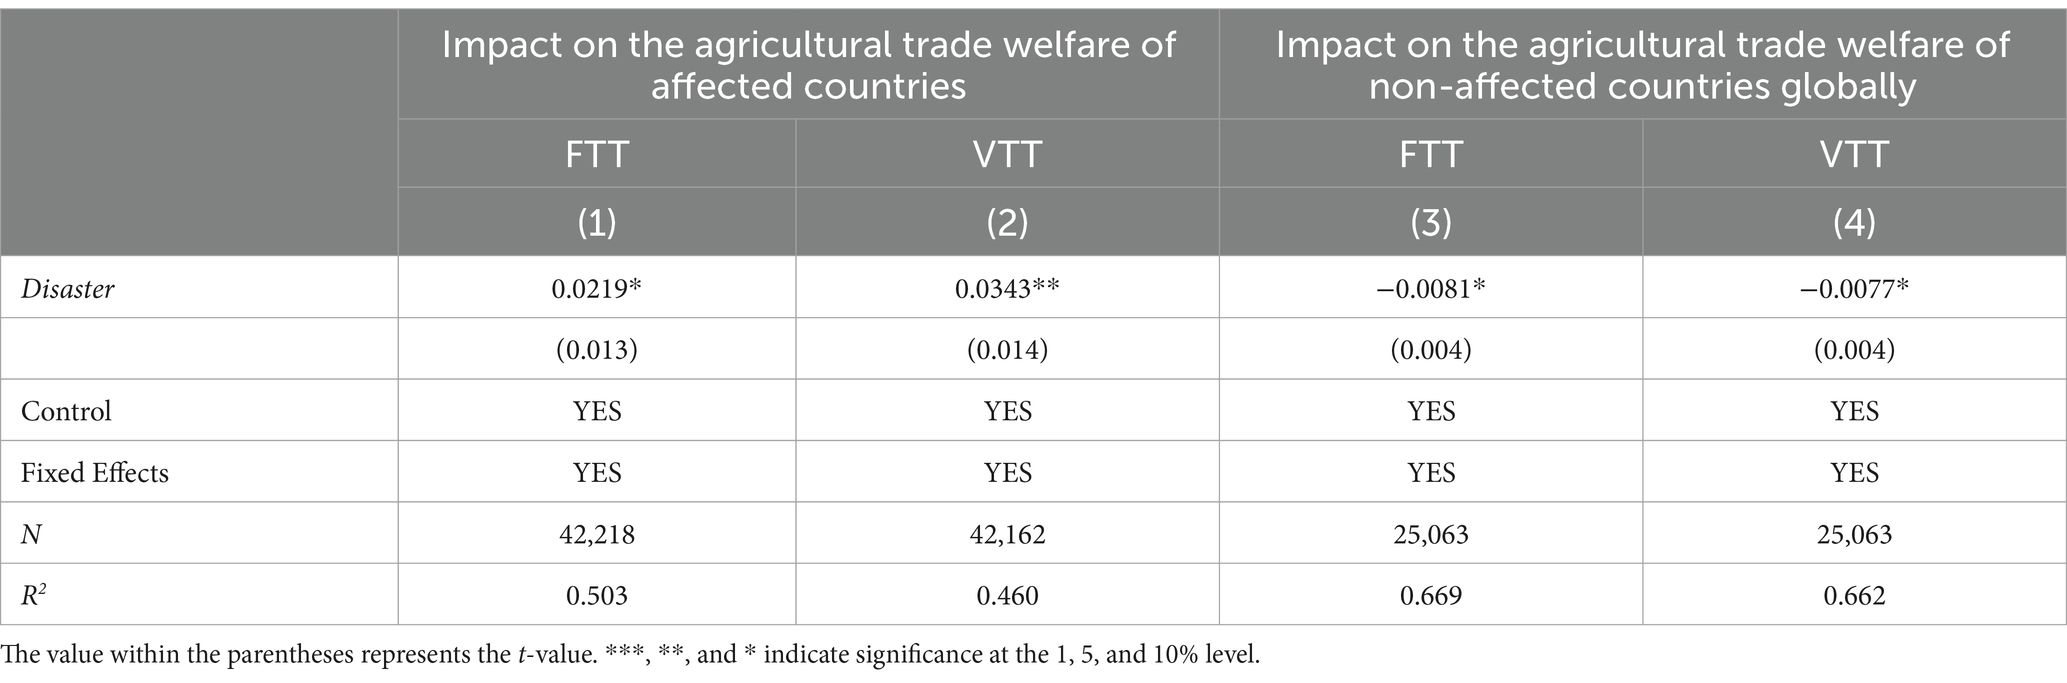
Table 5. Baseline analysis.
To ensure the reliability of the baseline results, this study performs several robustness tests. First, a comparative analysis is performed under different elasticity assumptions. Specifically, this study applies the combination of medium export elasticity of substitution and medium import elasticity of substitution. The results reported in Table 6 and from this alternative are consistent with the baseline findings and strengthen the robustness of the results. Second, the study considers the potential impact of contemporaneous trade-disturbing policies, drawing on the framework proposed by Luo et al. (2024). These policies include the ASEAN Community, established in 2015, and the Comprehensive and Progressive Trans-Pacific Partnership (CPTPP) Agreement, launched in 2017. To control for their effects, these policies are incorporated into our model through dichotomous variables. The impacts of these policies are reported in Table 7, with the results of the regressions for affected countries directly affected by climate disasters and the spillover effects on non-affected countries. The third robustness test involves replacing the fixed effects in the benchmark regression model. Specifically, the baseline analysis controls for year, affected country, non-affected country and product fixed effects to account for unobservable factors. To further test the robustness of the results, the regression is re-estimated using only the affected country fixed effects. The results from this specification are presented in columns (1)–(4) of Table 8 and are consistent with the baseline findings. Additionally, to address the potential interference of the COVID-19 pandemic on the global trade patterns, the data from 2020 onward is excluded from the analysis. The regression is re-run without this period, and the results are displayed in columns (5)–(8) of Table 8. The direction and significance of the coefficients in the above robustness remain consistent with the baseline results, both in terms of the impact on the agricultural trade welfare of the affected countries and the non-affected countries.
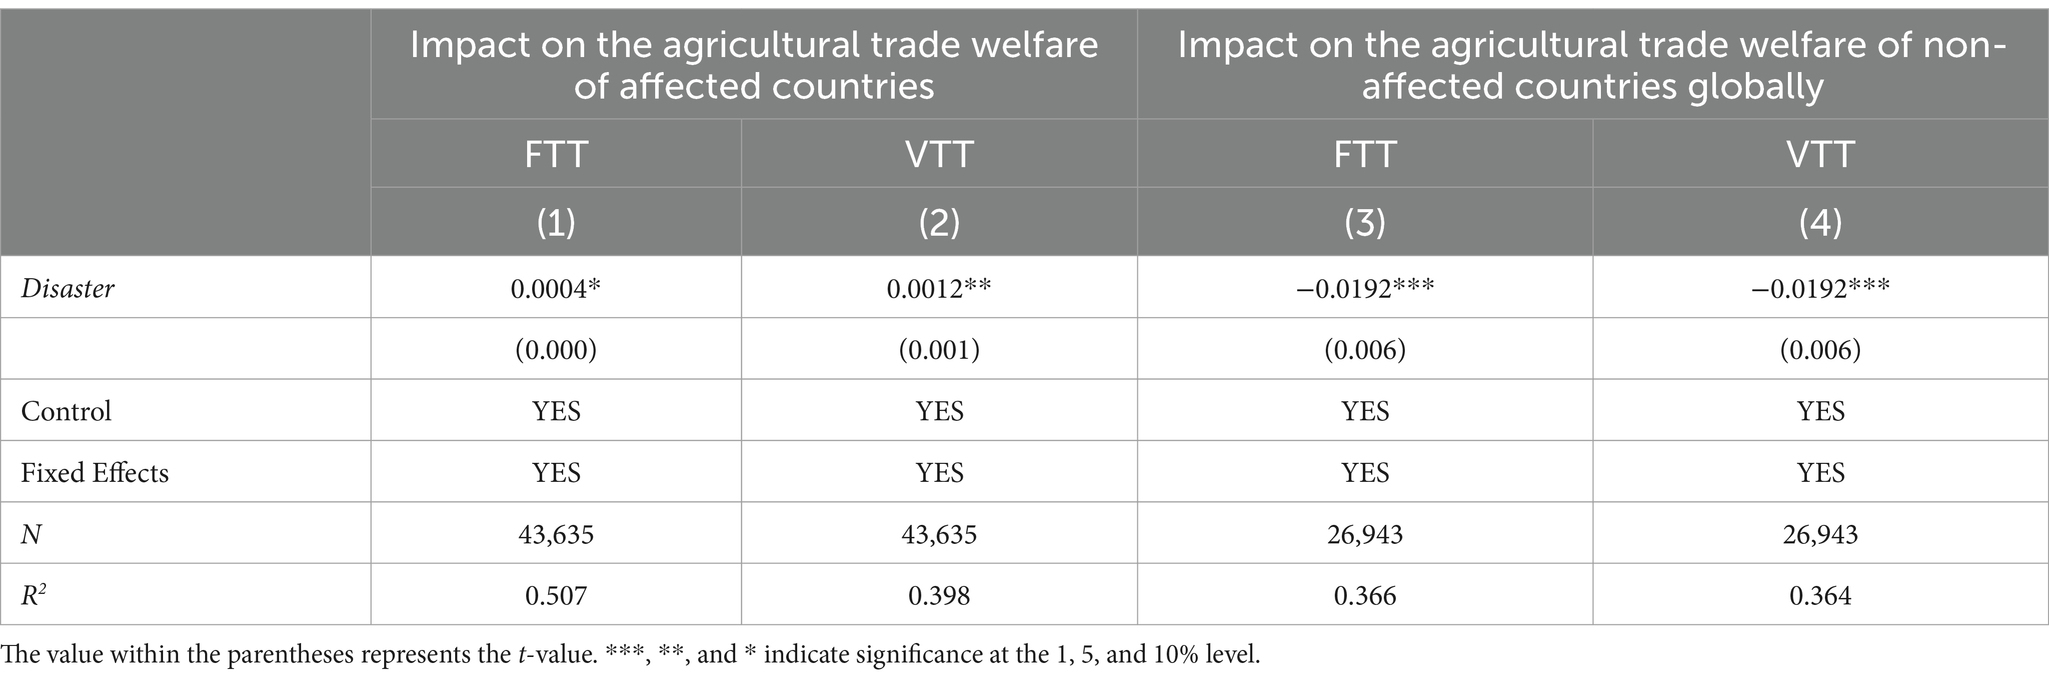
Table 6. Robustness analysis—replacement of elasticity of substitution.
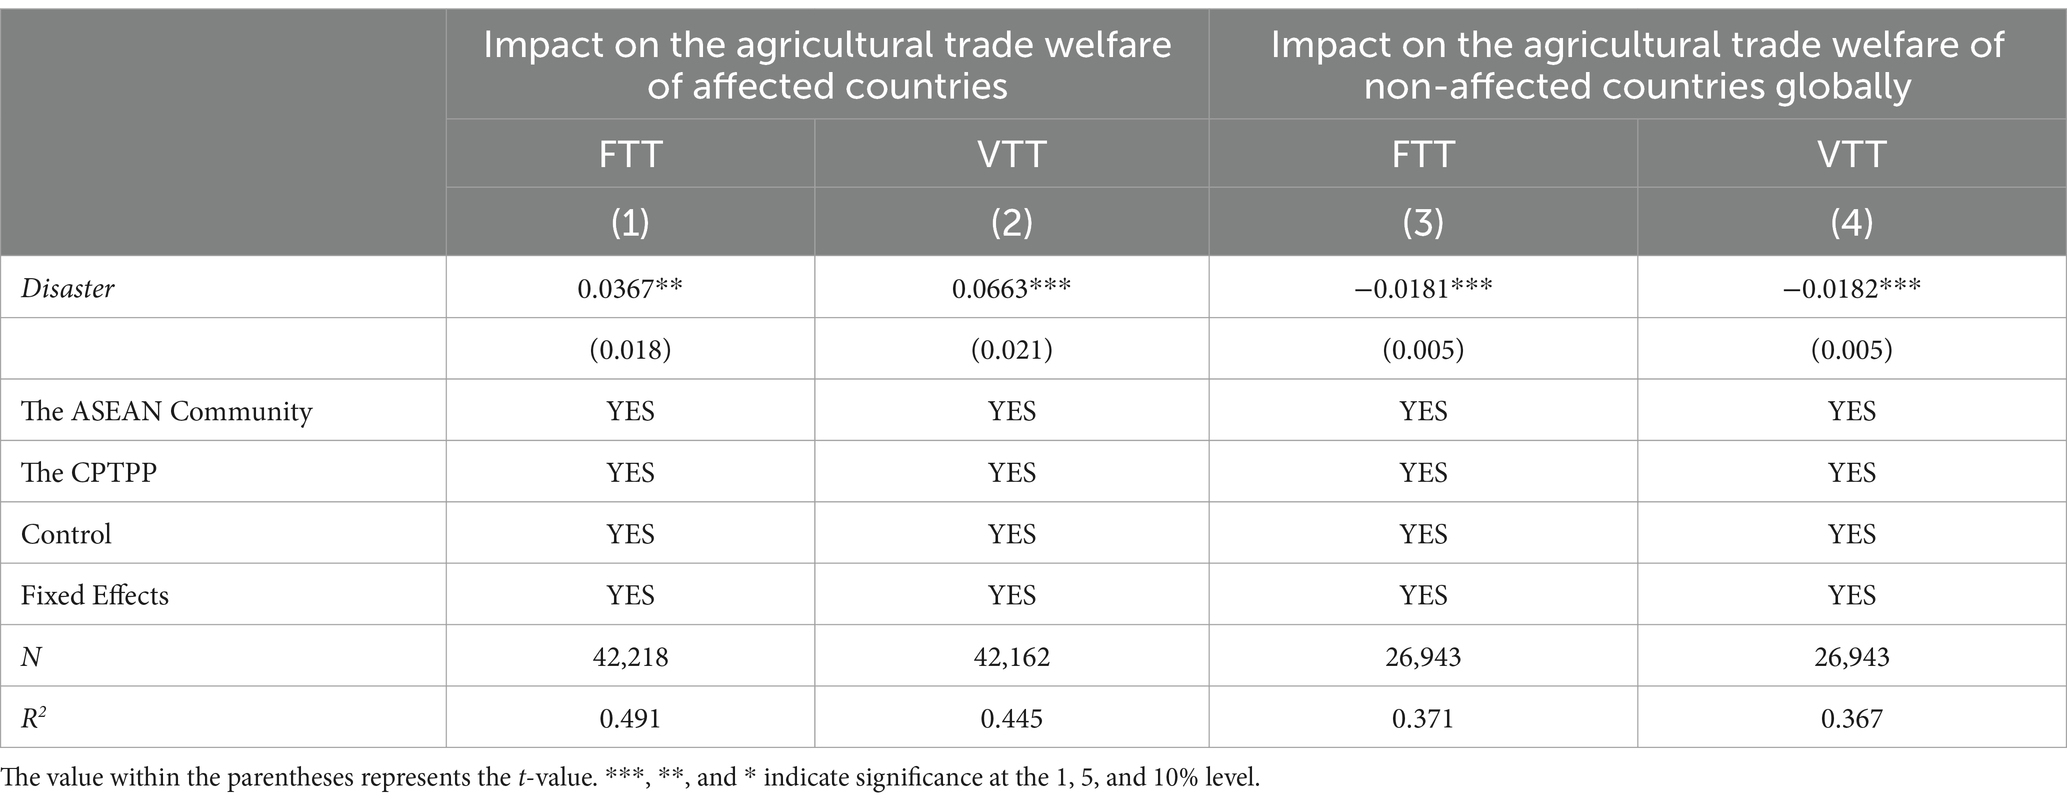
Table 7. Robustness analysis—exclusion of trade policy interventions.
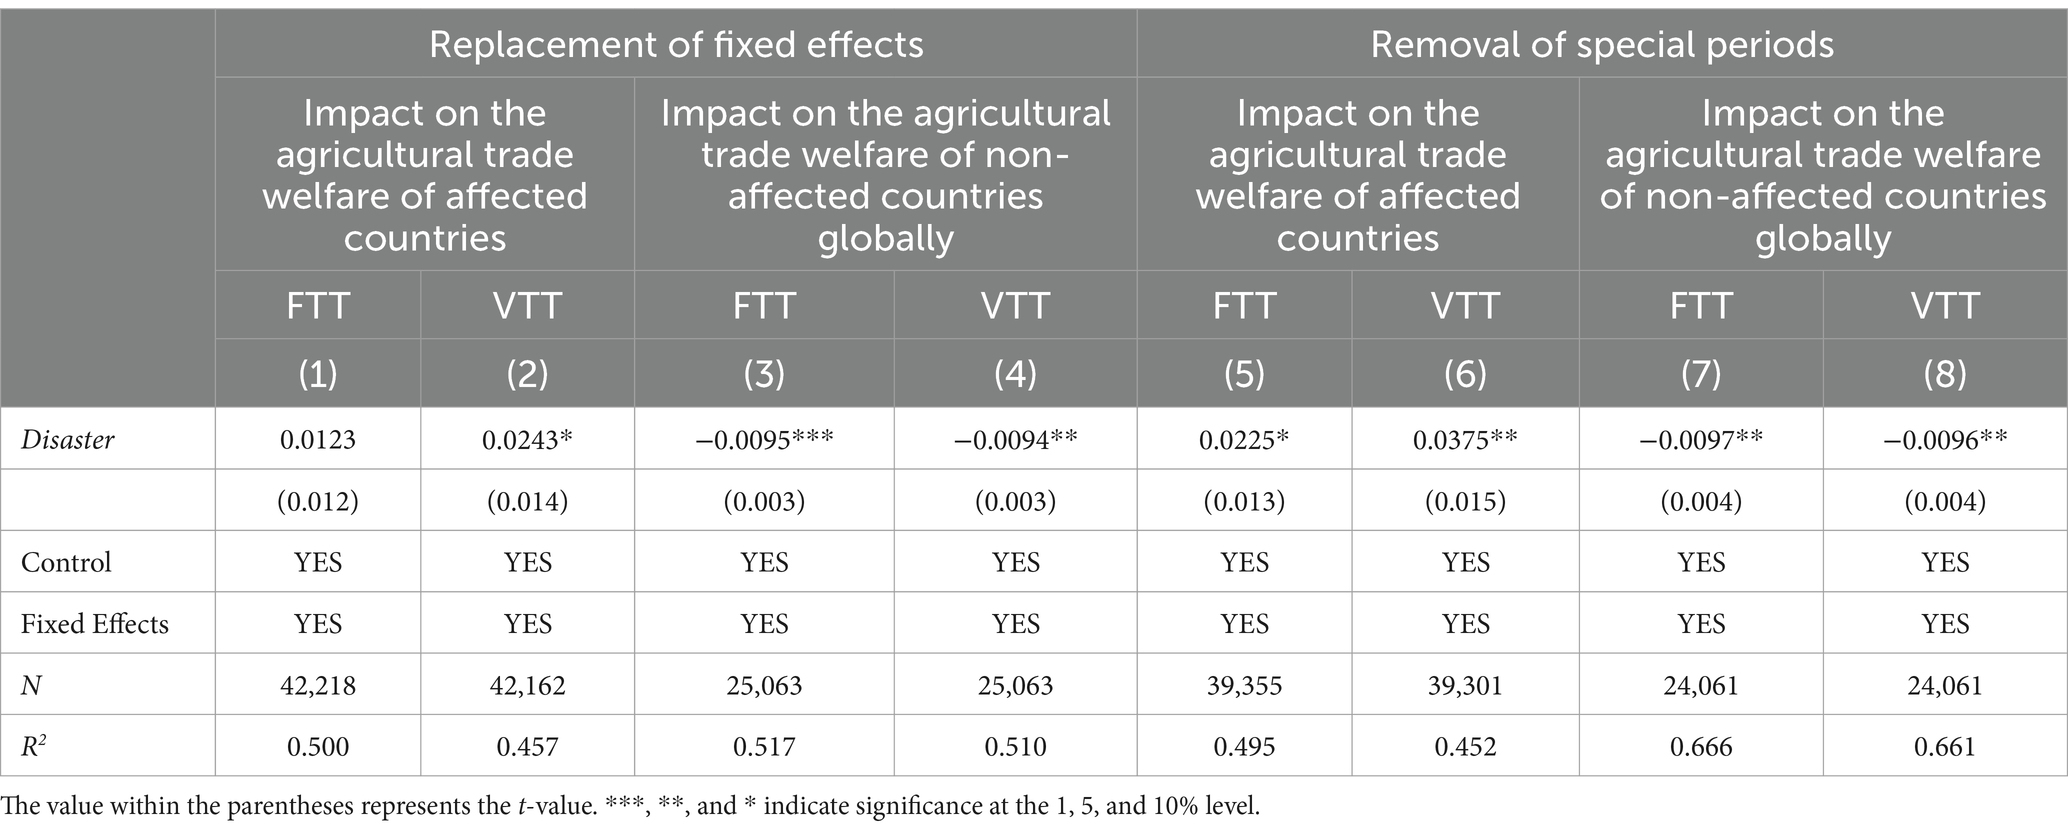
Table 8. Robustness analyses—replacement of fixed effects & adjustment of time window.
This study further builds on the framework of Feenstra (1994) to explore the mechanisms through which climate disaster risk impacts the agricultural trade welfare, specifically focusing on the movement of the import and export price indices. The regression results are presented in Table 9.
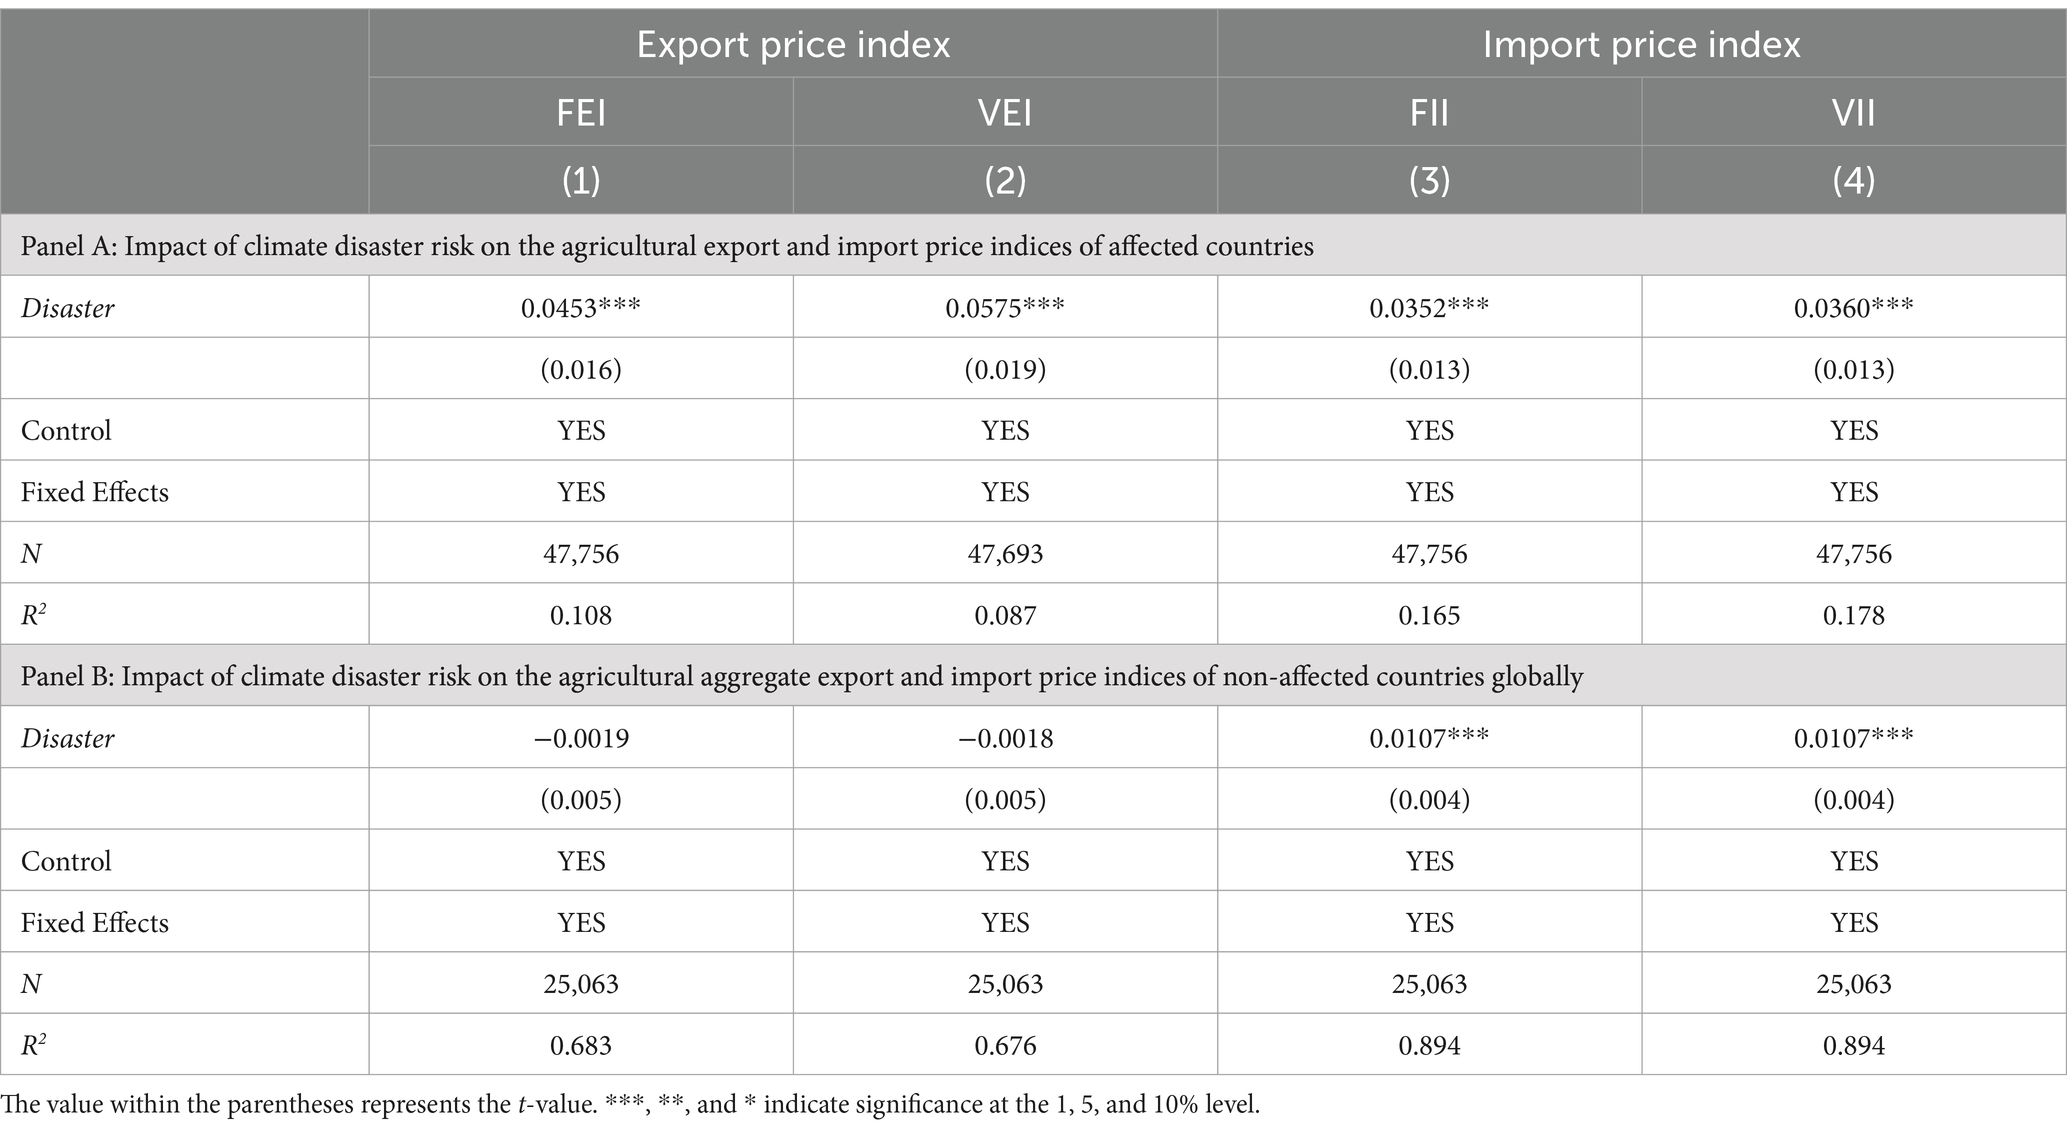
Table 9. Mechanism analysis—export and import price indices.
Panel A of Table 9 illustrates the effect of climate disaster risk on the import and export price indices of agricultural products in countries directly affected by such events. The results show that a 1% increase in the risk of climate disasters leads to a 0.05–0.06% increase in the agricultural export price index of the affected country, and a 0.04% increase in the agricultural import price index, on average. The rise in the export price index is greater than the increase in the import, resulting in an overall improvement in the agricultural trade welfare of the affected country. This effect is driven by significant damage to agricultural production in the affected regions, prompting some countries to implement temporary export restrictions to stabilize their domestic markets. These restrictions reduce export volumes and, in turn, lead to higher export price index. In contrast, imports increase only when domestic production falls short of meeting domestic demand. This increase in imports, however, has a relatively minor effect on the agricultural import price index, as climate-related disruptions do not significantly affect production in non-affected countries, keeping the import supply of affected countries relatively stable.
Table 9, Panel B examines the impact of climate disaster risk on the agricultural aggregate import and export price indices of countries not directly affected by the disaster. The results reveal that a 1% increase in the climate disaster risk is associated with a 0.01% increase in the agricultural aggregate import price index of non-affected countries, on average. However, there is no significant change observed in the agricultural aggregate export price index for these countries. This leads to a reduction in the agricultural trade welfare of non-affected countries. When agricultural production in the affected country declines, non-affected countries may import both high-priced products from the affected countries and the same products from third-party countries to meet domestic demand, driving up the import price. However, because global supply constraints do not lead to significant increase in the export capacity or price of products from non-affected countries, no notable change is observed in their agricultural aggregate export price index.
The welfare of agricultural trade in countries with different levels of trade openness is impacted in varying ways by climate disaster risk. Countries with high degrees of openness are more dependent on international markets, making their trade welfare more susceptible to fluctuations after climate disasters occur. In contrast, countries with more closed foreign trade regimes tend to adopt different coping strategies, leading to divergent impacts. In this study, the sample countries are grouped based on their membership in the General Agreement on Tariffs and Trade (GATT). Table 10, Panel A, presents the effect of climate disaster risk on the agricultural trade welfare of affected countries with varying degrees of trade openness. The results indicate that climate disaster risk has a significant positive effect on agricultural trade welfare in GATT members, especially when considering varieties-corrected terms of trade. Specifically, for each 1% increase in the risk of climate disasters, the FTT and VTT of GATT members increase by 0.03% and 0.05% on average, respectively. In contrast, no statistically significant effect is observed for the agricultural trade welfare of non-GATT countries, as they are less influenced by international trade, meaning the impact of climate disaster risk does not significantly alter their trade welfare.
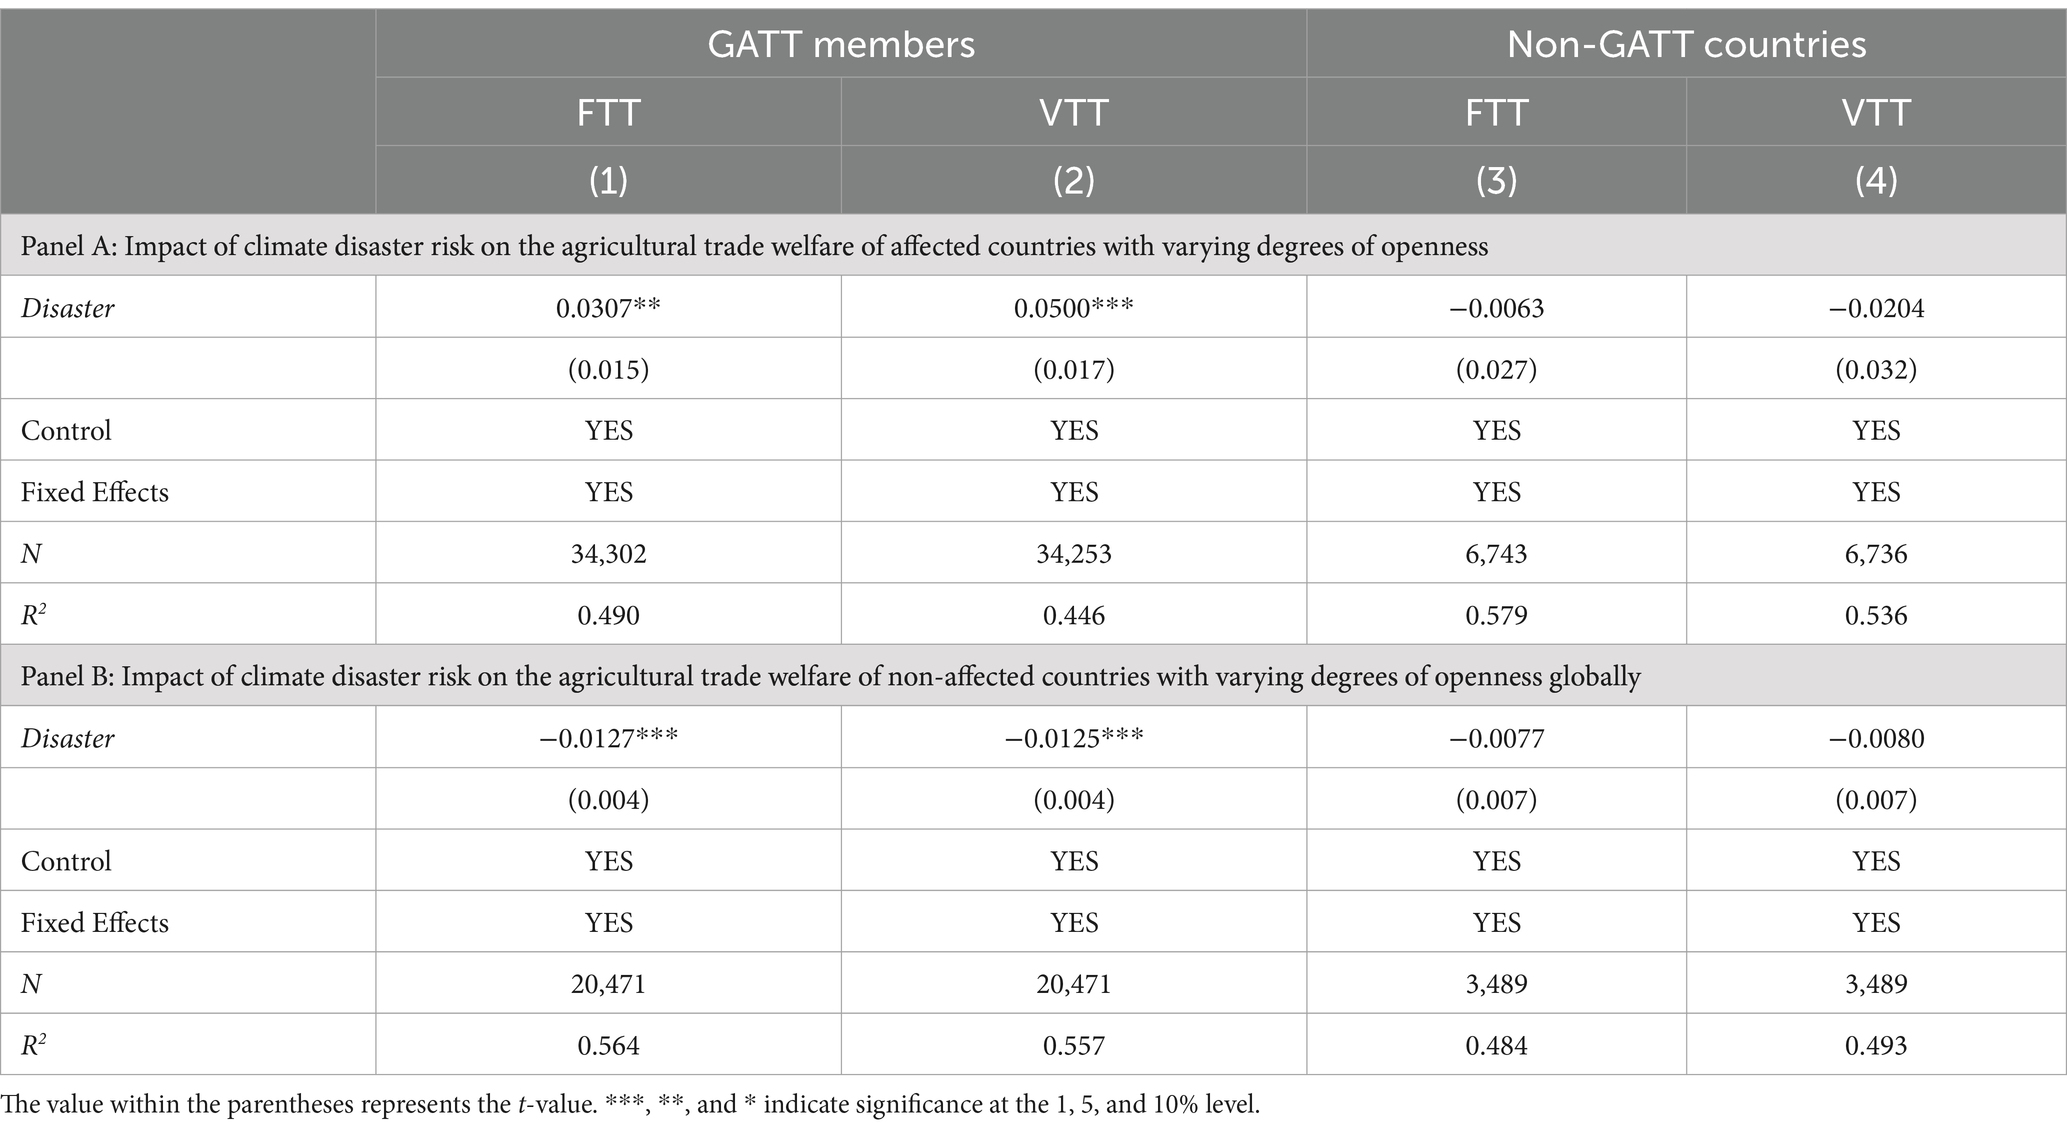
Table 10. Heterogeneity analysis—openness to the foreign trade.
Table 10, Panel B illustrates the influence of climate disaster risk on the agricultural trade welfare of other non-affected countries globally, categorized by their levels of foreign trade openness. The results demonstrate that for GATT members, there is a notable decline in agricultural trade welfare due to the climate disasters in other countries, even when those countries are not directly affected. Specifically, a 1% increase in the risk of climate disasters in affected countries is associated with a 0.01% deterioration in agricultural trade welfare for GATT members, on average. This decline is largely due to the strong trade relations between GATT members and other countries. When climate disasters occur in other countries, their agricultural exports are restricted, and the import supply of GATT members significantly reduces. As a result, import price of GATT members rises. Additionally, the disaster may reduce import demand within the affected country, which depresses export price for GATT countries. These combined effects lead to a significant reduction in the agricultural trade welfare for GATT members. In contrast, the spillover effects of climate disaster risk on the agricultural trade welfare for non-GATT countries are more limited, owing to their relatively fewer international trade linkages.
Countries with varying income levels exhibit significant differences in the structure of their economies, agricultural production models, and their ability to mitigate the risk posed by climate disasters. High-income countries generally have more advanced agricultural technologies and infrastructure, enabling them to recover more swiftly from disruptions in production and trade caused by climate-related events. In contrast, low-income countries tend to suffer greater production losses and prolonged recovery periods, resulting in more severe negative impacts on their agricultural trade welfare. Additionally, countries at different income levels hold distinct roles within global trade networks. High-income countries play a prominent role in global agricultural trade, and their trade policies and market behaviors have a substantial impact on global agricultural terms of trade. On the other hand, low-income countries, although occupying a more marginalized position in international trade, often place greater reliance on their agricultural sectors for national stability. Therefore, examining the impact of climate disaster risk on the agricultural trade welfare of countries with varying income levels provides valuable insights into the immediate economic consequences of such events.
This study utilizes the World Bank’s classification to categorize countries into high-income and non-high-income groups, and performs group regressions accordingly (Table 11). Panel A of Table 11 presents the impact of climate disaster risk on the agricultural trade welfare of countries experiencing such events at varying income levels. The results indicate that, in the short term, climate disaster risk has a notable positive effect on trade welfare in non-high-income countries. Specifically, a 1% increase in the climate disaster risk leads to a 0.02% increase in FTT and a 0.04% increase in VTT for non-high-income countries, on average. This can be attributable to two primary factors: first, non-high-income countries tend to have a relatively monolithic economic structure, with a larger share of their economies dependent on agriculture, and agricultural products accounting for a higher proportion of their exports. As climate disaster risk increases, these countries may be able to offset production losses by raising the price of agricultural products, thus improving trade welfare. Second, non-high-income countries tend to have smaller domestic markets, meaning a domestic supply reduction may not trigger a rapid expansion of import demand, keeping import price more stable and less volatile. In contrast, high-income countries are better equipped to mitigate the adverse effects of climate disasters on agricultural production due to their diversified economies and stronger coping mechanisms. These countries have more advanced technological and infrastructural capabilities, enabling them to swiftly restore production, thereby reducing the negative impact of such disasters on agricultural output. Consequently, the price for agricultural imports and exports in high-income countries remains relatively stable, and the impact of climate disaster risk on their trade welfare is minimal.
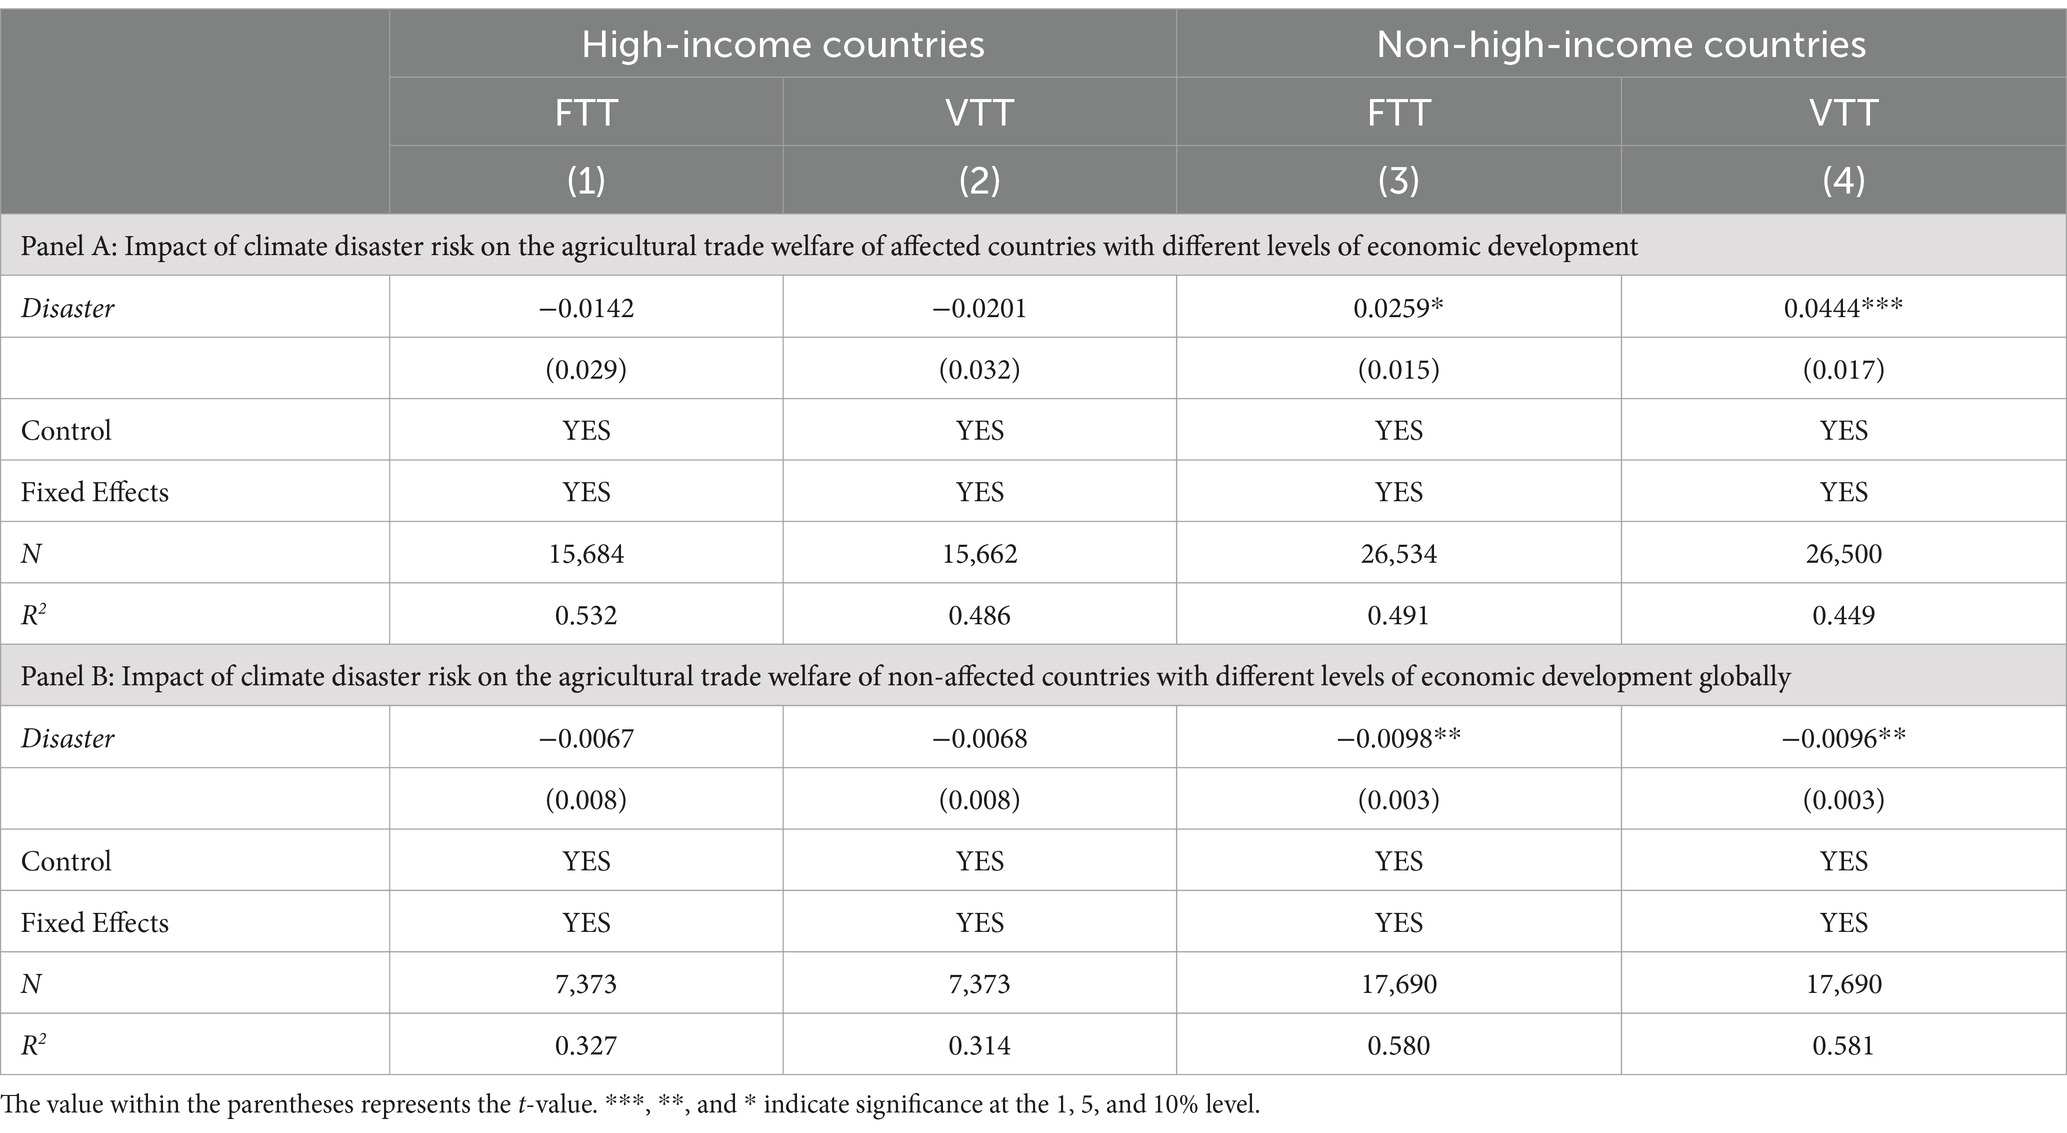
Table 11. Heterogeneity analysis—economic development.
Table 11, Panel B demonstrates the impact of climate disaster risk on the agricultural trade welfare of non-affected countries at varying income levels worldwide. The results demonstrate that when climate disasters occur in affected countries, the agricultural trade welfare of non-high-income countries is significantly diminished due to their relative lack of resources for market adaptation. Specifically, the occurrence of climate disasters in affected countries disrupts the regional agricultural supply chains. This, in turn, results in the increase in the cost of agricultural imports and the decline in their export demand for non-high-income countries. This further exacerbates the decline in trade welfare. In contrast, the agricultural trade welfare of high-income countries is less affected by climate disaster risk in other countries. This is primarily due to the fact that high-income countries can mitigate the adverse spillover effects by diversifying their sources of imports, robust coping capacities and more flexible supply chain management mechanisms.
The impact of climate disasters on the trade welfare of primary and processed agricultural products differs considerably due to the significant variations in their production processes, value chains and market demands. Primary products, which consist mainly of unprocessed crops such as cereals, vegetables, and fruits, are more dependent on climatic conditions and are more susceptible to price fluctuations caused by climate-related disasters. In contrast, processed products, such as canned foods, frozen vegetables, and fruit juices, are also reliant on the production of raw materials; however, their price and market demands are more influenced by factors such as processing technology, storage capacity, and distribution networks.
This study builds on the work of Dong and Cao (2019) to analyze the impact of climate disaster risk on the trade welfare of primary and processed agricultural products. Agricultural products are categorized into two groups: primary products (HS 01–13) and processed products (HS 14–24). The regression results presented in Table 12 indicate that for every 1% increase in the intensity of climate disaster risk, the VTT of the affected country’s primary agricultural products rises by 0.05%, on average, statistically significant at the 5% level. However, the impact on the FTT of primary agricultural products is not statistically significant. This is primarily due to the fixed-varieties nature of the FTT; product varieties are fixed and included across two consecutive periods. Thus, FTT mainly reflects the situation of products that are both stable and critical in international trade. Under this system, accurately capturing the entry of new goods and the exit of older ones is challenging. Products that have been in international trade for an extended period typically exhibit low elasticity of substitution. This implies that even in the event of climatic disasters, the market share of these products will not be immediately replaced by other products. Consequently, the FTT of agricultural products is unable to accurately reflect the impact of climate disasters on trade welfare.
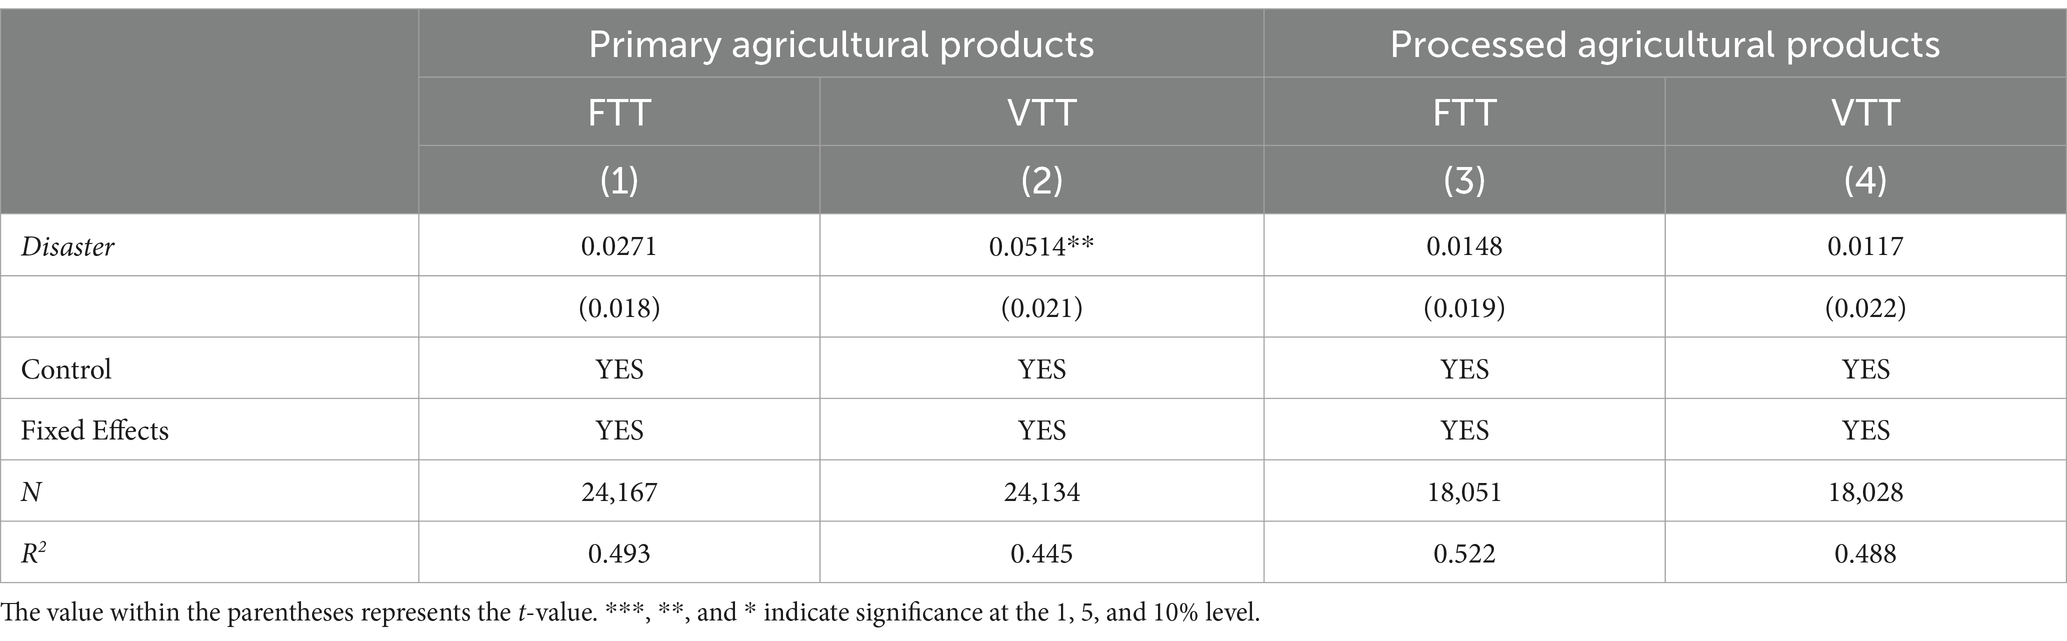
Table 12. Heterogeneity analysis—product categories.
The regression results presented in Table 12, columns (3) and (4) show that the impact of climate disaster risk on the trade welfare of processed agricultural products is negligible in both FTT and VTT. The value chains of processed agricultural products are more complex, with their price and trade welfare influenced not only by the supply of raw materials but also by various other factors, including processing technology, transportation logistics, and market demand. The processing of agricultural products enhances their stability and resilience to market fluctuations, thereby mitigating the direct impact of climate disaster risk on their trade welfare. Moreover, producers and distributors of processed agricultural products can effectively reduce the negative impact of climate disaster risk by diversifying their supply chain management and risk mitigation strategies.
The increasing frequency of extreme weather events in recent years has had a substantial impact on agricultural yields, both directly and indirectly influencing global supply chains and the trade welfare of agricultural products. This paper employs a quantitative approach to assess agricultural trade welfare across 114 countries over the period from 2002 to 2021. Furthermore, it empirically examines the impact of climate disaster risk on global agricultural trade welfare. The key conclusions of this paper are as follows:
The agricultural trade welfare of 50 countries has improved over the past two decades. Conversely, the agricultural trade welfare of 22 countries has declined compared to the base period. Additionally, 42 countries have experienced fluctuations in their agricultural trade welfare. Among 114 countries, 24 countries exhibit a high-variance type of change, while 27 countries display a low-variance pattern. The remaining countries exhibit a stochastic type of change.
Moreover, climate disaster risk has the potential to enhance the agricultural trade welfare of affected countries in the short term. However, on a global scale, climate disasters lead to a reduction in the supply of agricultural products in the international agricultural markets, resulting in a decline in trade welfare due to the supply chain disruptions. The impact of climate disaster risk on agricultural trade welfare is primarily concentrated in the countries directly affected by the climate disasters, with the indirect effects on other countries through trade flows being relatively limited.
In terms of country heterogeneity, countries with a high degree of trade openness are more dependent on international markets. Consequently, their agricultural trade welfare is positively affected when GATT members face increased climate disaster risk. However, their agricultural trade welfare is also significantly and negatively affected by climate disaster risk in other countries. Furthermore, the influence of climate disaster risk on trade welfare is more pronounced in non-high-income countries. Regarding product heterogeneity, climate disaster risk has a considerable impact on the trade welfare of primary agricultural products in affected countries, while the trade welfare of processed agricultural products is less affected, owing to their greater resilience. Ultimately, climate disaster risk influences trade welfare primarily through the price indices of agricultural exports and imports.
Climate disasters significantly affect agricultural terms of trade, particularly for primary agricultural products. Consequently, high-income countries worldwide should increase investments in the agricultural sector, particularly in the research and development of climate-resilient technologies, to mitigate the effects of climate disasters on agriculture. This will help strengthen the sector’s resilience to climate disaster risk. In non-high-income countries, there is a greater need to adopt advanced agricultural technologies, such as precision farming and smart irrigation systems. Additionally, cultivating climate-resilient crop varieties can effectively increase agricultural productivity, reduce resource waste, and enhance the adaptability of the agricultural production system to climate change. Investments in agricultural infrastructure should also be prioritized, particularly in the construction and maintenance of water conservation facilities for farmland. Furthermore, both high-income and non-high-income countries should encourage and support the establishment of agricultural insurance systems for farmers, providing policy-based agricultural insurance to mitigate economic losses caused by climate disasters and strengthen their risk management capabilities.
Climate disasters disrupt supply chains, leading to tighter global supply and deteriorating trade conditions in agriculture. In response, the international community should establish an emergency mechanism to address these disruptions and minimize market fluctuations. First, there should be enhanced information sharing and resource allocation, with the establishment of a global agricultural market information system to promptly release real-time data on the supply, demand and price of agricultural products. This will assist governments and market participants in responding swiftly to market changes driven by climate disasters. Second, a global emergency reserve mechanism for agricultural trade should be established, with countries collectively stockpiling key agricultural products to address short-term supply and demand imbalances caused by climate disasters. Through international cooperation, the coordination of agricultural product reserves and releases will ensure a stable supply. Moreover, countries should strengthen policy coordination to jointly formulate trade policies that address climate disasters, avoiding unilateral trade restrictions in emergency situations to maintain the openness and stability of the global agricultural markets.
Countries with a high degree of trade openness may experience improvements in their agricultural trade conditions in response to climate disasters. However, as non-affected countries, their agricultural trade welfare may also be indirectly negatively impacted. First, countries should optimize tariff policies by reducing import tariffs on agricultural products and lowering non-tariff barriers to facilitate their cross-border flow. In particular, for primary agricultural products severely affected by climate disasters, temporary tax exemptions or reductions should be implemented to ensure market supply stability and mitigate price volatility. Second, countries should strengthen cooperation with major trading partners by signing bilateral or multilateral trade agreements to establish stable trade relationships. In the event of climate disasters, international trade cooperation will allow for the quick importation of agricultural products from other countries to compensate for domestic supply shortages and stabilize market supply and demand relationships. Additionally, countries should enhance the regulation of agricultural trade markets to prevent speculative behavior and market manipulation, ensuring fair competition and the stable operation of the market.
Publicly available datasets were analyzed in this study. This data can be found here: the trade data are derived from the CEPII-BACI, and the HS 6-digit code is employed for agricultural varieties, spanning from HS 01 to HS 24.
ZZ: Conceptualization, Formal analysis, Funding acquisition, Methodology, Writing – original draft, Writing – review & editing. CL: Conceptualization, Data curation, Resources, Validation, Writing – original draft, Writing – review & editing. JY: Conceptualization, Data curation, Formal analysis, Visualization, Writing – original draft, Writing – review & editing. XW: Data curation, Investigation, Project administration, Visualization, Writing – original draft, Writing – review & editing.
The author(s) declare that financial support was received for the research and/or publication of this article. This work was supported by the 2022 Beijing Education Science Planning Project: “Research on the Construction of Green and Low-Carbon Campuses in Beijing” (AJEA22022).
The authors acknowledge the editors and reviewers for their contributions to this paper.
The authors declare that the research was conducted in the absence of any commercial or financial relationships that could be construed as a potential conflict of interest.
The authors declare that no Gen AI was used in the creation of this manuscript.
All claims expressed in this article are solely those of the authors and do not necessarily represent those of their affiliated organizations, or those of the publisher, the editors and the reviewers. Any product that may be evaluated in this article, or claim that may be made by its manufacturer, is not guaranteed or endorsed by the publisher.
Anderson, J. E., and van Wincoop, E. (2004). Trade costs. J. Econ. Lit. 42, 691–751. doi: 10.1257/0022051042177649
Blonigen, B. A., and Soderbery, A. (2010). Measuring the benefits of foreign product variety with an accurate variety set. J. Int. Econ. 82, 168–180. doi: 10.1016/j.jinteco.2010.08.001
Broda, C., Limão, N., and Weinstein, D. E. (2008). Optimal tariffs and market power: the evidence. Am. Econ. Rev. 98, 2032–2065. doi: 10.1257/aer.98.5.2032
Broda, C., and Weinstein, D. E. (2006). Globalization and the gains from variety. Q. J. Econ. 121, 541–585. doi: 10.1162/qjec.2006.121.2.541
Carleton, T. A., and Hsiang, S. M. (2016). Social and economic impacts of climate. Science 353:aad9837. doi: 10.1126/science.aad9837
China Meteorological Administration (2023). State of the global climate 2022 report. Beijing: China Meteorological Administration (in Chinese).
Deng, Q. M., Cao, Y. M., and Jin, X. R. (2021). The impact of product diversification on the trade conditions of countries along the “belt and road” initiative. Int. Bus. Res. 2, 65–78. doi: 10.13680/j.cnki.ibr.2021.02.006 (In Chinese)
Dong, D. D., and Cao, L. J. (2019). The impact of SPS on China’s agricultural products exports: an analysis from the perspective of different processing degrees of agricultural products. Jiangsu Agric. Sci. 12, 325–329. doi: 10.15889/j.issn.1002-1302.2019.12.073 (In Chinese)
Feenstra, R. C. (1994). New product varieties and the measurement of international prices. Am. Econ. Rev. 88, 157–177.
Feenstra, R., and Kee, H. L. (2004). On the measurement of product variety in trade. Am. Econ. Rev. 94, 145–149. doi: 10.1257/0002828041301524
Galstyan, V., and Lane, P. R. (2008). External imbalances and the extensive margin of trade. Econ. Notes 37, 241–257. doi: 10.1111/j.1468-0300.2008.00200.x
Ganbaatar, B., Huang, J., Shuai, C., Nawaz, A., and Ali, M. (2021). Empirical analysis of factors affecting the bilateral trade between Mongolia and China. Sustain. For. 13:4051. doi: 10.3390/su13074051
Gaulier, G., and Mejean, I. (2006). Import Prices, Variety and the Extensive Margin of Trade. CEPII Working Paper 2006–17.
Goyal, A., and Kumar, A. (2021). Asymmetry, terms of trade and the aggregate supply curve in an open economy model. J. Econ. Asymmet. 24:e00206. doi: 10.1016/j.jeca.2021.e00206
Guo, K., Li, Y., Zhang, Y., Ji, Q., and Zhao, W. (2023). How are climate risk shocks connected to agricultural markets? J. Commod. Mark. 32:100367. doi: 10.1016/j.jcomm.2023.100367
Hoegh-Guldberg, O., Jacob, D., Taylor, M., Guillén Bolaños, T., Bindi, M., Brown, S., et al. (2019). The human imperative of stabilizing global climate change at 1.5°C. Science 365:eaaw6974. doi: 10.1126/science.aaw6974
Huang, M. Y. (2008). Research on the volatility of China’s trade conditions. World Econ. 12, 28–36. (In Chinese)
Krugman, P. (2009). The increasing returns revolution in trade and geography. Am. Econ. Rev. 99, 561–571. doi: 10.1257/aer.99.3.561
Lebre de Freitas, M. (2023). Forecasting inflation with excess liquidity and excess depreciation: the case of Angola. Econ. Chang. Restruct. 56, 473–514. doi: 10.1007/s10644-022-09427-y
Li, J. L. (2009). An empirical analysis of the effects of RMB exchange rate fluctuations on China’s agricultural products trade conditions. Agric. Technol. Econ. 5, 106–112. (In Chinese)
Luo, Z., Zhang, Y., Xiang, T., and Bai, Y. (2024). Great power responsibility and win-win cooperation: policy effect evaluation of the belt and road initiative. J. World Econ. 12, 3–34. doi: 10.19985/j.cnki.cassjwe.2024.12.001 (In Chinese)
Mill, J. S. (1848). Principles of political economy with some of their applications. Soc. Philos. 1:329.
Qian, X. F., Lu, L. J., Huang, Y. H., and Chen, Y. B. (2010). Has China’s trade condition really deteriorated? - a re-estimation based on changes in product categories. Manage. World 7, 18–29. doi: 10.19744/j.cnki.11-1235/f.2010.07.004 (In Chinese)
Sato, K. (1976). The ideal log-change index number. Rev. Econ. Stat. 58, 223–228. doi: 10.2307/1924029
Smith, J. B., Schneider, S. H., Oppenheimer, M., Yohe, G. W., Hare, W., Mastrandrea, M. D., et al. (2009). Assessing dangerous climate change through an update of the intergovernmental panel on climate change (IPCC) “reasons for concern”. Proc. Natl. Acad. Sci. 106, 4133–4137. doi: 10.1073/pnas.0812355106
World Meteorological Organization (2021). WMO atlas of mortality and economic losses from weather, climate and water extremes (1970–2019). WMO Rep. 90, 8–10.
Xu, Z. Y., and Zhu, J. (2017). Re-estimation of China’s agricultural products trade conditions based on the perspective of variety changes. Shanghai Econ. Res. 11, 75–86. doi: 10.19626/j.cnki.cn31-1163/f.2017.11.008 (In Chinese)
Yildirim, E., and Demir, I. (2022). Agricultural flood vulnerability assessment and risk quantification in Iowa. Sci. Total Environ. 826:154165. doi: 10.1016/j.scitotenv.2022.154165
Zhang, L. X., and Zhang, X. C. (2011). Research on the Impact of External Shocks on the Price Fluctuations of Agricultural Products in China: From the Perspective of the Agricultural Industry Chain. Manage. World. 1, 71–81. doi: 10.19744/j.cnki.11-1235/f.2011.01.010 (In Chinese)
Keywords: climate disaster risk, agricultural products, terms of trade, agricultural production, trade welfare
Citation: Zhang Z, Li C, Yuan J and Wang X (2025) The impact of climate disaster risk on agricultural trade welfare and coping strategies from a global perspective. Front. Sustain. Food Syst. 9:1547969. doi: 10.3389/fsufs.2025.1547969
Edited by:
Jason Grant, Virginia Tech, United StatesReviewed by:
Xia Li, Beijing Institute of Petrochemical Technology, ChinaCopyright © 2025 Zhang, Li, Yuan and Wang. This is an open-access article distributed under the terms of the Creative Commons Attribution License (CC BY). The use, distribution or reproduction in other forums is permitted, provided the original author(s) and the copyright owner(s) are credited and that the original publication in this journal is cited, in accordance with accepted academic practice. No use, distribution or reproduction is permitted which does not comply with these terms.
*Correspondence: Xiaojuan Wang, Y3VmZXd4akAxNjMuY29t
Disclaimer: All claims expressed in this article are solely those of the authors and do not necessarily represent those of their affiliated organizations, or those of the publisher, the editors and the reviewers. Any product that may be evaluated in this article or claim that may be made by its manufacturer is not guaranteed or endorsed by the publisher.
Research integrity at Frontiers
Learn more about the work of our research integrity team to safeguard the quality of each article we publish.