 Mekonen Getachew Abebe
94% of researchers rate our articles as excellent or good
Learn more about the work of our research integrity team to safeguard the quality of each article we publish.
Find out more
ORIGINAL RESEARCH article
Front. Sustain. Food Syst. , 26 February 2025
Sec. Land, Livelihoods and Food Security
Volume 9 - 2025 | https://doi.org/10.3389/fsufs.2025.1528346
This article is part of the Research Topic Indigenous and Local Knowledge as a Catalyst for Sustainable Agriculture and Food Security View all 6 articles
Introduction: Ethiopia has faced significant food insecurity challenges, impacting households from the district to the national level. To strengthen household resilience to food security, it is essential to assess their current resilience levels accurately. The main objective of the study was to assess rural household resilience to food insecurity in Libo Kemkem, a district in northwest Ethiopia, which is particularly susceptible to food insecurity, and identify the contributions of the key pillars that enhance households' capacity to cope with food insecurity.
Methodology: The research used a cross-sectional survey with 216 households, drawn using a multi-stage stratified sampling technique to ensure representation across different subgroups. The Food and Agricultural Organization's Resilience Index Measurement and Analysis II framework was applied to assess the levels of resilience. Factor analysis was used as the main analytical tool to estimate the household resilience index.
Result and discussion: The result indicated that asset, adaptive capacity, and access to basic services are highly contributed to resilience with positive scores of scores of 0.85, 0.82, and 0.81 respectively. All the aforementioned scores of resilience pillars are highly significant since it is greater than 0.37 which is recommended for a sample size of 200 and above. Nevertheless, the social safety net is negatively associated with resilience, with a score of 0.68. The average household resilience capacity index was 0.56, showing that 63% of households are less resilient. The overall results of the study showed that households with better assets, adaptive capacity, and better access to basic services, are likely to be more resilient. Consequently, this study recommends applying targeted resilience-oriented strategies programs, packages, and projects that improve these positively contributing pillars of resilience to enhance food security in the area.
Food insecurity is a major challenge for all countries, especially developing ones (Abebe, 2024; Becker et al., 2017; Kwaw-Nimeson and Tian, 2021; Ojo, 2019). It has been a widespread concern for several years (Elzaki, 2023). Even though the issue is most noticeable in sub-Saharan and Asian countries, nearly all nations around the world have not yet attained food security (Sisha, 2020). In 2020, 928 million people faced severe food insecurity, an increase of 148 million from 2019, and 2.37 billion, or one-third of the global population, lacked adequate food access (Kiran and Jabbar, 2022). Ethiopia, like other developing countries, faces a major challenge in ensuring food security (Aragie and Genanu, 2017; Bahiru et al., 2023). Major persistent factors impacting food security in the country include land degradation, population pressure, deforestation, and desertification (Abebaw and Betru, 2019; Getaneh et al., 2022; Weldegiargis et al., 2023). Additionally, smallholders suffer the worst effects of climate change and variability, leading to increased poverty, water scarcity, and food insecurity (Assefa Tofu and Wolka, 2023; Tesso et al., 2012). Consequently, a huge amount of the country's inhabitant suffers from chronic and transitory food insecurity.
As a result, Ethiopia has frequently been associated with famine and food insecurity on a global scale (Africa Development Bank, 2014). The daily caloric intake in the country is lower than 2,100 kcal per person per day (Kashay and Mulugeta, 2014). Furthermore, recurrent droughts and floods have caused the number of affected households to increase over time. For instance, during the 2015 El Niño-induced drought, over 27 million people experienced food insecurity, affecting almost 20% of households. Of these, 18.1 million needed food assistance in 2016 (Neglo et al., 2021). Additionally, the levels of vulnerability to poverty among households in Tigray, Amhara, Oromia, SNNP, and other regions are 48%, 54.5%, 49.5%, 58%, and 51.4%, respectively (Demissie and Kasie, 2017). Moreover, according to Welderufael (2015), nearly half (48%) of the surveyed households were unable to achieve the daily suggested caloric intake. Furthermore, nearly one in two individuals lack adequate food access (Abebe, 2024).
To address such a challenge, governmental and non-governmental entities and agencies design and implement strategies and growth initiatives that prioritize resilience as a core idea or long-term goal (Von Grebmer et al., 2013). “Resilience in the context of food security is conceptualized as the capacity of households to anticipate, cope with, adapt to, and recover from food insecurity shocks and stresses” (Alinovi et al., 2010; Dhraief et al., 2019). This includes both immediate coping mechanisms and long-term strategies to maintain food security. Understanding which groups within the society exhibit low resilience levels is crucial, as low household resilience increases vulnerability, and vice versa (Chamdimba et al., 2021). Furthermore, studying resilience helps us understand the determinants of vulnerability and the adaptation strategies adopted by households over time (d'Errico and Di Giuseppe, 2018). It also supports decision-makers in designing forward-looking policies to enhance household resilience capacity to food insecurity.
To support this idea, globally many studies such as Alinovi et al. (2010), Gambo Boukary et al. (2016), Béné et al. (2016), Myeki and Bahta (2021), Ciani and Romano (2014), and Ladaninezhad et al. (2023), studied the contributions of resilience pillars1 to enhance food security. Similarly, different authors such as Beyene et al. (2023), Melketo et al. (2021), Atara et al. (2020), and Kebede et al. (2016) at different times measure the levels of household resilience to food security and assess the contributions of resilience pillars to food insecurity. However, researchers use different pillars to measure resilience. For instance, if we looked into the case of Ethiopia, Tefera et al. (2017) used aggregation of grain stock, in-kind precautionary, education, and risk-sharing strategies as a pillar of resilience. Likewise, Kasie et al. (2017), applied broader geographical and institutional context; household shock exposure; adaptive capacity; sensitivity, and household reaction to shock as a dimension of resilience. While, Atara et al. (2020) used agricultural assets, agricultural technology adoption, access to basic services, social capital, social safety nets, adaptive capacity, and income and food access. Due to this, there is a lack of harmony or consistency in recommendations of best-concerning resilience and its attributes being observed (Ansah et al., 2019). Moreover, resilience is context-specific, i.e., it needs to be studied in a specific location (Constas et al., 2014).
Therefore, this study was conducted in Northwestern Ethiopia specifically in Libo kemkem district to investigate households' ability to withstand food insecurity. The objectives of this study were (1) to measure the levels of rural household resilience to food insecurity and (2) to identify the major pillars of resilience that contribute to rural households' capacity to cope with food insecurity. This research hypothesizes that households endowed with stronger social networks, diversified income streams, better access to basic services and advanced agricultural practices demonstrate greater resilience to food insecurity, enabling them to better withstand and recover from shocks and stresses.
Resilience is a multifaceted concept that is not directly observable (d'Errico and Di Giuseppe, 2018). This is because the resilience of rural households depends on the range of choices available to them for maintaining a decent standard of living (Alinovi et al., 2010). As it encompasses multiple dimensions, the available frameworks for assessing resilience vary, depending on their focus on either the outcome or process-driven approach (Ahsan and Takeuchi, 2015). The former approach views resilience in terms of the final results achieved, while the latter considers resilience as a series of dynamic adaptations aimed at restoring the original state. Since resilience is a relatively new concept, there are no internationally agreed-upon measurements for it. As a result, researchers have employed various approaches to measure resilience across different indicators, leading to a lack of standardized measurement and consistency.
However, more recently, the Food Agricultural Organization (2016), has recognized resilience as an outcome variable resulting from various socio-economic factors, including access to basic services: (which is understood as the ability of a household to meet basic needs, by accessing and effectively using the available basic services); adaptive capacity (is defined as the ability of different actors or groups of actors to respond to climate shocks, stressors, risks, or new opportunities); assets (refer to the resources available to individuals, organizations or entire communities that can be used to further create wealth, reduce or prevent poverty, and redress skewed distribution); and social safety nets (is concerned with protecting and helping those who are poor, vulnerable, marginalized or dealing with risks). However, these four dimensions of resilience are latent and require other observed variables to estimate them separately (Dhraief et al., 2019). Identifying these proxy variables for resilience pillars can be done based on existing literature, the context of the study area, and the researchers' experience. The measurement of resilience is conceptualized in Figure 1.
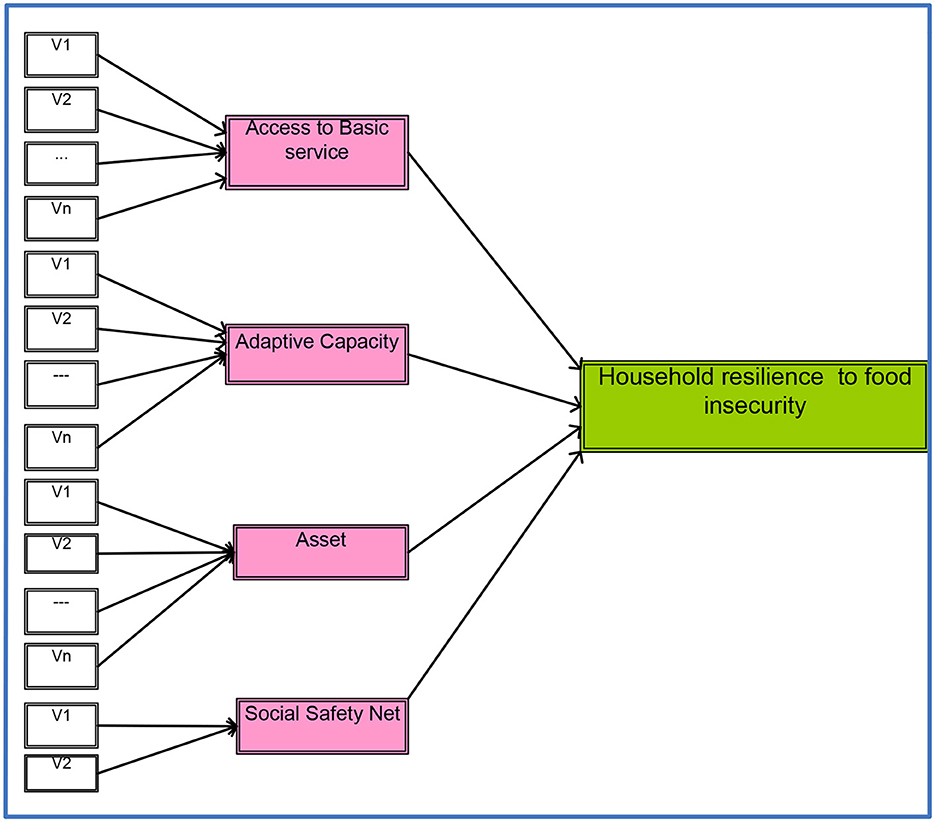
Figure 1. Path diagram household resilience to food insecurity model. Reproduced from Food Agricultural Organization (2016), licensed under CC BY 3.0 IGO.
The study was conducted in Northwest Ethiopia, specifically in the Libokemkem district. It encompasses an area of 1,560 km2, the district is situated at 11°57′46.6″-12°25′32.6″N latitude and 37°34′48.9″-38°3′30.9″ longitude (Geberselassie et al., 2018) (see the maps in Figure 2). It shares borders with Belesa to the North, Fogera to the South, Lake Tana, and Gonder Zuria to the West, and Ibnat district to the East. The primary economic activity of households is rain-based farming, producing wheat, beans, sorghum, maize, barley, rice, and millet along with livestock rearing (Aklilu et al., 2017; Engidaw and Gebremariam, 2020). The district is 81% Woyena-Dega, 18.1% Dega, and 0.9% Kolla (Addisu, 2015). According to Sisheber et al. (2015), as cited in Mengistu (2019), the land-use system of the district reveals that 51% is arable or cultivable land, 8.3% is pasture, 5.9% consists of forest or shrubland, 17.98% is occupied by water bodies, and the remaining 17.03% is categorized as degraded land. Continuous agriculture in the study district is leading rapid reduction in vegetation cover (see Figure 3). The average annual temperature varies from 25°C to 28°C, with a relative humidity of 31%−52.7% and a mean yearly rainfall of 900–1,200 mm (Demelash and Birri, 2019). Small-scale irrigation has begun in the lowlands (Mitiku, 2012). The district has one hospital, two health centers, 10 health posts, and a few private drug vendors (Demelash and Birri, 2019).
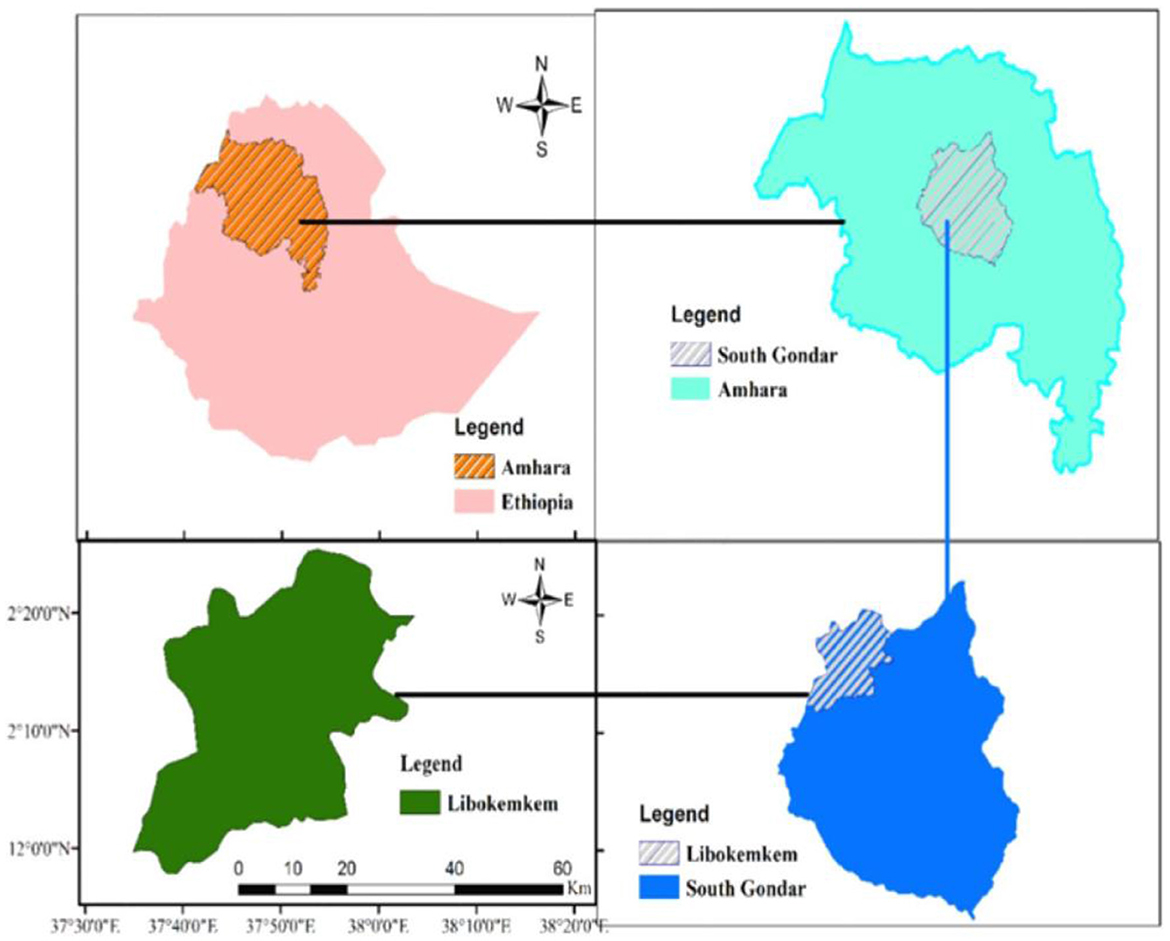
Figure 2. Map of the study area. Reproduced from Megabia et al. (2022), licensed under CC BY 4.0.
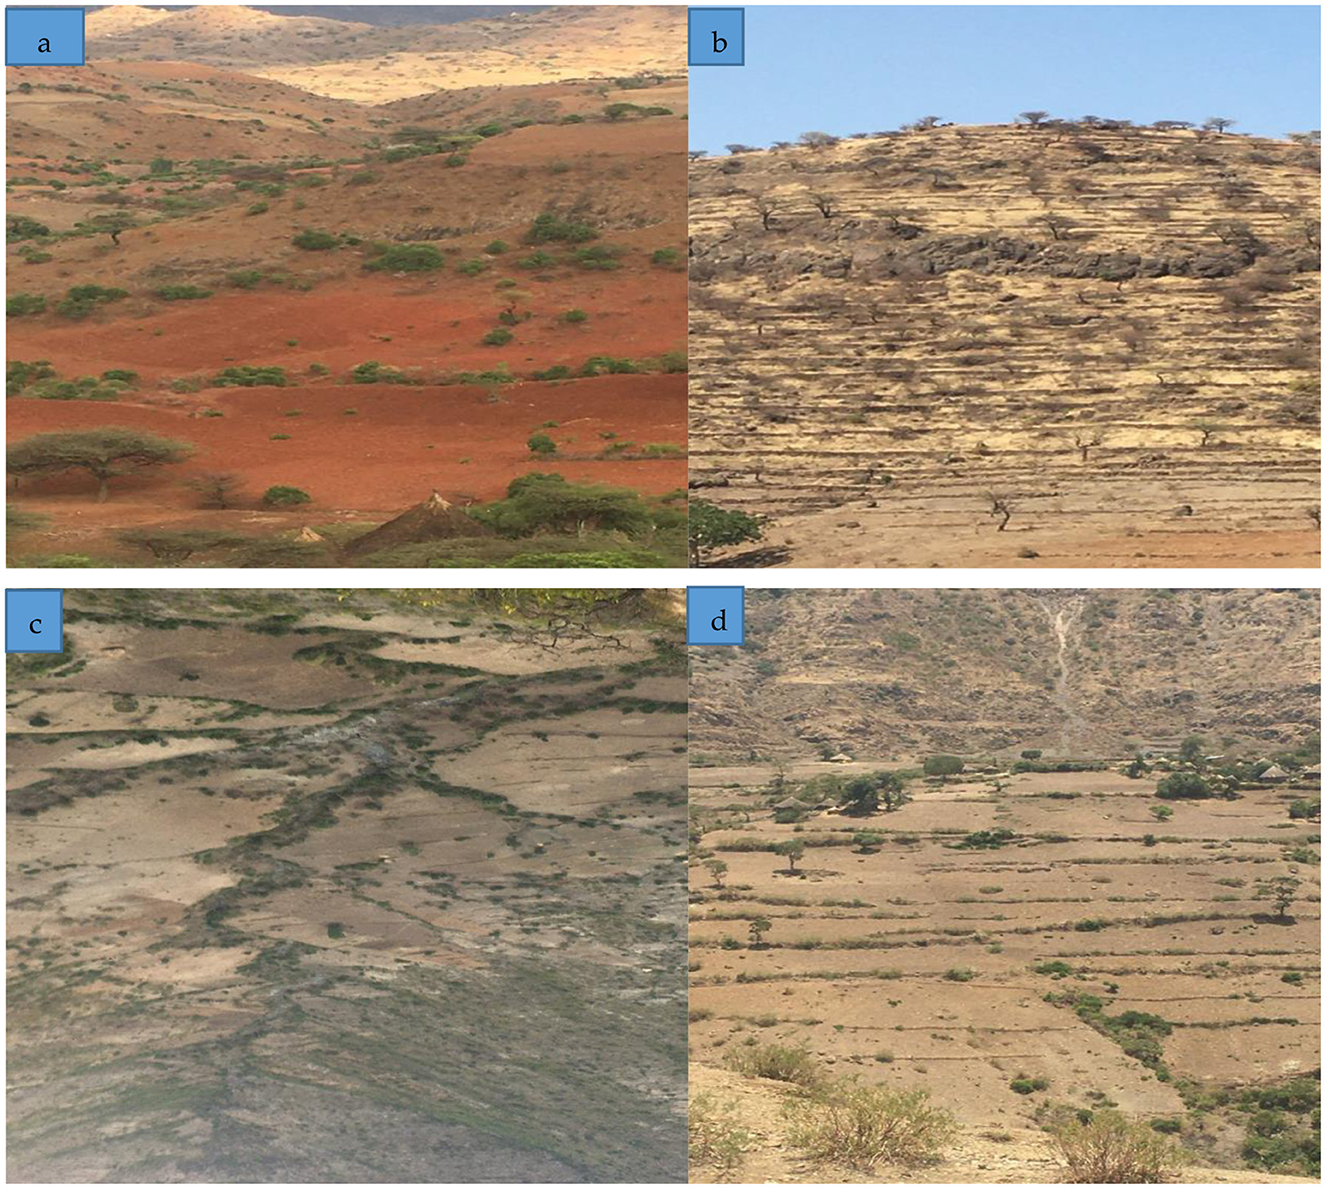
Figure 3. Different Topography of Libo Kemkem district, Northwestern, Ethiopia. (A) Ginaza Silkisa kebele; (B) Manto-Gera kebele; (C) Mikael Debir kebele; and (D) Shina Tsion kebele. Source: Image captured by the author during data collection (2023).
The study employed a household survey as its research strategy, primarily utilizing a quantitative approach with qualitative support. A household survey was chosen for this study because it effectively gathers comprehensive data directly from individuals within their settings, allowing for detailed insights into household characteristics, socio-economic status, and resilience factors. This method provides broad coverage by reaching a large sample size and capturing both quantitative and qualitative data through structured questionnaires. It offers direct feedback on agricultural practices, food security, and the impact of climate hazards, making it ideal for understanding diverse household experiences and challenges. Additionally, the efficiency of surveys enables widespread data collection across a geographically dispersed area, ensuring reliable and actionable information for addressing the study's objectives. The district chosen for the study was purposively selected because of its significant susceptibility to flood, pervasive poverty and food insecurity, recurrent droughts, and high population pressure with declining agricultural production (Tadesse, 2019).
The district comprises 29 rural kebeles,2 with 23 of them being beneficiaries of the productive safety net program (LWoFS, 2018). It comprises three livelihood zones. These are the Tana Zuria Livelihood Zone (Hereafter TZLZ), the Tana-Zuria Rice Livelihood Zone (Hereafter TZRLZ), and the Northern Highland Wheat Barley and Sheep Livelihood Zone (Hereafter NHWBLZ) (see Figure 2). In 2018, the district's total population was 269,970 and 64,531 households (Demelash and Birri, 2019). A multistage stratified sampling approach was applied to recruit households to the sample. In the first stage, the Libokemkem district was stratified into three livelihood zones: TZLZ, TZRLZ, and NHWBLZ. The TZLZ zone comprises 16 kebeles, TZRLZ includes seven kebeles, and NHWBLZ consists of 6 kebeles. TZLZ has more than twice the number of kebeles compared to the other zones. Next, within each livelihood zone, sample kebeles were purposively selected. This was done because some kebeles intersected two or more livelihood zones with varying degrees. Therefore, only kebeles entirely located within one livelihood zone were included in the study. Consequently, Ginaza-Slikisa and Mantogera from Tana Zuria, Mikael-Debir from NHWBLZ, and Shina Tsion from TZRLZ totaling four kebeles were included in the study. This approach was taken to ensure a proportional representation of each livelihood zone. Furthermore, the number of households in Ginaza-Silkisa, Manto-Gera, Shina-Tsion, and Mikael-Debir are 1,371, 1,639, 1,371, 1,729, and 2,514, respectively, totaling 7,253. The sample size was calculated using the formula from Yamane (1973) which is detailed below.
n = the sample size,
N = the population size (N = 7,253),
e = sample size for precision [A 7% margin of error was chosen to balance precision and practicality, given the study's homogeneous population and budgetary/logistical constraints (Creswell and Creswell, 2017)].
Based on this formula, 199 samples were initially selected. To account for potential non-responses or missing data, the sample size was increased by 10%, resulting in 219 samples. This approach is supported by Naing et al. (2006) who suggest oversampling by 10%−20% to compensate for non-responses. Among these, 216 questionnaires were filled and returned properly. Table 1 shows the distribution of sample households across each livelihood zone. Finally, household heads served as the unit of analysis, and selection was carried out using systematic random sampling with a sampling interval (k). The first household was chosen through simple random sampling. Household heads are selected because they typically have the most comprehensive knowledge of the household's overall situation.
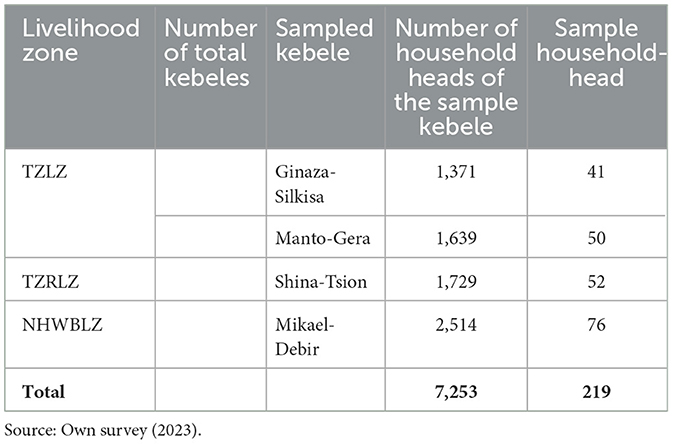
Table 1. Distribution of sample households.
The research utilized a comprehensive mixed-method approach, integrating both primary and secondary data sources to deliver a thorough analysis. Primary data were collected through structured household surveys, facilitated by local enumerators well-versed in the region's culture and language. A household survey was used for its comprehensive data collection, covering household characteristics, socio-economic status, and resilience factors. This method efficiently gathers data from a large, diverse sample across a wide area, offering reliable information for the study's objectives. Participants provided informed consent through both verbal and written methods, with verbal consent documented by researchers and written consent forms signed and securely stored. Household surveys involved face-to-face interviews using structured questionnaires. Qualitative data were collected through interviews with 12 key informants, comprising four individuals from each kebele. The key informants included extension agents, elders, representatives from the female league, and religious leaders. Additionally, eight focus group discussions (FGDs) were conducted, with one male and one female group in each kebele. The focus groups consisted of model farmers, adult community members, and beneficiaries of the Safety Net Program (see Figure 4). This approach ensured diverse perspectives were captured for a comprehensive analysis. All data was anonymized and stored securely to maintain confidentiality, and participation was voluntary, with the option to withdraw at any time.
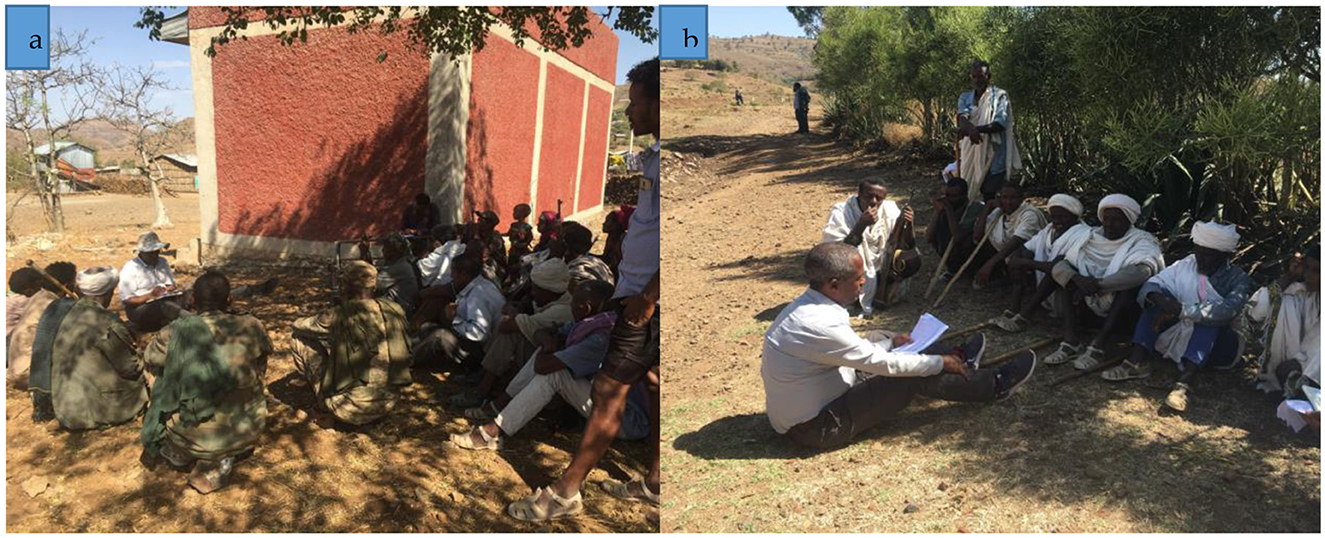
Figure 4. Pictures of focus group discussant during data collection. (A) Manto-Gera kebele; (B) Ginaza-Silkisa kebele. Source: Image captured by the author during data collection (2023).
The interview schedule was pretested with 20 respondents who were not part of the main sample, and revisions were made based on their feedback. Cronbach's alpha was used to evaluate the internal consistency of items designed to measure various concepts, with a value of 0.7 indicating acceptable consistency (Tsang et al., 2017). However, questions related to household participation in non-farm activities, such as carpentry, weaving, local beer brewing, and petty trading, yielded alpha values below 0.7, indicating low validity. To address this, these categories were combined, and the questionnaire was revised to enhance its overall validity. Additionally, qualitative data were gathered from focus group discussions with men, women, and youth, as well as key informant interviews in each kebele. In the context of rural household resilience to food insecurity, interviewing men, women, and youth in focus group discussions provides a well-rounded view of how different household members experience and respond to food insecurity. This inclusive approach helps identify specific challenges and coping strategies unique to each group, ensuring that interventions are tailored to the diverse needs of the entire household. By capturing a range of perspectives, the study can better understand and enhance the overall resilience of rural households against food insecurity.
In this study, resilience identification is based on the Food and Agriculture Organization Resilience Index Measurement and Analysis II (FAO RIMA-II) model, which necessitates the definition and identification of the most precise indicators for each resilience dimension (Table 2).
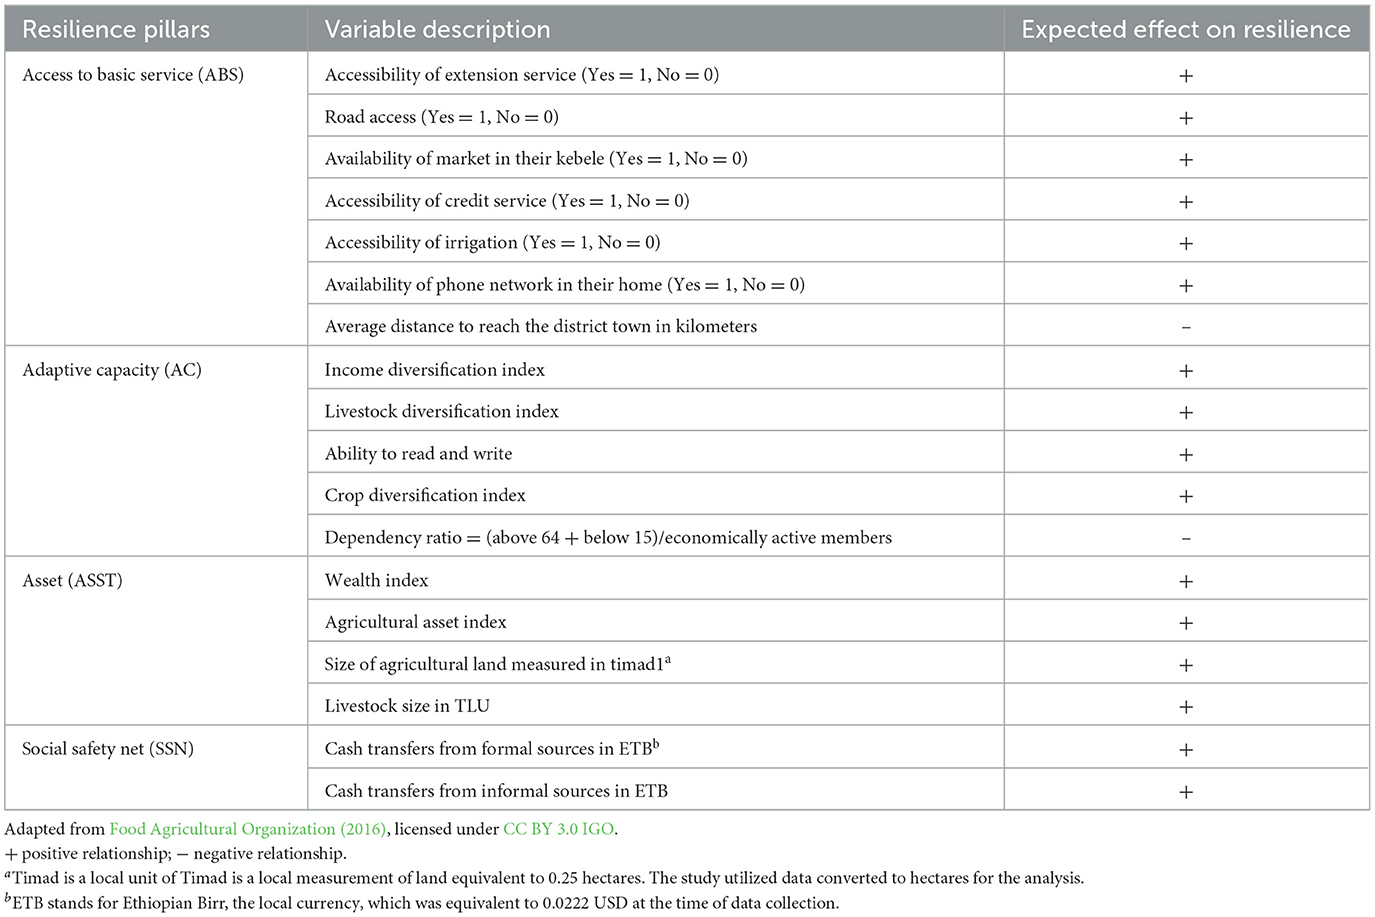
Table 2. The relationship between resilience and its proxy variables.
Drawing from RIMA-II, the estimation of resilience and its underlying pillars involves a multivariate statistical approach conducted in two stages, employing factor analysis (FA) and structural equation modeling (SEM) (Food Agricultural Organization, 2016). However, in this study, a two-stage factor analysis is utilized instead of SEM. The rationale for this choice lies in the limitations of SEM, which necessitates the simultaneous measurement of all components and assumes normally distributed residuals, thereby restricting it to continuous proxy forms. Yet, household data often exhibits a mixture of measurement scales (e.g., ratio, ordinal, or categorical), rendering SEM impractical for resilience measurement. Hence, employing multivariate techniques like factor analysis or principal component analysis proves advantageous (Alinovi et al., 2010; Kebede et al., 2016).
When estimating resilience, this study employs a two-stage factor analysis approach. In the first stage of factor analysis, the resilience pillars—such as Access to Basic Services, Adaptive Capacity, Assets, and Social Safety Nets—are treated as dependent variables. These pillars are estimated from their proxy indicators. In the second stage of factor analysis, however, these resilience pillars become independent variables, used to estimate the overall resilience of households (Dhraief et al., 2019). This process involves reducing the number of variables to alternative indicators for the latent variables, so yielding a single measure of the pillar of interest. Additionally, factor analysis assigns appropriate weights to each variable (Demeke and Tefera, 2013). It facilitates the estimation of pillars that are not directly observed, such as resilience pillars (Bollen, 2002). The fundamental concept underlying the hidden variable approach to measure resilience is that one or more hidden variables establish connections between variables that are not directly observed (Bollen, 2002). This mathematical relationship can be described as follows.
Where
γi = Observed indicator for the ith case
λ0 = Intercept term
λ1 = the “factor loading” that gives the impact of the 1st factor on γi
εi1…εik= Factor loading for the 1st through k case
ui= unique variable or error term
The study pursued two concurrent objectives: identifying substantive variables contributing to household resilience and gauging the level of household resilience. The significance of comparative support of a variable to the household resilience capacity index, beyond its role in estimation, is indicated by the weight of the factor loading. Substantive variables are identified based on their factor loading values, with a loading of 0.364 and above deemed significant for sample sizes exceeding 200 (Field, 2013). Additionally, variables with higher loadings are considered more crucial and deserving of greater attention (Ngesa et al., 2020). These weights are determined through six steps of factor analysis, including assigning weights and interpreting factors, where factor loadings are computed to represent the correlations between each variable and the resilience factors. Before conducting any analysis, it is imperative to assess the factorability of the indicators by verifying the prerequisites recommended for factor analysis and its associated models.
Among these prerequisites, the Kaiser-Meyer-Olkin (KMO) measure of sampling adequacy, the Bartlett Test of Sphericity, and the presence of multicollinearity or singularity are examined. The KMO measure evaluates whether the sample surveyed is suitable for factor analysis and its related models. As per Kaiser (1960) cited in Gambo Boukary et al. (2016), a KMO value exceeding 0.5 is deemed acceptable for conducting factor analysis. Bartlett's Test of Sphericity determines if the correlation matrix (R-matrix) resembles the identity matrix, which is crucial for meaningful factor analysis. This test also assesses whether variables in factor analysis exhibit significant correlations or not. Furthermore, it evaluates the null hypothesis, which posits that variables only correlate with themselves. In pursuit of a robust model, this test necessitates rejecting the null hypothesis (indicating a failure to accept it) (Balasundaram, 2009).
Testing for multicollinearity or singularity involves examining the determinant of the R-matrix, which represents the correlation coefficients matrix of the variables in the model. Field (2005) as cited in Atara et al. (2020), suggests that for a reliable model, the determinant of the R-matrix should exceed 0.00001. Additionally, adherence to the factor extraction rule proposed by Kaiser (1960) as cited in Kebede et al. (2016), is crucial. This rule advocates retaining eigenvalues greater than one to select more meaningful factors. Consequently, pillars such as access to basic services, social safety nets, adaptive capacity, and assets were constructed based on this principle. Three pillars of resilience (such as AC, ASST, and ABS) and their proxies were estimated using factor analysis. Meanwhile, the social safety net was estimated using min-max standardization. This is because factor analysis cannot estimate an index with fewer than three indicators (Wu, 2018). The formula for min-max standardization is shown in Equation (4).
After distinctly estimating the AC, ASST, and ABS through the first stage of factor analysis, and SSN through the min-max method, the second stage involves assessing the significance of each dimension and estimating the overall resilience index. Subsequently, the second-stage factor analysis (FA) is utilized to calculate a hidden outcome, namely the resilience capacity index, based on the aforementioned pillars calculated separately. This process entails amalgamating the dimensions to derive the composite resilience index. Mathematically, this can be represented as:
RCIi stands for Resilience capacity index of ith household rely on the state of ABS and AC. ASS, and SSN time t, with the error term. To interpret easier mean max rescaling was applied and the result should be changed to either 0–1 or 0–100 (Monserrath and Lascano, 2020; Ngesa et al., 2020). This indicates when RCI is close to 0 the household becomes less resilient and vice versa. According to Le et al. (2019), the formula is written as
Where and Xi stand the individual households' transformed and untransformed RCIs, respectively; Xmax and Xmin represent the maximum and minimum observed values, respectively. To prepare the data for analysis, all quantitative datasets were coded and input into SPSS version 23, chosen for its robust data management capabilities, before being exported to STATA version 14.1. Additionally, data from focus group discussions and key informant interviews were analyzed thematically to triangulate the quantitative results. In resilience analysis, there is a lack of a clear cutoff point to categorize households as resilient or less resilient. However, authors like Demeke and Tefera (2013), have used mean resilience index values to determine household resilience status, considering households scoring below the average as non-resilient and those scoring above average as resilient. This study also adopts this cut-off point to categorize households as resilient of less resilient.
Among the 216 participants, ~81% represent male-headed households, while 19% represent female-headed households. The average age of household heads is around 46 years, with an average household size ranging from five to six members. Specifically, the mean number of household members aged above 64 is 0.2, while those below 15 years old average at 2. The majority of households (63%) are classified as not receiving formal education or unable to read and write. Ownership of assets such as oxen and milking cows is prevalent, with 72% of households owning oxen and 65% owning milking cows. Additionally, 35% of households are not involved in any productive safety net program. Given the rural context, the primary occupation of respondents is farming, with ~84% engaged solely in crop production activities. Around 13% of respondents practice both farming and trade, while a minor percentage of 3.5% is involved in small-scale trade activities. Moreover, about 85% of respondents engage in both crop and animal production, while the remaining 15% solely focus on crop production (see Table 3).

Table 3. Demographic and socioeconomic profile of sample households.
Table 4 summarizes key variables for resilience analysis, showing land use (0.2 ha per capita) and livestock (0.7 TLU per capita) as crucial assets, with wealth and agricultural wealth indices averaging 0.4 and 0.8, respectively. Access to basic services includes irrigation (51%), credit (74%), extension (44%), telecom networks (93%), and markets (27%), with 27% facing mobility constraints and an average distance of 11.7 km to the nearest district town. Social safety nets are indicated by annual transfers of 328 ETB (formal) and 263 ETB (informal) per capita. Adaptive capacity is reflected by crop diversification (0.6), livestock diversification (0.7), and income diversification (0.9).
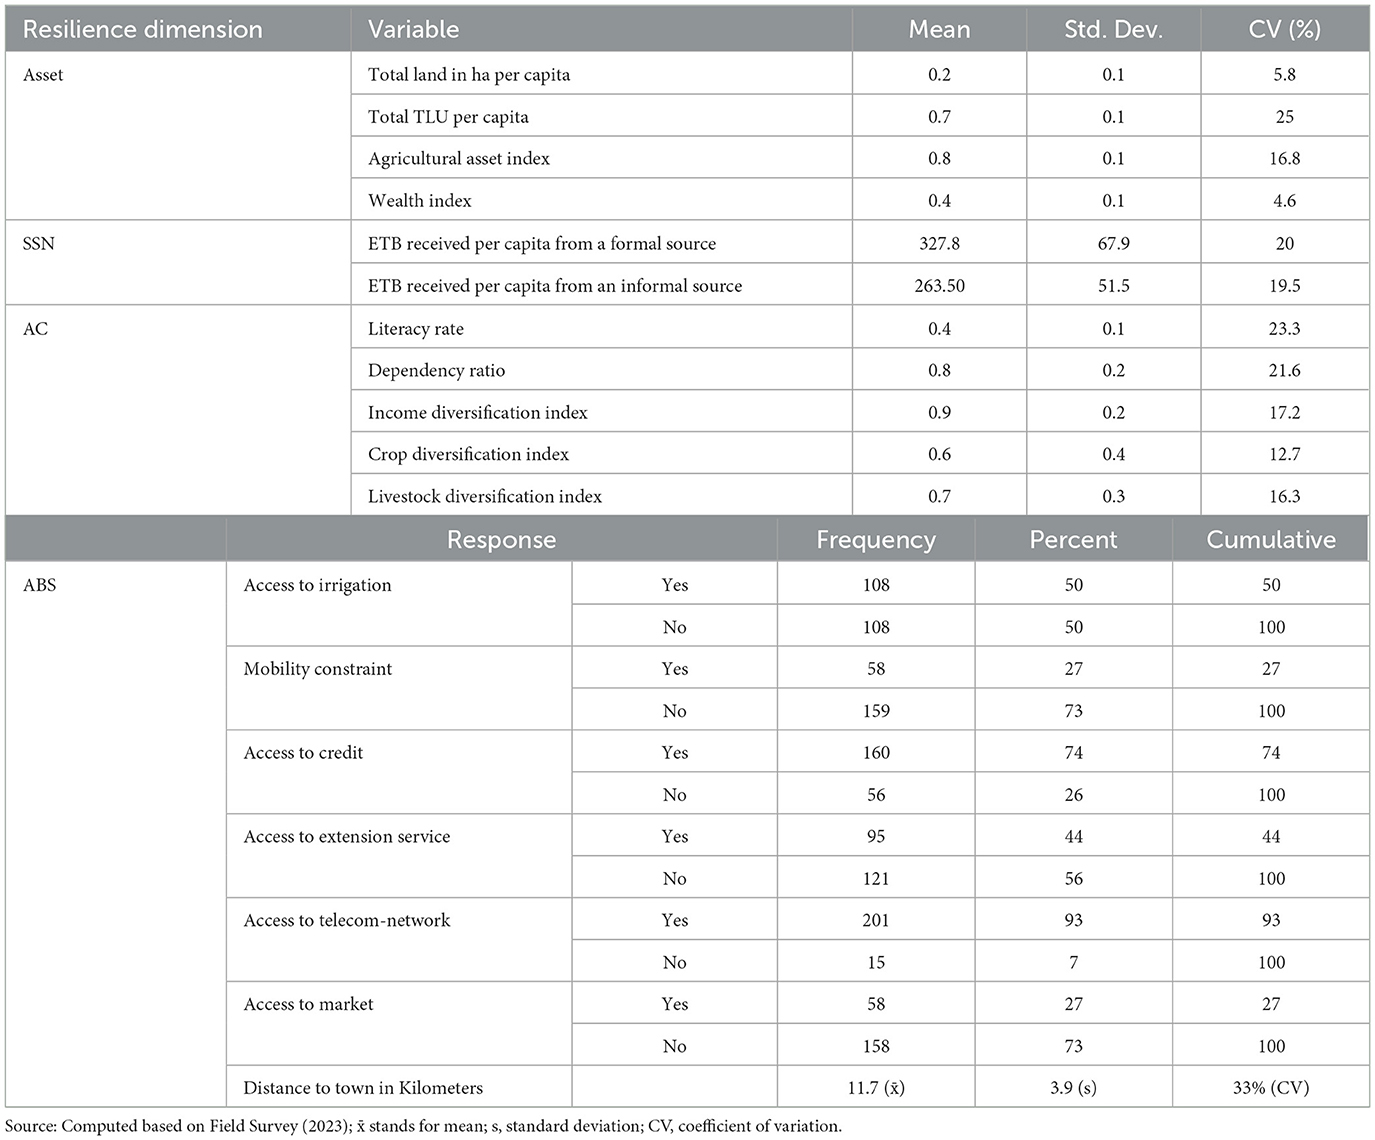
Table 4. Resilience explanatory variables.
Before proceeding with resilience measurement, it is imperative to estimate the resilience pillars based on the survey data. Identifying appropriate indicators is fundamental for designing effective future policies and interventions. Therefore, each resilience pillar, namely adaptive capacity, asset, and access to basic services, is estimated separately as outlined below.
Adaptive capacity, being a hidden variable, can be calculated by variables such as the crop diversification index, livestock diversification index, literacy rate, income diversification index, and dependency ratio. Before estimating adaptive capacity (AC), these indices undergo estimation through factor analysis.
The CDI is derived from a selection of crops including wheat, barley, millet, maize, rice, and beans. To ensure the validity of the factor analysis model, all statistical prerequisites are met (refer to Table 5). Following the Kaiser rule, two factors are retained, collectively explaining 77% of the variation. Table 5 illustrates the variables utilized for approximating the crop diversification index. The first three variables (wheat/barley, maize, and millet) predominantly contribute to the first factor, with millet and maize exhibiting higher loadings. Notably, wheat production demonstrates an inverse loading for the first factor due to its cultivation being limited to one-fourth of the study area. The CDI for each household is computed by combining the factor scores of both factors, utilizing the comparative variance explained by each factor as a weighting mechanism. Thus, the crop diversification index is the weighted sum of scores on the two factors.
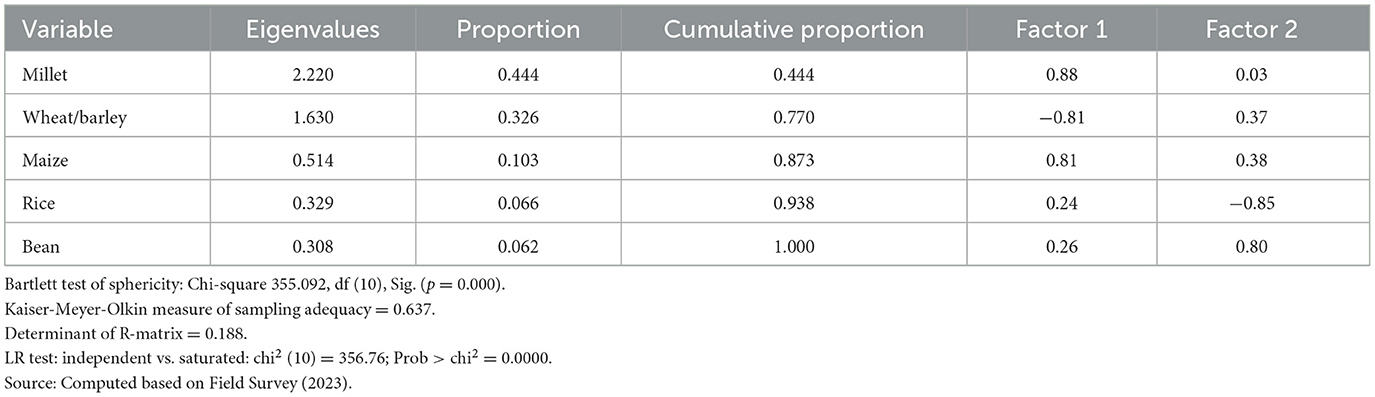
Table 5. Eigenvalue and factor loadings of crop diversification index.
The LDI is determined using variables such as oxen, milking cows, other cattle, equines, and shoats. Statistical tests confirm the adequacy of the factor analysis model, with two factors retained that collectively explain ~70% of the total variation (refer to Table 6). As indicated in Table 6, ownership of oxen significantly influences the estimation of the livestock diversification index. The loadings for all variables are positive as anticipated.
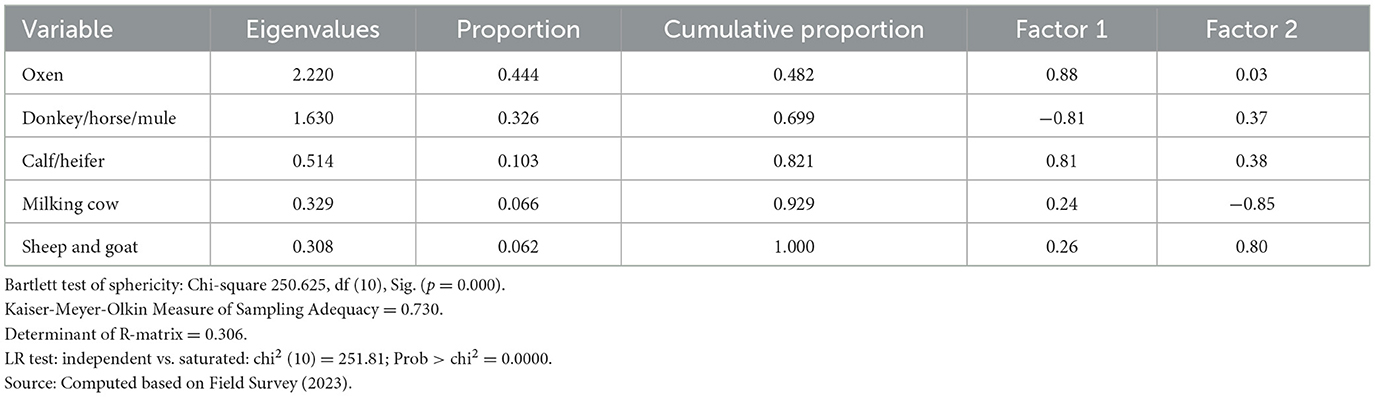
Table 6. Eigenvalue and Factor loading of livestock diversification index.
The IDI is calculated based on variables including income from trade, rent, grain production, vegetables, perennial plants (such as mango, banana, “gesho,” eucalyptus) cultivation, and livestock production. The statistical prerequisites for a robust factor analysis model are met, with three factors retained due to eigenvalues exceeding 1. These factors collectively explain ~65% of the total variation (see Table 7). Factor one is highly correlated with participation in trade, crop production, and animal production activities, although trade exhibits a negative correlation. Factor two shows a strong positive correlation with income received from rent, while remittance is negatively correlated. Perennial plant income and vegetable income are correlated with factor three, albeit with a negative correlation for vegetables. Notably, household participation in perennial plant cultivation demonstrates the highest loading under the overall significance of the variables, followed by income gained from rent (see Table 7).
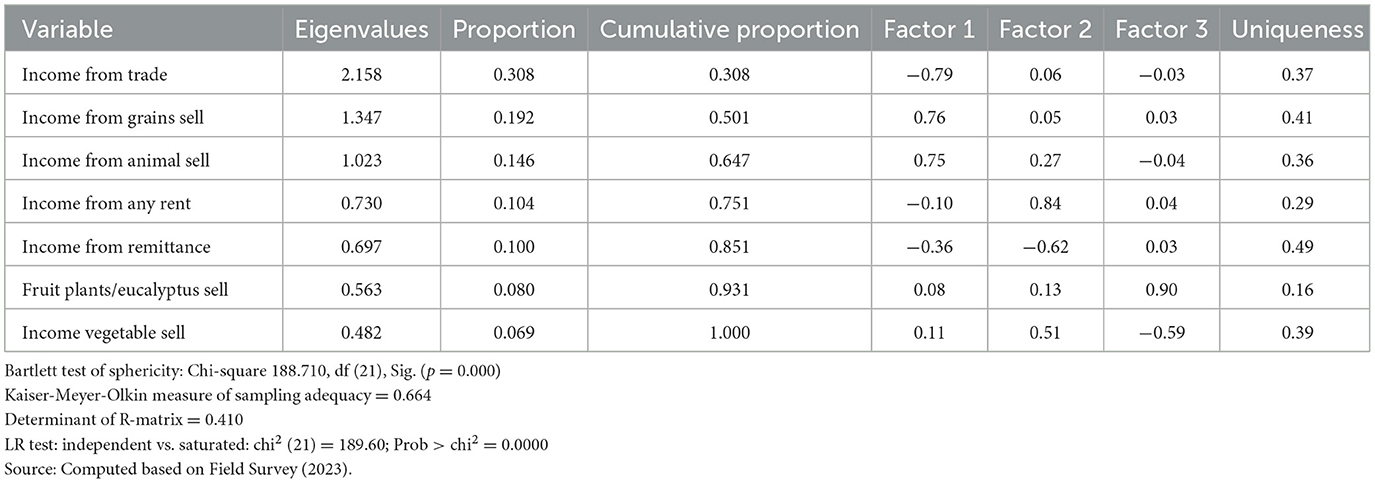
Table 7. Eigenvalue and factor loadings of income diversification index.
To estimate the latent variable income diversification index (IDI), the combined factor scores of the three factors are utilized, applying the relative variance explained by each factor as a weighting mechanism. Therefore, the IDI for each household represents the weighted sum of its scores on each of the three factors.
The estimation of adaptive capacity involves utilizing various indices, including the crop diversification index, livestock diversification index, and income diversification index, alongside the dependency ratio and literacy rate. Through factor analysis, two factors are retained, each with eigenvalues greater than one. The first and second factors capture 32% and 24% of the variation, respectively, collectively explaining 57% of the total variation. All statistical prerequisites are met, ensuring the validity of the model (refer to Table 8). Notably, the livestock diversification index and income diversification index exhibit positive and significant loadings to adaptive capacity (see Table 8).

Table 8. Eigenvalue and factor loadings for adaptive capacity.
Proxy variables such as the wealth index (comprising non-productive assets like radio/television, bed, and phone), agricultural wealth index (including agricultural equipment and tools such as plow and sickle), tropical livestock units per capita, and size of agricultural land in hectares per capita aid in estimating the asset pillar of resilience. All necessary statistical prerequisites for factor analysis are met.
Upon aggregation of the wealth index, two factors are retained. The first factor elucidates ~40% of the variation, while the second factor accounts for 26% of the total variation (refer to Table 9). Notably, except for jewelry, all variables exhibit significantly positive correlations with factor one. The availability of phones, followed by the availability of radio/televisions, emerges as the most crucial variable for estimating the wealth index of rural households (refer to Table 9). Given that the eigenvalues of two factors are greater than one, the combined factor scores of both factors are utilized to estimate the latent variable wealth index. This is achieved by employing the relative variance explained by each factor as a weighting mechanism.
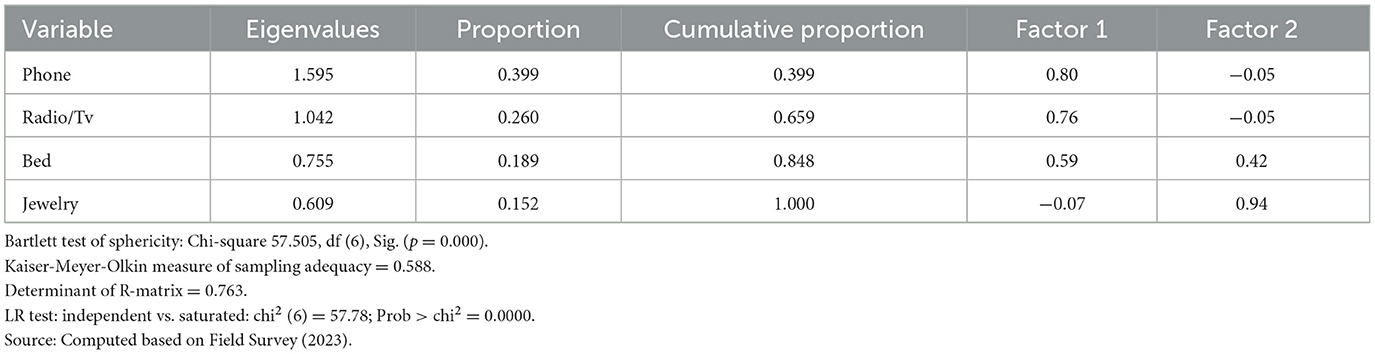
Table 9. Eigenvalue and factor loadings of wealth index.
The agricultural wealth index is estimated using variables such as ax, plow, sickle, “mofer,” and generator/water pumps. In this analysis, only one factor is retained, as its eigenvalue exceeds one. This factor explains 68% of the total variation, making it suitable for representing the underlying dimension. All necessary statistical requirements for a robust factor analysis model are met (refer to Table 10).
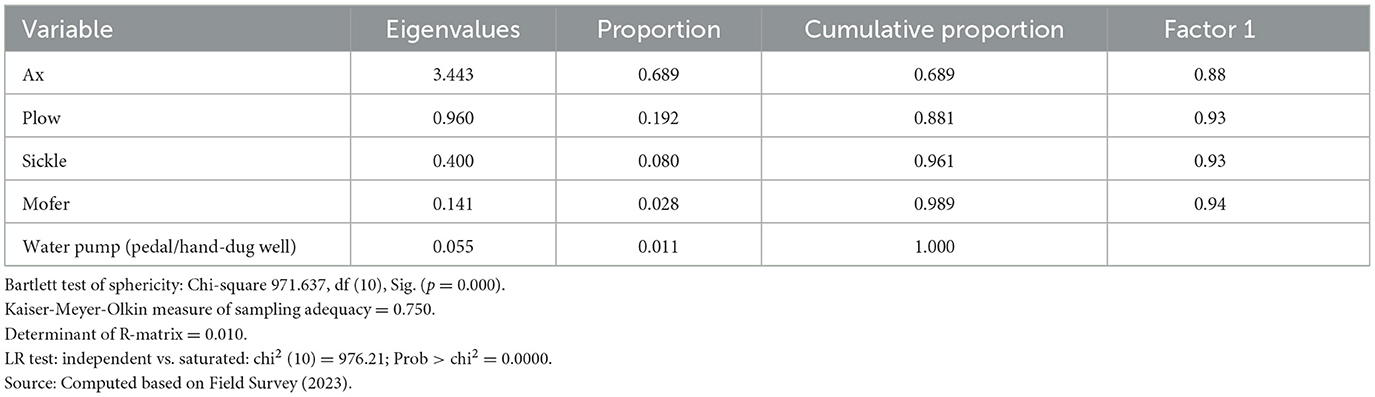
Table 10. Eigenvalue and factor loading of agricultural wealth index.
Furthermore, except for the generator/water pump, all agricultural tools exhibit higher loadings. This indicates that these variables are the most important ones for estimating the agricultural wealth index (see Table 10).
The asset pillar of resilience is estimated as follows: One factor is retained, explaining ~63% of the total variation, making it acceptable for estimating the latent variable asset (refer to Table 11). Variables such as the agricultural wealth index, total land size per capita, and total livestock units per capita exhibit high correlations with the latent variable asset, with positive loading signs as expected (see Table 11). Landholding size per capita followed by total livestock units (TLU) exhibit the highest loadings and have the strongest correlation with asset.
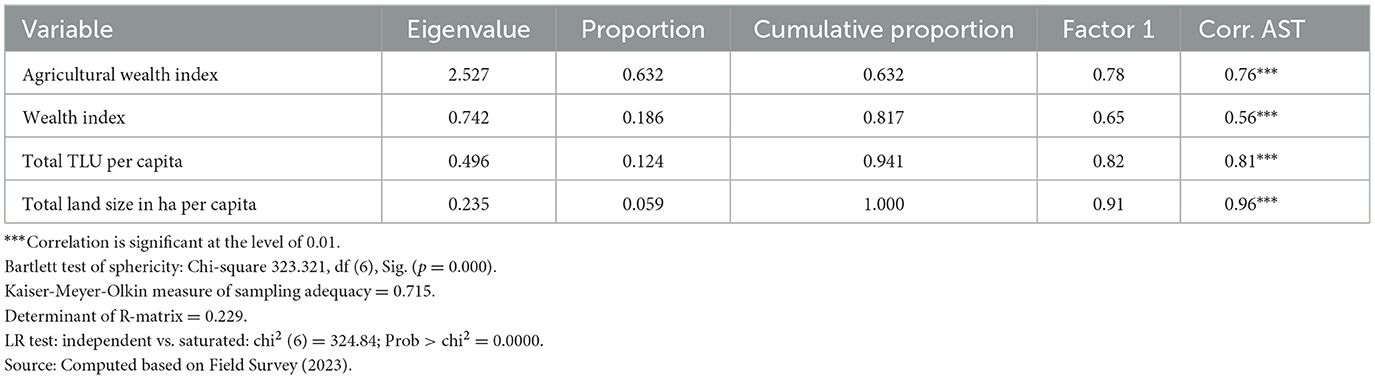
Table 11. Eigenvalue and factor loadings for assets.
The third pillar of household resilience capacity is ABS, which is estimated using variables including the availability of market and credit services in their kebele, availability of telecom network in their home, road access, accessibility of irrigation and extension services, and average distance to the district town. Three factors are retained, collectively explaining around 60% of the total variation, indicating satisfactory adherence to statistical requirements (refer to Table 12). As depicted in Table 12, the first three variables—availability of market in their kebele, road access, and distance to the district town—are associated with factor one, while accessibility to credit and extension services is associated with factor two. The remaining variables are correlated with factor three, with the availability of a telecom network in their home and accessibility of irrigation associated with this factor. Subsequently, the combined factor score of the three factors is utilized to estimate the latent variable ABS. This is achieved by employing the relative variance explained by each factor as a weighting mechanism. Ultimately, access to basic services for each household represents the weighted sum of its scores on each of the three factors.
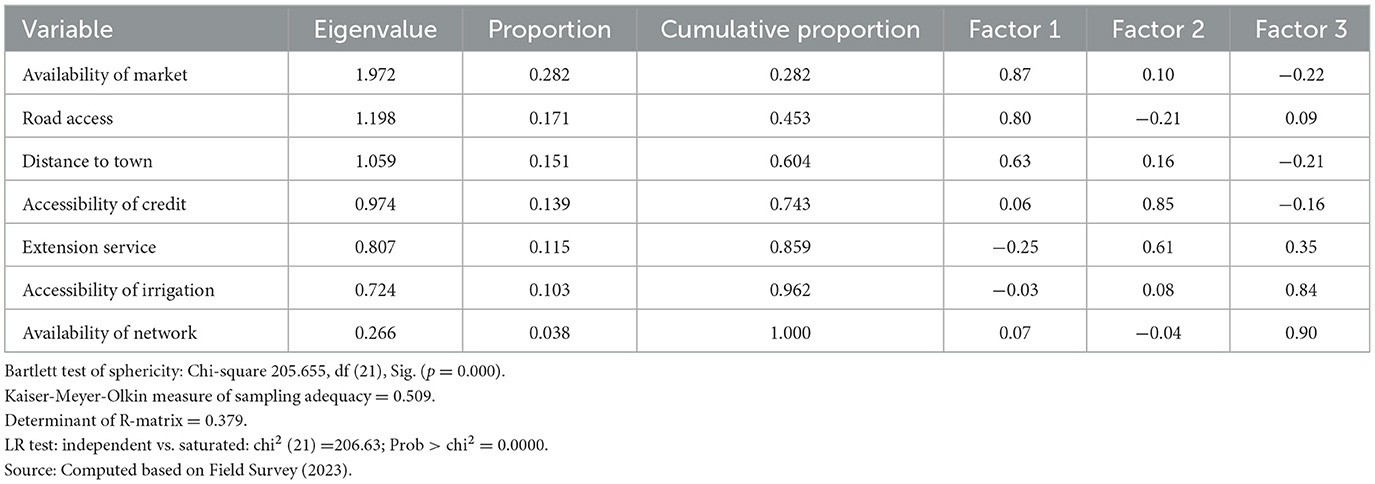
Table 12. Eigenvalue and factor loadings for access to basic service.
The fourth dimension of resilience, the SSN, is estimated using proxy variables representing formal and informal transfers received from different sources. The results indicate that the social safety net index exhibits a higher correlation with both formal and informal transfers, although the correlations with informal transfers are slightly higher compared to formal transfers (Table 13).
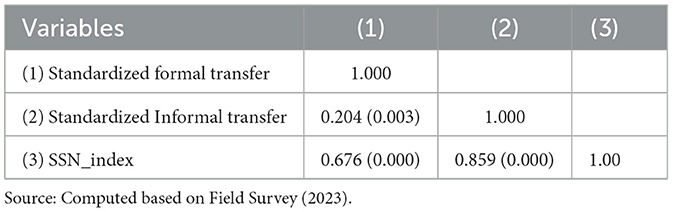
Table 13. Correlations of a social safety net with its indicator.
The latent variables derived in the previous section are utilized to compute the resilience capacity index, following the same procedures applied in the first step of factor analysis. All statistical prerequisites are met, as indicated in Table 14. As shown in Table 14, the asset pillar followed by the adaptive capacity pillar of resilience demonstrates positive and significantly higher loadings (>0.364), with strong correlations with the resilience capacity index. The correlation coefficients are 0.91 and 0.86, respectively, and are significant at the 0.01 level. The findings from the second stage of factor analysis underscore the significant reliance of household resilience on asset components, closely followed by adaptive capacity.
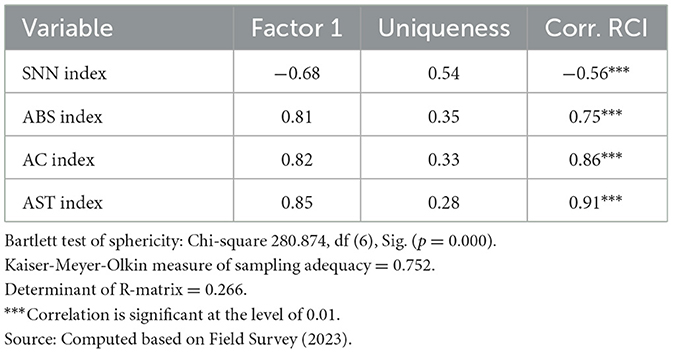
Table 14. Factor loadings value of resilience pillars.
The mean household resilience index of the household is 0.555. Using the mean as a threshold, around 63% of the respondents in this study are categorized as less resilient (Table 15). The result showed that most households (63.4%) are less resilient.
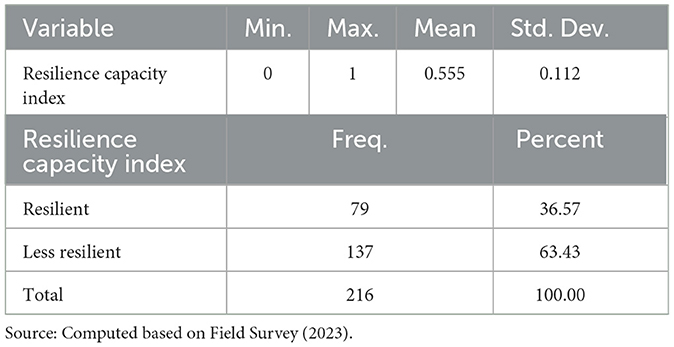
Table 15. Resilience vs. non-resilient households in the study district.
The study indicated that households in the study district engage in the production of diverse crops, own oxen and milking cows, and earn income from various sources, significantly enhancing their adaptive capacity to withstand food insecurity shocks. By diversifying their agricultural activities and income streams, these households can be equipped to cope with and recover from adverse conditions, thereby ensuring greater food security and stability. This is because crop diversification reduces risk, enhances resilience, improves soil health, manages pests, provides stable income, supports biodiversity, and ensures nutritional security. This finding is supported by focus group discussants and aligns with a study by Birthal and Hazrana (2019), which noted that producing diverse crops is an effective mechanism for farmers to adapt to climate shocks in India.
Likewise, owning oxen and milky cows exhibit higher and positive loadings, particularly associated with factors one and two, respectively. This aligns with expectations, indicating that an increase in oxen and milky cow ownership contributes to enhanced resilience capacity among rural households. This finding is consistent with previous research conducted by Tefera et al. (2017), which highlights the benefits of owning milky cows and oxen in facilitating investment in insurance or resilient farming practices, enhancing farm production and income generation, and consequently boosting savings and investment in self-insurance.
Notably, the livestock diversification index and income diversification index exhibit positive and significant loadings to adaptive capacity. Diversifying income sources and livestock in the study area enhances resilience by spreading risk, providing financial stability, and improving adaptability and recovery in the face of food insecurity shocks. This finding aligns with previous research conducted by Chamdimba et al. (2021) and Tefera et al. (2017), which highlight that resilient households tend to own a greater variety of livestock and have multiple sources of income, contributing to their resilience. Moreover, households with diverse income sources are better equipped to mitigate risks, as observed by Wan et al. (2016). Likewise, the literacy rate has a high correlation with adaptive capacity. This is because literate household heads enhance adaptive capacity by improving access to information, resources, and decision-making skills, which enable more effective responses to shocks and stressors. This result is in line with a study by Yoade et al. (2018), Households without formal education are more susceptible to food insecurity.
The presence of phones, along with access to radios and televisions, is identified as the most important factor in determining the wealth index of rural households. These assets play a vital role in enhancing household resilience to food insecurity by providing access to valuable information regarding agricultural inputs and market conditions. Furthermore, except for the generator/water pump, all agricultural tools exhibit higher loadings. This indicates that these variables are the most important ones for estimating the agricultural wealth index. Among these variables, landholding size per capita and total livestock units (TLU) exhibit the highest loading and strongest correlation with the asset. This suggests that these variables are pivotal underlying factors for estimating the resilience pillar of assets. This finding is consistent with previous research by Chamdimba et al. (2021), who found that higher levels of resilience were associated with greater land availability per adult equivalent. Similarly, Mendola and Simtowe (2015) observed a positive relationship between landholdings and wellbeing outcomes such as food security and income. Moreover, TLU also demonstrates a significant role in enhancing the asset component of resilience.
Focus group discussants highlighted that owning a large number of animals is crucial for building assets, reducing vulnerability, and enhancing resilience by providing essential economic resources, income stability, and support for agricultural productivity. This result is consistent with Kebede et al. (2016) and Tefera et al. (2017) and those authors highlighted that assets are very important to enhance household resilience. Weldegebriel and Amphune (2017), further support this notion, stating that households possessing a higher number of animals tend to exhibit greater resilience and use these animals as a buffer stock. The focus group discussants and key informants emphasized the critical importance of land in their locality, asserting that every activity is highly dependent on it. They suggested that households with more plots of land per capita can engage in commercial crop production activities. This sentiment resonates with findings from other researchers, such as Koo et al. (2019), who highlight the pivotal role of land in economies, particularly in agricultural communities. In this study district, land is identified as the primary productive asset crucial for food production, sustenance, and the livelihoods of households and their families.
Upon analyzing the overall significance proxy indicators of ABS, it is noted that the availability of a telecom network near the market exhibits the highest loading. This underscores its importance in enhancing households' ability to access updated information about potential shocks and take proactive measures before they occur. This finding aligns with research by Kebede et al. (2016), who observed that household access to telecom networks enables them to obtain reliable information on agricultural input costs, empowering them to make informed decisions and mitigate potential risks. Furthermore, the availability of the market in their kebele also exhibits the second-highest loading in the estimations of access to basic service pillars of resilience. The presence of a market in their kebele enables households to promptly exchange their perishable agricultural products upon production. Supporting this notion, focus group discussions, especially in the Tana Zuria rice livelihood zone (Shina Tsion kebele), highlighted that improved market access can boost morale for producing perishable cash crops like onions, tomatoes, and potatoes. This finding aligns with research by Tefera et al. (2017), which suggests that better market access can influence how households plan their efforts and investment choices. Therefore, responsible bodies must invest in enhancing these attributes to bolster household resilience.
The results indicate that the social safety net index exhibits a higher correlation with both formal and informal transfers, although the correlations with informal transfers are slightly higher compared to formal transfers. The high correlation between both formal and informal transfers with the social safety net is attributed to the poverty levels in the districts, where households are targeted by the productive safety net program. Additionally, because of their financial hardship, these households receive informal support from friends and relatives in other areas, such as cities or abroad, as noted by the focus group participants. This is because households with better characteristics, such as land, diversified income sources, livestock, etc., are not eligible for formal safety net programs provided by the government or NGOs. When the facts from the focus group discussions and key informant interviews were verified, it was found that people benefiting from the safety net programs are very poor and landless. As a result, it has been stated that some individuals may reduce their fixed assets to qualify for the productive safety net program. Given this, it is appropriate to observe a negative correlation between safety net participation and other resilience pillars, confirming the accuracy of the survey results. This finding aligns with Hailu and Amare (2022) and Abdulahi et al. (2024), which state that households receiving formal or informal assistance are generally economically vulnerable, targeted by social safety net programs, from rural or marginalized communities, facing crises, or low-income urban families. However, this study does not indicate that the PSNP is unnecessary for all households in the study area. Some households can be fully eligible to benefit from PSNP. Therefore, high attention should be given to accurately identifying the beneficiary and non-beneficiary households in the study districts.
The asset pillar, along with the adaptive capacity pillar of resilience, shows significantly higher positive loadings and strong correlations with the resilience capacity index. The correlation coefficients are 0.91 and 0.86, respectively, both significant at the 0.01 level. This underscores the substantial contribution of these two dimensions to the estimation of the household resilience capacity index. They are found to have considerable substantive importance in enhancing household resilience, with the asset component playing a particularly significant role. This finding is consistent with previous research conducted by Chamdimba et al. (2021), which suggests that higher household asset ownership correlates with greater resilience levels. Additionally, Lokosang et al. (2014), assert that wealth and its proxies contribute to enhancing resilience to food insecurity. The findings draw attention to the estimations of adaptive capacity and assets in the results sections. In the estimation of adaptive capacity, variables such as the income diversification index and livestock diversification index demonstrate higher loadings. Conversely, under the asset pillar, all variables exhibit loadings exceeding 0.364, signifying high statistical significance.
This aligns with a study conducted by Ngesa et al. (2020), which observed higher loadings related to asset possession and adaptive capacity, highlighting their crucial roles in estimating household resilience in Kenya. Additionally, Dhraief et al. (2019) also noted a positive correlation between adaptive capacity and resilience. These findings underscore the importance of considering both adaptive capacity and asset possession as key determinants of household resilience. They highlight the multifaceted nature of resilience, suggesting that a combination of factors, including income and livestock diversification, as well as asset ownership, contribute significantly to households' overall resilience levels. Furthermore, access to basic services constitutes the third pillar of resilience and demonstrates a strong positive and significant loading, along with a higher correlation between rural household resilience to food insecurity. With a loading value of 0.807, well above the threshold of 0.364, access to basic services emerges as a crucial determinant of household resilience. Investing in basic services such as market access, credit services, and road infrastructure can significantly enhance household resilience. Improved access to basic services motivates households to strengthen their resilience capacities, as they are better equipped to respond to challenges and uncertainties.
These findings resonate with the observations of Chamdimba et al. (2021), who noted a positive and significant relationship between access to basic services and resilience. They emphasized the importance of infrastructure and institutions in supporting livelihoods, asserting that better access to basic services enhances wellbeing outcomes and boosts the resilience status of households. Moreover, this perspective aligns with the views of developmental agents in the study area, who emphasize the positive impacts of improved access to basic services such as markets and roads. Enhanced access facilitates increased productivity and timely exchange of products at fair prices, thereby motivating producers to enhance their output. This activation of producer morale leads to increased production, further reinforcing household resilience.
The social safety net index exhibits a strong negative loading (−0.68) with resilience, a significant result given its absolute value exceeding 0.364. This finding suggests that the social safety net increases as household impoverishment intensifies. This result contradicts findings from studies such as Ngesa et al. (2020), which emphasized the pivotal role of the social safety net, among other pillars, in enhancing household resilience in Mieso district, Ethiopia. However, this study is not unique in encountering such anomalous results. Authors like Atara et al. (2020) have observed similar outcomes. They suggest that participation in social safety net programs may come at the expense of other resilience-building mechanisms, and it may not contribute to the accumulation or protection of resources and assets. These findings raise questions about the effectiveness of social safety net programs in boosting household resilience and highlight the need for further investigation into the dynamics between social safety nets and other resilience pillars. The insights provided by a key informant from Ginaza-Silkisa shed light on the challenges faced by households participating in the Productive Safety Net Program (PSNP). These households may hesitate to invest in permanent assets due to concerns about graduation from the program. However, the inability to acquire productive assets, particularly oxen, limits their future production potential. Additionally, such households face exacerbated difficulties during seasons of increased costs.
Finally, 63% of respondents in this study are identified as less resilient, indicating that a significant portion of participants lack resilience. Given the expectations or assumptions about the participants' adaptive capacities, the finding that most of them are not resilient is unexpected and noteworthy. This classification provides a basis for further analysis and targeted interventions to improve household resilience. Therefore, the concerned authorities need to give significant attention to ensuring the household's food security. To build resilience in the study district, governments, NGOs, or other organizations should invest in the resilience pillars with higher loadings, as these will most effectively improve household resilience. This strategy will save time, energy, and resources by focusing on the most impactful areas for investment, as identified by this study.
While the findings of this study are specific to the Libo Kemkem district, the resilience pillars identified—adaptive capacity, access to basic services, social safety nets, and asset ownership—are broadly applicable to other regions facing similar challenges. These pillars can guide resilience-building policies in diverse contexts. For example, enhancing adaptive capacity through climate-smart agricultural practices, improving access to basic services such as healthcare and education, expanding social safety nets to protect vulnerable populations, and promoting asset accumulation through microfinance initiatives are key strategies that can be adopted in other areas. These findings underscore the importance of integrating local context into policy design while offering actionable steps that can improve resilience in regions confronting food insecurity and climate risks. Therefore, to enhance the asset base and adaptive capacity, the study suggests promoting income diversification through access to microfinance and supporting ownership of productive assets like dairy cows and oxen. Additionally, improving telecom networks and market accessibility can further strengthen household resilience.
This study consolidates the various pillars of resilience capacity into a unified measure known as the rural household resilience capacity index. Through a two-stage factor analysis, the four pillars of resilience, along with the overall resilience capacity index, were estimated. The results of the factor analysis reveal that, on average, rural households possess a resilience capacity index of 0.555, with ~63% of households classified as less resilient. Asset ownership, adaptive capacity, and access to basic services demonstrate positive associations with household resilience capacity. Each factor exhibits a significant loading of 0.85, 0.82, and 0.81, respectively. These loadings surpass the recommended threshold of 0.364 for a sample size of 200 or more, indicating their substantive importance.
Moreover, these pillars display high correlations with resilience capacity, with asset, adaptive capacity, and access to basic services showing correlations of 0.91, 0.86, and 0.75, respectively, all with a p-value of 0.000. The variables with higher loadings signify greater importance and warrant increased attention. Therefore, policymakers should prioritize these variables when designing policies aimed at enhancing household resilience. By focusing on pillars with the highest loadings, policymakers can develop targeted interventions that address the most critical aspects of household resilience effectively.
Conversely, the social safety net pillar displays a negative loading of −0.68 and is negatively correlated with resilience, with a correlation coefficient of −0.56 and a p-value of 0.000. This suggests that the social safety net pillar of resilience increases as households experience poverty, yet it does not guarantee asset protection or enhance resilience. In contrast, asset ownership, adaptive capacity, and access to vital services emerge as pivotal factors in bolstering household resilience capacity in this district. To improve the resilience capacity of the least resilient households, it is imperative to prioritize asset protection, maintain adaptive capacity, and expand access to essential services. Specifically, efforts should focus on safeguarding assets, fostering adaptive capabilities, and extending basic services, particularly to those identified as less resilient.
Concerning the Productive Safety Net Program (PSNP), the government must assess how it is perceived and understood by the beneficiaries. By gaining insights into community perceptions and understanding, policymakers can ensure that the PSNP effectively addresses the needs and challenges faced by households, ultimately contributing to the enhancement of household resilience. The key limitation of this research is that it relies on cross-sectional data, which only provides a snapshot of rural household resilience to food insecurity at one point in time. This approach doesn't reveal how resilience changes before and after a shock. To gain a deeper understanding of resilience dynamics, future research should use time-series data to track these changes over time.
In conclusion, to enhance resilience in such contexts, concrete policy steps should be considered, including strengthening adaptive capacity through the adoption of income-generating climate-smart activities, improving access to essential services like healthcare and education, reducing vulnerability, and fostering asset accumulation through initiatives such as microfinance and savings programs. These actions would not only support resilience in the Libo Kemkem district but also provide a framework for other regions dealing with comparable issues.
The study's primary limitation lies in its local scope, which, while highly valuable for regional policymakers, limits the generalizability of the findings to other contexts. To address this limitation, future research could expand the geographic scope or conduct comparative studies across different regions to assess the broader applicability of the results. Additionally, we recognize that the reliance on cross-sectional data restricts our ability to analyze temporal changes in resilience. Future studies utilizing longitudinal data would provide deeper insights into how resilience evolves over time and the long-term effects of interventions. These directions for future research would enhance our understanding of resilience dynamics and contribute to more robust, contextually relevant policymaking.
The original contributions presented in the study are included in the article/supplementary material, further inquiries can be directed to the corresponding author.
Ethical review and approval was not required for the study on human participants in accordance with the local legislation and institutional requirements. Written informed consent was obtained from the patients/participants or patients/participants legal guardian/next of kin to participate in this study, and for the publication of any potentially identifiable images or data included in this article, in accordance with the national legislation and the institutional requirements.
MA: Conceptualization, Data curation, Formal analysis, Methodology, Writing – original draft, Writing – review & editing.
The author(s) declare that no financial support was received for the research, authorship, and/or publication of this article.
The author(s) declare that no Gen AI was used in the creation of this manuscript.
The author declares that the research was conducted in the absence of any commercial or financial relationships that could be construed as a potential conflict of interest.
All claims expressed in this article are solely those of the authors and do not necessarily represent those of their affiliated organizations, or those of the publisher, the editors and the reviewers. Any product that may be evaluated in this article, or claim that may be made by its manufacturer, is not guaranteed or endorsed by the publisher.
1. ^Pillars refers to the key dimensions or components that collectively determine or measure resilience.
2. ^Kebele is the smallest administrative unit in Ethiopia.
Abdulahi, S. M., Feyisa, H. L., and Ayen, D. D. (2024). Impact of urban productive safety net programme on poverty reduction and food security: evidence from major cities of Eastern Ethiopia (Dire Dawa, Harar and Jigjiga). Food Energy Secur. 13:e535. doi: 10.1002/fes3.535
Abebaw, S., and Betru, T. (2019). A review on status and determinants of household food security in Ethiopia. Ethiop. J. Environ. Stud. Manage. 12, 497–508. Available at: https://ejesm.org/doi/v12i5.2
Abebe, M. G. (2024). Impacts of urbanization on food security in Ethiopia. A review with empirical evidence. J. Agric. Food Res. 15:100997. doi: 10.1016/j.jafr.2024.100997
Addisu, Y. (2015). Food insecurity and its determinants in households of Ethiopia: the case of Libo Kemkem district, Amhara national regional state. Food Sci. Qual. Manage. 41, 95–101.
Africa Development Bank (2014). Africa Food Security Brief: Special Focus on Climate Africa Food Security Change Impacts (Issue 5). Statistics Department, Chief Economist Complex. Retrieved from https://www.afdb.org
Ahsan, M. N., and Takeuchi, K. (2015). Retracted article: The dynamics among poverty, vulnerability, and resilience: evidence from coastal Bangladesh. Nat. Hazards 79, 2123–2123. doi: 10.1007/s11069-015-1950-0
Aklilu, E., Gebresilassie, A., Yared, S., Kindu, M., Tekie, H., Balkew, M., et al. (2017). Studies on sand fly fauna and ecological analysis of Phlebotomus orientalis in the highland and lowland foci of kala-azar in northwestern Ethiopia. PLoS ONE 12:e0175308. doi: 10.1371/journal.pone.0175308
Alinovi, L., Mane, E., and Romano, D. (2010). “Measuring household resilience to food insecurity: application to Palestinian households,” in Agricultural Survey Methods (John Wiley & Sons, Ltd.), 341–368. doi: 10.1002/9780470665480.ch21
Ansah, I. G. K., Gardebroek, C., and Ihle, R. (2019). Resilience and household food security: a review of concepts, methodological approaches and empirical evidence. Food Secur. 11, 1187–1203. doi: 10.1007/s12571-019-00968-1
Aragie, T., and Genanu, S. (2017). Level and determinants of food security in North Wollo zone (Amhara region–Ethiopia). J. Food Secur. 5, 232–247. doi: 10.12691/jfs-5-6-4
Assefa Tofu, D., and Wolka, K. (2023). Transforming food insecure farmers from climate variability and land degradation susceptibility to resilient livelihoods. Res. Global. 7:9. doi: 10.1016/j.resglo.2023.100168
Atara, A., Tolossa, D., and Denu, B. (2020). Analysis of rural households' resilience to food insecurity: does livelihood systems/choice/matter? The case of Boricha woreda of Sidama zone in southern Ethiopia. Environ. Dev. 35:100530. doi: 10.1016/j.envdev.2020.100530
Bahiru, A., Senapathy, M., and Bojago, E. (2023). Status of household food security, its determinants, and coping strategies in the Humbo district, southern Ethiopia. J. Agric. Food Res. 11:100461. doi: 10.1016/j.jafr.2022.100461
Balasundaram, N. (2009). Factor analysis: nature, mechanism and uses in social and management science research. J. Cost Manage. Account. Bangl. 37, 15–25.
Becker, C. B., Middlemass, K., Taylor, B., Johnson, C., and Gomez, F. (2017). Food insecurity and eating disorder pathology. Int. J. Eat. Disord. 50, 1031–1040. doi: 10.1002/eat.22735
Béné, C., Headey, D., Haddad, L., and von Grebmer, K. (2016). Is resilience a useful concept in the context of food security and nutrition programmes? Some conceptual and practical considerations. Food Secur. 8, 123–138. doi: 10.1007/s12571-015-0526-x
Beyene, F., Senapathy, M., Bojago, E., and Tadiwos, T. (2023). Rural household resilience to food insecurity and its determinants: Damot Pulasa district, southern Ethiopia. J. Agric. Food Res. 11:100500. doi: 10.1016/j.jafr.2023.100500
Birthal, P. S., and Hazrana, J. (2019). Crop diversification and resilience of agriculture to climatic shocks: evidence from India. Agric. Syst. 173, 345–354. doi: 10.1016/j.agsy.2019.03.005
Bollen, K. A. (2002). Latent variables in psychology and the social sciences. Annu. Rev. Psychol. 53, 605–634. doi: 10.1146/annurev.psych.53.100901.135239
Chamdimba, O. Y., Ortmann, G. F., and Wale, E. (2021). Resilience to shocks and food insecurity: determinants, and the impact of smallholder Jatropha curcas cultivation in southern Malawi. Afr. J. Sci. Technol. Innov. Dev. 13, 619–633. doi: 10.1080/20421338.2020.1774962
Ciani, F., and Romano, D. (2014). “Testing for household resilience to food insecurity: evidence from Nicaragua,” in 2014 International Congress, August 26–29, 2014, Ljubljana, Slovenia. Department of Economics and Management, University of Florence.
Constas, M., Frankenberger, T., and Hoddinott, J. (2014). Resilience Measurement Principles: Toward an Agenda for Measurement Design. Food Security Information Network, Resilience Measurement Technical Working Group, Technical Series 1. Food and Agriculture Organization of the United Nations.
Creswell, J. W., and Creswell, J. D. (2017). Research Design: Qualitative, Quantitative, and Mixed Methods Approaches. Thousand Oaks, CA: Sage Publications.
Demeke, M., and Tefera, N. (2013). Sustainable Resilience for Food and Nutrition Security: The Case of Farming Rural Households in Ethiopia. Rome: Agricultural Development and Economics Division (ESA), Food and Agricultural Organization (FAO), 1–32.
Demelash, W. A., and Birri, D. J. (2019). Knowledge, attitude and practices related to visceral leishmaniasis and its trend in Libo Kem Kem Wereda, Northwest Ethiopia: a cross-sectional and retrospective study. Therapy 4, 23–28. doi: 10.11648/j.ijidt.20190402.12
Demissie, B. S., and Kasie, T. A. (2017). Rural households' vulnerability to poverty in Ethiopia. J. Poverty 21, 528–542. doi: 10.1080/10875549.2017.1348425
d'Errico, M., and Di Giuseppe, S. (2018). Resilience mobility in Uganda: a dynamic analysis. World Dev. 104, 78–96. doi: 10.1016/j.worlddev.2017.11.020
Dhraief, M. Z., Dhehibi, B., Daly Hassen, H., Zlaoui, M., Khatoui, C., Jemni, S., et al. (2019). Livelihoods strategies and household resilience to food insecurity: a case study from rural Tunisia. Sustainability 11:907. doi: 10.3390/su11030907
Elzaki, R. M. (2023). Challenges of food security in the Gulf Cooperation Council countries: an empirical analysis of fixed and random effects. Agric. Resour. Econ. Int. Sci. E-J. 9, 44–68. doi: 10.51599/are.2023.09.01.03
Engidaw, M. T., and Gebremariam, A. D. (2020). The effect of productive SafetyNet program on wasting among under-five children in the rural community of South Gondar Zone, Northwest Ethiopia. Arch. Public Health 78, 1–9. doi: 10.1186/s13690-020-00481-4
Food and Agricultural Organization (2016). Analysing Resilience for Better Targeting and Action: Resilience Index Measurement and Analysis - II (RIMA-II) (Rome).
Gambo Boukary, A., Diaw, A., and Wünscher, T. (2016). Factors affecting rural households' resilience to food insecurity in Niger. Sustainability 8:181. doi: 10.3390/su8030181
Geberselassie, S. B., Abebe, S. M., Melsew, Y. A., Mutuku, S. M., and Wassie, M. M. (2018). Prevalence of stunting and its associated factors among children 6-59 months of age in Libo-Kemekem district, Northwest Ethiopia; A community based cross sectional study. PLoS ONE 13:e0195361. doi: 10.1371/journal.pone.0195361
Getaneh, Y., Alemu, A., Ganewo, Z., and Haile, A. (2022). Food security status and determinants in North-Eastern rift valley of Ethiopia. J. Agric. Food Res. 8:100290. doi: 10.1016/j.jafr.2022.100290
Hailu, A. G., and Amare, Z. Y. (2022). Impact of productive safety net program on food security of beneficiary households in western Ethiopia: a matching estimator approach. PLoS ONE 17:e0260817. doi: 10.1371/journal.pone.0260817
Kaiser, H. H. (1960). The application of electronic computers to factor analysis. Educ. Psychol. Meas. 20, 141–151. doi: 10.1177/001316446002000116
Kashay, S., and Mulugeta, M. (2014). Determinants of rural households' food security in Laelay Maichew woreda Tigray region, Ethiopia. Afr. J. Agric. Food Secur. 2, 106–112.
Kasie, T., Agrandio, A., Adgo, E., and Garcia, I. (2017). Household resilience to food insecurity: shock exposure, livelihood strategies and risk response options: the case of Tach-Gayint District, Amhara Region, Ethiopia (PhD thesis). University of Jaume I, Castellón de la Plana, Spain.
Kebede, T., Haji, J., Legesse, B., and Mammo, G. (2016). Econometric analysis of rural households' resilience to food insecurity in West Shoa, Ethiopia. J. Food Secur. 4, 58–67. doi: 10.12691/jfs-4-3-2
Kiran, R., and Jabbar, A. (2022). Policy-oriented food insecurity estimation and mapping at district level in Pakistan. Agric. Resour. Econ. Int. Sci. E-J. 8, 33–65. doi: 10.51599/are.2022.08.04.02
Koo, J., Thurlow, J., ElDidi, H., Ringler, C., and De Pinto, A. (2019). Building Resilience to Climate Shocks in Ethiopia. Washington, DC: International Food Policy Research Institute.
Kwaw-Nimeson, E., and Tian, Z. (2021). The impact of agricultural producer price on sustainable food security in Africa–a system GMM approach. Agric. Resour. Econ. Int. Sci. E-J. 7, 60–76. doi: 10.51599/are.2021.07.03.04
Ladaninezhad, M., Mohammadi, H., Esmaillzadeh, A., Pouraram, H., and Mohaghegh, M. (2023). Measuring household resilience to food insecurity among Iranian teachers in disasters and crises. Front. Sustain. Food Syst. 7:1174459. doi: 10.3389/fsufs.2023.1174459
Le, T.-H., Chuc, A. T., and Taghizadeh-Hesary, F. (2019). Financial inclusion and its impact on financial efficiency and sustainability: empirical evidence from Asia. Borsa Istanbul Rev. 19, 310–322. doi: 10.1016/j.bir.2019.07.002
Lokosang, L., Ramroop, S., and Zewotir, T. (2014). Indexing household resilience to food insecurity shocks: the case of South Sudan. Agrekon 53, 137–159. doi: 10.1080/03031853.2014.915486
LWoFS (2018). Libokemkem Woreda Office of Food Security. Report on Productive Safety Net Program. Libo-kemkem, Ethiopia.
Megabia, T. T., Amare, Z. Y., and Asmare, A. M. (2022). Rural household perception and adaptation strategies to climate change and variability: in the case of Libo-kemkem Woreda, Ethiopia. Environ. Syst. Res. 11:23. doi: 10.1186/s40068-022-00270-8
Melketo, T., Schmidt, M., Bonatti, M., Sieber, S., Müller, K., and Lana, M. (2021). Determinants of pastoral household resilience to food insecurity in Afar region, Northeast Ethiopia. J. Arid Environ. 188:104454. doi: 10.1016/j.jaridenv.2021.104454
Mendola, M., and Simtowe, F. (2015). The welfare impact of land redistribution: evidence from a quasi-experimental initiative in Malawi. World Dev. 72, 53–69. doi: 10.1016/j.worlddev.2015.02.010
Mengistu, M. Y. (2019). Impact of institutional credit on crop productivity in Kemkem Woreda, Ethiopia. Ethiop. J. Business Manage. Econ. 2, 34–34.
Mitiku, K. (2012). A neglected old disease in a new focus: epidemic of visceral leishmaniasis. Ethiop. J. Pediatr. Child Health 8, 27–38.
Monserrath, X., and Lascano, G. (2020). AES prize essay resilience to food insecurity: theory and empirical evidence from international food assistance in Malawi. J. Agric. Econ. 71, 936–961. doi: 10.1111/1477-9552.12397
Myeki, V. A., and Bahta, Y. T. (2021). Determinants of smallholder livestock farmers' household resilience to food insecurity in South Africa. Climate 9:117. doi: 10.3390/cli9070117
Naing, L., Winn, T., and Rusli, B. (2006). Practical issues in calculating the sample size for prevalence studies. Arch. Orofac. Sci. 1, 9–14.
Neglo, K. A. W., Gebrekidan, T., and Lyu, K. (2021). The role of agriculture and non-farm economy in addressing food insecurity in Ethiopia: a review. Sustainability 13:3874. doi: 10.3390/su13073874
Ngesa, O., Grey, S., Duveskog, D., and Atieno, I. (2020). “Characteristics and determinants of the resilience of smallholder farmers: lessons from application of the RIMA II methodology in eastern Africa,” in Handbook of Climate Change Management: Research, Leadership, Transformation, eds. J. M. Luetz and D. Ayal (Cham: Springer), 1–23.
Ojo, I. O. (2019). Ologit analysis of determinants of vulnerability to food insecurity by cocoa farming households in southern Asunafo, Republic of Ghana. Agric. Resour. Econ. Int. Sci. E-J. 5, 31–46.
Sisha, T. A. (2020). Household level food insecurity assessment: evidence from panel data, Ethiopia. Sci. Afr. 7:e00262. doi: 10.1016/j.sciaf.2019.e00262
Sisheber, B., Fente, D., Adgo, E., and Nyssen, J. (2015). “Regional geography of Dek Island, Lake Tana, Ethiopia,” in Paper Presented at the TropiLakes 2015: Tropical Lakes in a Changing Environment: Water, Land, Biology, Climate and Humans: Excursion Guide Mid-conference Excursion.
Tadesse, S. (2019). The Role and Challenges of World Vision Ethiopia in Children's Empowerment in Libokemkem Wereda South Gondar Zone, Amhara Region.
Tefera, N., Demeke, M., and Kayitakire, F. (2017). Building Sustainable Resilience for Food Security and Livelihood Dynamics: The Case of Rural Farming Households in Ethiopia. Ispra: European Commission.
Tesso, G., Emana, B., and Ketema, M. (2012). Analysis of vulnerability and resilience to climate change induced shocks in North Shewa, Ethiopia. Agric. Sci. 3:871. doi: 10.4236/as.2012.36106
Tsang, S., Royse, C. F., and Terkawi, A. S. (2017). Guidelines for developing, translating, and validating a questionnaire in perioperative and pain medicine. Saudi J. Anaesth. 11(Suppl. 1):S80. doi: 10.4103/sja.SJA_203_17
Von Grebmer, K., Headey, D., Bene, C., Haddad, L., Olofinbiyi, T., Wiesmann, D., et al. (2013). 2013 Global Hunger Index: The Challenge of Hunger: Building Resilience to Achieve Food and Nutrition Security, Vol. 79. Washington, DC: International Food Policy Research Institute.
Wan, J., Li, R., Wang, W., Liu, Z., and Chen, B. (2016). Income diversification: a strategy for rural region risk management. Sustainability 8:1064. doi: 10.3390/su8101064
Weldegebriel, Z. B., and Amphune, B. E. (2017). Livelihood resilience in the face of recurring floods: an empirical evidence from Northwest Ethiopia. Geoenviron. Disast. 4, 1–19. doi: 10.1186/s40677-017-0074-0
Weldegiargis, A. W., Abebe, H. T., Abraha, H. E., Abrha, M. M., Tesfay, T. B., Belay, R. E., et al. (2023). Armed conflict and household food insecurity: evidence from war-torn Tigray, Ethiopia. Confl. Health 17:22. doi: 10.1186/s13031-023-00520-1
Welderufael, M. (2015). Analysis of households vulnerability and food insecurity in Amhara regional state of Ethiopia: using value at risk analysis. Ethiop. J. Econ. 23, 37–78.
Wu, H.-S. (2018). “Introduction to factor analysis,” in Paper Presented at the Centre of Family and Demographic Research, CFDR Workshop Series.
Keywords: community adaptation, factor analysis, food insecurity, indigenous knowledge, Libo Kemkem, livelihood zone, resilience
Citation: Abebe MG (2025) Strengthening household resilience for enhanced food security in northwestern Ethiopia: insights from resilience pillars. Front. Sustain. Food Syst. 9:1528346. doi: 10.3389/fsufs.2025.1528346
Received: 14 November 2024; Accepted: 16 January 2025;
Published: 26 February 2025.
Edited by:
Pradeep K. Dubey, International Rice Research Institute South Asia Regional Centre, IndiaReviewed by:
Pradeepa Korale Gedara, University of Queensland, AustraliaCopyright © 2025 Abebe. This is an open-access article distributed under the terms of the Creative Commons Attribution License (CC BY). The use, distribution or reproduction in other forums is permitted, provided the original author(s) and the copyright owner(s) are credited and that the original publication in this journal is cited, in accordance with accepted academic practice. No use, distribution or reproduction is permitted which does not comply with these terms.
*Correspondence: Mekonen Getachew Abebe, bWVrdWdldG9AZ21haWwuY29t
Disclaimer: All claims expressed in this article are solely those of the authors and do not necessarily represent those of their affiliated organizations, or those of the publisher, the editors and the reviewers. Any product that may be evaluated in this article or claim that may be made by its manufacturer is not guaranteed or endorsed by the publisher.
Research integrity at Frontiers
Learn more about the work of our research integrity team to safeguard the quality of each article we publish.