 Ruxin Zhang1
 Zhongyi Qu
 Liping Wang
 Wei Yang
94% of researchers rate our articles as excellent or good
Learn more about the work of our research integrity team to safeguard the quality of each article we publish.
Find out more
ORIGINAL RESEARCH article
Front. Sustain. Food Syst. , 24 February 2025
Sec. Waste Management in Agroecosystems
Volume 9 - 2025 | https://doi.org/10.3389/fsufs.2025.1528044
This article is part of the Research Topic Biochar in Agroecosystems: Optimizing Soil Fertility and Crop Productivity View all 4 articles
Introduction: Biochar has been widely used under irrigation conditions because of its ability to improve agricultural soil productivity and crop yield. However, the effects of deficit irrigation biochar interactions on soil quality and underlying mechanisms remain not well understood.
Objective: This study aimed to determine whether deficit irrigation combined with biochar could interact with soil physics, chemistry, biology, and crop growth, thereby increasing the soil quality index and affecting crop yield and quality.
Methods: In this study, we conducted a 2-year experiment with differential irrigation: full irrigation (100% ETc) and deficit irrigation (60% ETc), applying three biochar doses (B0 = 0 t ha−1, B15 = 15 t ha−1, and B30 = 30 t ha−1).
Results: The results showed that the biochar and irrigation interaction significantly affected soil enzyme activities, nutrients, and microbial biomass carbon and adenosine triphosphate contents, resulting in an increase in the number of dominant taxa and α diversity index in the biochar treatment under deficit irrigation conditions. However, this treatment resulted in lower relative abundances of Acidobacteria, Chloroflexi, and Candidatus Rokubacteria. Biochar application improved sunflower kernel quality, aboveground biomass, and yield, with varying effects under different irrigation practices. Compared with the other treatments, the B30 treatment under deficit irrigation conditions exhibited the highest aboveground biomass and yield, with increases of 1.3–28.3% and 1.1–33.5%, respectively. However, an increase in arginine and proline contents in the seeds was only observed later in the experiment. In addition, the soil quality index was crucial for sunflower yield, with its positive effects varying based on the irrigation method used.
Conclusion: Biochar applied under deficit irrigation was effective in improving soil environment and soil quality in the study area, at least for the 2-year pilot study. Most importantly, biochar counteracted the adverse effects of water deficit and promoted crop seed quality and yield.
Significance: In conclusion, deficit irrigation combined with biochar application under conditions of water scarcity may be a novel approach for improving crop yield by reducing the negative effects of drought stress.
Since 1967, when the Yellow River’s water regulation achieved full coverage in the Hetao Irrigation District of Inner Mongolia, it has served as a major example of ecological management, water-saving renovation, and other agricultural intensification (Jia et al., 2017; Hang and Song, 2022; Yang et al., 2023). Although agricultural soil quality in this region has remained stable for a long time, excessive irrigation has led to significant nutrient loss and overall soil degradation. This issue is exacerbated by increasing water scarcity and competition for resources (Mounzer et al., 2013; Abdoulaye et al., 2019; Faloye et al., 2019). Thus, water scarcity is a critical constraint for sustainable agricultural production (Yang et al., 2015). The Hetao Irrigation District is an important agricultural production area, and sunflower planting plays a significant role here. During the growth cycle of sunflowers, they have unique requirements for soil nutrients and water, and their planting benefits in the Hetao area are closely associated with soil quality and irrigation conditions. In the context of water shortage, the growth of sunflowers is facing unique challenges, as the limitation of water may directly affect their physiological processes, such as photosynthesis, transpiration, and nutrient absorption. Improving soil quality, increasing water-use efficiency (WUE), and narrowing the gap between the supply and demand of freshwater resources to address both quantity and quality issues have become particularly important in the context of limited freshwater resources (Xu et al., 2018; Farhangi et al., 2021).
With rising temperatures expected to increase evapotranspiration demand (Sermons et al., 2017), deficit irrigation (DI) may become an advanced and effective water conservation technique during periods of water constraints or drought (Hale et al., 2021; Liu et al., 2022; Hou et al., 2023). In recent years, DI strategies have been effectively expanded, especially in arid and semi-arid regions (Yu et al., 2020; Asmamaw et al., 2023). DI has been shown to increase WUE while reducing irrigation water usage (Wei et al., 2018), improve fruit and crop quality (Wang et al., 2011; Sun et al., 2014), and maintain crop yield (Yu et al., 2020). However, different levels of DI strategies for different types of crops can have equally irreversible negative impacts on soil and plants. For example, using water with moderate salinity (EC between 1.1 and 1.7 dS m−1) in DI strategies can aggravate soil salinization in grape vineyards and peach and nectarine orchards, despite saving water (Aragüés et al., 2015). Similarly, transient water stress can lead to reduced yield and fruit quality in chili peppers (Fernandez et al., 2005; Mardani et al., 2017). The appropriate amount of water for DI may vary significantly depending on the soil, growing conditions, and crop variety (Agbna et al., 2017). However, long-term trials (over 12 months) and mechanistic studies are limited, leaving gaps in our understanding of how soil microorganisms contribute to crop growth under DI and their impact on plant growth-promoting communities (Hale et al., 2021).
Beyond water-saving techniques, biochar has emerged as a promising tool to enhance agroecosystem resilience to water stress and combat soil degradation (Asai et al., 2009; Mannan et al., 2016; Yan et al., 2022; Zhang et al., 2024). The structural characteristics and physicochemical properties of biochar can effectively improve soil structure (Lehmann et al., 2011; Roland et al., 2022), influencing water and heat transport, microbial activity processes (Zahid et al., 2018), and nutrient transformations, leaching, and efficacy in the soil (Xie et al., 2020). These improvements not only enhance soil quality but also indirectly boost plant productivity. Moderate amounts of biochar increase tomato yield, vitamin C, and soluble sugar content (Guo et al., 2021; Wu et al., 2022) and increase wheat seed biomass by 5.40–120.15% (Xu et al., 2021). However, it reduces grape acidity by 15.8% (Wei et al., 2020). These varying effects highlight the inconsistency in biochar’s impact on soil and plants. The physiological mechanisms by which biochar influences plant growth under DI stress remain unclear and require further investigation.
Previous studies found significant interactions between DI and biochar addition (Chen et al., 2013; Akhtar et al., 2014). For example, Artiola et al. (2012) found that the use of 2 and 4% biochar under DI conditions resulted in a significant decrease in soil bulk weight (from 1.59 to 1.26 g cm3) and increases in soil water content and lettuce yield. Liu et al. (2021) found that owing to the synergistic improvement of soil physical and chemical properties by biochar and irrigation, DI offsets the negative effects of biochar improvement on crop WUE. However, most previous studies have focused on individual soil-water-plant metrics, lacking comprehensive evaluations of the combined effects of DI and biochar on agroecosystems. In particular, the role of soil microbial diversity, crucial for maintaining soil functions, remains underexplored. Additionally, while soil quality assessments offer a clear overview of overall soil health, there is still a shortage of field studies connecting these assessments to broader soil quality concepts. In this study, we tested the validity of the following hypotheses: (1) biochar addition under DI conditions improves soil physical, chemical, and biological traits compared to non-biochar controls under FI and (2) under reduced water supply, biochar improves yield and quality by improving soil quality and promoting crop growth. Our objective was to elucidate the potential mechanisms by which biochar addition combined with reduced irrigation may improve soil quality and crop yield.
The experiment was conducted during the sunflower growing seasons of 2022 and 2023 at the Science and Technology Backyard Experimental Station, Wuyuan County, Bayannur City, Inner Mongolia, China (41°07′ N, −108°04′ E, and 1,031.9 MSL). The climate in this region ranges from arid to semi-arid, with a multi-year average temperature of 6.1°C, 170 mm of rainfall, a frost-free period of 119–138 days, approximately 3,260 h of annual sunshine, and average annual free water surface evaporation of 2,095.2 mm. Prior to the experiment, we determined the basic physicochemical properties of the mixed soil samples (0–20 cm) in the experimental area; the soil texture was sandy loam (pH 7.88), total nitrogen was 0.69 g kg−1, available phosphorus (AP) was 46.29 mg kg−1, available potassium (AK) was 571.50 mg kg−1, and organic matter was 10.36 g kg−1. The experiment was conducted on 5 May 2022 and 12 May 2023, with two spring irrigations using Yellow River water (mineralization: 0.55 g L−1) for salt suppression. The meteorological conditions, such as air temperature and humidity, in the growing seasons of 2022 and 2023 are shown in Figure 1. The average temperatures for the growing seasons of 2022 and 2023 crops were 21.5°C and 21.7°C, rainfall was 99.0 mm and 35.8 mm, and average humidity was 59.5 and 56.6%, respectively.
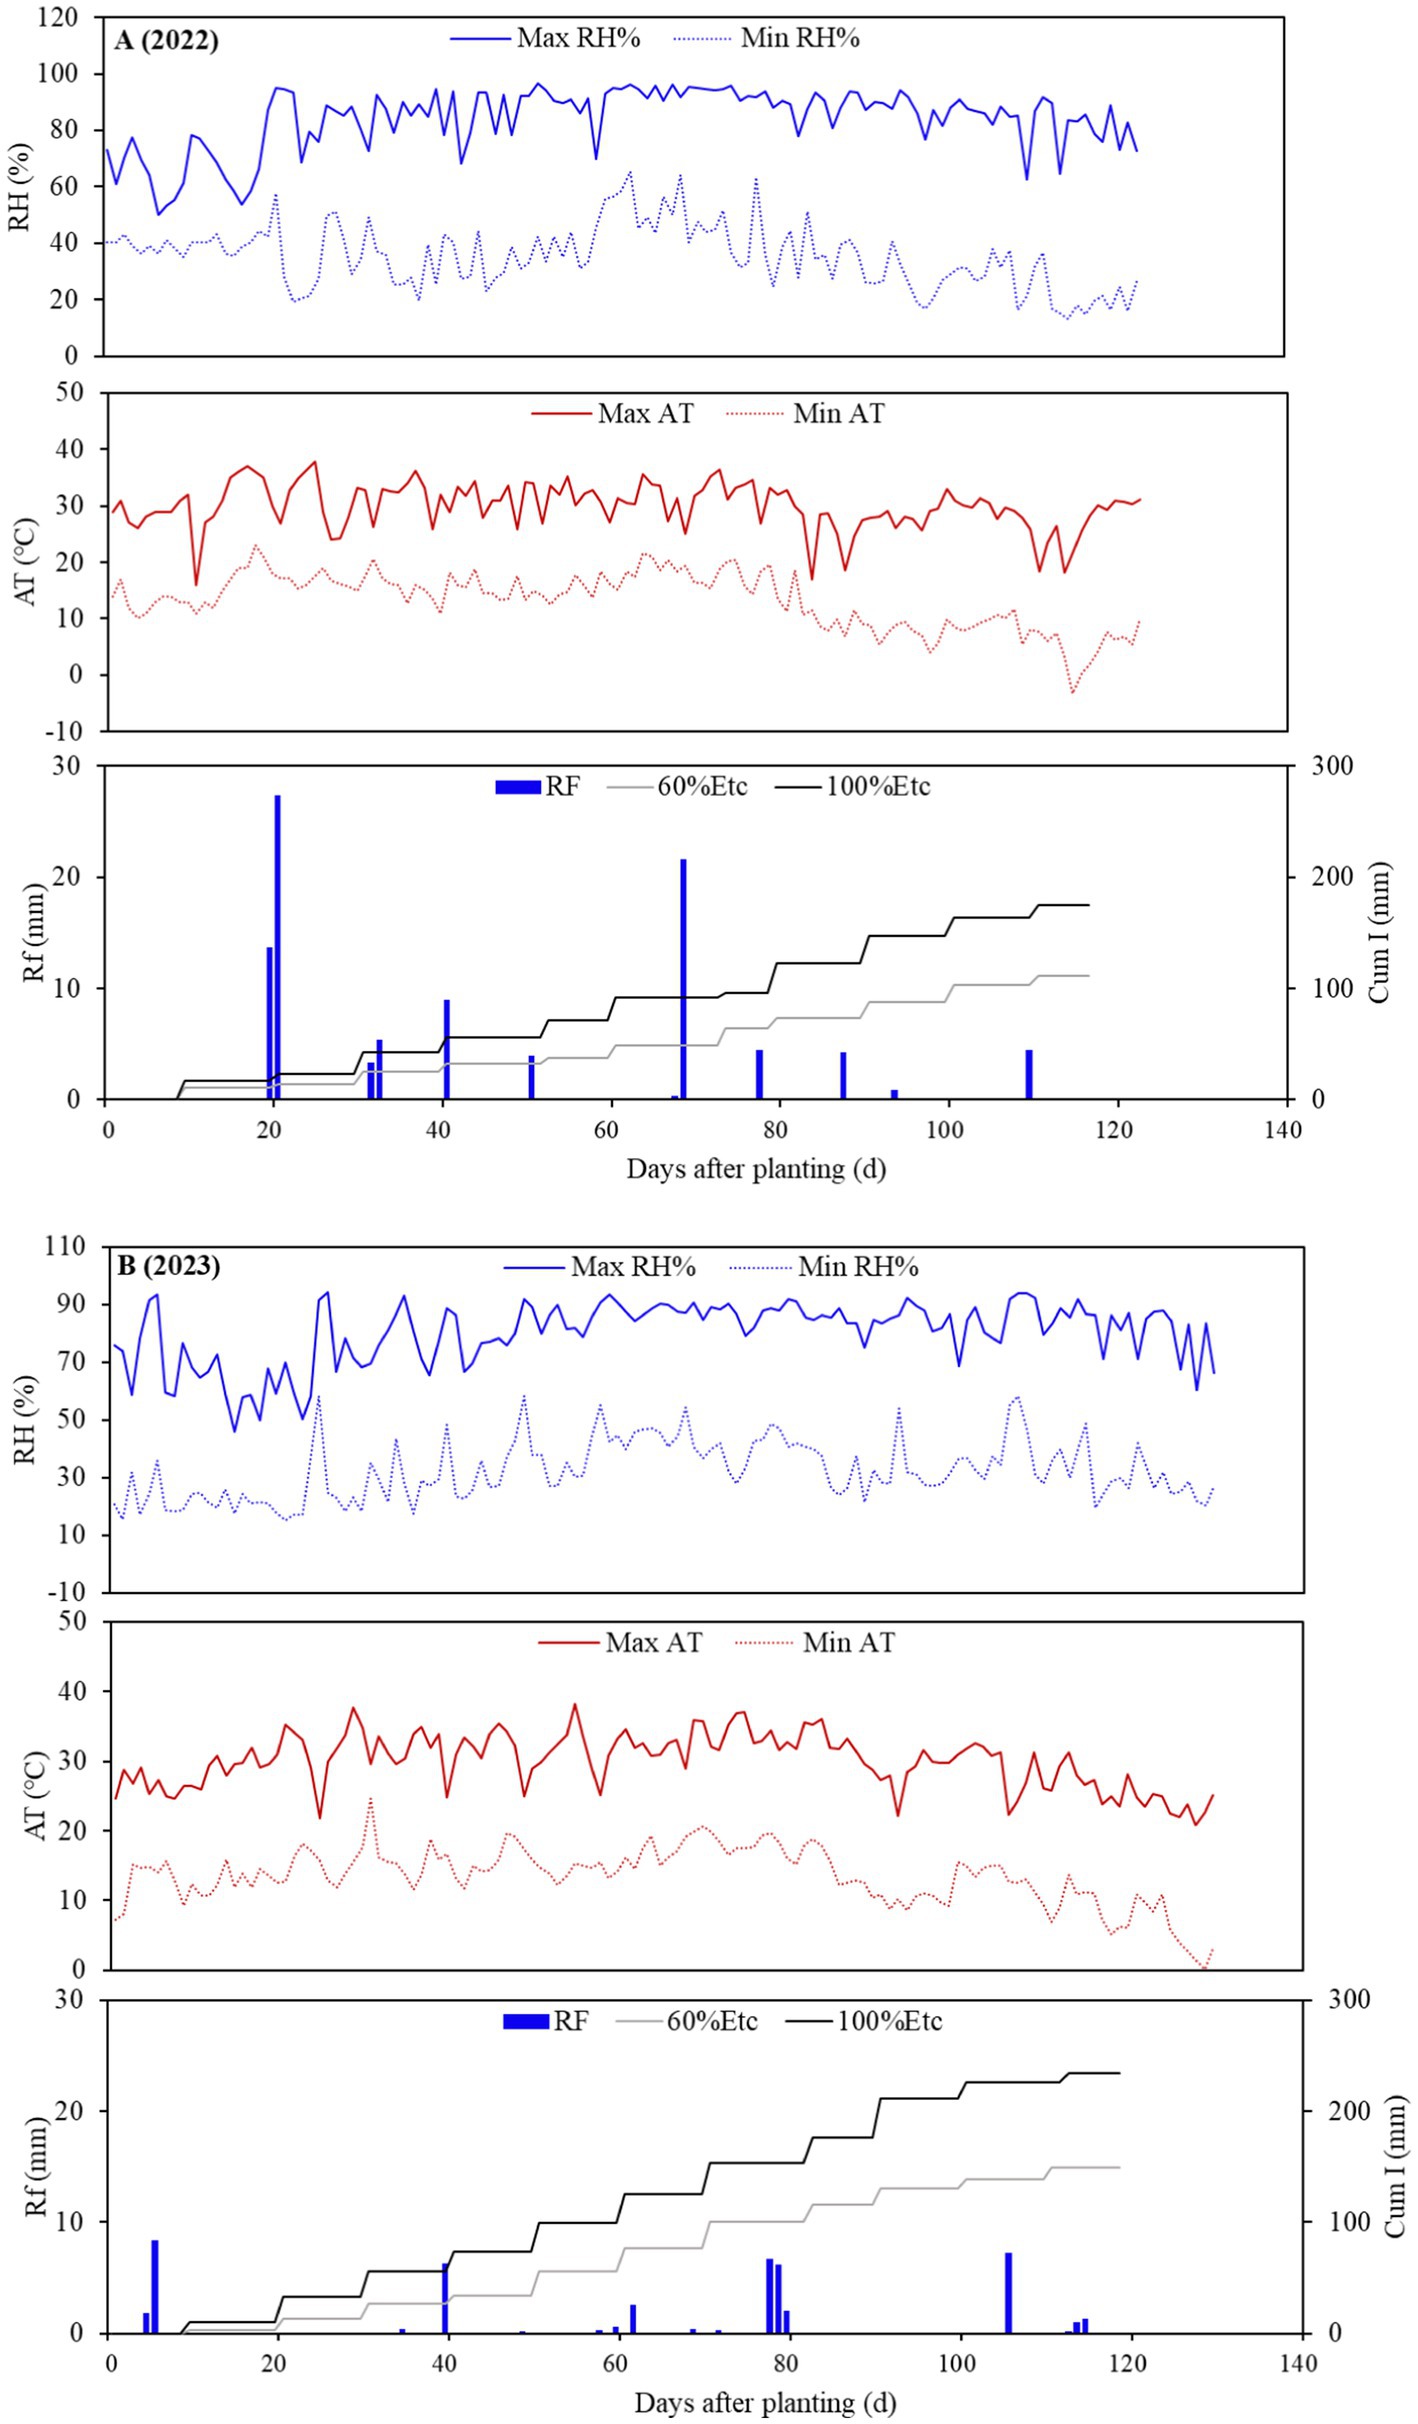
Figure 1. Daily maximum (Max) and minimum (Min) relative humidity (RH%), air temperature (AT), rainfall (RF), and cumulative irrigation (Cum I) during the 2022 (A) and 2023 (B) sunflower growing seasons.
Typical local agricultural wastes include sunflower and corn stalks. Biochar was provided by Inner Mongolia Environmental Science Manufacturing Co., Ltd. using fresh sunflower straw as raw material, pyrolyzed under anaerobic conditions at approximately 400°C. prior to mixing with the soil samples, the biochar was ground to a particle size of ≤2 mm. Soil samples were stored fresh at 4°C in aerated polyethylene bags. In 2022, biochar was thoroughly mixed with 0–20 cm of soil prior to planting. Biochar had a pH of 7.14, a cation exchange capacity of 22.14 cmol kg−1, a specific surface area of 9.87 m2 g−1, and an ash content of 25.36%.
The study used a factorial design with two experimental factors: irrigation and biochar levels. Irrigation was applied at two levels—full irrigation (FI) at 100% crop evapotranspiration (ETc) and deficit irrigation (DI) at 60% ETc. Biochar was applied in three dosages: 0 (B0), 15 (B15), and 30 t ha−1 (B30). These treatments were factorially combined together to form a total of six treatments, each replicated three times across 18 plots, each covering 128 m2. Adjacent plots were separated by a 20-cm thick concrete partition, buried to a depth of 1.8 m, with the pit bottoms sealed with concrete and equipped with a drainage corridor. Drip irrigation under plastic mulch was used throughout the sunflower reproductive period. The sunflower variety was Tongqing No. 6, planted in two rows under each membrane (90 cm wide), with row spacing of 40 cm, plant spacing of 60 cm, and a drip irrigation system (Flat Emitter) with a 0.3 m emitter spacing, 16 mm tube diameter, and a flow rate of 2.8 L h−1 per nozzle. Before sowing each year, organic fertilizers (P2O5: 180 kg ha−1; N: 106.5 kg ha−1; K2O: 75 kg ha−1) were evenly spread on the surface of the respective plots and incorporated into the top 20 cm using a rotary tiller. N fertilizer (300 kg ha−1) was applied during the critical period of sunflower growth with drip irrigation. Herbicides and fungicides were applied during planting to protect the crops from weeds and diseases.
Soil samples were collected from each treatment at harvest in 2022 and 2023 at a depth of 0–20 cm using a multi-point (randomized 5-point) mixed sampling method. Samples were divided into three portions: two were packed on dry ice and brought back to the laboratory within 12 h. One portion was stored at −80°C for soil microbial DNA extraction, and another portion was stored at −4°C for soil enzyme activity determination. The remaining portion was air-dried and screened for physical, chemical, and biological properties.
Soil bulk density (BD, g cm−3) was determined using the ring knife method. Soil samples were weighed, dried in a fan-assisted oven at 105°C for 12 h, and then reweighed to ascertain gravimetric soil water content. Volumetric soil water content (SWC, cm3 cm−3) was calculated by multiplying the weight of the soil water content by BD. Total carbon (TC, g kg−1) and total nitrogen (TN, g kg−1) were determined using an elemental analyzer (FlashSmart; USA). Available phosphorus (AP, mg kg−1) was determined using the 0.5 mol L−1 of NaHCO3 extraction-molybdenum antimony colorimetric method, while AK (mg kg−1) was quantified using the flame photometric method (UV-1900i; Shimadzu) (Bao, 2000). The cation exchange capacity (CEC, cmol kg−1) was determined using the ammonium acetate exchange method (Bao, 2000), with NH4+ concentrations analyzed via a continuous flow analyzer (Auto Analyzer3, SEAL, Germany) using Equation 1.
where CEC is the cation exchange capacity (cmol kg−1), C is the NH4+-N concentration in the measured sample (mg L−1), and m is the weighed soil mass (g).
In this study, four soil enzymes involved in the C, N, and P cycles were measured: acid phosphatase (ACP), N-acetyl-β-D-glucosidase (NAG), catalase (CAT), and leucine aminopeptidase (LAP). Enzyme activities were determined using a microtiter plate fluorescence assay (Saiya et al., 2002). Details of the assay methods have been described previously (Deforest, 2009). Soil microbial biomass carbon (MBC) was extracted via direct leaching using chloroform fumigation (Vance et al., 1987). Soil ATP was extracted using TIP reagent (0.6 M imidazole, 1.1 M trichloroacetic acid, and 0.25 M sodium hydrogen phosphate), and the extracts were briefly cooled on ice and then frozen at −20°C. ATP levels were determined using a bioluminometer (GloMax 96; Promega, USA) with firefly luciferin-luciferase reagent (Qiu et al., 2015).
Total soil DNA was extracted using an E. Z. N. A. Soil DNA Kit (Omega Bio-Tek, USA), and all DNA samples were tested for purity following extraction using an ultra-micro spectrophotometer (NanoDrop2000; Thermo Fisher Scientific, USA). DNA concentration was detected using a microfluorometer (TBS-380; Turner BioSystems, USA). The quality of the extracted DNA was determined using 1% agarose gel electrophoresis (5 V cm−1 for 20 min). Primers 338F and 806R were used to amplify the V3–V4 region of the soil bacterial 16S rRNA gene, followed by quantification using Eub338F and Eub518R, library construction using the DNBSEQ-T7RS Reagent kit (FCL PE150) V2.0, and library quality control and quantification. Qualified libraries were subjected to bidirectional high-throughput sequencing on a DNBSEQ-T7 sequencing platform (Wuhan BioVivan Biotechnology Co., Ltd.). High-throughput sequencing data were analyzed using Fastp software for splicing and quality control of the raw data. Amino acid sequences from non-redundant gene sets were aligned with the database using Diamond (Buchfink et al., 2015) with a BLASTP alignment e-value threshold of 1e-5. Species annotations were obtained from the corresponding taxonomic database, and species abundance was calculated based on the total abundance of the corresponding genes.
Five representative sunflower plants with consistent flowering entries were selected for each treatment. At maturity, 50 kernels were picked from the outermost three or four circles of each disk (to control for quality variation due to seed position) from fixed plants. These 50 kernels were then mixed for analysis. Sunflower seeds were crushed in a grinder, and the crude fat content of the seed kernels was determined using gas chromatography (Clarus 680; Varian, USA). The protein content of the seed kernels was determined using a Kjeldahl nitrogen analyzer (TM8100; Foss, China). Amino acid fractions (arginine, valine, and proline) were determined using an amino acid analyzer (L-8900; Hitachi, Japan). At the time of sunflower ripening and harvesting, three sunflower plants from each treatment were randomly selected for the measurement of aboveground dry matter mass. The fresh weight of each plant was measured, followed by drying in an oven at 105°C for 30 min to halt greening. The plants were then dried at a constant 75°C until reaching a stable mass, cooled to room temperature, and weighed to determine the aboveground dry matter mass. Fifteen sunflower plants were randomly selected from each treatment, threshed, and air-dried. The disk mass, 100-grain mass, and seed mass were measured and converted into yield per unit area.
To calculate the reference ET0, an automatic meteorological station (MC-QXSQ; Sanzhi Future Technology Co., Ltd., China) was used to measure real-time micrometeorological data, including net radiation, air temperature, humidity, and real-time wind speed during the experimental period. The net radiometer (SZWL-FS485) has a spectral range of 0.3–3 μm and a measurement range of 0–2,000 W m−2. Air temperature and humidity were measured with a standard temperature and humidity probe (SZWL-WS485) with an accuracy of ±3% for humidity at room temperature, and ± 0.1°C for temperature. Wind speed was measured in real-time using a SZWL-F device, with a range of 0–70 m s−1, a response time of <1 s, and a start-up wind speed of 0.4–0.8 m s−1. The sensor measurement parameters were transmitted to the MC-QXSQ data acquisition terminal through a cable. The data acquisition terminal was connected to a computer through a serial port, and data download was accomplished through a 4G wireless module. Automatic weather station data were measured every 30 min, and the daily average data were used to calculate ET0. To ensure the reliability of the daily ET0 calculations and provide timely irrigation when needed, more than 15 hourly data averages were used to calculate daily ET0. Cumulative ET0 (Equation 3) was calculated using the Penman–Monteith formula based on meteorological data at the site. ETc was calculated using Equation 2 (Allen et al., 1998). All treatments were irrigated on the same date with an irrigation interval of 10 d. The ETc value used for each calculation was the sum of ETc 10 d prior to the day of irrigation. When rainfall occurred during irrigation, irrigation was postponed, and the effective precipitation in the irrigation cycle was subtracted from the irrigation volume. When the effective precipitation exceeded the irrigation volume, only 20 mm of water was used for fertilizer application. The amount of water applied was measured by using water meters installed in each area (Figure 1). ETc and ET0 were calculated as follows:
where ET0 is the reference evapotranspiration (mm), Kc is the crop stage coefficient, Rn is the net radiation on the crop surface (W m−2), G is the soil heat flux density (W m−2), T is the average daily air temperature at a height of 2 m (°C), U2 is the wind speed at a height of 2 m (m s−1), es is the saturated water pressure (kPa), ea is the actual water pressure (kPa), Δ is the slope of saturated water pressure (kPa °C−1), and γ is the dry and wet table constant (kPa °C−1). Sunflower crop Kc values were as follows: 0.697 for the initial growth period (0–30 d after planting, DAP), 0.751 for the rapid development period (30–60 DAP), 0.804 for the mid-growth period (60–90 DAP), and 0.350 for the maturity period (90–120 DAP) (Dai et al., 2011).
Twenty-four indicators of soil physics, chemistry, and biology were measured as total dataset (TDS) indicators, each of which was analyzed using one-way analysis of variance (ANOVA). Indicators with significant differences were selected as significant dataset indicators. Data were standardized and subjected to principal component analysis (PCA) combined with norm values to identify indicators for inclusion in the minimum dataset (MDS). Norm values of the indicators in each group were calculated, and the indicators in each group whose norm values were within 10% of the maximum norm value in that group were selected. If multiple indicators from the same group met this criterion, Pearson’s correlation coefficient was used to decide which to retain. Indicators with a correlation coefficient below 0.5 were all retained. If indicators were significantly correlated within a principal component (R > 0.5), the one with the highest norm value was chosen for the MDS (Zhou et al., 2020). TDS was calculated as the composite load of all indicators using the following formula (Equation 4):
where is the cumulative factor loading of indicator i across all k principal components, is the individual factor loading of indicator i, and is the eigenvalue of the kth principal component.
The affiliation values of the indicators entering the MDS were obtained by establishing an affiliation function between the indicator and the soil quality, calculated using the following formula (Equation 5):
where x is the actual measured value of the soil quality indicator, is the minimum value, is the maximum value, and is the standardized value of the indicator.
The linear scores of the indicators were weighted and summed with weighting factors to calculate the SQI using the following formula Equation 6 (Zhou et al., 2020):
where and denote the linear scores and weighting coefficients corresponding to the ith evaluation indicator, respectively, and n denotes the total number of soil indicators in the dataset.
Data processing and graphical representation were performed using Microsoft Office Excel (Microsoft Corporation) and Origin 2019b, respectively. Quantitative data for soil traits and sunflower parameters were screened for normal distribution using the Shapiro–Wilk test, and the Levene test was used for variance alignment. Redundancy analysis (RDA) of the soil bacterial phylum level community structure, relative abundance of bacteria, and soil properties was performed using CANOCO 5.0. Alpha diversity indices were calculated using qiime software (version v.1.8) (Schloss et al., 2011). The Mantel test between soil traits and sunflower parameters was performed using the “ggcor” package in the R (version 4.3.2) statistical computing environment. To investigate the effects of irrigation and biochar and their interaction, a two-way ANOVA was performed on all data using SPSS 22.0 (IBM Corporation, USA). All data are expressed as mean ± standard error of three replicates. Tukey’s test was applied to the data at a 5% significance level.
The soil’s physical and chemical properties under the two irrigation levels and three biochar treatments in the two growing seasons are shown in Table 1. Except for the lack of a significant effect of biochar on soil CEC (two-way ANOVA, p > 0.05), there was a significant effect of biochar on the remaining soil physical and chemical traits (two-way ANOVA, p < 0.05) under both irrigation regimes. Irrigation and biochar had a significant effect on TN (two-way ANOVA, p < 0.01). Under FI conditions, B15 significantly reduced BD by 11.0% (two-way ANOVA, p < 0.05; 2-year average). TC, TN, AP, and AK were significantly higher in the B30 soil than in the soil without biochar application under DI conditions by 17.6, 18.9, 13.1, and 13.8%, respectively (two-way ANOVA, p < 0.05; 2-year average). Within each amendment type, the DI + B30 treatment was more significant overall in improving soil physical and chemical traits (two-way ANOVA, p < 0.05; 2-year average).
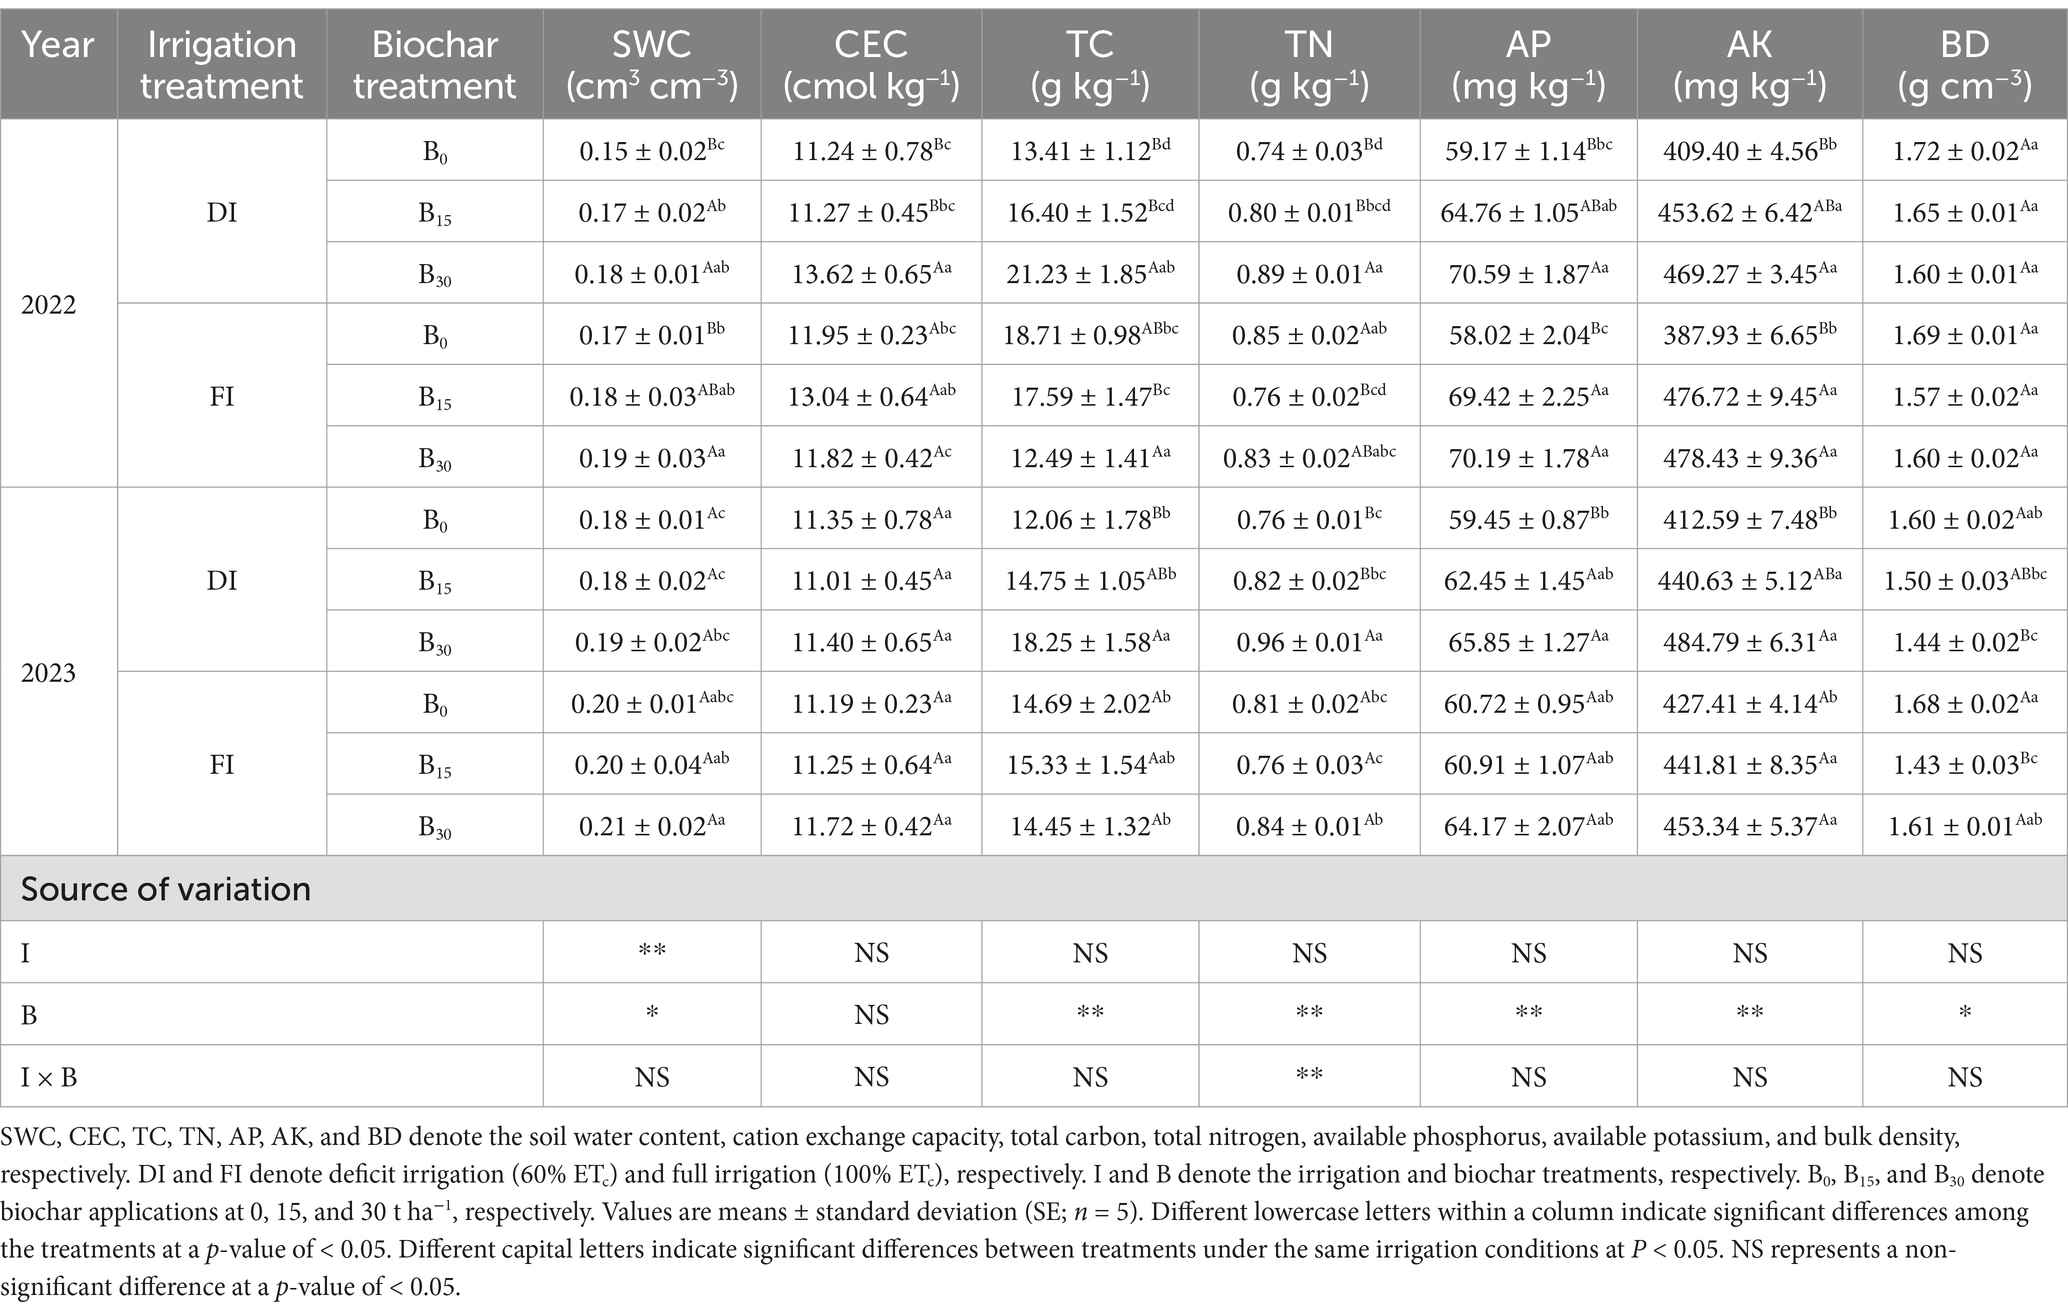
Table 1. Main and interaction effects of irrigation and biochar on soil physicochemical properties.
The effects of different irrigation levels and biochar on soil enzyme activities and MBC and adenosine triphosphate (ATP) contents are shown in Figure 2. Soil acid phosphatase (ACP), N-acetyl-β-D-glucosidase (NAG), catalase (CAT), and leucine aminopeptidase (LAP) activities were significantly affected by biochar, irrigation, and their interaction (two-way ANOVA, p < 0.05; Figure 2A). Under DI conditions, compared with the B0 treatment, the B30 treatment increased ACP, NAG, CAT, and LAP activities by 38.0, 62.4, 64.8, and 26.8%, respectively (two-way ANOVA, p < 0.05; 2-year average). Without considering other factors, the activity of each soil enzyme was significantly higher under the DI + B30 conditions (two-way ANOVA, p < 0.05). Soil MBC (Figure 2B) and ATP (Figure 2C) contents increased by 6.8% (two-way ANOVA, p < 0.05) and 2.3% (two-way ANOVA, p > 0.05), respectively, under DI conditions compared to FI. In particular, the addition of biochar resulted in increased MBC and ATP contents under DI conditions relative to FI. While there was no significant biochar and irrigation interaction for MBC (two-way ANOVA, p > 0.05), a significant interaction was observed for ATP (two-way ANOVA, p < 0.05).
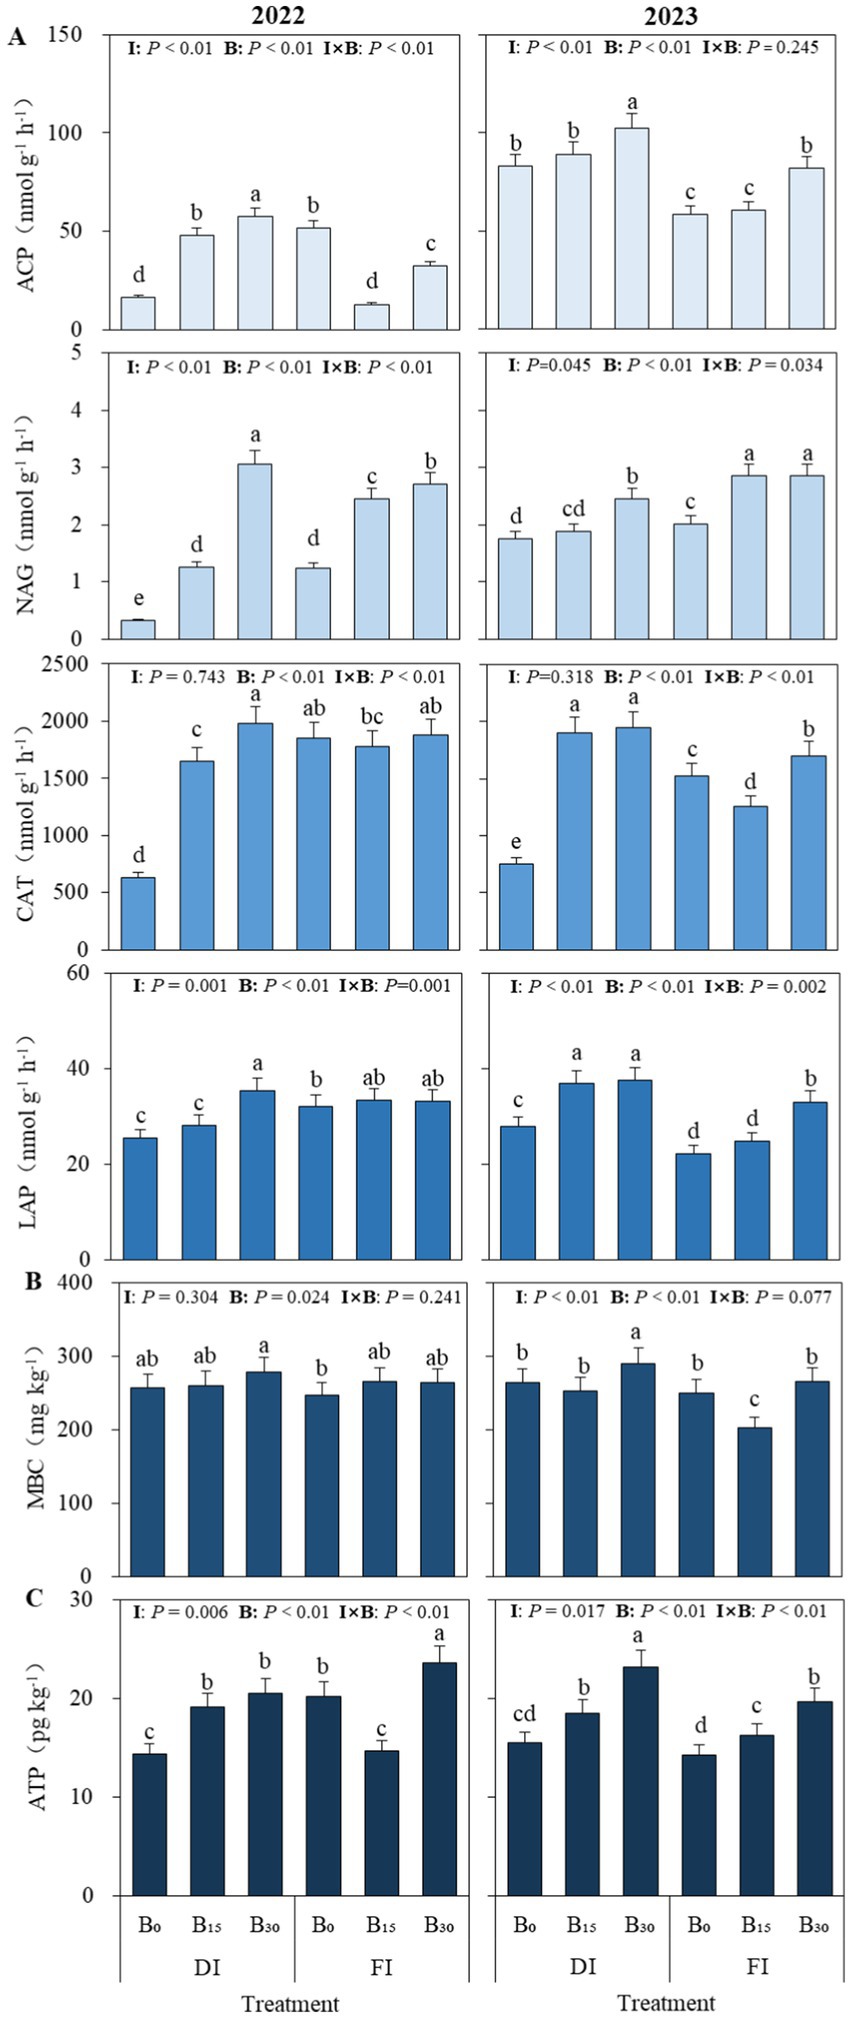
Figure 2. Effects of different irrigation levels and biochar on soil enzyme activities (A) and microbial biomass carbon (MBC, B) and adenosine triphosphate (ATP, C) contents. ACP, NAG, CAT, and LAP denote acid phosphatase, N-acetyl-β-D-glucosidase, catalase, and leucine aminopeptidase, respectively. DI and FI denote deficit irrigation (60% ETc) and full irrigation (100% ETc), respectively. I and B denote irrigation and biochar, respectively. B0, B15, and B30 denote biochar applications of 0, 15, and 30 t ha−1, respectively. Values are means ± standard deviation (SE; n = 5). Different lowercase letters in a column within a factor indicate significant differences between all treatments at P < 0.05.
The community structure of soil microorganisms at the phylum level is shown in Figure 3. Eleven taxa with a relative abundance >0.5% were obtained. The dominant species were Proteobacteria (33.5%), Actinobacteria (22.3%), Acidobacteria (15.1%), Gemmatimonadetes (7.4%), Bacteroidetes (6.5%), Chloroflexi (5.5%), Candidatus_Rokubacteria (4.4%), Planctomycetes (0.9%), Cyanobacteria (0.6%), Verrucomicrobia (0.6%), and Firmicutes (0.5%). The DI + B30 treatment significantly increased the abundance of dominant bacterial taxa, including Proteobacteria, Actinobacteria, Gemmatimonadetes, Bacteroidetes, and Chloroflexi, compared to other treatments (p < 0.05). However, the relative abundances of Acidobacteria, Chloroflexi, and Candidatus Rokubacteria decreased.
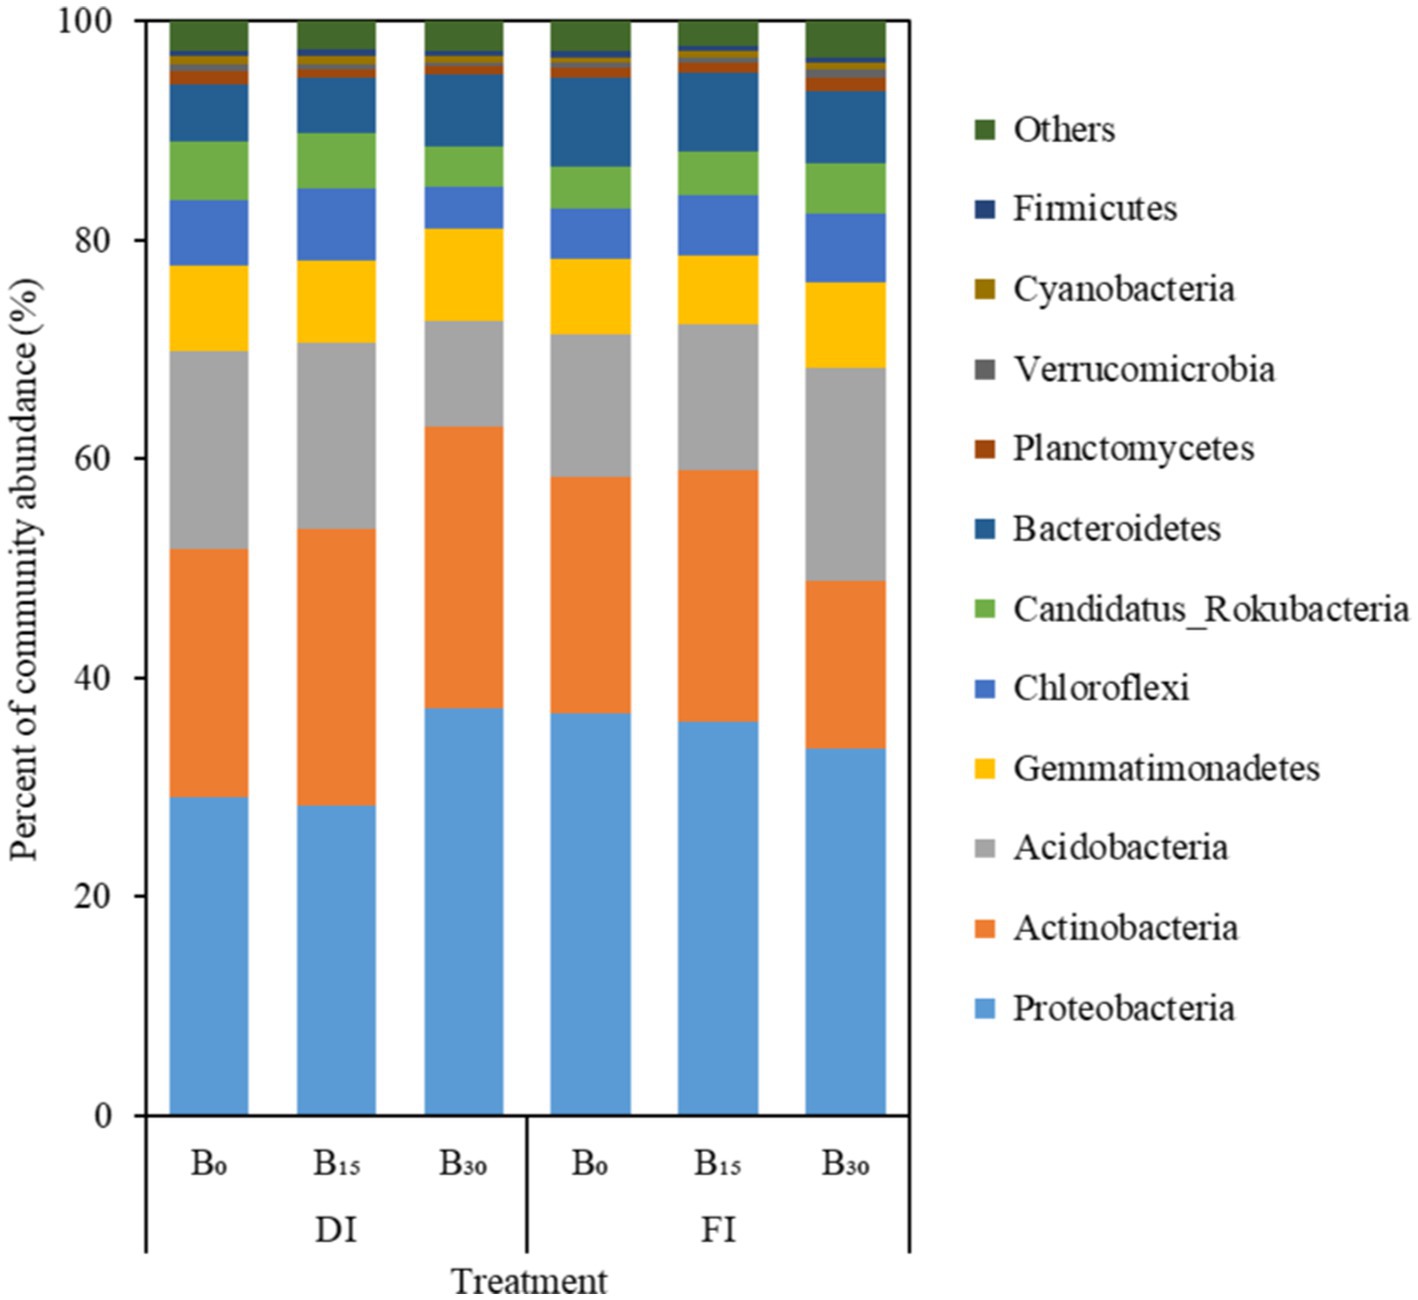
Figure 3. Taxonomic composition of soil bacteria under different treatments at the phylum level. DI and FI denote deficit irrigation (60% ETc) and full irrigation (100% ETc), respectively. B0, B15, and B30 denote biochar applications of 0, 15, and 30 t ha−1, respectively.
The effect of biochar level on α diversity index was significantly higher than that of irrigation level (p < 0.05; Figure 4). The coverage index for each treatment was approximately 0.99, indicating that the sequencing data accurately represented the majority of the microbial diversity within the samples. Under FI conditions, the Chao1, Shannon, and ACE indices were significantly lower in the unapplied biochar (B0) treatment than in the other irrigation and biochar treatments. Observing the results of all treatments, the Chao1 and ACE indices were significantly higher in the FI + B30 treatment than in the other treatments (p < 0.05), while the Shannon index was significantly higher in the DI + B30 treatment than in the other treatments (p < 0.05). The Simpson index reflects the degree of species dominance, with smaller values representing a higher diversity of community species. Biochar application, particularly at B15 under DI conditions, significantly reduced the Simpson’s index and increased community species diversity, indicating that biochar application enhances soil bacterial community diversity under DI.
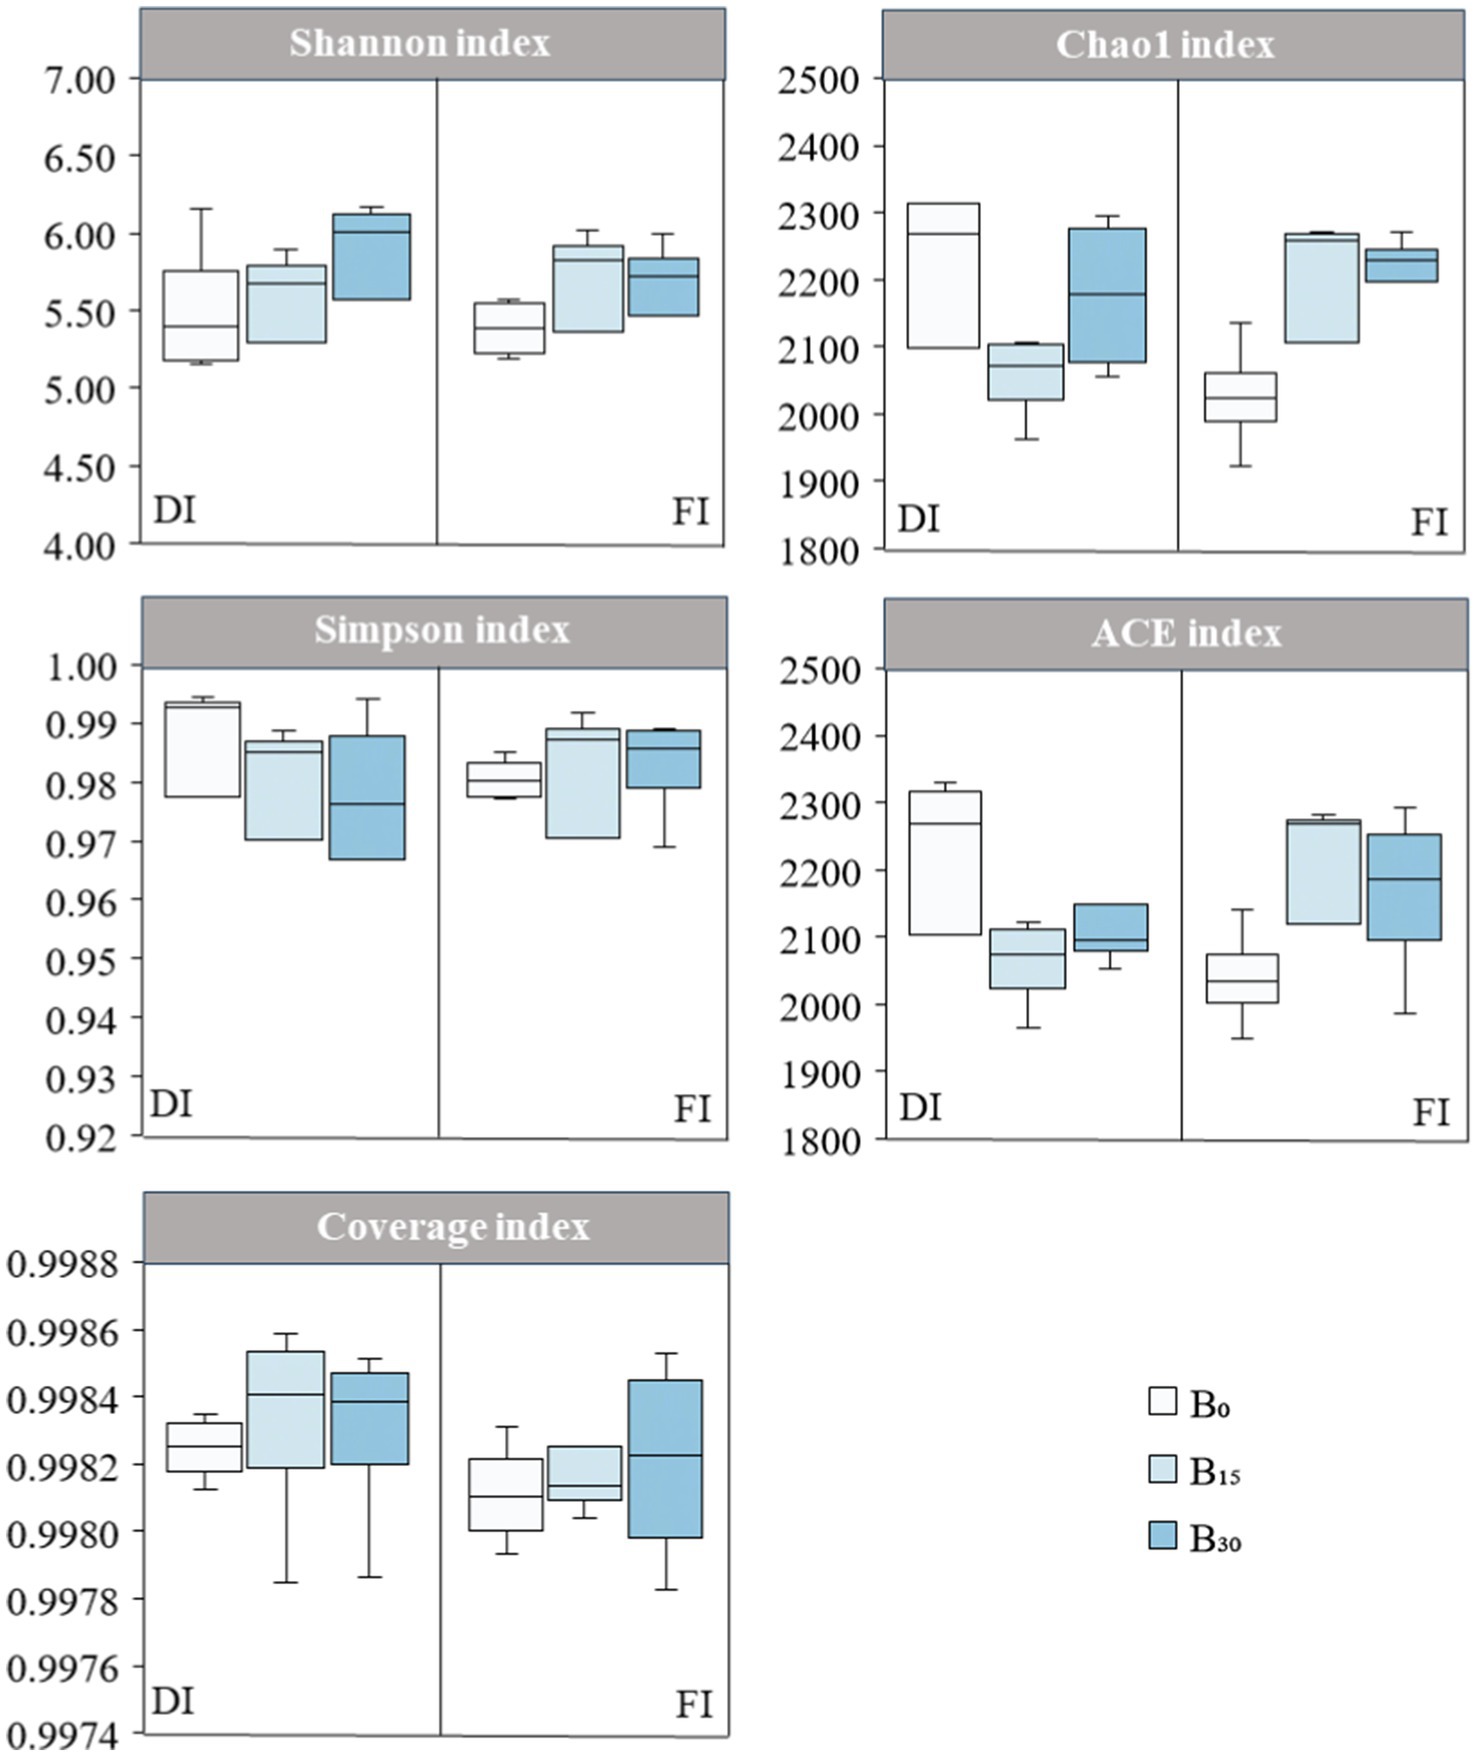
Figure 4. Effects of biochar application on soil microbial α-diversity under different irrigation levels. DI and FI denote deficit irrigation (60% ETc) and full irrigation (100% ETc), respectively. B0, B15, and B30 denote biochar applications of 0, 15, and 30 t ha−1, respectively.
The RDA ordination plot reflects the relationship between soil factors and bacterial community structure under different irrigation and biochar levels (Figure 5). RDA1 explained 51.94% and RDA2 explained 26.28% of the variance, giving a cumulative explained variance of 78.22% for both axes. The results of the permutation test showed that the environmental factors that played key roles in changes in soil bacterial communities under the different treatments were LAP (R2 = 0.519, p = 0.024), ACP (R2 = 0.401, p = 0.002), MBC (R2 = 0.371, p = 0.026), CAT (R2 = 0.221, p = 0.003), TN (R2 = 0.128, p = 0.004), and ATP (R2 = 0.120, p = 0.002). Among them, the explained rates of microbial functional structural variations in ATP, ACP, CAT, and TN were highly significant. Furthermore, the explained rate of microbial functional structural variation in LAP and MBC reached a significant level.
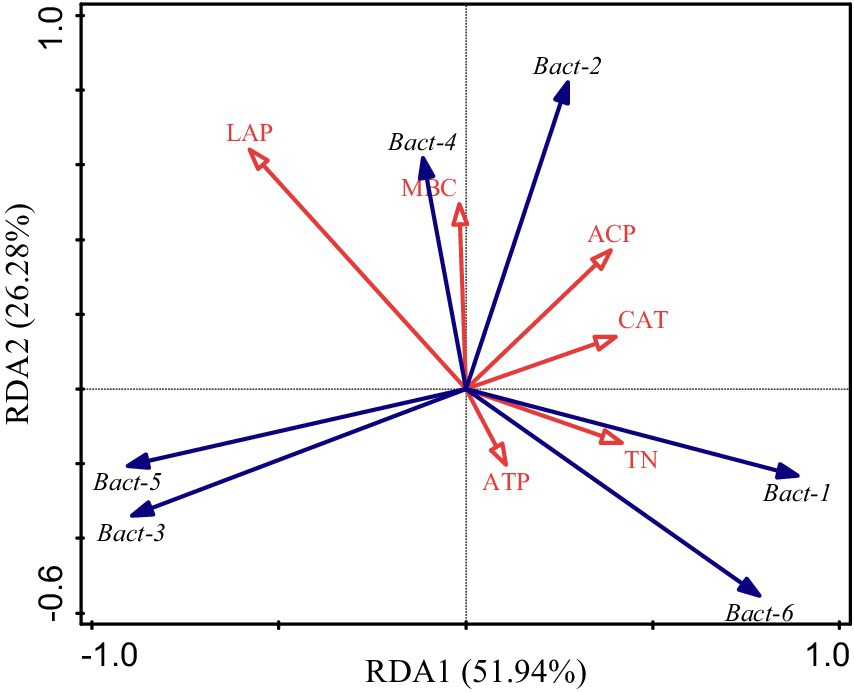
Figure 5. Redundancy analysis (RDA) of soil microbial phylum level community structure with soil environmental factors. ACP, CAT, MBC, ATP, TN, and LAP denote acid phosphatase, catalase, microbial biomass carbon, adenosine triphosphate, total nitrogen, and leucine aminopeptidase, respectively. Bact-1, Bact-2, Bact-3, Bact-4, Bact-5, and Bact-6 denote Proteobacteria, Actinobacteria, Acidobacteria, Gemmatimonadetes, Chloroflexi, and Bacteroidetes, respectively.
The effects of irrigation and biochar application on seed quality, biomass, and sunflower yield are presented in Table 2. Crop seed quality is an important factor in determining the economic efficiency of crops. ANOVA results showed that biochar significantly impacted all seed quality indicators over the 2-year period, except for crude fat, which remained unaffected. There was no significant interaction between irrigation and biochar on any seed quality indices (p > 0.05). There was no regularity in the trends of crop seed quality indices at different biochar dosages with increasing irrigation water. Crude fat was higher in crops of the DI + B30 treatment across both seasons. In 2022, the B30 treatment exhibited the highest protein, arginine, valine, and proline contents under FI conditions, and the differences between the protein, valine, and proline treatments were statistically significant (p < 0.05). In 2023, under DI conditions, the B30 treatment exhibited improved seed quality, particularly in arginine (p < 0.05) and proline (p = 0.12). This suggests that biochar under DI conditions can enhance sunflower kernel quality, but long-term monitoring is necessary to fully understand its effects.
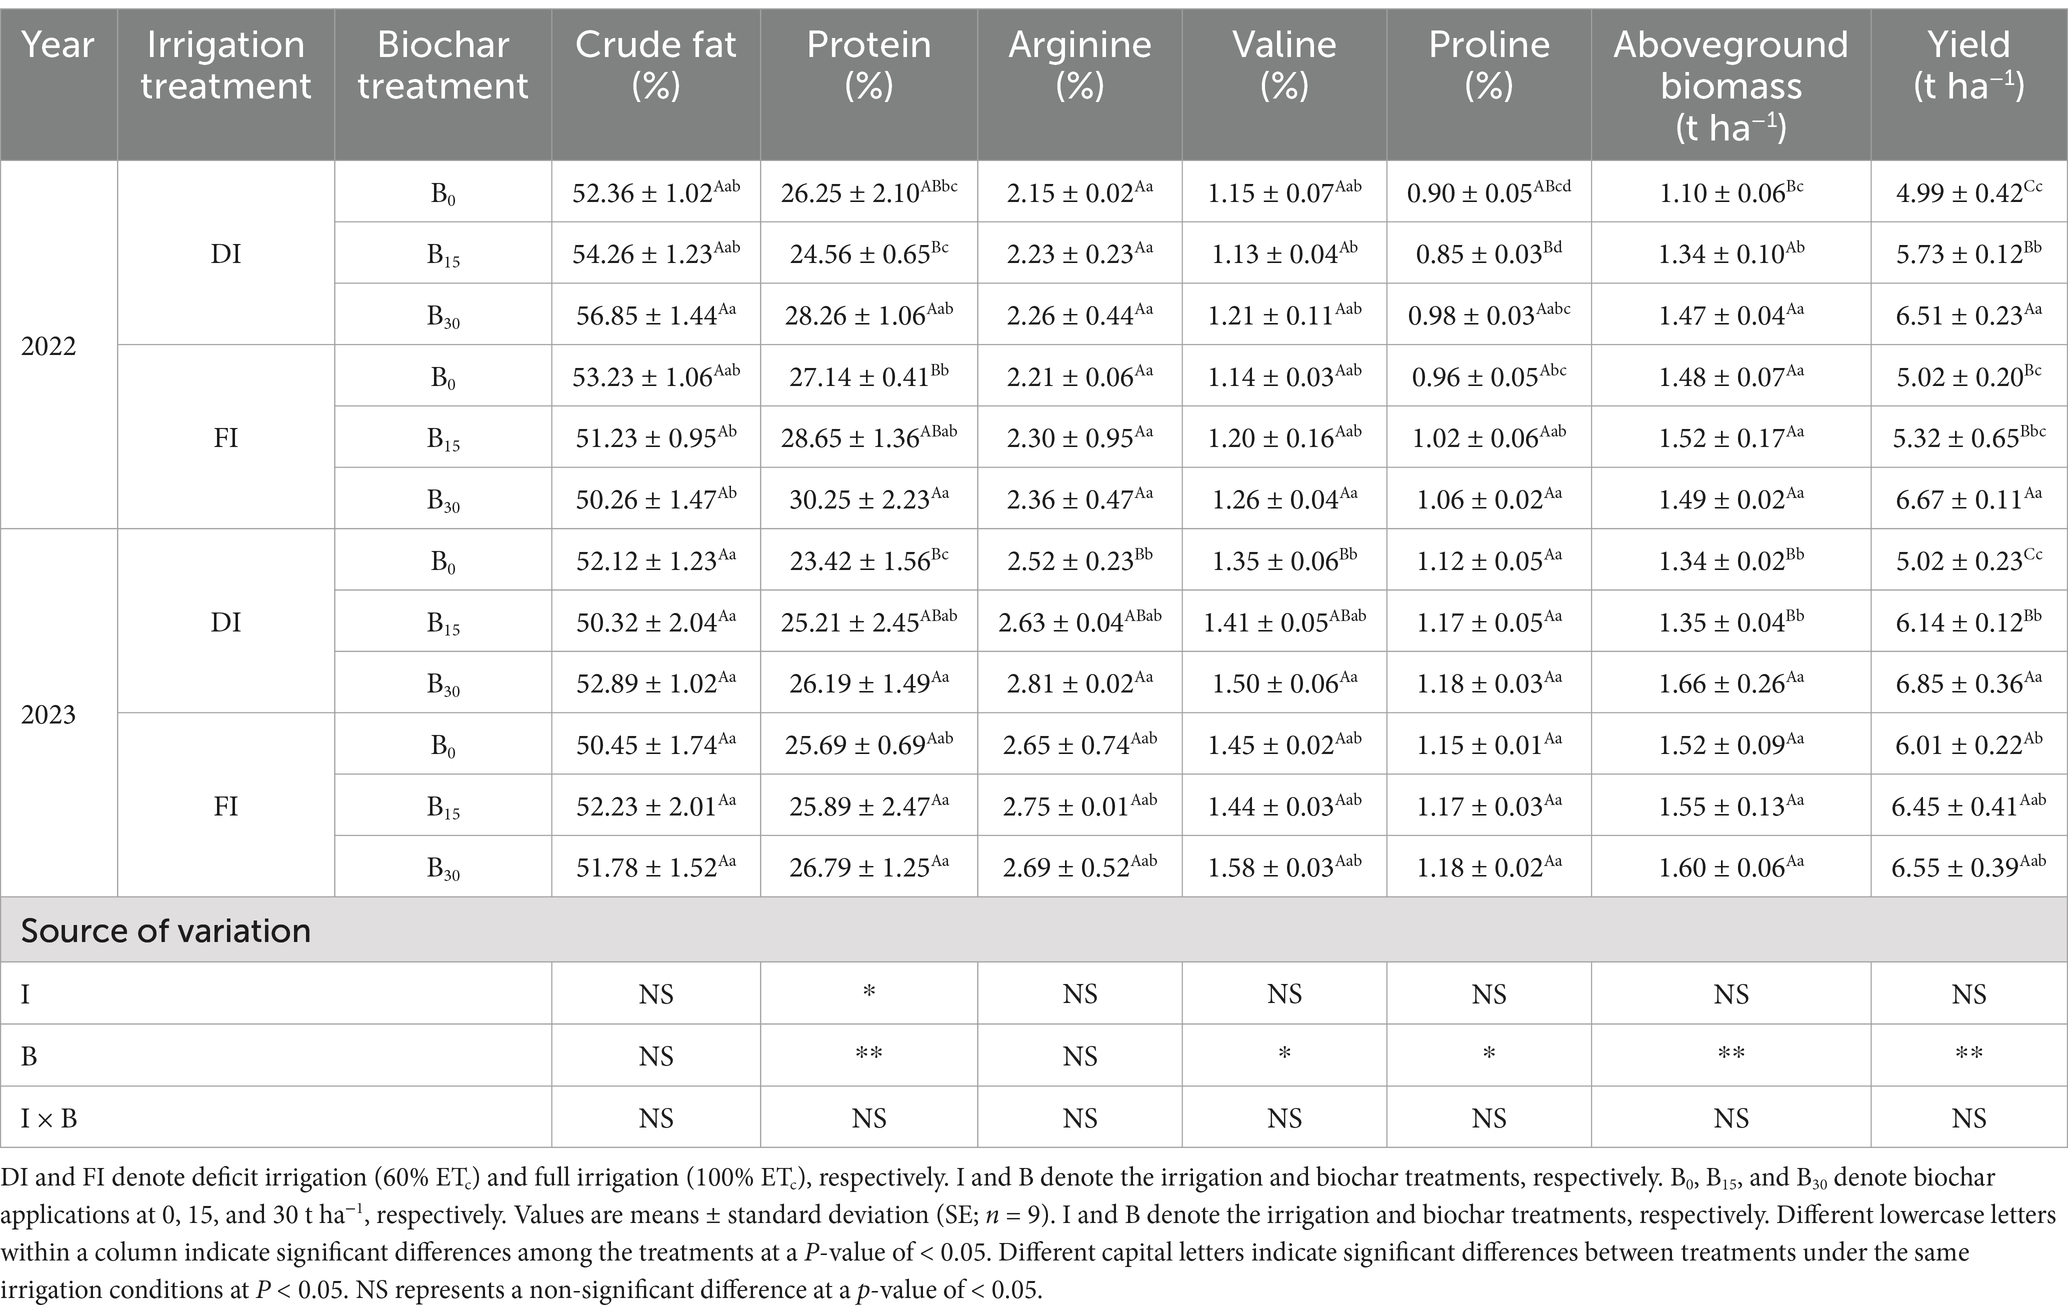
Table 2. Main and interaction effects of irrigation and biochar on seed quality, biomass, and yield of sunflower.
In both irrigation treatments, the application of biochar increased sunflower yield components (sunflower aboveground biomass and yield) compared with no biochar application (Table 2). While biochar had a significant effect (p < 0.01) on both aboveground biomass and sunflower yield, irrigation and their interaction did not show significant effects (p > 0.05). In both growing seasons, the DI + B30 treatment exhibited the highest yield (6.68 t ha−1; 2-year average), whereas the DI + B0 treatment had the lowest yield (5.00 t ha−1; 2-year average). ANOVA results showed that the application of biochar under DI conditions had a tendency to significantly increase the aboveground biomass of the crop compared to the FI condition (p < 0.05). The B30 treatment exhibited the highest aboveground biomass over the 2-year average, significantly outperforming the DI + B0 and DI + B15 treatments by 22.0 and 14.4%, respectively (p < 0.05). Overall, biochar application under DI conditions consistently enhanced sunflower aboveground biomass and yield, with improvements correlating with increased biochar addition.
Correlation and Mantel test analyses of soil physical, chemical, and biological indicators with sunflower seed quality (Spec01), aboveground biomass (Spec02), and yield (Spec03) were performed for 2 years of growing season data (Figure 6A). According to the Mantel test analysis, Spec01 showed highly significant positive relationships with CEC, TC, TN, AK, Chao1 index, Shannon index, Simpson index, ACE index, coverage index, Proteobacteria (Bact-1), and Chloroflexi (Bact-6) (p < 0.01, Mantel r ≥ 0.25). Spec02 showed highly significant positive relationships with TC, TN, AP, AK, NAG, LAP, Bact-1, and Bact-6 (p < 0.01, Mantel’s r ≥ 0.25). Spec03 showed highly significant positive relationships with TC, TN, AK, CAT, and ATP (p < 0.01, Mantel’s r ≥ 0.25). Therefore, CEC, TC, TN, AP, AK, NAG, LAP, CAT, ATP, Chao1 index, Shannon index, Simpson index, ACE index, coverage index, Bact-1, and Bact-6 were selected as valid indicators based on their significance levels.
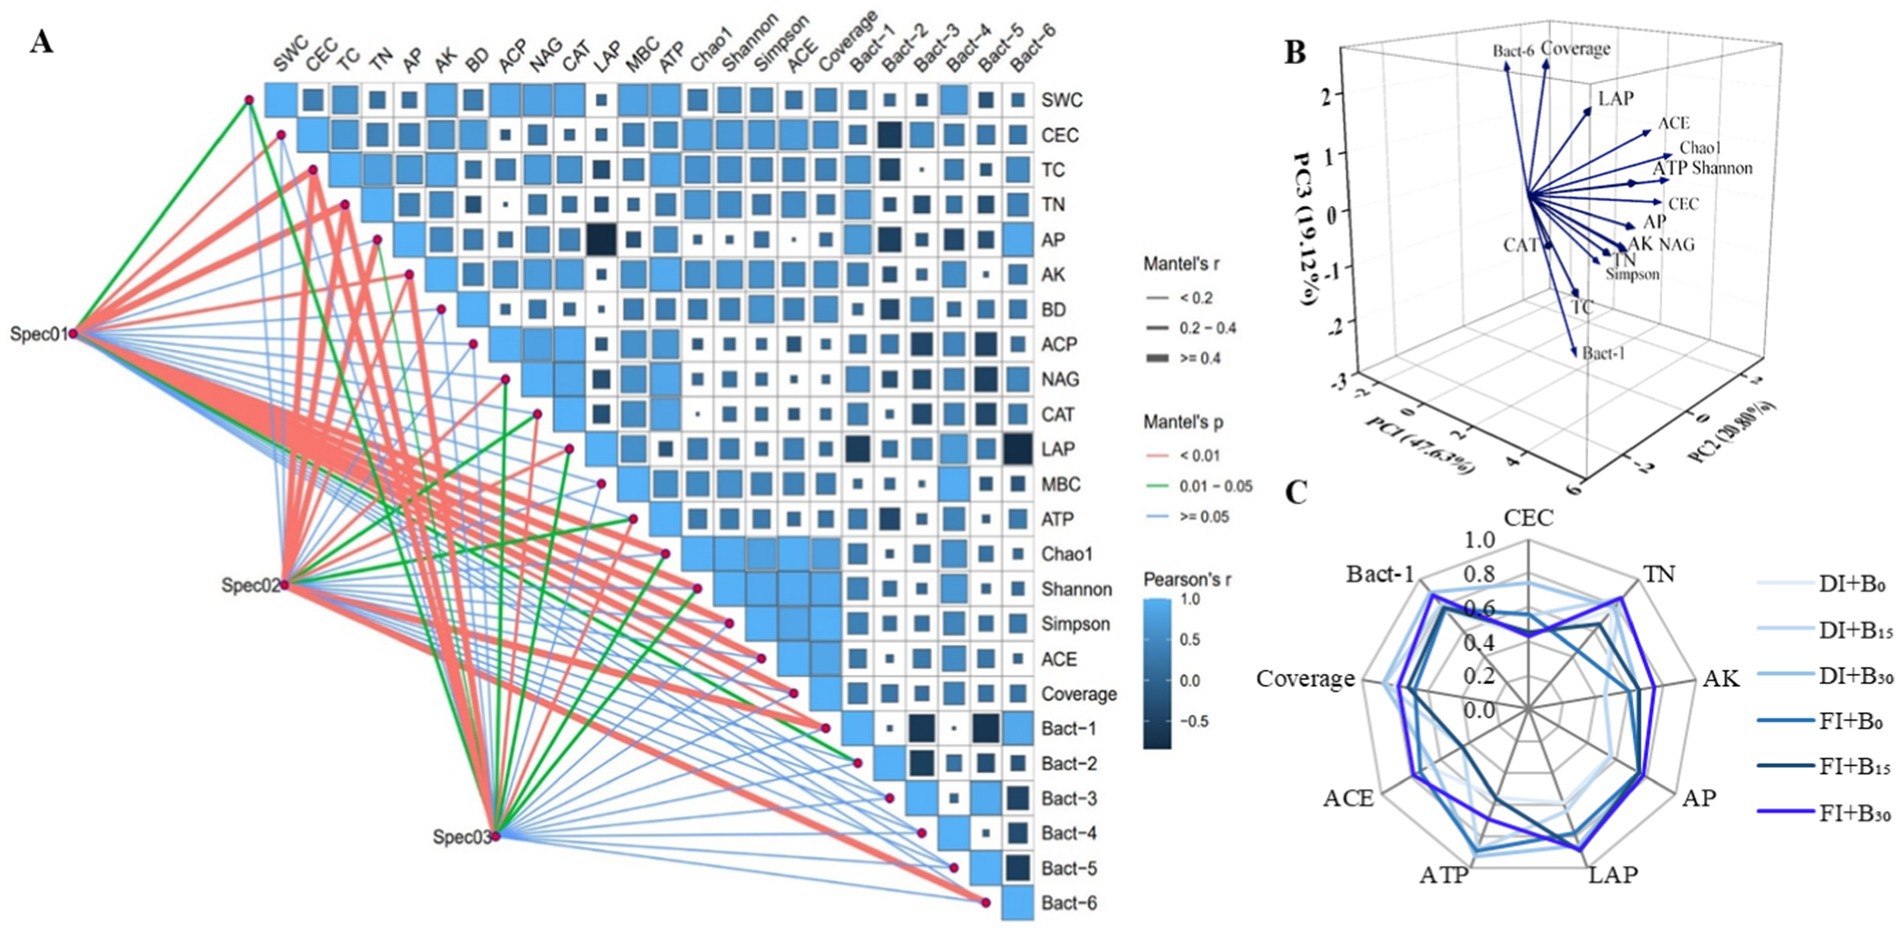
Figure 6. Correlation analysis and Mantel test analysis of soil indicators with sunflower seed quality (Spec01: crude fat, protein, arginine, valine, and proline), aboveground biomass (Spec02), and yield (Spec03) (A). Principal component analysis (PCA) of the effective indicators screened (B). Distribution of soil quality indices under different treatments (C). SWC, CEC, TC, TN, AP, AK, BD, ACP, NAG, CAT, LAP, MBC, ATP, Bact-1, Bact-2, Bact-3, Bact-4, Bact-5, and Bact-6 denote soil water content, cation exchange capacity, total carbon, total nitrogen, available phosphorus, available potassium, bulk density, acid phosphatase, N-acetyl-β-D-glucosidase, catalase, leucine aminopeptidase, microbial biomass carbon, adenosine triphosphate, Proteobacteria, Actinobacteria, Acidobacteria, Gemmatimonadetes, Chloroflexi, and Bacteroidetes, respectively. DI and FI denote deficit irrigation (60% ETc) and full irrigation (100% ETc), respectively. B0, B15, and B30 denote biochar applications of 0, 15, and 30 t ha−1, respectively.
The effective indicators were subjected to PCA (Figure 6B). Three principal components were extracted with eigenvalues greater than 1, contributing 47.6, 20.8, and 19.1%, respectively, with a cumulative contribution of 87.5%. Soil CEC, TN, AP, AK, LAP, ATP, ACE index, coverage index, and Bact-1 within 10% of the highest factor loadings of the principal components were retained as indicators of soil quality. The radar area method was used to evaluate soil quality under different treatments (Figure 6C). The results showed that the axial intersection curves differed significantly between the different irrigation levels and biochar levels and that the application of biochar significantly increased SQI (p < 0.05) compared with the no-biochar treatment under both irrigation modes. Under both irrigation modes, the B30 treatment performed better for most indicators and constituted the largest area on the radar map (DI conditions: CEC, ATP, coverage index, and Bact-1; FI conditions: TN, AK, AP, and ACE index).
Additionally, the application of biochar significantly increased SQI at different irrigation levels (p < 0.05; Figure 7A). The soil quality indices under the different treatments in descending order were as follows: DI + B30 (1.53); FI + B30 (1.47); DI + B15 (1.35); FI + B15 (1.32); FI + B0 (1.30); and DI + B0 (1.25). The DI + B30 treatment had a significantly higher SQI value than the other treatments (p < 0.05). In addition, linear regression analysis showed a significant positive correlation between SQI and sunflower yield (Figure 7B), with a coefficient of determination (R2) of 0.76.
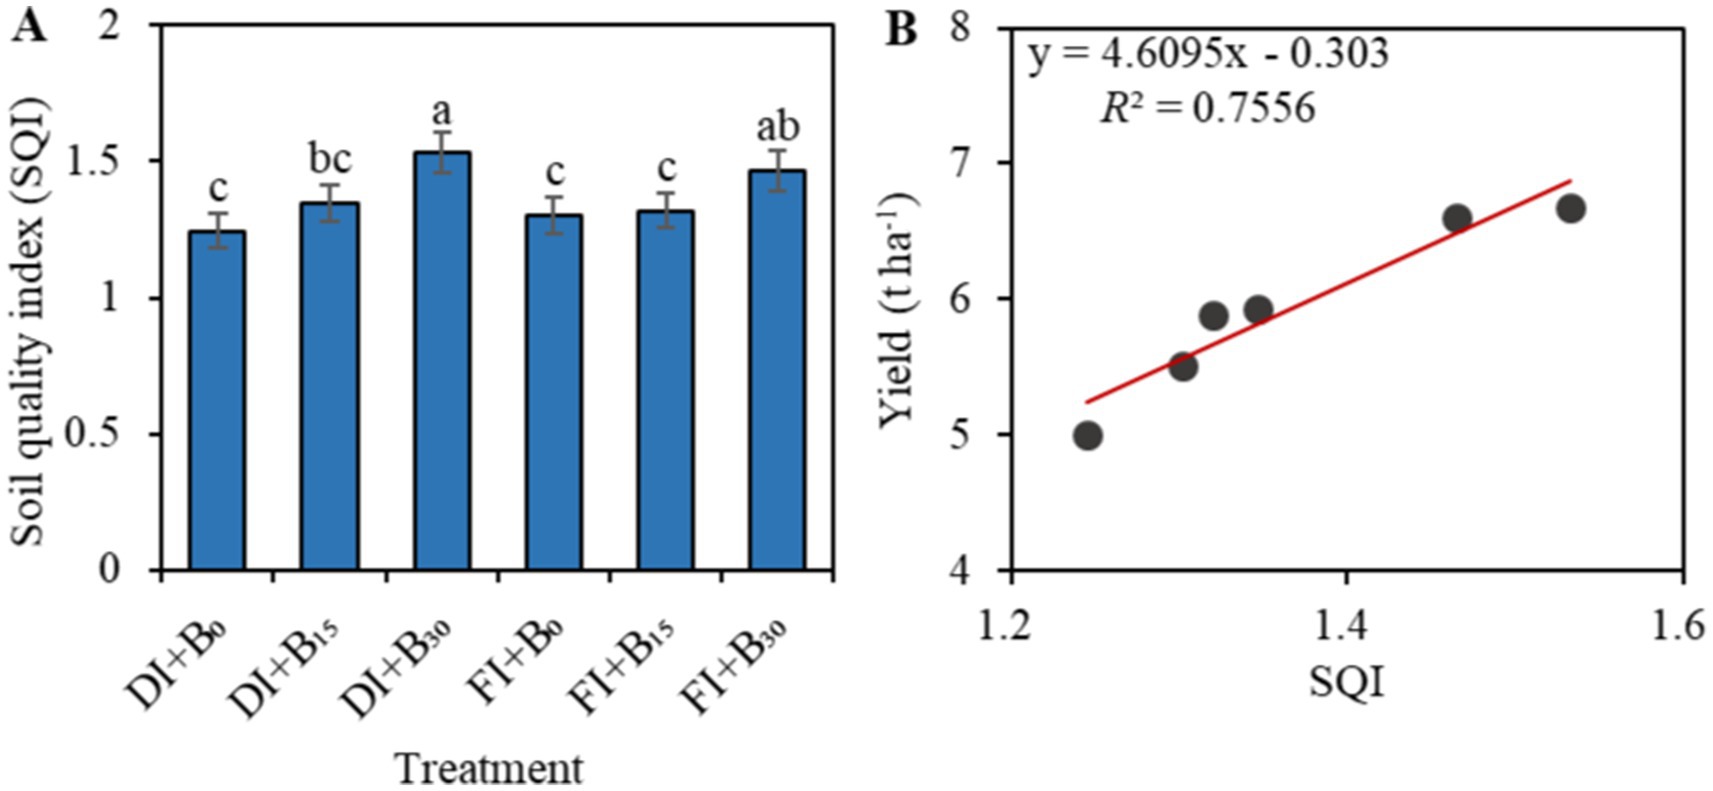
Figure 7. Differences in SQI across irrigation and biochar models (A). Fitted curves of SQI and yield (B). DI and FI denote deficit irrigation (60% ETc) and full irrigation (100% ETc), respectively. B0, B15, and B30 denote biochar applications of 0, 15, and 30 t ha−1, respectively. Different lowercase letters in a column within a factor indicate significant differences between all treatments at a p-value of < 0.05.
Our study showed that biochar application under the DI strategy had reciprocal effects on 24 environmental parameters, such as soil physics, chemistry, and biology, sunflower yield indicators, and quality, which resulted in various positive effects on overall soil quality. This confirmed and complemented the results of previous studies (Artiola et al., 2012; Chen et al., 2013; Hale et al., 2021). Under DI conditions, biochar application improved the soil environment, elevating soil nutrient content, water content, BD, enzyme activity, and microbial activity, with the DI + B30 treatment showing the greatest enhancements. Biochar application under DI conditions notably improved sunflower seed quality, aboveground biomass, and yield, demonstrating its primary influence compared to irrigation alone. Finally, a comprehensive examination of soil quality revealed that biochar application increased SQI under both irrigation modes, with SQI being significantly and positively correlated with yield. Below, we discuss potential explanations for these findings.
The results of this study showed that the addition of biochar to soil increased soil TC, TN, AP, and AK contents under DI conditions (Table 1). This is in line with the findings of other authors (Mannan et al., 2016; Zahid et al., 2018; Liu et al., 2021) who reported that owing to its ability to efficiently adsorb organic molecules in the soil, biochar induces the polymerization of small molecules into nutrient macromolecules. This may have a positive metabolic impact on microbial growth and provide a habitat for microorganisms, thereby increasing the ability of the soil to absorb nutrients (Lehmann et al., 2011; Farrell et al., 2013). However, the extent to which biochar affects soil fertility is influenced by numerous factors, including soil texture, biochar pore size distribution, and biochar surface chemistry (Gray et al., 2014). Notably, the interaction between irrigation volume and biochar can improve the physical and hydrological properties of soils, such as BD and SWC (Wei et al., 2018; Zhang et al., 2024). Consistent with other studies, we found that biochar was effective in increasing SWC and decreasing BD (Table 1), especially under FI conditions. Specifically, biochar application reduced BD by 11.0% and increased SWC by 21.2% compared to no biochar. This improvement is likely due to biochar’s lower density compared to soil, which promotes soil aggregation and increases porosity, resulting in a lower soil BD and improved soil structure (Pandian et al., 2016; Phares and Akaba, 2022). This porous structure also boosts soil water-holding capacity. Higher biochar application rates under both irrigation modes consistently increased SWC, indicating that biochar enhances soil porosity and water storage potential.
Soil microbial biomass can be considered as a potential pool of plant-available nutrients, driving material transformation and nutrient cycling in the soil (Borgogni et al., 2019). Soil enzymes, primarily produced by microorganisms, reflect soil microbial activity (Joseph et al., 2017). Irrigation, biochar, and the interaction between the two also significantly affected soil enzyme activity (Figure 2A). Among the many water-saving irrigation systems, DI has been shown to be an especially effective water-saving method (Wei et al., 2018; Yu et al., 2020). In the present study, significant increases in ACP, NAG, CAT, and LAP activities were observed under the DI biochar treatment. These results align with those of Li et al. (2010), who used three types of irrigation, namely, conventional, alternate, and fixed irrigation, on potted maize and reached similar conclusions. Specifically, alternate irrigation increased CAT, urease, and convertase activities at the pulling stage of maize, whereas partial root-zone irrigation decreased ACP activities from the pulling to the filling stage. Moreover, they found that SWC influenced soil enzyme activities, but its role varied with soil enzyme type. In the present study, the application of 15 t ha−1 biochar reduced Roland et al. (2022) and CAT activities under FI conditions compared to the no-biochar treatment, and soil enzyme activities were sensitive to changes in SWC (Figure 6A). This suggests that enzyme activities are optimized within a specific moisture range, with extremes potentially inhibiting their function. Overall, based on the results of this study, biochar application is essential for counteracting moisture deficiency impacts and potentially enhancing soil enzyme activity. However, the exact functional relationship between changes in enzyme activities remains unclear and requires further investigation.
Our results also confirmed that biochar enhances microbial activity, particularly by increasing MBC and ATP contents under DI conditions (Figures 2B,C). Currently, studies on soil ATP content in agricultural soils are scarce (Inubushi et al., 1989; Qiu et al., 2015, 2019). In our study, we found that soil ATP content increased by 2.3% under DI conditions compared with that under FI conditions. Interestingly, the addition of biochar resulted in a larger increase in ATP content, with a maximum increase of 41.5% (Figure 2C). This is consistent with the conclusion drawn by Luo et al. (2012) that biochar application contributes to a significant increase in soil ATP content by as much as 100%. Soil ATP content in biochar treatments under DI showed a similar trend to MBC over 2 years, although the FI + B30 treatment exhibited increased ATP content in 2022 compared to other treatments. This trend suggests that biochar may stimulate microbial biomass more effectively than irrigation alone. This finding is inconsistent with Chen et al. (2013), who reported no changes in MBC, MBN, or the MBC/MBN ratio in rice production areas after biochar treatment, though real-time quantitative PCR indicated an increased bacterial-to-fungal ratio. Our study supports the conclusion that biochar enhances bacterial relative abundance (Figure 3, see Subsection 4.2 for a detailed discussion), though it presents conflicting results regarding MBC. Previous studies have found that increased MBC with biochar is linked to improved soil fertility and nutrient availability, fostering microbial growth (Yao et al., 2017; Yan et al., 2022). However, the broader impacts of these changes on ecosystem carbon cycling and microbial function remain uncertain. It is worth noting that the variability in soil microbial activity and structure induced by biochar is related to differences in soil type, soil fertility, type of crop grown, and the raw materials used in its preparation. These factors help explain the observed variability, but further in-depth research is needed to clarify the specific mechanisms involved.
Soil microbial abundance, an important parameter for assessing soil quality, is rapidly changing and sensitive, playing a crucial role in carbon and nitrogen cycling processes (Wang et al., 2017; Chen et al., 2018). In this experiment, biochar application improved the α diversity index under both irrigation levels. Specifically, under DI condition, biochar significantly increased the Shannon index, with higher biochar amounts notably improving microbial diversity (Figure 4). This is inconsistent with the findings of Zhang et al. (2021), who found that both bacterial and fungal Shannon indices were significantly reduced after 2 years corn stover biochar application. We determined that this variability may be related to differences in soil type, soil utilization, and biochar characteristics, though these factors were not directly measured in our study. In addition, we found that biochar had a greater effect on soil microbial diversity than irrigation treatment. Our results suggest that while irrigation affects microbial community characteristics, alternating wet and dry conditions primarily drive short-term fluctuations in soil carbon and nitrogen availability. These fluctuations may stabilize microbial communities, minimizing the impact of irrigation treatments (Hale et al., 2021). It is hypothesized that biochar has a significant effect on microbial diversity, and there are multiple reasons why soil amendments increase the abundance of soil microbial communities. In addition to improved soil structure and soil aeration after biochar application, the relative abundances of Proteobacteria, Actinobacteria, Gemmatimonadetes, Bacteroidetes, and Chloroflexi increased simultaneously (Figure 3). According to the RDA, soil ATP, ACP, CAT, TN, and MBC were the key environmental factors causing changes in the soil bacterial communities (Figure 5). Similar results were reported by Yao et al. (2017), who indicated that soil bacterial communities were altered by the application of biochar compared to the control with no biochar applied. This change was highly correlated with soil physicochemical indicators, such as pH, TC, TN, and total phosphorus, which may lead to changes in the community structure of microorganisms because of resource competition. Biochar, with its high porosity and large specific surface area, provides a favorable breeding site for soil bacteria, enhancing their growth and relative abundance (Rillig et al., 2010). Notably, the B30 treatment reduced the abundance of soil Acidobacteria under DI conditions (Figure 3). Acidobacteria are mostly oligotrophic (Kuznetsov et al., 1979), and soil nutrient oversupply is not suitable for the growth of this group (Han et al., 2012). Based on the findings of the above studies, we can infer that biochar appears to improve soil nutrient status. However, whether this leads to a eutrophic state requires further investigation. While biochar enhances soil nutrient indices, it also affects bacterial growth differently compared to treatments without biochar. Overall, the application of biochar regulates the soil C/N ratio, and its unique structure can directly affect the physical and chemical properties and nutrient content of the soil, thereby improving the soil microbiological environment and diversity.
Stopping irrigation during the vegetative growth under limited irrigation conditions does not exert an impact on crop growth indicators or yield, highlighting limited irrigation as a strategy to improve irrigation WUE (Wang et al., 2011; Sun et al., 2014). However, in the present study, DI conditions exerted a detrimental effect on sunflower growth, but the application of biochar under DI conditions offset this negative effect. For example, sunflowers with biochar under DI conditions achieved higher yields and aboveground biomass than those with FI (Table 2). Conversely, the absence of biochar under DI conditions negatively affected sunflower growth. It is well known that the high WUE of plants treated with organic inputs is positively correlated with improved soil properties (Figure 6A, Uzoma et al., 2011). Thus, biochar has a high capacity to conserve water and nutrients, and a high amendment rate of biochar allows more nutrients to be available to plants (Table 1). In addition, biochar appeared to be more responsive to sunflower yield than irrigation alone. This confirms the findings of Jeffery et al. (2011), who found that plant responses to biochar application are more pronounced under complex conditions, such as poor soil quality, nutrient shortages, and low water-holding capacity. Biochar improves the soil environment, a key mechanism for enhancing plant yield (Lehmann et al., 2011; Liu et al., 2021; Wu et al., 2022). Additionally, as shown in Table 1, soil CEC values were approximately 11 cmol kg−1, whereas biochar had a CEC value of over 20 cmol kg−1. Typically, a higher CEC value in biochar indicates its greater capacity to adsorb positively charged nutrients, primarily due to its phenolic constituents, which help retain and absorb nutrients. Therefore, the addition of biochar with CEC values higher than soil CEC values extends the CEC of the soil and simultaneously prolongs the ability of the soil to retain water and fertilize the soil, making it more readily available for plant uptake and growth (Alfadil et al., 2021).
Global food demand has become a priority issue (Rai et al., 2019). Sunflower kernels are rich in proteins, fats, carbohydrates, fiber, minerals, and vitamins, and are a high-quality source of plant proteins that are important for sustaining life activities (Francois, 1996). Biochar and irrigation can affect crop or fruit quality (Mardani et al., 2017; Wei et al., 2020; Guo et al., 2021). In the present study, crude fat, protein, arginine, valine, and proline contents were significantly higher in the FI-treated sunflower kernels than in those treated with DI alone (Table 2). The enhanced seed quality observed under the FI treatment may be due to the need for higher water content during crop development, which enhances cellular metabolism, leading to increased release of energy and ultimately inducing seed or fruit growth. In contrast, water deficit reduces the length and width of the seed or fruit (Mardani et al., 2017), which may result in a reduction in seed quality. However, biochar application under DI conditions improved crude fat content compared to FI conditions (Table 2). Specifically, the DI + B30 treatment increased crude fat content by 7.5% compared to FI + B30. Thus, it can be found that biochar application counteracted the negative effects of deficit irrigation on seed crude fat, likely by enhancing water uptake and improving crop physiology. Currently, most studies on the effects of biochar and irrigation on crop seed or fruit quality have focused on crops such as tomatoes (Guo et al., 2021), wheat (Xu et al., 2021), and chili pepper (Mardani et al., 2017), and relatively few studies have reported on sunflower seed quality in response to biochar addition. Most researchers have attributed the improvement in crop seed and fruit quality to increased leaf photosynthesis and nutrient uptake (Mardani et al., 2017; Guo et al., 2021). In addition, from Mantel test analysis of soil and crop quality indices, CEC, TC, TN, AK, Chao1 index, Shannon index, Simpson index, ACE index, coverage index, Proteobacteria, and Chloroflexi showed highly significant positive correlations (p < 0.01; Figure 6A). Biochar also improved soil fertility conditions by improving soil nutrients, microbial activity, and other traits, affecting the inter-root environment of sunflowers, favoring sunflower nutrient uptake and utilization, and ultimately promoting sunflower seed growth and nutritional quality. In summary, the addition of biochar to soil during DI had a positive effect on sunflower yield and quality. Moreover, all quality indicators of the DI plants under the biochar treatment were significantly higher than those under the FI treatment. Therefore, combining DI with biochar may be a promising method to conserve water and improve sunflower yield and quality under limited freshwater conditions.
SQI is a comprehensive indicator of soil health and productivity, critical for sustainable agriculture (Lin et al., 2023). Using the multiple regression analysis weighting method and standardized scoring function, we found that the combination of irrigation and biochar application increased the SQI (Figures 6C, 7A). Interestingly, the increase in SQI was more pronounced in the treatments involving biochar, indicating its superior effect on improving soil quality. The SQI distribution of the combined irrigation and biochar treatments (Figure 6C) also showed that CEC, ATP, coverage index, TN, AK, AP, ACE index, and Proteobacteria performed better in soil SQI, suggesting that the biochar-imposed treatments under DI conditions improved soil physical, chemical, and biological environments, thereby enhancing soil quality (Li et al., 2019). Additionally, TC, TN, AK, CAT, and ATP showed a highly significant positive correlation (p < 0.01) with sunflower yield (Figure 6A). Biochar exhibited synergistic effects on both sunflower yield and soil quality, with SQI also being significantly positively correlated with yield (Figure 7B). Although biochar is relatively stable in the soil environment (Spokas et al., 2014), the surface properties of biochar change after the second year of addition owing to oxidation, which inevitably affects soil quality (Lucchini et al., 2014). However, Lucchini et al. (2014) found that biochar application over a 2-year period enhanced the adsorption of heavy metals, decreased soluble Cd and As in soil, and improved soil quality. Our study supports the notion that biochar continues to positively affect soil quality in the second year after application. However, the long-term impacts of combining biochar with varying irrigation strategies on soil quality beyond 2 years remain unexplored. Therefore, future research should focus on the sustainable agricultural practices of biochar application on soil quality.
A 2-year trial showed that biochar application could eliminate the negative impacts of water deficit conditions on soil quality. It also reduced soil nutrient losses and increased microbial biodiversity without compromising sunflower seed quality and yield. Specifically, under DI conditions, biochar application improved the agricultural soil environment and significantly increased the overall SQI, thereby increasing sunflower productivity (e.g., sunflower yield and aboveground biomass). Therefore, higher biochar application rates may improve sunflower seed quality. This study emphasized the synergistic effect of irrigation with 60% ETc in combination with biochar at 30 t ha−1, which is recommended for improving sunflower yield and soil quality. However, to establish sustainable agricultural practices and confirm the long-term effectiveness of biochar application, further extended research is necessary. These long-term studies will be crucial for validating the reproducibility of these results and assessing the consistent practical benefits of biochar in various agricultural systems.
The datasets presented in this study can be found in online repositories. The names of the repository/repositories and accession number(s) can be found in the article/supplementary material.
RZ: Conceptualization, Data curation, Formal analysis, Investigation, Methodology, Software, Writing – original draft. ZQ: Funding acquisition, Investigation, Software, Supervision, Visualization, Writing – review & editing. LW: Data curation, Investigation, Project administration, Visualization, Writing – review & editing. WY: Formal analysis, Funding acquisition, Investigation, Project administration, Supervision, Writing – original draft. DZ: Data curation, Investigation, Methodology, Writing – original draft. YZ: Investigation, Methodology, Writing – original draft. JL: Investigation, Methodology, Writing – original draft.
The author(s) declare that financial support was received for the research, authorship, and/or publication of this article. This study was supported by the National Natural Science Foundation of China (52279037 and 52109056), the National Key Research and Development Program of China (2021YFD1900605-08), and the Basic Research Operating Expenses Program for Colleges and Universities directly under the Inner Mongolia Autonomous Region (BR22-13-12).
We really appreciate the editor and reviewers for their profound and professional comments which greatly improved this study.
The authors declare that the research was conducted in the absence of any commercial or financial relationships that could be construed as a potential conflict of interest.
The authors declare that no Generative AI was used in the creation of this manuscript.
All claims expressed in this article are solely those of the authors and do not necessarily represent those of their affiliated organizations, or those of the publisher, the editors and the reviewers. Any product that may be evaluated in this article, or claim that may be made by its manufacturer, is not guaranteed or endorsed by the publisher.
ANOVA, Analysis of variance; AP, Available phosphorous; AT, Air temperature; BD, Bulk density; CEC, Cation exchange capacity; DI, Deficit irrigated; FI, Full irrigation; MBC, Microbial biomass carbon; MDS, Minimum data set; PCA, Principal component analysis; SQI, Soil quality index; SWC, Soil water content; TDS, Total dataset; TN, Total nitrogen; WUE, Water-use efficiency.
Abdoulaye, O. A., Lu, H., Zhu, Y., Hamoud, Y. A., and Sheteiwy, M. (2019). The global trend of the net irrigation water requirement of maize from 1960 to 2050. Climate 7:124. doi: 10.3390/cli7100124
Agbna, G. H., She, D., Liu, Z., Elshaikh, N. A., Shao, G., and Timm, L. C. (2017). Effects of deficit irrigation and biochar addition on the growth, yield, and quality of tomato. Sci. Hortic Amsterdam. 222, 90–101. doi: 10.1016/j.scienta.2017.05.004
Akhtar, S. S., Li, G. T., Andersen, M. N., and Liu, F. L. (2014). Biochar enhances yield and quality of tomato under reduced irrigation. Agric. Water Manag. 138, 37–44. doi: 10.1016/j.agwat.2014.02.016
Alfadil, A. A., Shaghaleh, H., Hamoud, Y. A., Xia, J., and Mohamed, S. S. (2021). Straw biochar-induced modification of the soil physical properties enhances growth, yield and water productivity of maize under deficit irrigation. Commun. Soil Sci. Plant 52, 1954–1970. doi: 10.1080/00103624.2021.1901913
Allen, R. G., Pereira, L. S., Raes, D., and Smith, M. (1998). Crop evapotranspiration-guidelines for computing crop water requirements-FAO irrigation and drainage paper. Vol. 56. Rome, Italy: FAO.
Aragüés, R., Medina, E. T., Zribi, W., Clavería, I., Álvaro-Fuentes, J., and Faci, J. (2015). Soil salinization as a threat to the sustainability of deficit irrigation under present and expected climate change scenarios. Irrigation Sci. 33, 67–79. doi: 10.1007/s00271-014-0449-x
Artiola, J. F., Craig, R., and Robert, F. (2012). Effects of a biochar-amended alkaline soil on the growth of Romaine lettuce and bermudagrass. Soil Sci. 177, 561–570. doi: 10.1097/SS.0b013e31826ba908
Asai, H., Samson, B. K., Stephan, H. M., Songyikhangsuthor, K., Inoue, Y., Shiraiwa, T., et al. (2009). Biochar amendment techniques for upland rice production in northern Laos: soil physical properties, leaf SPAD and grain yield. Field Crop Res. 111, 81–84. doi: 10.1016/j.fcr.2008.10.008
Asmamaw, D. K., Janssens, P., Dessie, M., Tilahun, S. A., Adgo, E., Nyssen, J., et al. (2023). Effect of deficit irrigation and soil fertility management on wheat production and water productivity in the upper Blue Nile Basin. Ethiopia. Agric. Water Manage. 277:108077. doi: 10.1016/J.AGWAT.2022.108077
Bao, S. (2000). Soil agrochemical analysis (third edition). Beijing: China Agriculture Press, 14–21.
Borgogni, F., Lavecchia, A., Mastrolonardo, G., Certini, G., Ceccherini, M. T., and Pietramellara, G. (2019). Immediate-and short-term wildfire impact on soil microbial diversity and activity in a mediterranean forest soil. Soil Sci. 184, 35–42. doi: 10.1097/SS.0000000000000250
Buchfink, B., Xie, C., and Huson, D. H. (2015). Fast and sensitive protein alignment using DIAMOND. Nat. Methods 12, 59–60. doi: 10.1038/nmeth.3176
Chen, J. L., Kang, S. Z., Du, T. S., Qiu, R. J., Guo, P., and Chen, R. Q. (2013). Quantitative response of greenhouse tomato yield and quality to water deficit at different growth stages. Agric. Water Manag. 129, 152–162. doi: 10.1016/j.agwat.2013.07.011
Chen, H., Xia, Q., Yang, T., Bowman, D., and Shi, W. (2018). The soil microbial community of turf: linear and nonlinear changes of taxa and N-cycling gene abundances over a century-long turf development. FEMS Microbiol. Ecol. 95:224. doi: 10.1093/femsec/fiy224
Dai, J., Shai, H., Tian, D., Xia, Y., and Li, M. (2011). Determined of crop coefficients of main grain and oil crops in Inner Mongolia Hetao irrigated area. J. Irrig. Drain. 30, 23–27. doi: 10.13522/j.cnki.ggps.2011.03.018
Deforest, J. (2009). The influence of time, storage temperature, and substrate age on potential soil enzyme activity in acidic forest soils using MUB-linked substrates and l -DOPA. Soil Biol. Biochem. 41, 1180–1186. doi: 10.1016/j.soilbio.2009.02.029
Faloye, O. T., Alatise, M. O., Ajayi, A. E., and Ewuloc, B. S. (2019). Effects of biochar and inorganic fertiliser applications on growth, yield and water use efficiency of maize under deficit irrigation. Agric. Water Manag. 217, 165–178. doi: 10.1016/j.agwat.2019.02.044
Farhangi, A. S., Torabian, S., Qin, R., Noulas, C., Lu, Y., and Gao, S. (2021). Biochar effects on yield of cereal and legume crops using meta-analysis. Sci. Total Environ. 775:145869. doi: 10.1016/j.scitotenv.2021.145869
Farrell, M., Kuhn, T. K., Macdonald, L. M., Maddern, T. M., Murphy, D. V., Hall, P. A., et al. (2013). Microbial utilisation of biocharderived carbon. Sci. Total Environ. 465, 288–297. doi: 10.1016/j.scitotenv.2013.03.090
Fernandez, M. D., Gallardo, M., Bonachwla, S., Orgaz, F., Thompson, R. B., and Fereres, F. (2005). Water use and production of a greenhouse pepper crop under optimum and limited water supply. J. Hort. Sci. 80, 87–96. doi: 10.1080/14620316.2005.11511897
Francois, L. E. (1996). Salinity effects on four sunflower hybrids. Agron. J. 88, 215–219. doi: 10.2134/agronj1996.00021962008800020016x
Gray, M., Johnson, M. G., Dragila, M. I., and Kleber, M. (2014). Water uptake in biochars: the roles of porosity and hydrophobicity. Biomass Bioenergy 61, 196–205. doi: 10.1016/j.biombioe.2013.12.010
Guo, L., Yu, H., Kharbach, M., Zhang, W., Wang, J., and Niu, W. (2021). Biochar improves soil-tomato plant, tomato production, and economic benefits under reduced nitrogen application in northwestern China. Plan. Theory 10:759. doi: 10.3390/PLANTS10040759
Hale, L., Curtis, D., Azeem, M. J., Crowley, D. E., and Mcgiffen, M. E. (2021). Influence of compost and biochar on soil biological properties under turfgrass supplied deficit irrigation. Appl. Soil Ecol. 168:104134. doi: 10.1016/J.APSOIL.2021.104134
Han, D., Hao, Z., Gao, G., and Wang, Y. (2012). Ecological function of oligotrophic bacteria and their applications in the environment. Microbiol. China 39, 526–535. doi: 10.13344/j.microbiol.china.2012.04.006
Hang, X., and Song, J. (2022). Drivers of the irrigation water rebound effect: a case study of Hetao irrigation district in Yellow River basin. China. Agric. Water Manag. 266:107567. doi: 10.1016/J.AGWAT.2022.107567
Hou, J., Zhang, J., Liu, X., Ma, Y., Wei, Z., Wan, H., et al. (2023). Effect of biochar addition and reduced irrigation regimes on growth, physiology and water use efficiency of cotton plants under salt stress. Ind. Crop. Prod. 198:116702. doi: 10.1016/j.indcrop.2023.116702
Inubushi, K., Brookes, P. C., and Jenkinson, D. S. (1989). Adenosine 5′-triphosphate and adenylate energy charge in waterlogged soil. Soil Biol. Biochem. 21, 733–739. doi: 10.1016/0038-0717(89)90072-2
Jeffery, S., Verheijen, F. G., van der Velde, M., and Bastos, A. C. (2011). A quantitative review of the effects of biochar application to soils on crop productivity using meta-analysis. Agric. Ecosyst. Environ. 144, 175–187. doi: 10.1016/j.agee.2011.08.015
Jia, Y., Guo, H., Xi, B., Jiang, Y., Zhang, Z., Yuan, R., et al. (2017). Sources of groundwater salinity and potential impact on arsenic mobility in the western Hetao Basin, Inner Mongolia. Sci. Total Environ. 601-602, 691–702. doi: 10.1016/j.scitotenv.2017.05.196
Joseph, E. K., Emily, B. G., Scott, F., Aurélien, L., Amanda, L., John, L. D., et al. (2017). Rapid shifts in soil nutrients and decomposition enzyme activity in early succession following forest fire. Forests 8, 347–353. doi: 10.3390/f8090347
Kuznetsov, S. I., Dubinina, G. A., and Lapteva, N. A. (1979). Biology of oligotrophic Bacteria. Ann. Rev. Microbiol. 33, 377–387. doi: 10.1146/annurev.mi.33.100179.002113
Lehmann, J., Rillig, M. C., Thies, J., Masiello, C. A., Hockaday, W. C., and Crowley, D. (2011). Biochar effects on soil biota-a review. Soil Biol. Biochem. 43, 1812–1836. doi: 10.1016/j.soilbio.2011.04.022
Li, X., Wang, D., Ren, Y., Zhang, Z., and Zhou, Y. (2019). Soil quality assessment of croplands in the black soil zone of Jilin pro-vince, China: establishing a minimum data set model. Ecol. Indic. 107:105251. doi: 10.1016/j.ecolind.2019.03.028
Li, F., Yu, J., Nong, M., Kang, S., and Zhang, J. (2010). Partial root-zone irrigation enhanced soil enzyme activities and water use of maize under different ratios of inorganic to organic nitrogen fertilizers. Agric. Water Manag. 97, 231–239. doi: 10.1016/j.agwat.2009.09.014
Lin, S. D., Lei, Q. Y., Liu, Y., Zhao, Y. M., Su, L. J., Wang, Q. J., et al. (2023). Quantifying the impact of organic fertilizers on soil quality under varied irrigation water sources. Water 15:3618. doi: 10.3390/w15203618
Liu, X., Kiril, M., Liu, F., and Mathias, N. A. (2022). Biomass accumulation and water use efficiency of faba bean-ryegrass intercropping system on sandy soil amended with biochar under reduced irrigation regimes. Agric. Water Manag. 273:107905. doi: 10.1016/J.AGWAT.2022.107905
Liu, X., Wei, Z., Ma, Y., Liu, J., and Liu, F. (2021). Effects of biochar amendment and reduced irrigation on growth, physiology, water-use efficiency and nutrients uptake of tobacco (Nicotiana tabacum L.) on two different soil types. Sci. Total Environ. 770:144769. doi: 10.1016/j.scitotenv.2020.144769
Lucchini, P., Quilliam, R. S., DeLuca, T. H., Vamerali, T., and Jones, D. L. (2014). Does biochar application alter heavy metal dynamics in agricultural soil? Agric. Ecosyst. Environ. 184, 149–157. doi: 10.1016/j.agee.2013.11.018
Luo, Y., Durenkamp, M., De, N. M., Lin, Q., Devonshire, B. J., and Brookes, P. C. (2012). Microbial biomass growth, following incorporation of biochars produced at 350 °C or 700 °C, in a silty-clay loam soil of high and low pH. Soil Biol. Biochem. 57, 513–523. doi: 10.1016/j.soilbio.2012.10.033
Mannan, M. A., Halder, E., Karim, M. A., and Ahmed, J. U. (2016). Alleviation of adverse effect of drought stress on soybean (Glycine max. L.) by using poultry litter biochar. Bangladesh. Agron. J. 19, 61–69. doi: 10.3329/baj.v19i2.31854
Mardani, S., Tabatabaei, S. H., Pessarakli, M., and Zareabyaneh, H. (2017). Physiological responses of pepper plant (Capsicum annuum L.) to drought stress. J. Plant Nut. 40, 1453–1464. doi: 10.1080/01904167.2016.1269342
Mounzer, O., Pedrero-Salcedo, F., Nortes, P. A., José-Maria, B., Nicolás-Nicolás, E., and Alarcón-Transient, J. J. (2013). Transient soil salinity under the combined effect of reclaimed water and regulated deficit drip irrigation of mandarin trees. Agric. Water Manag. 120, 23–29. doi: 10.1016/j.agwat.2012.10.014
Pandian, K., Subramaniayan, P., Gnasekaran, P., and Chitraputhirapillai, S. (2016). Effect of biochar amendment on soil physical, chemical and biological properties and groundnut yield in rainfed Alfisol of semi-arid tropics. Arch. Agron. Soil Sci. 62, 1293–1310. doi: 10.1080/03650340.2016.1139086
Phares, C. A., and Akaba, S. (2022). Co-application of compost or inorganic NPK fertilizer with biochar influenced soil quality, grain yield and net income of rice. J. Integr. Agric. 21, 3600–3610. doi: 10.1016/j.jia.2022.07.041
Qiu, G., Chen, Y., Luo, Y., Xu, J., and Brookes, P. C. (2015). The microbial ATP concentration in aerobic and anaerobic Chinese soils. Soil Biol. Biochem. 92, 38–40. doi: 10.1016/j.soilbio.2015.09.009
Qiu, G., Zhu, M., Meng, J., Luo, Y., Di, H., Xu, J., et al. (2019). Changes in soil microbial biomass C, ATP and microbial ATP concentrations due to increasing soil cd levels in Chinese paddy soils growing rice (Oryza sativa). Plant Soil 436, 1–12. doi: 10.1007/s11104-018-03899-6
Rai, P. K., Lee, S. S., Zhang, M., Tsang, Y. F., and Kim, K. H. (2019). Heavy metals in food crops: health risks, fate, mechanisms, and management. Environ. Int. 125, 365–385. doi: 10.1016/j.envint.2019.01.067
Rillig, M. C., Wagner, M., Salem, M., George, C., Ramke, H. G., Titirici, M. M., et al. (2010). Material derived from hydrothermal carbonization: effects on plant growth and arbuscular mycorrhiza. Appl. Soil Ecol. 45, 238–242. doi: 10.1016/j.apsoil.2010.04.011
Roland, V., Ulrike, D., Maria, E. P., Yao, P., Anupam, S., Qiu, C. X., et al. (2022). Stable carbon isotopic composition of biomass burning emissions – implications for estimating the contribution of C3 and C4 plants. Atmos. Chem. Phys. 22, 2871–2890. doi: 10.5194/acp-22-2871-2022
Saiya, C. K. R., Sinsabaugh, R. L., and Zak, D. R. (2002). The effects of long term nitrogen deposition on extracellular enzyme activity in an Acer saccharum forest soil. Soil Biol. Biochem. 34, 1309–1315. doi: 10.1016/S0038-0717(02)00074-3
Schloss, P. D., Gevers, D., and Westcott, S. L. (2011). Reducing the effects of PCR amplification and sequencing artifacts on 16S rRNA-based studies. PLoS One 6:e27310. doi: 10.1371/journal.pone.0027310
Sermons, S. M., Sinclair, T. R., Seversike, T. M., and Rufty, T. W. (2017). Assessing transpiration estimates in tall fescue: the relationship among transpiration, growth, and vapor pressure deficits. Environ. Exp. Bot. 137, 119–127. doi: 10.1016/j.envexpbot.2017.02.003
Spokas, K. A., Novak, J. M., Masiello, C. A., Johnson, M. G., Colosky, E. C., Ippolito, J. A., et al. (2014). Physical disintegration of biochar: an overlooked process. Environ. Sci. Technol. Lett. 1, 326–332. doi: 10.1021/ez500199t
Sun, Z., Bruun, E. W., Arthur, E. L. W., Moldrup, J. P., Hauggaard-Nielsen, H., and Elsgaar, H. (2014). Effect of biochar on aerobic processes, enzyme activity, and crop yields in two sandy loam soils. Biol. Fert. Soils 50, 1087–1097. doi: 10.1007/s00374-014-0928-5
Uzoma, K. C., Inoue, M., Andry, H., Zahoor, A., and Nishihara, E. (2011). Influence of biochar application on sandy soil hydraulic properties and nutrient retention. J. Food. Agric. Environ. 127, 516–522. doi: 10.1016/j.foodchem.2011.01.033
Vance, E. D., Brookes, P. C., and Jenkinson, D. S. (1987). An extraction method for measuring soil microbial biomass C. Soil Biol. Biochem. 19, 703–707. doi: 10.1016/0038-0717(87)90052-6
Wang, F., Kang, S., Du, T., Li, F., and Qiu, R. (2011). Determination of comprehensive quality index for tomato and its response to different irrigation treatments. Agric. Water Manag. 98, 1228–1238. doi: 10.1016/j.agwat.2011.03.004
Wang, H., Marshall, C. W., Cheng, M., Xu, H., Li, H., Yang, X., et al. (2017). Changes in land use driven by urbanization impact nitrogen cycling and the microbial community composition in soils. Sci. Rep. 7:44049. doi: 10.1038/srep44049
Wei, Z., Du, T., Li, X., Fang, L., and Liu, F. (2018). Interactive effects of CO2 concentration elevation and nitrogen fertilization on water and nitrogen use efficiency of tomato grown under reduced irrigation regimes. Agric. Water Manag. 202, 174–182. doi: 10.1016/j.agwat.2018.02.027
Wei, M., Liu, X., He, Y., Xu, X., Wu, Z., Yu, K., et al. (2020). Biochar inoculated with Pseudomonas putida improves grape (Vitis vinifera L.) fruit quality and alters bacterial diversity. Rhizosphere 16:100261. doi: 10.1016/j.rhisph.2020.100261
Wu, Z., Fan, Y., Qiu, Y., Hao, X., Li, S., and Kang, S. (2022). Response of yield and quality of greenhouse tomatoes to water and salt stresses and biochar addition in Northwest China. Agric. Water Manag. 270:107736. doi: 10.1016/J.AGWAT.2022.107736
Xie, W., Chen, Q., Wu, L., Yang, H., Xu, J., and Zhang, Y. (2020). Coastal saline soil aggregate formation and salt distribution are affected by straw and nitrogen application: a 4-year field study. Soil Tillage Res. 198:104535. doi: 10.1016/j.still.2019.104535
Xu, G., Lu, D., Wang, H., and Li, Y. (2018). Morphological and physiological traits of rice roots and their relationships to yield and nitrogen utilization as influenced by irrigation regime and nitrogen rate. Agric. Water Manag. 203, 385–394. doi: 10.1016/j.agwat.2018.02.033
Xu, Y., Song, Z., Chang, X., Guo, Z., and Gao, M. (2021). Effects of Fe-Mn oxide-modified biochar composite applications on phthalate esters (PAEs) accumulation in wheat grains and grain quality under PAEs-polluted brown soil. Ecotoxicol. Environ. Saf. 208:111624. doi: 10.1016/j.ecoenv.2020.111624
Yan, S., Zhang, S., Yan, P., and Muhammad, A. (2022). Effect of biochar application method and amount on the soil quality and maize yield in Mollisols of Northeast China. Biochar 4:56. doi: 10.1007/S42773-022-00180-Z
Yang, C., Luo, Y., Sun, L., and Wu, N. (2015). Effect of deficit irrigation on the growth, water use characteristics and yield of cotton in arid Northwest China. Pedosphere 25, 910–924. doi: 10.1016/S1002-0160(15)30071-0
Yang, W., Zhang, R., Yang, Y., Ji, W., Zhang, X., and Qu, Z. (2023). Evaluation of net carbon sequestration and ecological benefits from biochar-incorporated sorghum farmland in arid salinized areas of Inner Mongolia. J. Environ. Manag. 351:119979. doi: 10.1016/j.jenvman.2023.119979
Yao, Q., Liu, J., Yu, Z., Li, Y., Jin, J., Liu, X., et al. (2017). Changes of bacterial community compositions after three years of biochar application in a black soil of Northeast China. Appl. Soil Ecol. 113, 11–21. doi: 10.1016/j.apsoil.2017.01.007
Yu, L., Zhao, X., Gao, X., and Siddique, K. H. (2020). Improving/maintaining water use efficiency and yield of wheat by deficit irrigation: a global meta-analysis. Agric. Water Manag. 228:105906. doi: 10.1016/j.agwat.2019.105906
Zahid, Z., Iftikhar, S., Ahmad, K. S., and Gul, M. M. (2018). Low-cost and environmental-friendly Triticum aestivum - derived biochar for improving plant growth and soil fertility. Commun. Soil Sci. Plant Anal. 49, 2814–2827. doi: 10.1080/00103624.2018.1546869
Zhang, R., Qu, Z., Yang, W., Li, J., Wang, L., Liu, Q., et al. (2024). Evaluating annual soil carbon emissions under biochar-added farmland subjecting from freeze-thaw cycle. J. Environ. Manag. 365:121506. doi: 10.1016/J.JENVMAN.2024.121506
Zhang, H., Wang, S., Zhang, J., Tian, C., and Luo, S. (2021). Biochar application enhances microbial interactions in mega-aggregates of farmland black soil. Soil Till. Res. 213:105145. doi: 10.1016/j.still.2021.105145
Keywords: biochar, deficient irrigation, soil enzyme activities, bacterial diversity, seed quality
Citation: Zhang R, Qu Z, Wang L, Yang W, Zhang D, Zhao Y and Li J (2025) Enhancing soil microbial diversity, quality, and crop growth through deficit irrigation combined with biochar application. Front. Sustain. Food Syst. 9:1528044. doi: 10.3389/fsufs.2025.1528044
Edited by:
Jiaping Liang, Kunming University of Science and Technology, ChinaCopyright © 2025 Zhang, Qu, Wang, Yang, Zhang, Zhao and Li. This is an open-access article distributed under the terms of the Creative Commons Attribution License (CC BY). The use, distribution or reproduction in other forums is permitted, provided the original author(s) and the copyright owner(s) are credited and that the original publication in this journal is cited, in accordance with accepted academic practice. No use, distribution or reproduction is permitted which does not comply with these terms.
*Correspondence: Zhongyi Qu, cXV6aG9uZ3lpQGltYXUuZWR1LmNu
Disclaimer: All claims expressed in this article are solely those of the authors and do not necessarily represent those of their affiliated organizations, or those of the publisher, the editors and the reviewers. Any product that may be evaluated in this article or claim that may be made by its manufacturer is not guaranteed or endorsed by the publisher.
Research integrity at Frontiers
Learn more about the work of our research integrity team to safeguard the quality of each article we publish.