 Feifei Lu1
 Minchen An
95% of researchers rate our articles as excellent or good
Learn more about the work of our research integrity team to safeguard the quality of each article we publish.
Find out more
ORIGINAL RESEARCH article
Front. Sustain. Food Syst. , 07 February 2025
Sec. Agricultural and Food Economics
Volume 9 - 2025 | https://doi.org/10.3389/fsufs.2025.1521229
This article is part of the Research Topic Enhancing Food Security and Trade Resilience in Sustainable Agricultural Systems View all 19 articles
Silk and silk products have become one of the world's most vital traded commodities and China is the world's largest producer and exporter of silk products. This study uses statistical data on silk products trade of twenty-nine countries, who are main partners of China's silk trade. The data are mainly from the UN Comtrade database for the years 2002–2022. Utilizing the Constant Market Share (CMS) model, it analyzes the current status of China's silk product export trade. The study decomposes the factors influencing the export growth of silk products between China and other countries. The results indicate that from 2002 to 2022, China's export growth of silk products to other countries was mainly driven by increased export competitiveness. Specifically, silk and satin products and natural silk products have strong export competitiveness, while secondary silk products constrain export growth. In comparison, the dominant factor driving other countries' silk products export to China was the increasing demand in the Chinese market. Market fluctuations caused by the economic crisis and the epidemic have had an impact on the export value of natural silk products and silk and satin products, while secondary silk products, which have the highest value-added, have shown strong competitiveness.
Since ancient times, silk has been known for its unique comfort, luster and charm. It has been the most popular fiber all over the world (Sundari and Ramalakshmi, 2018). The silk industry consists of mulberry cultivation, sericulture, and silk reeling and weaving, which involves agriculture, industry and services, and it occupies a vital position in the industrial sector. There is a sustainable demand for silk due to its wide use in important fields such as the textile industry, medicine and computer science (Furdui et al., 2010; Popescu, 2013). The industry is also of special strategic significance for rural development and poverty reduction (Halagundegowda et al., 2021), because the sericulture and silk industry is highly labor intensive but has high value added (Anitha, 2011; Ashfaq and Aslam, 2006).
Silk and silk products have become one of the most important traded commodities in the world, as well as a key part of international trade in agricultural products. Despite the low production of silk, which accounts for only 0.2% of the global textile fiber market, its trade value is in billions of dollars (Kumaresan et al., 2021). With the economic and social development, sericulture and silk processing industry has been changing from a labor-intensive industry to a capital-intensive industry. The advantages of resources and technology of developed countries and the advantages of labor resources in developing countries are constantly changing the evolution of the production and trade pattern of silk products in the context of deepening economic globalization.
China is the birthplace of silk and has been producing silk for thousands of years, and silk has long been one of China's most representative export commodities. Especially after joining the WTO, China has gradually become the world's largest producer and exporter of silk products. Its natural silk, silk and satin, and secondary silk products trade have accounted for 63.38%, 46.91% and 15.35% of the world, respectively. In addition, China's silk product trade has been in a surplus position in the international silk trade in the long-run, and has become one of China's industries with a monopoly status. However, trade volatility has become a prominent issue in recent years. The complex and volatile global economic landscape coupled with the global financial crisis and subsequent recession in major economies has led to a significant contraction in consumer demand for silk products. Therefore, studying the trade fluctuation and the relevant influencing factors of China's silk products can not only explore the economic law of multilateral trade in silk, but also optimize the world silk industry chain. This study decomposes the factors affecting the trade fluctuations between China and its major trade partner countries of silk products based on data from 2002 to 2022. The heterogeneity of influences across different periods and across various categories of silk products is analyzed.
This paper tries to make up for the shortages identified in the existing research by two aspects of contributions. First, it analyzes the impacts of various factors on the silk trade between China and its trade partners from the perspective of both the silk products as a whole and the heterogeneity across different categories of silk products. The results drawn from the analyses can be applied to the high quality and sustainable development of the silk industry and its segmented products for various silk production and trade countries. Second, a modified Constant Market Share (CMS) model is introduced to quantitatively decompose the influencing factors of trade fluctuations in silk products, as well as the significance and trend of each factor, based on the trade data of Chinese silk products from 2002 to 2022.
The remainder of this article is organized as follows. Section 2 presents the current situation of China's import and export trade of silk products, i.e., the export trade scale, product and market structure of silk products trade. Section 3 is dedicated to the data and methods. The revised CMS model used in this article is introduced, and its theoretical basis and mechanism are analyzed. The empirical results and discussions on the trade fluctuations of silk products trade between China and other countries are presented in Section 4. The last section summarizes the results and proposes policy recommendations.
As a textile product with a long history and unique charm, silk plays an important role in global economic and cultural exchanges (Loewe, 1971). With the deepening trend of economic globalization and the upgrading of the structure of the world's silk industry, the pattern of international silk trade has also undergone significant changes (Shu, 2019). Currently, nearly 70 countries and regions around the world produce silk as well as silk-processed products, the vast majority of which are developing countries, the major ones being China, India, Vietnam, Uzbekistan, Brazil and Thailand (Gu, 2001). China is the world's largest producer and trader of silk, and India is the world's second largest producer of silk and raw silk and the largest consumer of silk (Feng et al., 2009). These countries have good natural conditions for mulberry planting and sericulture as well as advanced production technology and a large number of laborers, which are the main bases for silk production and export (Popescu, 2018).
The international trade market of the silk is complex and dynamically changing. After a long period of low silk prices, silk prices have rebounded to more than 55$/kg, stimulating the recovery of the silk cocoon and raw silk trade in many countries (Popescu, 2018). Madsen (2012) show that technological improvements, such as the introduction of sericulture hybrids, can increase silk production, which in turn affects silk exports. In addition, changes in international market demand, adjustments in trade policies, and geopolitical factors also have a profound impact on silk trade (Popescu, 2018). The trade volume of silk products varies greatly among different types of products. Woven fabrics are more expensive in the export market, while the import price of raw silk and silk yarn is relatively low (Gu, 2001). As the cocoon and silk industry is a more typical labor-intensive industry, the impact of international market fluctuations on the industry is very significant, and the major silk-exporting countries have transformed their export trade mode from quantitative expansion to winning in quality and efficiency (Feng et al., 2009; Zhang et al., 2018).
Scholars have launched a series of studies on the main factors causing fluctuations in China's silk export trade. From the comparative advantages of China's silk products and international competitiveness, silk is a product with strong competitive advantages in China (Gu and Zhang, 2002). From the analysis of export trade of various products, raw materials such as silk and semi-finished products such as silk satin have strong competitive advantages in the international market, while the competitiveness of women's shirts and other silk products is weaker (Fan and Chen, 2013). The size of the international silk market and the domestic production of raw silk affect China's raw silk export trade, with the reduction in the size of the international silk market being the main reason for the serious difficulties faced by China's silk industry, and oversupply due to the rapid expansion of the size of the domestic silk industry being a secondary reason (Lin et al., 2006). The trade facilitation of the Belt and Road partners has great potential to promote the development of China's silk export trade, and it can effectively promote silk export trade goods to the international market (Ren and Gu, 2019). In addition, the GDP of silk importing countries, the geographical distance between China and silk importing countries, the bilateral real exchange rate and China's accession to the WTO also have a significant impact on China's silk export trade (Huo and Lin, 2008). Cross-sectional comparisons based on China's major textile export complexity indicators and longitudinal comparisons of China's silk industry export complexity indicators with other silk exporting countries show that China is only a major silk exporting country, not a silk technology powerhouse (Gu and Fang, 2013).
Currently, there are relatively limited studies on China's trade fluctuations in silk products. The existing literature mainly carries out qualitative research and descriptive statistical analysis to analyze the characteristics and development trends of trade in silk products between China and its major trading partners in terms of silk product production, trade product structure, and trade country characteristics (Liu et al., 2006; Feng and Teng, 2012), and only a few scholars utilize the application of econometric models to analyze China's export trade of silk products and its fluctuations from the perspectives of trade competitiveness and development potential (Gu and Zhang, 2002; Fan and Chen, 2013; Wang L. et al., 2017; Huo and Lin, 2008). The existing literature rarely uses the constant market share model to analyze the factors affecting the trade volatility of China's silk products, nor does it systematically analyze the extent to which natural silk products, silk and satin products, and secondary silk products in the silk industry chain affect their respective trade volatility.
Regression models have been widely applied to analyze the relationship between a single specific variable and export trade volatility by using time series data (Chiou-Wei and Zhu, 2002; Karagöz, 2016; Azar and Ciabuschi, 2017; Ahmadi-Esfahani, 2006). In recent years, for example, gravity models have been applied more to bilateral trade studies (Wang et al., 2022; Masood et al., 2023; Nasrullah et al., 2020; Leng et al., 2020). The trade gravity models often include dummy variables, such as common borders, common language, common religion, etc., as well as institutional indicator variables, such as whether they belong to the same preferential trade agreement or regional integration organization. Such variables that affect export trade volatility are infinite (Widodo, 2010) and most of these variables are not easily and accurately measured, therefore such models can only be used to study the few factors that affect export trade volatility.
The CMS model is one of the main methods used internationally by scholars to study the dynamics of countries' exports and the factors that influence them (Batista, 2008; Merkies and van der Meer, 1988). It was first proposed and applied to the study of world trade by Tyszynski (1951) and refined by Fagerberg and Sollie (1987). In subsequent studies by Jepma (1989), Milana (1988), and Leamer and Stern (2017), The first-level effects were further refined to form a two-level decomposition of the CMS model. The CMS model does not attempt to explain how a particular economic variable affects the volume of export trade; it divides the fluctuations in the volume of export trade into three components, structural effect, competitiveness effect and second-order effect, each with different economic significance (Hatsopoulos and Krugman, 1987; Muhammad and Yaacob, 2008). In addition, the CMS model is able to analyze export volatility comprehensively and accurately with simple and easily available trade data (Wang Z. X. et al., 2017). In a way, the CMS model is a more “macro” analytical framework than other empirically constructed models, making it an important complement to other empirical models used to study the effects of specific variables (Widodo, 2010).
Currently, many scholars utilize the CMS model to study international trade, and most of the studies focus on analyzing the influencing factors of trade fluctuations of specific products, such as aquatic products (Dai et al., 2020), tobacco products (Ruitao et al., 2018), nuts (Aguiar et al., 2017), new energy products (Wang Z. X. et al., 2017). Scholars also take a regional perspective to study the trade between exporting countries and other countries as well as major regions (organizations) in the world, such as the Asian market (Chen and Duan, 2001), the European Union (EU), the North American Free Trade Area (NAFTA), North-East Asia and ASEAN (Widodo, 2010; Abdul et al., 2022), Central and Eastern Europe (CEE) countries (Liu and Xiao, 2018).
The export and import trade value, product structure and market structure of China's silk products are depicted and analyzed in this section.
From 2002 to 2022, the global silk trade exhibited considerable fluctuations. Beginning in 2002, silk trade experienced rapid growth, increasing from US 3.874 billion to US 5.035 billion and reaching its peak in 2008 (Figure 1). Following this peak, the trade volume fluctuated and declined to US 3.507 billion. China, as the largest silk producer and trader worldwide, has consistently maintained a significant position in the global silk market. In 2022, China's import and export of silk products accounted for 32.6% of the global total, highlighting its integral role in the international silk industry.

Figure 1. Changes of China and Global Trade in Silk Products from 2002 to 2022 (million US dollars). Data source: UN Comtrade database.
Similarly, China's silk trade also demonstrated notable volatility during the same period, as shown in Table 1. After joining the World Trade Organization, China's total silk trade surged from US 1.228 billion in 2002 to US 2.130 billion in 2008, achieving an average annual growth rate of 10%. This growth significantly outpaced the global silk trade growth rate of 3.88%. However, the global financial crisis led to a 12.4% decline in China's silk product trade in 2009 compared to the previous year. Although silk exports began to recover in 2010, the growth rate remained modest at 3.92%, below the earlier 10% rate. Subsequently, factors such as the global economic slowdown and regional instability caused the total trade volume to decrease from US 1.799 billion in 2015 to US 1.386 billion in 2019, with an average annual growth rate of −8.62%. Notably, in 2014, India and the European Union surpassed China, marking a significant turning point (Huang and He, 2022). Finally, after reaching a low of US 801 million in 2020, China's silk trade volume rebounded rapidly to US 1.377 billion in 2022.
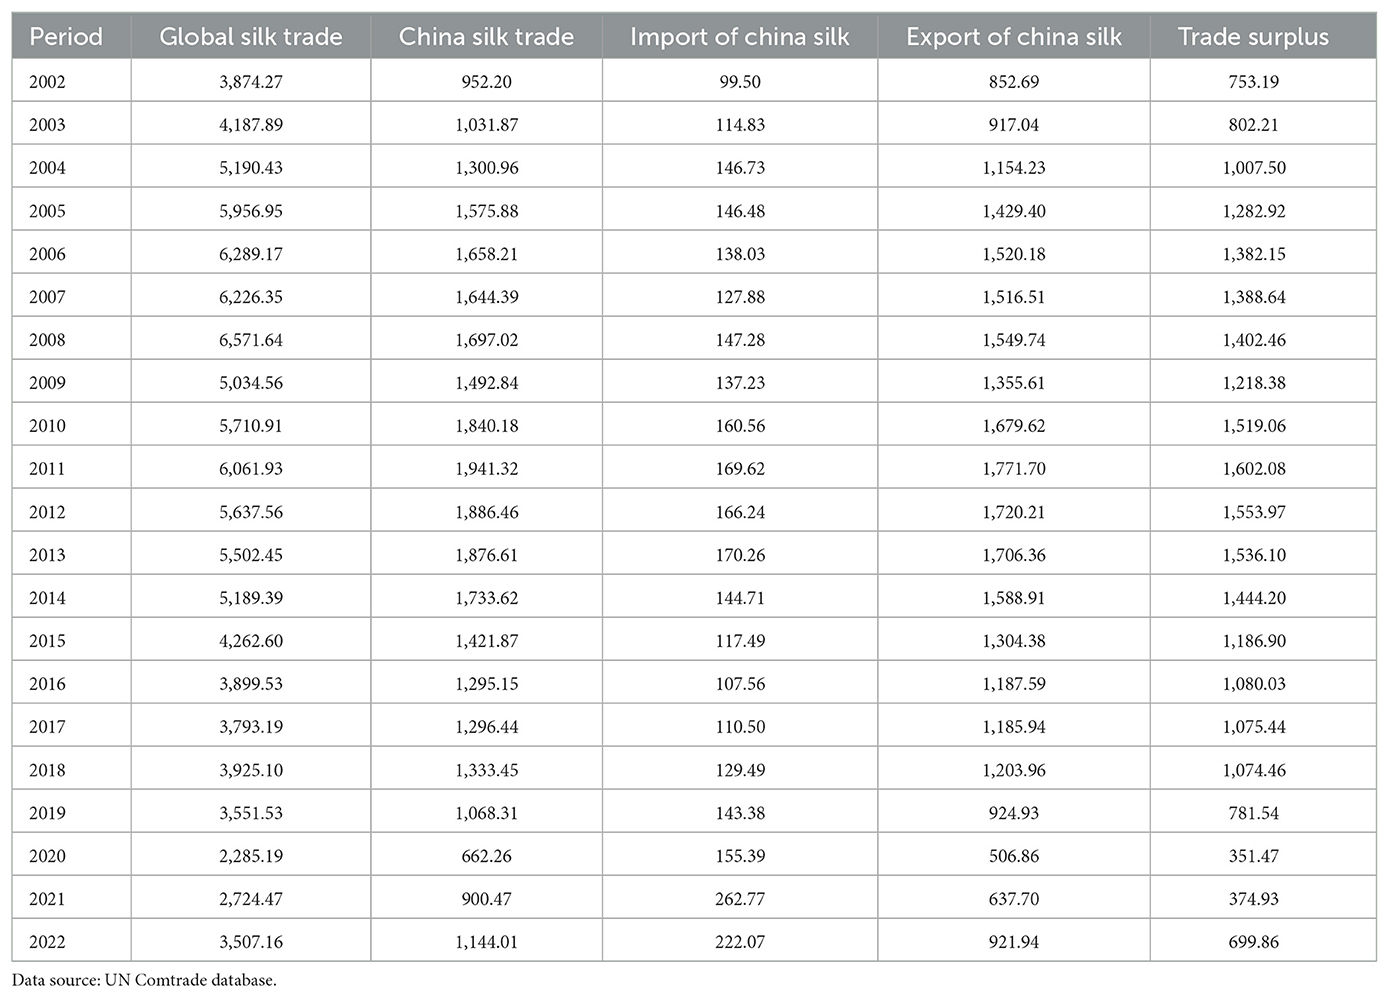
Table 1. Overview of China and global trade in silk products from 2002 to 2022 (million US dollars).
In spite of the fluctuation of silk product trade, China has maintained a long-term trade surplus position in silk product trade over the past two decades. Silk product import in 2022 accounted for only 16.1% of the total trade value, while the exports accounted for 83.9%. This trade surplus is primarily attributed to China's production volume, quality advantages, and strong demand in foreign markets.
Silk products are categorized into three major classes based on the classification criteria of the Harmonized Commodity Description and Coding System. They are natural silk products (cocoon, raw silk, waste silk, non-retail silk, yarn made from non-retail waste silk), silk and satin products, and secondary silk products (women's blouses, silk scarves and shawls, neckties).
As depicted in Figure 2, from 2002 to 2022, silk and satin products and natural silk products, with relatively small profit margins, are the main categories of China's silk products trade. The average annual trade volume of silk satin products is 656 million US dollars, with an average annual growth rate of 10.57%, while the trade of natural silk products showed a similar growth trend, with an average annual growth rate of 7.45%. Comparatively, secondary silk products, which have relatively higher profit margins, grew more slowly, at 4.86%. It is worth mentioning that the global economic crisis in 2008 caused a reduction in the scale of the international silk market, resulting in serious difficulties for China's silk industry.
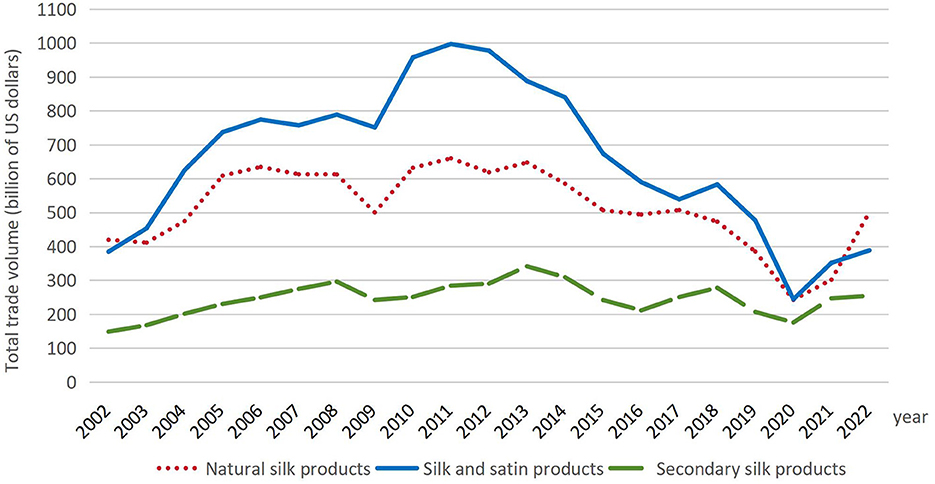
Figure 2. Changes in the total trade volume of Chinese silk products during 2002 to 2022. Data source: UN Comtrade database.
China's export trade of silk products has declined continuously since 2012, with a large degree of volatility. Between 2013 and 2022, there was a notable decrease in the trade value of silk and satin products, declining from 888 million US dollars in 2013 to 388 million US dollars in 2022. During this period, the trade trends of silk and satin and natural silk products were similar, both showing a decline year by year. The decline in silk and satin products was faster, especially after 2017, with an average annual trade balance of only 28.61 million US dollars.
The target markets for Chinese silk products are highly concentrated, with a limited number of import and export trading partners. The main trading partners are India and Pakistan in South Asia, Japan and South Korea in East Asia, and Italy, Germany, and France in Europe. These nations constitute the most significant markets for both imports and exports.
Table 2 displays the top eight countries or regions to which China's silk products were exported in 2022. India stands out as China's largest market for silk, with an export value of 145 million US dollars and accounting for 15.26% of China's total silk export value. For silk and satin products, Italy and Pakistan are the main export destinations, with export values of 108 million US dollars and 54.58 million US dollars, respectively, and accounting for approximately one-third of the total export value. Secondary silk products are mainly sold to developed countries such as the United States, Japan, Germany, and France. The United States, in particular, is China's foremost market for secondary silk products, accounting for 16.88% of the total export value.
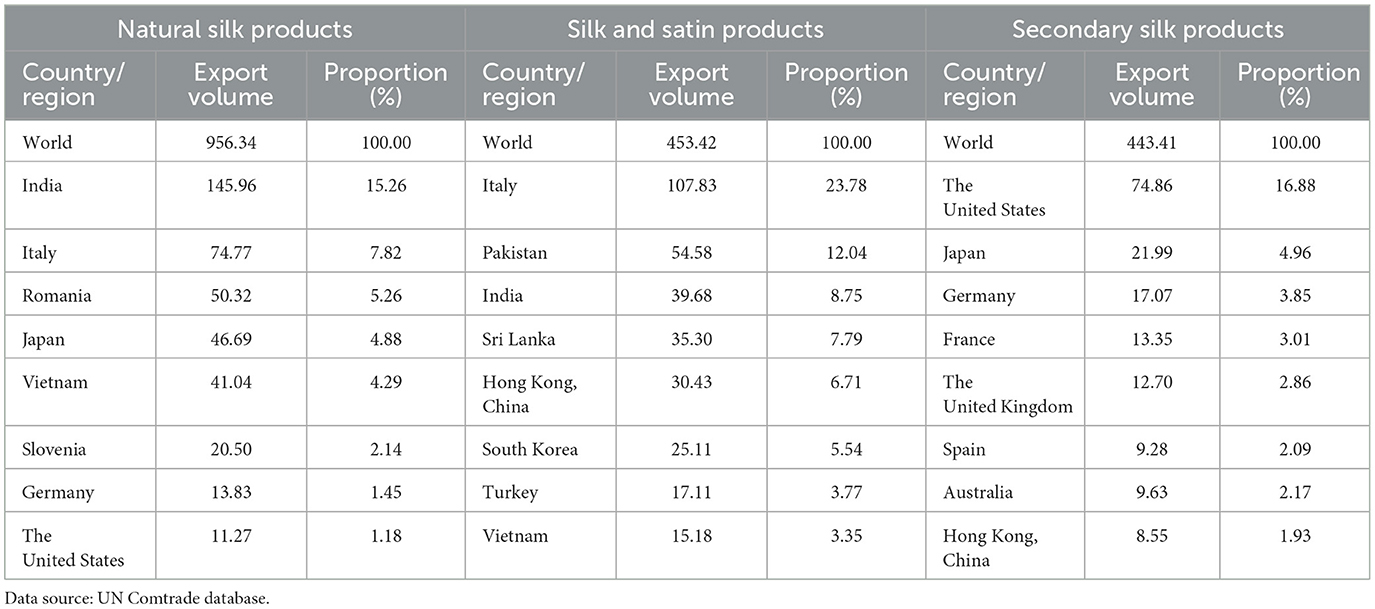
Table 2. The top 8 partner countries/regions of China's silk products export in 2022 (million US dollars).
The main partner countries and the trade value of China's silk products import are depicted in Table 3. India, Italy, and Uzbekistan are the largest sourcing countries of China's silk product imports, accounting for over 60% of China's total silk product imports. In 2022, the market concentration of silk products imported to China was notably high, primarily centered around India, Uzbekistan, South Korea, and Malaysia. The import value of silk products from each of these countries to China exceeds 10 million US dollars, contributing to a cumulative import share of 42.78%. Italy holds the position of being the largest exporter of silk and satin products to China, constituting 26.44% of the total imports, and is followed by Japan, India, and South Korea, with import values all exceeding 1 million US dollars. The import concentration of China's secondary silk products is the highest, with Italy and France being the key sourcing countries, with import values of 72.8 million US dollars and 54.98 million US dollars, respectively. The combined import share of these two countries reaches 45.34%. This high concentration is attributed to the superior quality and brand premium associated with silk processed products manufactured in Italy and France.
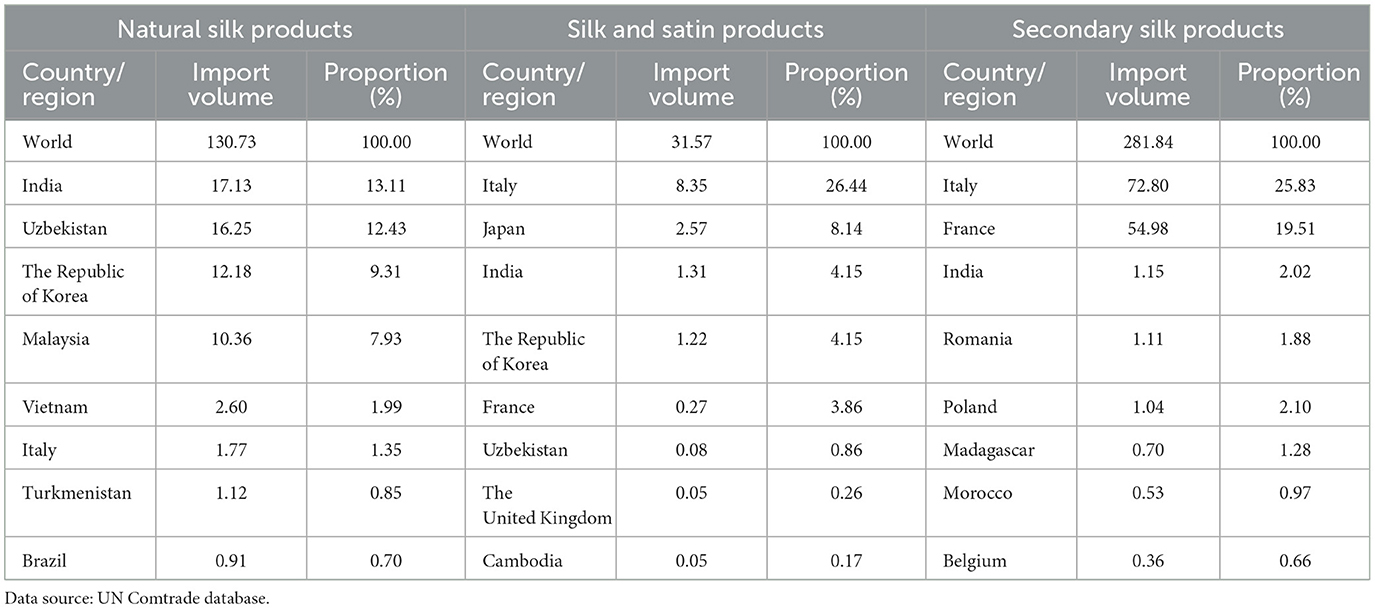
Table 3. The top 8 partner countries/regions of China's silk products import in 2022 (million US dollars).
This section presents the model and data sources.
As can be seen from the analysis in the previous section, the trade volume, product structure and market structure of China's silk products trade have shown tremendous fluctuations. However, descriptive analysis does not explain the causes of trade fluctuations. Silk trade involves a variety of silk product categories and a large number of trading partner countries, and the data presents the characteristics of multi-dimensionality and complexity. Therefore, the constant market share (CMS) model is adopted to explore the influencing factors behind the fluctuation of China's silk trade with other countries in a more comprehensive and in-depth manner from a more macroscopic perspective.
In this paper, the 23 countries that account for more than 90% of China's total exports of silk products are considered as a whole, without taking into account the changes in market demand among the exporting countries. Therefore, this study builds on the model constructed by Jepma (1989) and refers to the model settings of previous scholars (Liu and Xiao, 2018; Wang Z. X. et al., 2017; Bagaria and Ismail, 2019; Capobianco et al., 2017). The model setup of Capobianco constructs the CMS model by dividing the export growth of silk products into two levels and simplifying the second level of decomposition appropriately.
The decomposition formula of the first level model is as follows:
Where q represents the export value of silk products from China to other countries or regions, Qi represents the import value of the i-th category of silk products by China from other countries or regions, and Si represents the proportion of China's export value of the i-th category of silk products to the total import value of the i-th category of silk products by other countries or regions. The superscript 0 denotes the base (initial) year, and Δ represents the change between the terminal and base years.
At the second level decomposition model, structural effects can be further decomposed into two items:
The competitive effect can be decomposed into:
The second-order effect can be decomposed into:
Hence, the decomposition formula of the second level model is as follows:
These decomposed effects calculated in above models are depicted in Figure 3.
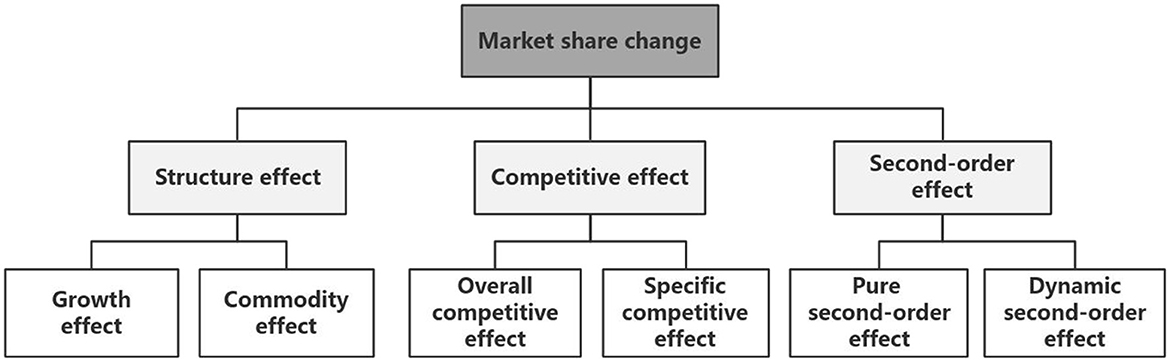
Figure 3. The structure of the decomposed effects.
The definitions of each effect decomposition of the model are shown in Table 4.
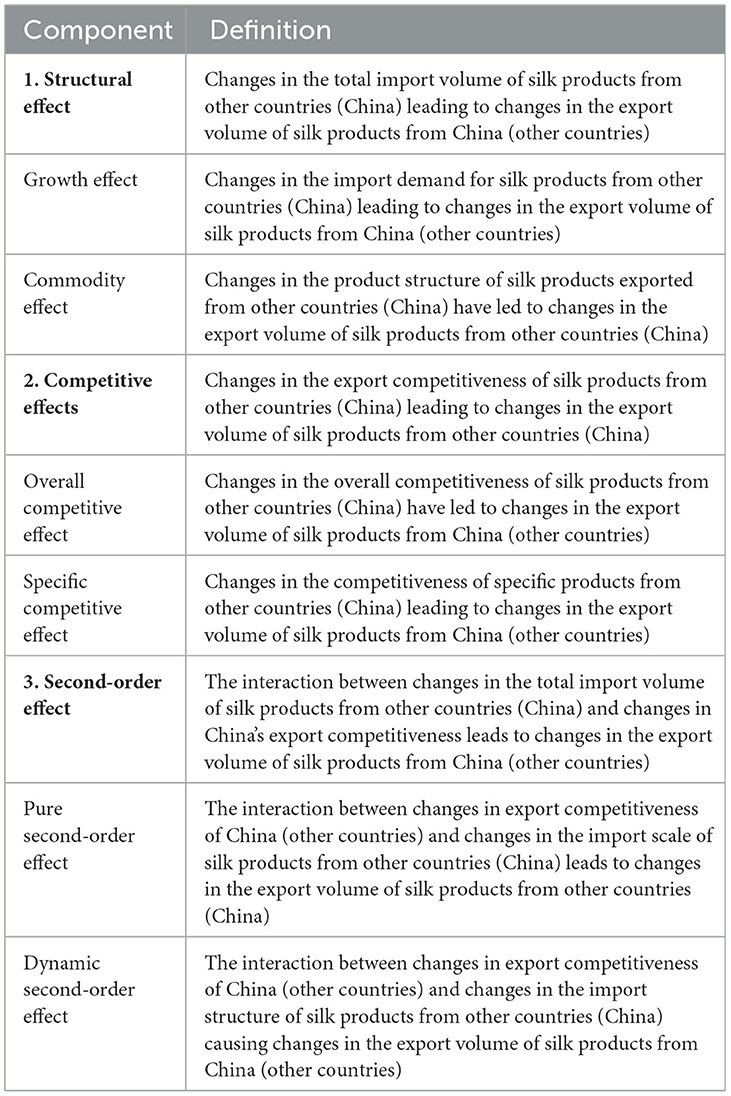
Table 4. Decomposition definitions of CMS model specific effect.
The data for the silk product trades were obtained from the United Nations Commodity Trade Statistics (UN Comtrade) database. Specific categories of products were defined by referring to the HS1996 statistical standard classification codes. The production technology and end-users are very different among different silk products. Meanwhile, different types of silk products also have different tariff policies, trade barriers and market competition situation. We therefore divide the silk products into three categories, they are atural silk products, silk and satin products, secondary silk products. The selected categories include a portion of Chapter 50 (5001–5006) as natural silk products, encompassing silk cocoon (5001), raw silk (5002), waste silk (5003), non-retail silk (5004), non-retail waste silk woven into yarn (5005), and retail waste silk woven into yarn (5006). Category 5007 of Chapter 50 is silk and satin products. A part of products from Chapter 62 are secondary silk products, including women's shirts (620610), scarves and shawls (621410), and ties (621510).
For the segmentation of export markets, 29 countries or regions were selected based on the volume of silk product trade with China. India, the United States, Italy, Romania, Germany, Singapore, Japan, and South Korea are the eight countries with the largest trade values and these countries account for over 90% of China's silk product exports in total. These 29 countries or regions were grouped together as “other countries”.
Due to China joined the WTO in November 2001 and started to fully implement its obligations and enjoy corresponding rights in 2002. For the silk trade, this led to a new rule environment and closer integration with the global market, making 2002 a significant starting point for analyzing the changes in silk trade. Therefore, the research period of this paper is 2002–2022 and is divided into four phases:
2002–2009, marked by rapid export growth. Following China's accession to WTO, the process of global economic integration and further opening of national markets has accelerated significantly, and China's trade in silk products has shown an upward trend. 2010–2014, The far-reaching effects of the international financial crisis and the contraction of world trade have led to unstable demand for silk products in the international market, and the scale of China's silk exports has declined, followed by a slow recovery trend. 2015–2019, Export trade continues to shrink stage, Europe and the United States and other major economies, weak economic growth, consumer confidence suffered a setback, the demand for silk and other non-essential goods to reduce the demand for silk, resulting in China's silk products exports continued to shrink. 2020–2022, The epidemic led to the contraction of global silk trade, but the rapid recovery of China's export trade and the development of emerging markets to promote the recovery of China's silk products export trade.
In this section, the decomposed causes of China's export fluctuations of silk products to other trading partner countries are estimated. From 2002 to 2022, the total growth of China's exports of silk products to other countries is 69.25 million US dollars. In general, the competitiveness effect promotes the export growth most obviously, and the structural effect and the second-order effect have the inverse pulling effect on the exports of silk products.
Overall, from 2002 to 2022, the structural effect exerted a reverse driving force on the growth of China's silk exports, with a contribution rate of −247.52%, resulting in a decrease in export value by 171 million US dollars (as shown in Table 5). Specifically, the Commodity effect had negative contribution values in the first two phases, leading to a decrease in China's silk export value by 17.25 million US dollars and 153 million US dollars, respectively. This indicates that in the initial two phases, China's exports of silk products to other countries were concentrated on products with slower demand growth in those countries, without adjusting the export structure in response to changes in the demand of other countries. In the latter two phases, the export product mix of Chinese silk products has been optimized to some extent, but its contribution to export growth has been limited. In the first three phases, the contribution values of the Growth effect showed a downward trend from year to year. However, under the impact of the COVID-19 pandemic, China's international trade recovered quickly thanks to its strong supply chain resilience, and exports of Chinese silk products were boosted by rapid growth in market demand in other countries.
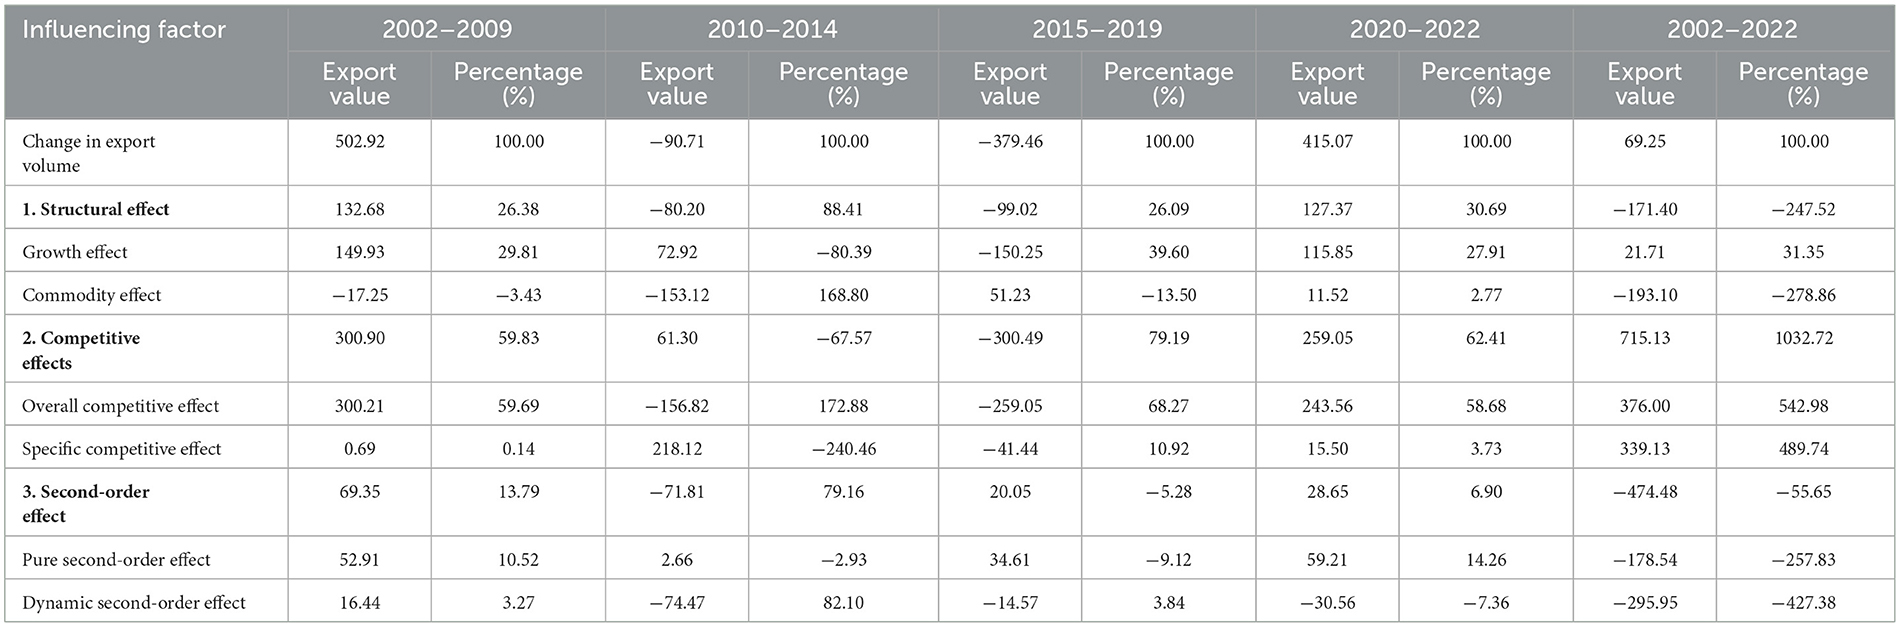
Table 5. Decomposition of CMS model results for China's export of silk products to other countries (million US dollars).
The competitive effect is the most significant factor driving the growth of China's silk exports. From 2002 to 2022, the competitive effect contributed to an increase of 715 million US dollars in China's silk product exports, with a contribution rate of 1,032.72%. In the first three phases, the competitive effect showed a declining trend year by year, exerting an increasingly negative impact on export growth. It led to a shift from positive to negative contribution values, causing a decrease in export value by 300 million US dollars in the period from 2015 to 2019. However, under the influence of the COVID-19 pandemic, Chinese silk products demonstrated strong competitiveness in the international market. From 2020 to 2022, the value of the contribution picked up rapidly to 259 million US dollars, with an upward trend from year to year. During this period, the overall competitive effect became the primary force driving export growth, contributing 243 million US dollars, with a contribution rate of 58.68%, reversing the competitive effect from negative to positive.
During the period from 2002 to 2022, the second-order effect had a negative impact on the growth of China's silk product exports, resulting in a decrease of 474 million US dollars, with a contribution rate of −55.65%. Specifically, both the pure second-order effect and dynamic second-order effect had negative contributions, with contribution rates of −257.83% and −427.38%, respectively. It indicates that China's silk product export competitiveness did not align well with the import demands and structural changes of other countries. The negative second-order effect offset the export growth brought about by the competitive effect, reducing the growth rate of silk product exports.
Next, we explore the factors affecting the fluctuation of the export of silk products from other trading partner countries to China. From 2002 to 2022, the export growth of silk products from other countries to China was −27.25 million US dollars, of which the total export amount declined by 93.96 million US dollars during the period of 2010–2014, and gradually resumed the growth in the latter two phases. Among the four phases, the structural effect promoted export growth most obviously, while the Competitive effect played a negative pulling role on export growth in general, and the specific decomposition of the model effect is shown below.
As shown in Table 6, from 2002 to 2022, other countries' exports of Chinese silk products decreased by 27.25 million US dollars. The structural effect was the most significant factor influencing changes in other countries' exports of Chinese silk products, promoting an increase in export value with a contribution of 327 million US dollars. As the export value change is negative, it indicates that the increase in Chinese import demand has stimulated the export of silk products from other countries. Specifically, the growth effect directly drove export value growth by 227 million US dollars, being the main contributor to export value growth.

Table 6. Decomposition of CMS model results for other countries' exports of silk products to China (million US dollars).
In each of the four phases, the contribution rate of structural effects was positive, showing a fluctuating trend. The main reason for this fluctuation was the impact of economic crises and the COVID-19 pandemic, which led to changes in Chinese import demand across the four phases, consequently affecting export structures.
From 2002 to 2022, the competitive effect had a reverse pulling effect on the exports of silk products from other countries, directly leading to a decrease in export value by 87.57 million US dollars, with a contribution rate of 321.39%. Specifically, in the second, third, and fourth phases, the negative pulling effect of the competitive effect on export growth continued to strengthen. The contribution rate of the competitive effect showed a decreasing trend year by year, transitioning from positive to negative, decreasing from 59.29% in the second phase to −22.69% in the fourth phase.
Among these, the overall competitive effect had the strongest negative pulling effect on export growth. In all four phases, the contribution values were negative, indicating that other countries lacked overall competitive advantages in exporting silk products to China. The reason behind this is that in intense market competition, the rising prices of raw materials make it less feasible for other countries to gain a price advantage through human capital.
From 2002 to 2022, the second-order effect had a negative impact on the exports of silk products from other countries, directly leading to a decrease in export value by 267 million US dollars, with a contribution rate of −980.09%. It indicates that the export competitiveness of silk products from other countries did not align well with the changes in China's import demand and market structure.
Specifically, as shown in Table 6, the dynamic second-order effect had negative contribution rates in all four phases. It further indicates that the interactive impact of the export competitiveness of silk products from other countries and the changes in China's import structure did not promote export growth. It can be observed that the export competitiveness of silk products from other countries had consistently remained in a relatively weak state, unable to adjust promptly according to changes in the import market demand.
Due to the different characteristics of different categories of silk products, it would inevitably form the impact on the export structure. Therefore, this section further analyzes the factors influencing China' trade fluctuations of each category of silk products. During 2002–2022, China's exports of silk products to other countries were mainly driven by the growth of silk and satin products, which increased by 72.29 million US dollars, followed by natural silk products, while the export of secondary silk products accounted for the smallest proportion. Overall, the results show that natural silk products and secondary silk products export growth of China mainly depended on the structural effect, while the competitive effect of silk and satin products was the most important factor influencing its export growth. The decomposition of factors affecting changes in China's exports of different categories of silk products to other countries is shown in Table 7.
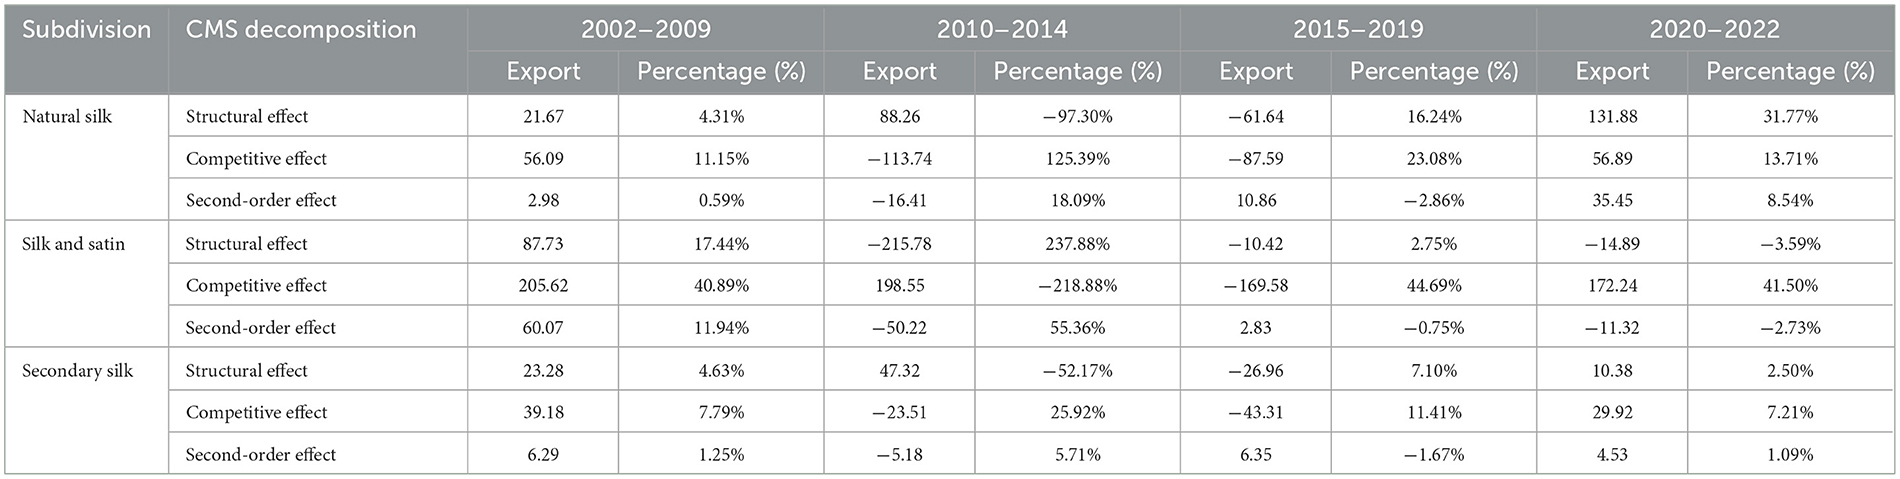
Table 7. Decomposition of CMS model results for China's exports of different categories of silk products to other countries (million US dollars).
China's silk products export growth factors are analyzed as shown in Table 7. Structural effect was the main driving force of the export growth of natural silk products, promoting the export growth from 21.67 million US dollars to 132 million US dollars, the contribution rate also increased from 4.31% to 31.77%, indicating that the increase in imports from other countries promoted the expansion of China's exports of silk products, and this effect on the promotion of exports gradually enhanced of the role of competitive effect in the period of 2010–2019 which had a negative impact on the export volume, while the contribution rate reached 125.39% and 23.08%, indicating that the competitiveness of China's natural silk products was insufficient, hindering the export of natural silk products. The second-order effect on exports was generally stable, and the product structure of natural silk exports was more in line with market demand.
Silk and satin products were China's silk trade accounted for the largest category, from the data in Table 8 it shows that the structural effect of silk and satin products contributed to the value of the value of the negative value except for 2002–2009, in particular, the contribution value of −216 million US dollars in 2010–2014, indicating that China's exports of silk and satin products did not expand along with the expansion of the scale of imports from other countries. The competitive effect was positive at all phases except 2015–2019, which was negative, of which the epidemic period of 2020–2022 pushed the export growth of 172 million US dollars, which was the main driving force for the export growth of silk and satin products. And the Second-order effect on exports showed a fluctuating state, the contribution value and contribution rate were negative for many years, indicating that China's export product structure of silk and satin products and the demand for imports from other countries were not adapted to a certain extent.
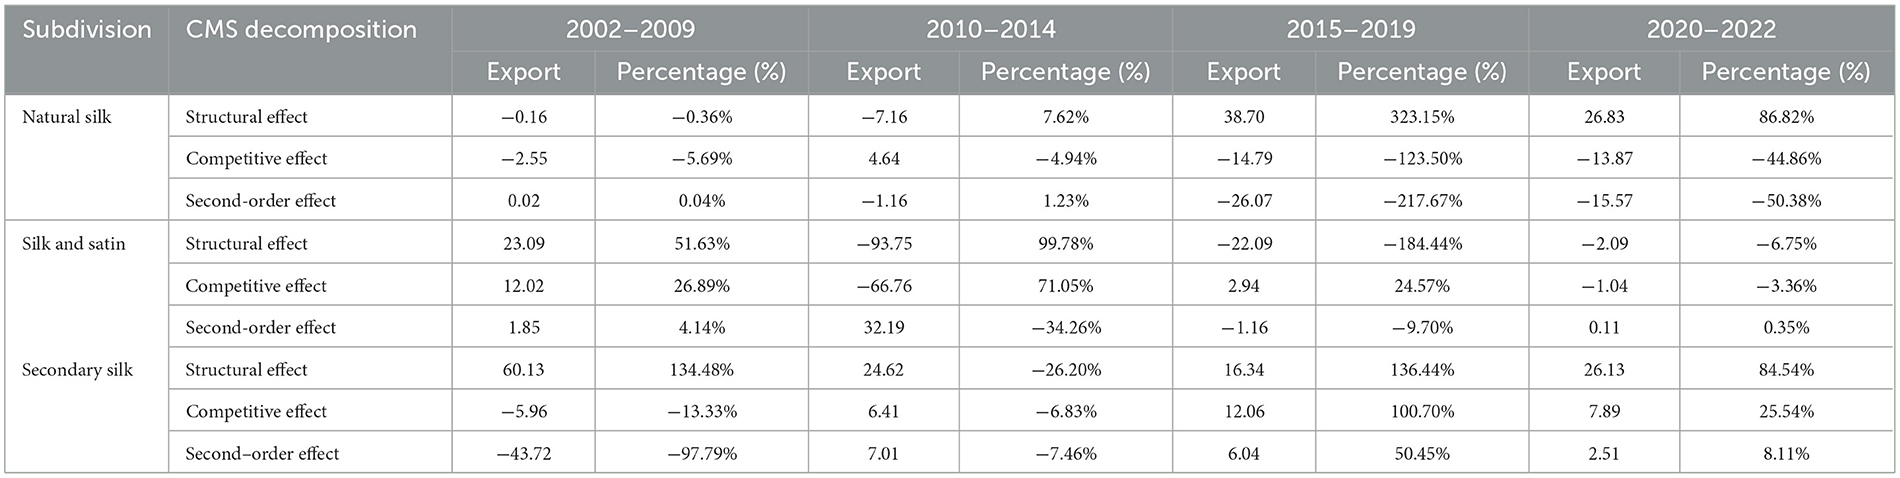
Table 8. Decomposition of CMS model results for other countries' exports of different categories of silk products to China (million US dollars).
Secondary silk products were the least important category of China's exports to other countries, with a decrease of 31.52 million US dollars in exports from 2002 to 2022. In the first two phases, structural effects were the main driving force for export growth, pushing up exports by 47.32 million US dollars, but after 2015, structural effect and competitive effect had a negative impact on exports. Although the competitiveness of secondary silk product exports increased significantly during the 2020–2022 epidemic, overall, the contraction of the global silk trade brought about a significant drop in import demand, and the structural effect and competitive effect constrained China's secondary silk products export growth.
In order to better explore the impact of different categories of silk products on the fluctuation of export trade in the world silk trade, therefore, this section we probes into the factors affecting the fluctuation of export trade of silk products from other countries to China by products. Overall, the export value of silk products from other countries to China declined by 27.25 million US dollars from 2002 to 2022, and the export value of both natural silk products and silk and satin products were on a downward trend, while the structural effect and competitive effect of secondary silk products drove their export value to grow against the trend. The decomposition of factors affecting changes in other countries' exports of different categories of silk products to China is shown in Table 8.
The contribution value of the structural effect of natural silk products turned from negative to positive and showed a year-on-year growth trend, with a contribution rate of 323.15% in 2015–2019, resulting in an export increase of 38.7 million US dollars, while the contribution value and contribution rate of the competitive effect and the second-order effect show a decreasing trend in the four phases, which indicated that the export growth of natural silk products from other countries mainly originated from the demand of the Chinese market increase, but their products in the Chinese market were not competitive enough, and there was a certain degree of inconsistency between the structure of their export products and the categories of demand of the Chinese market.
The export value of silk and satin products declined by 133 million US dollars, which was the main reason for the decline of its export trade volume. Specifically, the structural effect and competitive effect pushed the export value up by 35.11 million US dollars from 2002 to 2009, while the structural effect became the biggest obstacle to its export growth in the following three phases. The main reason was the shrinkage of demand in the Chinese market due to the global economic crisis in 2008. The competitive effect and the second-order effect remained generally stable after the fluctuation in 2010–2014, indicating that their product categories were generally in line with the Chinese market demand.
The export value of secondary silk products increased by 111 million. Specifically, the structural effect and the competitive effect were the main driving forces of its export growth, and the export value increased by 28.4 million US dollars from 2015 to 2019, with contribution rates of 136.44% and 100.7%, respectively. The contribution value of the structural effect showed an increasing trend, indicating that the silk products of other countries were more competitive in the Chinese market and the demand of the Chinese market was higher. The contribution rate of the contribution value of the second-order effect remained generally stable, indicating that the export product categories of other countries were generally in line with the demand of the Chinese market.
This study presents the evolution of China's export and import of silk products from 2002 to 2022. The CMS model is used to examine the factors contributing to the trade dynamics of silk products between China and other countries. The conclusions are as follows.
During the two decades from 2002 to 2022, China's silk exports growth to other countries were mainly driven by the competitive effect, while structural effect and second-order effect exhibit reverse pull influence. Specifically, China's silk products export was effectively promoted by silk product competitiveness, but the product structure of China's silk products exported we're not able to adapt to changes in the import demand of other countries.
As for different categories of silk products exported from China to other countries, the export of natural silk products mainly relied on the structural effect generated by the expansion of import demand in other countries. The competitive effect was the main factor promoting the growth of exports of silk and satin products, but the structure of its export products and the demand for imports from other countries there had a certain degree of non-adaptation. The structural effect and competitive effect constrained the export growth of China's secondary silk products, and the export value decreased by 31.52 million US dollars.
For the silk exported from other countries to China, the structural effect is the main factor of export growth, indicating that the rapid growth of China's import demand for silk products promoted the exports of other countries. However, due to the lack of overall competitiveness of silk products in other countries, market fluctuations caused by the economic crisis and the COVID-19 pandemic had a greater impact on their exports. And the export structure of product and the structure of China's import demand were misaligned. It was not conducive to the expansion of exports.
For other countries exporting different categories of silk products to China, the export growth of natural silk products mainly stemmed from the increase in demand in China's market, but the competitiveness of its products in the Chinese market was insufficient. The export value of silk and satin products fell by 133 million US dollars, and the structural effect became the biggest obstacle to its export growth. Secondary silk products were more competitive in the Chinese market and had a higher market demand.
The results of the analysis of the article show that a large part of the fluctuations in the trade of silk products were due to the fluctuations in the world economic situation, and the fluctuation trend was basically the same. China's international competitiveness of silk products had a clear quantitative advantage, especially silk and satin products had a strong export competitiveness advantage, and natural silk products were pressured by the competition in the silk market in neighboring countries, and their export competitiveness advantage had been weakened. The export competitiveness of secondary silk products was weaker, mainly because of the gap in the deep processing of silk with Italy, France and other exporting countries. The growth of other countries' exports of silk products to China resulted mainly from China's expanding market demand, and their export dependence on the international market, resulting in their exports being vulnerable to international trade fluctuations. The market fluctuations caused by the economic crisis and the epidemic had a greater impact on the export value of natural silk products and silk and satin products, while the secondary silk products with the highest added value showed stronger competitiveness, and the structure of exported products was gradually biased in favor of processed silk products.
Based on the above analysis, we put forward the following policy recommendations from the perspectives of government, enterprises and producers.
First, the government aspect. Governments must establish a favorable macroeconomic environment to support international silk trade. As the world's second-largest economy and a central hub for silk commerce, China should actively advance the Belt and Road Initiative and free trade zone strategies. This entails developing more open and transparent policy frameworks and facilitating access to relevant information channels for member countries' silk industries and import/export businesses. Additionally, optimizing the structure of silk trade is essential. Silk-exporting nations should not only strengthen their comparative advantages in silk product exports but also stay informed about changes in information demand within agricultural markets. Promptly adjusting export product structures can help mitigate the effects of high national market shares and trade barriers.
Second, the enterprise aspect. To enhance international competitiveness and foster export growth in China's silk industry, it is necessary to transition silk raw material exporters into high value-added silk product exporters. This involves bolstering technological innovation in silk fabric production, processing, and design, thereby increasing China's comparative advantages in silk product design and branding. Building on robust product design, enterprises should intensify the brand marketing of pure silk products to establish the international reputation of Chinese silk brands. This will strengthen the position of China's silk industry within the global silk value chain.
Third, the producer aspect. Promoting standardized breeding practices is crucial. Producers should actively comply with the quality inspection standards set by silk enterprises to ensure the stability and consistency of cocoon quality. Establishing stable partnerships with silk companies and signing long-term purchase agreements can help mitigate the impact of market price fluctuations on producers' revenues. Furthermore, producers should adjust their breeding scales and variety structures in accordance with buyers' demands to achieve effective alignment with production requirements.
This study still has certain limitations that could be further expanded upon in the future. First, not all of China's partner countries of silk product trade are analyzed. We selected 29 countries and regions, accounting for over 90% of China's silk product exports, as the research objects. Second, the research data in this work are sourced only from the UN Comtrade database and double-check with other databases. Due to the situation where some countries have not reported trade data, there may be slight discrepancies in the data of the total global silk product exports during the model computation process. Finally, more specific analyses could be conducted at the level of China with individual countries or international organizations in the future.
The original contributions presented in the study are included in the article/supplementary material, further inquiries can be directed to the corresponding author.
FL: Supervision, Validation, Writing – review & editing, Visualization, Writing – original draft. MA: Conceptualization, Data curation, Formal analysis, Writing – original draft, Writing – review & editing. QL: Funding acquisition, Resources, Visualization, Writing – original draft, Writing – review & editing.
The author(s) declare financial support was received for the research, authorship, and/or publication of this article. This study was funded by the Modern Agricultural Technology System of Shandong Province (No. SDAIT-18-07) and the earmarked fund for China Agriculture Research System (CARS).
The authors declare that the research was conducted in the absence of any commercial or financial relationships that could be construed as a potential conflict of interest.
The reviewer XW declared a shared affiliation, with no collaboration, with author QL to the handling editor at the time of the review.
The author(s) declare that no Gen AI was used in the creation of this manuscript.
All claims expressed in this article are solely those of the authors and do not necessarily represent those of their affiliated organizations, or those of the publisher, the editors and the reviewers. Any product that may be evaluated in this article, or claim that may be made by its manufacturer, is not guaranteed or endorsed by the publisher.
Abdul, K. M., Qayyum, U., Khan, S., and Ngozi Adeleye, B. (2022). Who is trading well with China? A gravity and constant market share analysis of exports of Pakistan and ASEAN in the Chinese market. J. Asian Afric. Stud. 57, 1089–1108. doi: 10.1177/00219096211045098
Aguiar, G. P., Da Silva, J. C. G. L., Frega, J. R., de Santana, L. F., and Valerius, J. (2017). The use of constant market share (CMS) model to assess Brazil nut market competitiveness. J. Agricult. Sci. 9, 174–180. doi: 10.5539/jas.v9n8p174
Ahmadi-Esfahani, F. Z. (2006). Constant market shares analysis: uses, limitations and prospects. Aust. J. Agricult. Resource Econ. 50, 510–526. doi: 10.1111/j.1467-8489.2006.00364.x
Anitha, R. (2011). Indian silk industry in the global scenario. Int. J. Multidisciplin. Manage. Stud. 1, 100–110.
Ashfaq, M., and Aslam, M. (2006) Renewal of sericulture industry. Middle-East J. Sci. Res. 1, 58–59.
Azar, G., and Ciabuschi, F. (2017). Organizational innovation, technological innovation, and export performance: the effects of innovation radicalness and extensiveness. Int. Business Rev. 26, 324–336. doi: 10.1016/j.ibusrev.2016.09.002
Bagaria, N., and Ismail, S. (2019). Export Performance of China: A Constant Market Share Analysis. Front. Econ. China 14, 110–130.
Batista, J. C. (2008). Competition between Brazil and other exporting countries in the US import market: a new extension of constant-market-shares analysis. Appl. Econ. 40, 2477–2487. doi: 10.1080/00036840600970203
Capobianco, U., Aparicio, J., and Pablo Valenciano, J. D. (2017). Analysis of Spain' s competitiveness in the European tomato market: an application of the Constant Market Share method. Spanish J. Agricult. Res. 15:e0113. doi: 10.5424/sjar/2017153-10629
Chen, K. Z., and Duan, Y. (2001). Competitiveness of Canadian agri-food exports against competitors in Asia: 1980-97. J. Int. Food Agribusin. Market. 11, 1–19. doi: 10.1300/J047v11n04_01
Chiou-Wei, S. Z., and Zhu, Z. (2002). Sources of export fluctuations: empirical evidence from Taiwan and South Korea, 1981–2000. J. Asian Econ. 13, 105–118. doi: 10.1016/S1049-0078(01)00114-2
Dai, Y. Y., Yuan, Y. M., Yuan, Y., Zhou, Z., and Zhang, H. Y. (2020). Competitiveness of Chinese and Indonesian tilapia exports in the US market. Aquacult. Int. 28, 791–804. doi: 10.1007/s10499-019-00496-x
Fagerberg, J., and Sollie, G. (1987). The method of constant market shares analysis reconsidered. Appl. Econ. 19, 1571–1583. doi: 10.1080/00036848700000084
Fan, Z., and Chen, L. (2013). An analysis on international competitiveness of Chinese silk fabric products. Sericult. Sci. 39, 129–134. doi: 10.13441/j.cnki.cykx.2013.01.006
Feng, L., Shimin, S., and Xianjuan, Q. (2009). China-Indian silk trade: current production and future prospects. Chin. J. Populat. Resourc. Environm. 7, 91–96. doi: 10.1080/10042857.2009.10684931
Feng, X., and Teng, Y. (2012). Analysis of the export market structure and optimization of chinese silk products. Silk 49, 77–80.
Furdui, E. M., Mărghitaş, L. A., Dezmirean, D., Mihai, C. M., Bobiş, O., and Paşca, I. (2010). Comparative study of biological characteristics of larvae, crude and dried cocoon in 7 races of silkworm Bombyx mori L., raised in Transylvania area. Sci. Papers Animal Sci. Biotechnol. 43, 490–493.
Gu, G., and Fang, Y. (2013). An analysis on the status quo and evolvement mechanism for export technical sophistication of China's silk industry. Sericulture Sci. 39, 365–371.
Gu, G., and Zhang, L. (2002). Economic analysis of China's silk export trade. J. Zhejiang University 5, 98–103. doi: 10.3785/j.issn.1008-942X.2002.05.014
Halagundegowda, G. R., Kumaresan, P., Sathish Gowda, C.S., Mohan Kumar, T., Muttanna, L., et al. (2021). Performance of global trade of indian silk in post-liberalization era. Biol. Forum 13, 582–588.
Hatsopoulos, G. N., and Krugman, P. R. (1987). The problem of US competitiveness in manufacturing. New Engl. Econ. Rev. 1987, 18–29.
Huang, Y., and He, Z. (2022). Research on China's silk export trade issues. China Arab Sci. Technol. Forum 5, 67–70.
Huo, S., and Lin, J. (2008). An Empirical Analysis of Influential Factors on Silk Export Trade in China. Sericult. Sci. 3, 556–561.
Jepma, C. J. (1989). “Extensions of the constant-market-shares analysis with an application to long-term export data of developing countries,” in The Balance Between Industry and Agriculture in Economic Development: Proceedings of the Eighth World Congress of the International Economic Association, Delhi, India (London: Palgrave Macmillan UK, 1989), 129–143.
Karagöz, K. (2016). Determining factors of Turkey's export performance: an empirical analysis. Procedia econ. Finan. 38, 446–457. doi: 10.1016/S2212-5671(16)30216-7
Kumaresan, P., Halagundegowda, G. R., and Muttann, R. (2021) “Competitiveness of India Silk Goods: an Analysis of Intensive Extensive Margins.” Indian Journal of Agriculture Allied Sciences 7, 78-82.
Leng, Z., Shuai, J., Sun, H., Shi, Z., and Wang, Z. (2020). Do China's wind energy products have potentials for trade with the “Belt and Road” countries?–A gravity model approach. Energy Policy 137:111172. doi: 10.1016/j.enpol.2019.111172
Lin, G., Wu, H., and Min, S. (2006). Empirical Studies on the Influencing Elements of Raw Silk Export of China After Entering WTO. Sericult. Sci., 4, 566–570.
Liu, C., and Xiao, H. (2018). The Driving Factors of Agricultural Trade between China and Sixteen Central and Eastern European Countries–Based on Constant Market Share Model. Agricult. Technol. Econ. 9, 135–144.
Liu, L., Zhang, Q., and Zhang, Z. (2006). The development status and prospects of China's silk trade under the background of trade liberalization. Silk 11, 9–11+23.
Loewe, M. (1971). Spices and silk: aspects of world trade in the first seven centuries of the Christian era. J. Royal Asiatic Soc. 103, 166–179. doi: 10.1017/S0035869X0012920X
Madsen, F. S. (2012), An Analysis of Global Silk Trade: Linking Coordination to Technological Improvements and Exports (Master's thesis). Lund University Department of Economics.
Masood, S., Khurshid, N., Haider, M., Khurshid, J., and Khokhar, A. M. (2023). Trade potential of Pakistan with the South Asian Countries: a gravity model approach. Asia Pacific Managem. Rev. 28, 45–51. doi: 10.1016/j.apmrv.2022.02.001
Merkies, A. H., and van der Meer, T. (1988). A theoretical foundation for constant market share analysis. Empir. Econ. 13, 65–80. doi: 10.1007/BF01973315
Milana, C. (1988). Constant-market-shares analysis and index number theory. Eur. J. Polit. Econ. 4, 453–478. doi: 10.1016/0176-2680(88)90011-0
Muhammad, N. M. N., and Yaacob, H. C. (2008). Export competitiveness of Malaysian electrical and electronic (E&E) product: Comparative study of China, Indonesia and Thailand. Int. J. Bus. Manage. 3, 65–75. doi: 10.5539/ijbm.v3n7p65
Nasrullah, M., Chang, L., Khan, K., Rizwanullah, M., Zulfiqar, F., and Ishfaq, M. (2020). Determinants of forest product group trade by gravity model approach: a case study of China. Forest Policy Econ. 113:102117. doi: 10.1016/j.forpol.2020.102117
Popescu, A. (2013). “Trends in World silk cocoons and silk production and trade, 2007-2010,” in Scientific Papers: Animal Science & Biotechnologies/Lucrari Stiintifice: Zootehnie si Biotehnologii, 46.
Popescu, A. (2018). Considerations upon the trends in the world silk trade. Scientific Papers Series Management, Economic Engineering in Agriculture and Rural Development, 18(1).
Ren, Y., and Gu, G. (2019). Impact of trade facilitation on Chinese silk exports: empirical evidence from China and the “Belt and Road” trading partners. Silk 56, 1–7.
Ruitao, L. I., Yifeng, Q., Dehua, L. I., Lei, D., Jingjing, L., Yuying, C., et al. (2018). Study on factors affecting export of china's tobacco products based on constant market share(CMS) model. Acta Tabacaria Sinica 24, 93–99.
Shu, Z. R. (2019). Discussion on the situation and development strategies of China's silk export trade. China J. Commer. 5, 96–99.
Sundari, K. T., and Ramalakshmi, P. (2018). Silk production: the global scenario. Asian Rev. Soc. Sci. 7, 22–24. doi: 10.51983/arss-2018.7.2.1435
Tyszynski, H. (1951). World trade in manufactured commodities, 1899-1950 1. Manchester School 19, 272–304. doi: 10.1111/j.1467-9957.1951.tb00012.x
Wang, L., Li, J., and Gu, G. (2017). Pricing power of China's cocoon and silk products in international market: an empirical analysis based on international market power. Sericult. Sci. 43, 327–335. doi: 10.13441/j.cnki.cykx.2017.02.021
Wang, M., Tan, Z., Liu, J., and Chen, J. (2022). Analyzing the impact of Fukushima nuclear wastewater discharge on seafood trade with gravity model. Ocean Coast. Manag. 230:106302. doi: 10.1016/j.ocecoaman.2022.106302
Wang, Z. X., Zheng, H. H., Pei, L. L., and Jin, T. (2017). Decomposition of the factors influencing export fluctuation in China's new energy industry based on a constant market share model. Energy Policy 109, 22–35. doi: 10.1016/j.enpol.2017.06.050
Widodo, T. (2010). Market dynamics in the EU, NAFTA, North East Asia and ASEAN: the method of constant market shares (CMS) analysis. J. Econ. Integrat. 2010, 480–500. doi: 10.11130/jei.2010.25.3.480
Keywords: silk products, CMS model, export growth, influencing factors, trade fluctuations
Citation: Lu F, An M and Liang Q (2025) The sustainability of China's silk trade: analysis of growth effect and the influencing factors. Front. Sustain. Food Syst. 9:1521229. doi: 10.3389/fsufs.2025.1521229
Received: 01 November 2024; Accepted: 13 January 2025;
Published: 07 February 2025.
Edited by:
Wenjin Long, China Agricultural University, ChinaReviewed by:
Liao Wenmei, Jiangxi Agricultural University, ChinaCopyright © 2025 Lu, An and Liang. This is an open-access article distributed under the terms of the Creative Commons Attribution License (CC BY). The use, distribution or reproduction in other forums is permitted, provided the original author(s) and the copyright owner(s) are credited and that the original publication in this journal is cited, in accordance with accepted academic practice. No use, distribution or reproduction is permitted which does not comply with these terms.
*Correspondence: Qiao Liang, bGlhbmdxaWFvMjMyM0B6anUuZWR1LmNu
Disclaimer: All claims expressed in this article are solely those of the authors and do not necessarily represent those of their affiliated organizations, or those of the publisher, the editors and the reviewers. Any product that may be evaluated in this article or claim that may be made by its manufacturer is not guaranteed or endorsed by the publisher.
Research integrity at Frontiers
Learn more about the work of our research integrity team to safeguard the quality of each article we publish.