 Emad S. Aljohani
 Benaissa Chidmi
 Alaa Kotb
 Mahmoud Alderiny
 Abdullah Aldakhil
 Yusuf Krimly1
95% of researchers rate our articles as excellent or good
Learn more about the work of our research integrity team to safeguard the quality of each article we publish.
Find out more
ORIGINAL RESEARCH article
Front. Sustain. Food Syst. , 20 March 2025
Sec. Agricultural and Food Economics
Volume 9 - 2025 | https://doi.org/10.3389/fsufs.2025.1516742
This article is part of the Research Topic Enhancing Food Security and Trade Resilience in Sustainable Agricultural Systems View all 20 articles
Introduction: Understanding the demand for imported green coffee in Saudi Arabia is crucial for stakeholders in the coffee trade. This study examines how demand varies by country of origin, focusing on Ethiopia, Brazil, India, and other exporting nations such as Colombia, Vietnam, and Kenya. Given the growing coffee consumption in Saudi Arabia, analyzing consumer preferences and market dynamics can provide insights for importers, exporters, and policymakers.
Methods: This study employs the Almost Ideal Demand System (AIDS) model to estimate demand elasticities for green coffee imports. The analysis considers income and price elasticities to determine the classification of coffee imports as necessities or luxury goods, as well as cross-price elasticities to assess substitution and complementarity relationships between different origins.
Results: Findings indicate that Ethiopian coffee dominates the Saudi market and is considered a luxury good with high income elasticity. In contrast, Brazilian and other coffees exhibit characteristics of necessities, with relatively stable demand. Indian coffee is highly price-elastic but maintains a smaller market share. Cross-price elasticity estimates reveal that Ethiopian and Indian coffees act as substitutes, whereas Ethiopian coffee complements imports from other sources.
Discussion and conclusion: Projected trends suggest continued growth in Ethiopian, Brazilian, and Indian coffee imports, while imports from other origins may decline. These findings have practical implications for importers and marketers, who can refine sourcing and promotion strategies, and for exporters, particularly from Ethiopia and Brazil, who can strengthen their market positioning. Policymakers may leverage these insights to ensure stable coffee import flows through targeted trade policies. This study contributes to the coffee demand literature by emphasizing the role of origin differentiation in shaping market dynamics in Saudi Arabia's green coffee sector.
Coffee is one of the most widely consumed beverages in the world, with an estimated daily intake exceeding 2.25 billion cups [Daviron and Ponte, 2005; International Coffee Organization (ICO), 2012]. Its importance extends beyond cultural preferences, playing an important role in the economies of numerous coffee-producing countries, particularly in the developing world. In these regions, coffee is a major source of export revenue, contributing at least 10% of total export income in many cases (Feleke and Walters, 2005). The global coffee industry supports the livelihoods of over 25 million households and spans over 10.3 million hectares of cultivated land (Pohlan and Janssens, 2010).
Estimating differentiated demand is critical in empirical research, particularly in markets where consumers make choices based on product characteristics beyond price and income considerations. Traditional aggregate demand models often assume homogeneity among goods, failing to account for consumer preferences, quality perceptions, and brand differentiation variations. Bresnahan (1987) emphasizes that differentiated product markets require models that accommodate substitution patterns and price sensitivity differences across varieties. The Almost Ideal Demand System (AIDS) model (Deaton and Muellbauer, 1980) and other structural demand models provide a flexible framework for analyzing these variations, ensuring that empirical findings reflect the actual heterogeneity in consumer behavior. Differentiated demand estimation is instrumental in understanding market segmentation, informing policy decisions, and guiding industry strategies in response to shifting consumer preferences (Nevo, 2001).
Differentiated demand models have been widely applied in agricultural and food markets, where products from different sources exhibit distinct attributes influencing consumer choices. For example, Moschini et al. (1994) estimate a differentiated demand system for milk, considering variations in fat content and organic labeling. Brown and Schrader (1990) analyze egg consumption, distinguishing between conventional and free-range varieties. Davis and Stewart (2002) apply a differentiated demand model to beef, examining the impact of branding and country of origin on consumer preferences. Similarly, Bouamra-Mechemache et al. (2008) investigate cheese demand, capturing variations across regional varieties and processing methods. These studies demonstrate that treating agricultural products as homogeneous can lead to inaccurate policy implications and market assessments.
Analyzing demand through a differentiated model is particularly valuable for coffee, where consumer preferences vary based on origin, flavor profile, and production methods. Different exporting countries produce coffee with unique sensory attributes and perceived quality levels, significantly influencing purchasing decisions. Studies have shown that consumers differentiate between Arabica and Robusta varieties (Teuber, 2010) and between organic and conventional production methods (Liu et al., 2019).
Recent research further highlights the importance of differentiation in coffee markets. Marescotti et al. (2016) examine the role of geographical indications in Latin American coffee markets, showing how origin-based branding affects consumer demand. Grieco (2022) analyzes the European coffee market, emphasizing how country-of-origin effects shape consumer preferences and pricing strategies. Storer (2017) discusses the emergence of direct trade and single-origin coffees, illustrating how differentiation strategies influence market segmentation and pricing. These studies reinforce the argument that treating coffee demand as homogeneous can lead to misleading conclusions, as intrinsic quality attributes and external market signals drive consumer preferences. Without accounting for these differences, aggregate demand models risk oversimplifying consumer behavior, leading to misinformed trade policies and marketing strategies. Using a differentiated demand approach, researchers can better capture these dynamics, providing insights essential for industry stakeholders, policymakers, and exporters in shaping supply chain decisions.
Previous studies have extensively examined coffee demand at both household and national levels, aiming to understand key consumption drivers, price sensitivity, and socioeconomic factors. Research across various regions has consistently shown that consumer preferences are influenced by income levels, price fluctuations, and product characteristics (Capps et al., 2023; Yohannes and Matsuda, 2016; Bussolo, 2006). For instance, Capps et al. (2023) highlight the income elasticity of coffee demand in the United States, demonstrating how consumption responds to economic conditions. Similarly, Yohannes and Matsuda (2016) analyze household coffee consumption in Japan, finding that consumers exhibit significant sensitivity to price changes. These studies underscore the importance of accounting for income and price elasticities when analyzing coffee demand, particularly in markets where preferences for different coffee origins and varieties play a crucial role in shaping consumption patterns.
Saudi Arabia's coffee market has transformed significantly over the past six decades, reflecting consumer preferences, trade policies, and economic development shifts. Coffee consumption is both culturally significant and increasing rapidly, making accurate demand estimation crucial for guiding import decisions and trade policies. For instance, Saudi consumers may prefer Ethiopian coffee for its distinct flavor, whereas Brazilian coffee is often considered a more affordable option. A demand model based on country of origin accounts for these differences, enabling a detailed analysis of how price and income changes affect the demand for coffee from each exporting country. This approach provides a clearer understanding of market dynamics and supports more targeted policy decisions, benefiting importers, policymakers, and the coffee industry.
According to the Saudi Ministry of Environment, Water, and Agriculture, total coffee imports have grown significantly over the past six decades. In 1961, Saudi Arabia imported 3,740 tons of coffee, valued at $2.41 million, with 100% of imports comprising green coffee. By 1973, imports had more than doubled to 8,411 tons ($9.20 million), with green coffee maintaining a dominant share (84.19% in volume, 81.95% in value). By 2000, imports had increased substantially to 23,331 tons ($66.99 million), with green coffee comprising 91.37% of total volume and 72.63% of total value. In 2009, total imports reached 33,276 tons ($114.98 million). While green coffee still accounted for the majority (90.40% in volume, 75.07% in value), its share had started declining, indicating an emerging demand for processed coffee products. By 2021, total coffee imports surged to 101,318 tons, valued at $470.90 million, yet the share of green coffee fell to 65% in volume and 53% in value, signaling a growing preference for processed, specialty, and instant coffee. Over the past six decades, green coffee has accounted for 81.05% of total import volume and 69.32% of total import value, underscoring its historical significance while reflecting a gradual shift toward value-added coffee imports.
Given coffee origins' diversity and distinct market characteristics, a differentiated demand system is necessary to capture these variations. This study employs the Almost Ideal Demand System (AIDS) model (Deaton and Muellbauer, 1980) to estimate price and income elasticities for green coffee imports from key suppliers such as Ethiopia, Brazil, and India. By applying this framework, the analysis identifies distinct price and income elasticities for Saudi Arabia's demand for green coffee from different origins, contributing to the broader literature on coffee consumption and providing valuable insights into consumer preferences in a growing market. The observed decline in green coffee's share relative to total imports underscores the importance of considering differentiation in coffee demand as consumer preferences shift toward premium, single-origin, and processed coffee varieties, driven by economic and cultural changes.
While many studies on coffee demand focus on aggregate consumption patterns, they often overlook distinctions between coffee types or their countries of origin. Traditional demand models provide useful insights into overall market trends. Still, they fail to capture origin-specific consumer preferences shaped by factors such as quality, flavor, and perceived value. Few studies have adopted a differentiated approach, where each exporting country's coffee is treated individually to assess its unique demand elasticity. This study addresses this gap by analyzing Saudi Arabia's demand for green coffee imports through a country-of-origin framework, using the Almost Ideal Demand System (AIDS) model to estimate price and income elasticities for key suppliers such as Ethiopia, Brazil, and India. This approach extends previous research by providing a more precise analysis of demand differentiation, allowing for a deeper understanding of Saudi consumer preferences and their implications for importers, exporters, and policymakers.
Recent studies highlight the importance of analyzing demand with respect to country of origin. For instance, Alamo and Malaga (2012) examined U.S. retail coffee demand by considering origin, blend, and roast preferences, while the Specialty Coffee Transaction Guide offers pricing benchmarks for differentiated coffees, emphasizing the role of geographical indications in specialty coffee markets. In the Saudi context, understanding how price and income changes affect demand for coffee from different suppliers is essential for designing effective trade policies and market strategies. This study's findings provide valuable insights for stakeholders by revealing how sensitive Saudi consumers are to price variations in coffee imports. The high elasticity of Ethiopian coffee, for example, suggests that it is perceived as a premium product, meaning even small price reductions could significantly boost demand. In contrast, Brazilian coffee, which exhibits lower price sensitivity, may be better positioned as an affordable, stable choice in the market.
These results have important policy and business implications. Importers and retailers can use elasticity estimates to optimize sourcing, pricing strategies, and product positioning. At the same time, exporters may tailor their trade negotiations and supply chain decisions based on the relative price sensitivity of their coffee in Saudi Arabia. Policymakers can leverage these insights to support stable trade agreements and adjust tariffs to ensure consistent access to preferred imports. As Saudi Arabia's coffee market continues to expand, accounting for differentiated demand dynamics will be essential for fostering a balanced, competitive, and sustainable trade environment.
The remainder of this paper is organized as follows. Section 2 presents material and methods, including the conceptual, data, and empirical framework. Section 3 discusses the findings, their implications for policymakers and market participants, and a comparison with previous research. Finally, Section 4 concludes the study by summarizing key insights and suggesting directions for future research.
This study examines the behavior of Saudi importers of green coffee from various nations using the Almost Ideal Demand System (AIDS) model. This section describes the AIDS model, its assumptions, techniques for estimating parameters, and derived elasticities.
The Almost Ideal Demand System (AIDS), introduced by Deaton and Muellbauer (1980), is widely used in economic studies focused on demand systems due to its flexibility and consistency with consumer theory. The model offers several advantages: it is an arbitrary first-order approximation to any demand system, satisfies the axioms of choice, allows for aggregation over consumers, and accommodates non-linear Engel curves. The AIDS model is derived from the expenditure function, which represents the behavior of importers in relation to a set of goods (Yang and Koo, 1994).
Let n represent the number of the goods considered, (p1t, p2t, …, pnt) are the prices of these goods at time period t, and (q1t, q2t, …, qnt) quantities consumed at time period t, then the total expenditure on amounts imported during the time period t is. The demand equations of AIDS can be expressed in terms of the budget shares:
where is the expenditure share of good i, εit is the disturbance term, and ln Pt is the translog price index given by:
The model to be estimated is given by the system of equations summarized in Equation 1.
The Almost Ideal Demand System (AIDS) model is grounded in the principles of consumer theory, ensuring that its predictions align with rational economic behavior. To achieve this, the model must satisfy several theoretical restrictions. These restrictions are not merely mathematical constraints but are essential for ensuring the model's consistency with the axioms of consumer choice. Below, we discuss these restrictions in detail.
The adding-up condition ensures that the total expenditure on all goods equals the consumer's budget. Mathematically, this is expressed as: where wit represents the expenditure share of good i at time t. This condition implies that the sum of the expenditure shares across all goods must equal one, reflecting the consumer's budget constraint. For the AIDS model, this condition is satisfied if the following restrictions on the model's parameters hold:
These restrictions ensure that the model accurately reflects the allocation of the consumer's budget across different goods.
The homogeneity restriction ensures that the demand functions are homogeneous of degree zero in prices and income. This means that if all prices and income change by the same proportion, the quantities demanded remain unchanged. Mathematically, this restriction is expressed as:
This restriction ensures that the model is free from “money illusion," meaning that consumers respond to real changes in prices and income rather than nominal changes. It is a crucial condition for ensuring that the model's predictions are consistent with rational consumer behavior.
The symmetry restriction ensures that the compensated (Hicksian) cross-price effects between goods are symmetric, reflecting the consistency of consumer preferences. Mathematically, this restriction is expressed as:
This condition implies that the effect of a price change for good i on the demand for good j is the same as the effect of a price change for good j on the demand for good i. The symmetry restriction is derived from the assumption that the consumer's utility function is well-behaved and that the substitution effects are consistent.
The negative condition ensures that the Slutsky substitution matrix is negative semi-definite, which is a necessary condition for the demand functions to be consistent with utility maximization. Mathematically, this condition requires that the own-price elasticities are non-positive:
where eii represents the own-price elasticity of demand for good i. This condition ensures that the law of demand holds, meaning that an increase in the price of a good leads to a decrease in its quantity demanded, all else being equal.
The AIDS model enables the computation of expenditure (income) elasticities (ηi) and Marshallian (uncompensated) price elasticities (Θij). The income elasticity is calculated as:
The own- and cross-price elasticities can be calculated using the following equation (Gravelle and Rees, 2004; Nicholson, 2005):
Equation 8 can be simplified as:
The Almost Ideal Demand System (AIDS) model is estimated using a system of equations derived from the budget share (Equation 1). However, due to the adding-up condition, the system of equations is singular, as the sum of the expenditure shares equals one, and the sum of the disturbance terms equals zero. To address this issue, one equation is dropped from the system, and the parameters of the omitted equation are recovered using the theoretical restrictions (Equations 3–6). This approach ensures that the estimated model is theoretically consistent and empirically robust.
The system of equations in Equation 1 is non-linear due to the presence of the translog price index ln Pt. To simplify the estimation, Deaton and Muellbauer (1980) propose using the Stone price index as an approximation:
where is the Stone price index. Substituting this into Equation 1 yields the Linear Approximate Almost Ideal Demand System (LA-AIDS):
The LA-AIDS model can be estimated using the Zellner (1962) Seemingly Unrelated Regression (SUR) method, which accounts for the correlation between the disturbance terms across equations. However, using the Stone price index introduces a simultaneity bias, as the budget shares wit appear on both the left-hand and right-hand sides of the equation. To mitigate this issue, lagged budget shares are often used in the Stone price index:
Alternatively, the nonlinear AIDS model can be estimated directly using Nonlinear Seemingly Unrelated Regression (NLSUR) or Maximum Likelihood (ML). These methods provide consistent and efficient estimates, avoiding the issues associated with the Stone price index.
In this study, the AIDS model is estimated using the R software, specifically the micEconAids package, which provides a straightforward way to perform econometric estimation of the AIDS model (Henningsen and Hamann, 2008). The package includes the aidsEst function, which allows for estimating the model parameters, elasticities, and hypothesis testing.
This study employs the Almost Ideal Demand System (AIDS) model to explore and assess Saudi Arabia's demand for green coffee imported from major producing nations (Ethiopia, Brazil, and India). Additionally, it includes data from secondary coffee-producing countries (Colombia, Vietnam, and Kenya, aggregated as the rest of the countries). Secondary data on the quantities of green coffee (qi) imported from these countries and their respective values (mi) are from the Food and Agriculture Organization (FAO) from 1999 to 2021. Based on this data, we calculated the year-on-year import prices () and the expenditure shares ().
Figure 1 displays the historical trends of green coffee import volumes (left panel) and values (right panel) for Saudi Arabia's coffee imports from Ethiopia, Brazil, India, and other countries. We employed a logarithmic scale to account for the significant disparity in import figures–where Ethiopia's imports are more than tenfold those of other countries. The data reveal that Saudi Arabia's imports of Ethiopian green coffee from 1999 to 2021 exhibit a consistent positive linear trend. In contrast, imports from other countries show no clear pattern over time. Furthermore, the import volumes of these other varieties are relatively similar, with no significant differences observed.
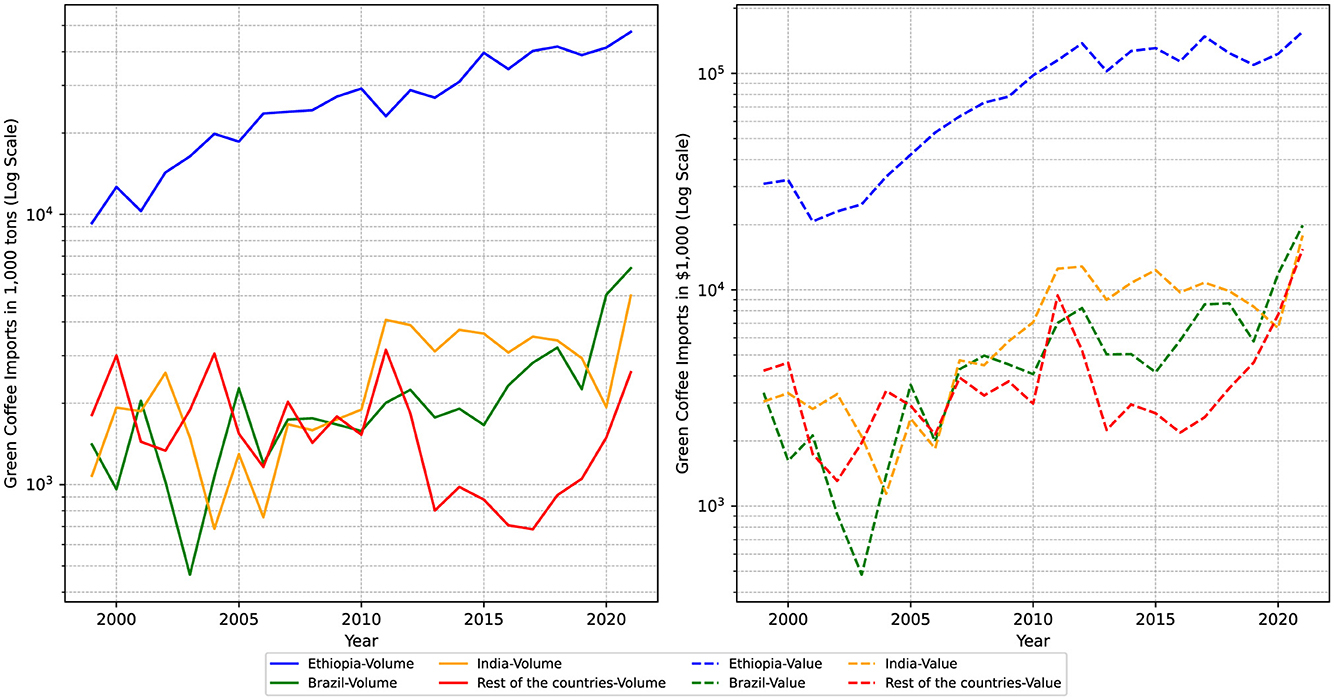
Figure 1. Historical trends in Saudi Arabia Green Coffee imports in volume (left) and value (right) between 1999 and 2021.
Table 1 provides descriptive statistics for the quantities, values, prices, and budget shares of green coffee imports in Saudi Arabia from 1999 to 2021. The data reveal significant variations in import patterns across different origins, reflecting Saudi Arabia's preferences and market dynamics for green coffee.
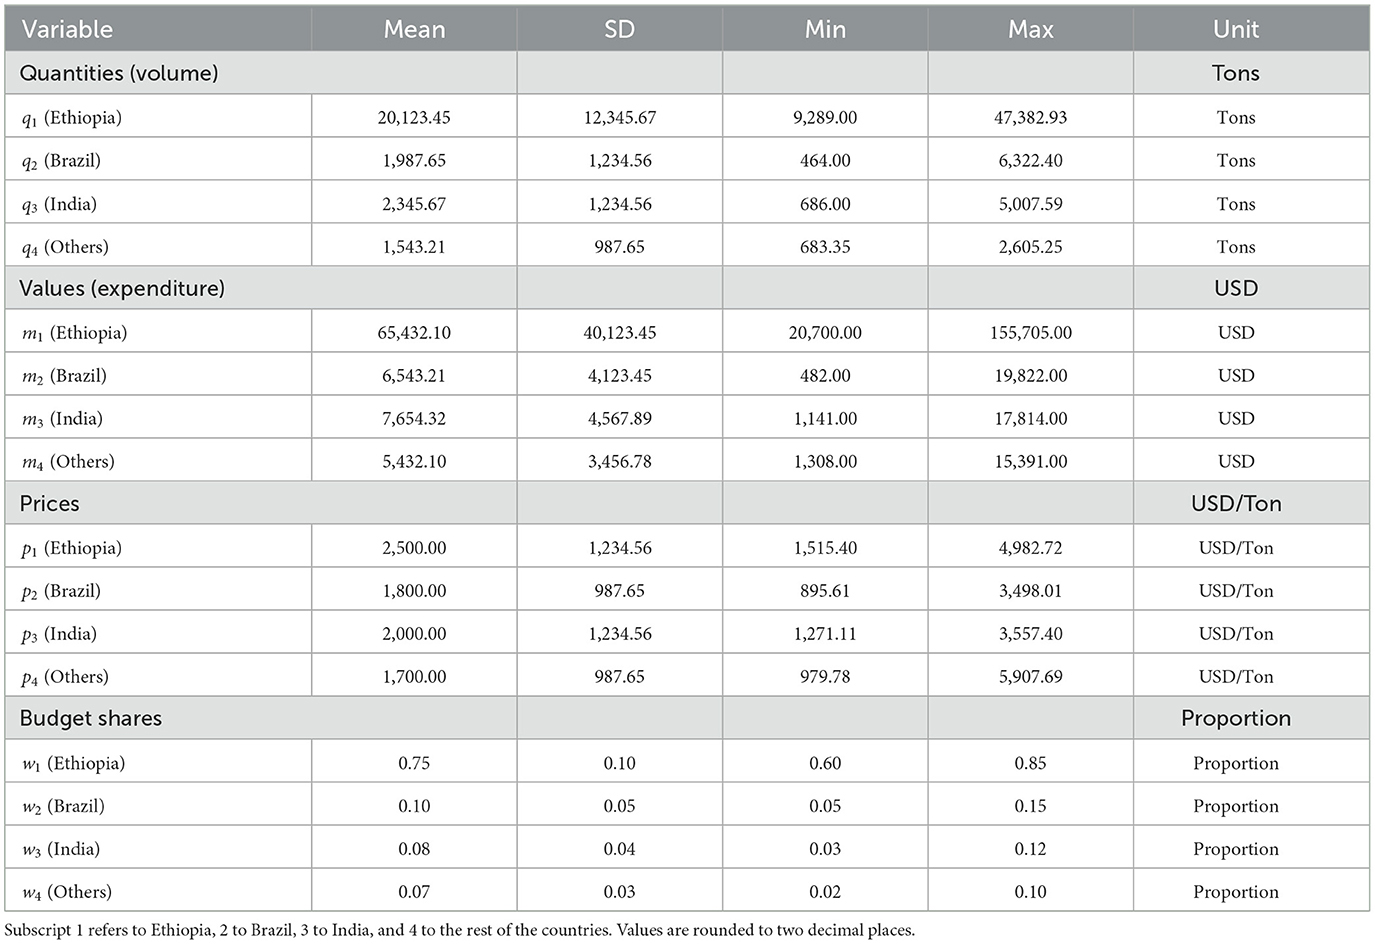
Table 1. Descriptive statistics for green coffee imports in saudi Arabia (1999–2021).
From 1999 to 2021, Saudi Arabia imported an average of 27,111 tons of Ethiopian green coffee annually, with an average price of $3,003 per ton. Ethiopia dominates Saudi Arabia's green coffee imports, accounting for 85% of the total expenditure on imported green coffee. The expenditure on Ethiopian coffee has grown at a substantial annual rate of 9.1%, significantly outpacing the growth rate of import prices, which stood at 2.6%. This strong demand has led to a yearly increase of 6.5% in the volume of Ethiopian green coffee imported.
In contrast, the average quantity of Brazilian green coffee imported by Saudi Arabia is 2,120 tons, with an average price of $2,330 per ton. Brazil's share of Saudi Arabia's green coffee expenditure is relatively smaller, at 5%. However, the expenditure on Brazilian coffee has grown at an annual rate of 10%, which is higher than the growth rate of import prices (4%). This has resulted in a yearly growth rate of 6.1% in the volume of Brazilian coffee imports, indicating a steady demand for this origin.
Indian green coffee imports show a similar trend, with an average annual import volume of 2,476 tons and an average price of $2,695 per ton. Saudi Arabia spends an average of $7,079 thousand on Indian coffee, representing 5% of the total expenditure on imported green coffee. The expenditure on Indian coffee has grown at an annual rate of 8.8%, surpassing the growth rate of import prices (3.4%). Consequently, the volume of Indian coffee imports has increased by 5.4% annually.
Imports from other countries, including Colombia, Vietnam, and Kenya, average 1,613 tons annually, with an average price of $2,653 per ton. These countries collectively account for 4.8% of Saudi Arabia's total expenditure on green coffee imports. However, the growth rate of expenditure on these imports (3.6%) is lower than the growth rate of import prices (6.5%), leading to a 3% annual decline in import volumes. This suggests a shift in consumer preferences toward coffee from Ethiopia, Brazil, and India.
Table 1 highlights the relative significance of Saudi Arabia's demand for green coffee from different origins. Ethiopian coffee holds the largest market share, accounting for 85% of total expenditure, followed by Indian coffee (6.9%) and Brazilian coffee (5%). Coffee from other countries, including Colombia, Vietnam, and Kenya, collectively represents 4.8% of total expenditure. These findings underscore the dominance of Ethiopian coffee in Saudi Arabia's green coffee market while revealing steady demand for Brazilian and Indian varieties. The declining imports from other countries suggest a potential shift in consumer preferences toward higher-quality or more competitively priced coffee from major suppliers.
To estimate the model given by Equation 1 under the theoretical restrictions given Equations 3–6, we construct the empirical model presented in Equation 13. It assumes that p1t, p2t, p3t, and p4t represent the import prices of green coffee ($/ton) at time t from Ethiopia, Brazil, India, and other countries (Colombia, Vietnam, and Kenya), respectively. w1t, w2t, w3t, and w4t represent the distribution of budget shares on imported goods from the specified nations at time t. mt indicates the total expenditure on imports from these countries and represents the entire budget at time t. By replacing the variables in the AIDS model (1) with the variables under study, the empirical model can be formulated as follows:
To simplify the AIDS model, one equation is dropped, and it is assumed that the constant in the price index (Equation 2) is normalized to zero. The system of equation in Equation 13 is estimated by the Nonlinear Seemingly Unrelated Regression (NLSUR) method.
The Almost Ideal Demand System (AIDS) model was applied to estimate the parameters and demand elasticities for green coffee imports in Saudi Arabia. The results provide insights into how Saudi importers respond to price and income changes across different coffee origins, examining own-price, cross-price, and income elasticities. Additionally, we evaluate the significance of each type of coffee based on consumer perceptions, test the consistency of the estimated demand model, and predict import trends through 2030.
Table 2 provides the estimated parameters of the AIDS model, which are fundamental to understanding the sensitivity of Saudi demand for green coffee from various countries. These parameter estimates are used to calculate elasticities, helping to identify how price and income changes affect coffee demand from each origin. The estimates reveal positive and statistically significant intercept values for Ethiopian and Brazilian green coffee, indicating that these coffee types have substantial baseline shares in Saudi Arabia's import market. The estimated coefficients for Ethiopian coffee, in particular, underscore its dominant role in Saudi Arabia's green coffee imports, as reflected by its high intercept value. In contrast, the intercept for Indian coffee is lower and not statistically significant, suggesting a smaller baseline share and less market penetration compared to Ethiopian and Brazilian coffees.
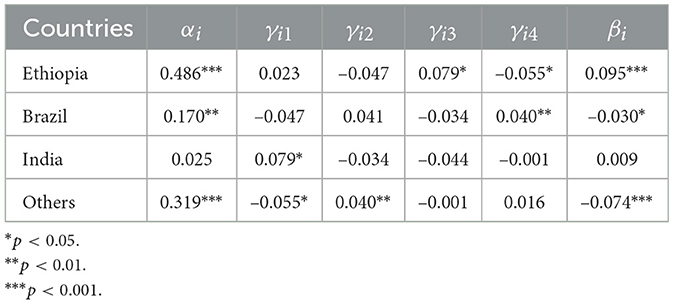
Table 2. Results of ILLE method to coefficients of the almost ideal demand system.
Table 3 presents the calculated own-price and cross-price elasticities based on the parameter estimates. The own-price elasticity of demand for Ethiopian green coffee is –1.029, indicating a significant elasticity; a 10% increase in price would reduce demand by ~10.3%, showing Saudi consumers' high sensitivity to price changes for Ethiopian coffee. In contrast, Brazilian green coffee has a price elasticity of –0.629, indicating a lower sensitivity and suggesting that Saudi consumers view it as a more stable product in their consumption choices. Indian coffee shows high price elasticity at –1.635, reflecting strong responsiveness to price changes.
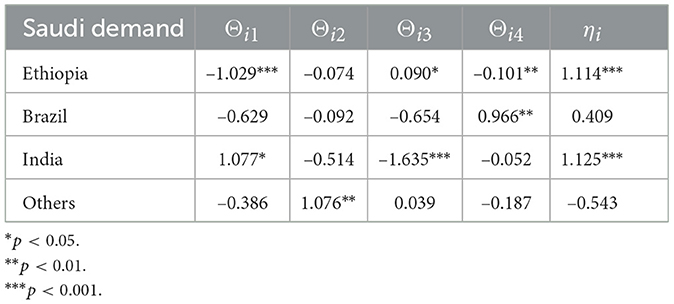
Table 3. Marshallian price elasticities and income elasticities.
Table 4 summarizes the projected demand for green coffee imports in Saudi Arabia through 2030 based on observed import prices and expenditure growth rates. Ethiopian, Brazilian, and Indian coffee imports are projected to grow annually by 6.2%, 5.3%, and 4.3%, respectively, reflecting an increasing preference for these origins. In contrast, imports from other countries (Colombia, Vietnam, and Kenya) are expected to decline at an annual rate of 4%, suggesting a shift in consumer preferences.
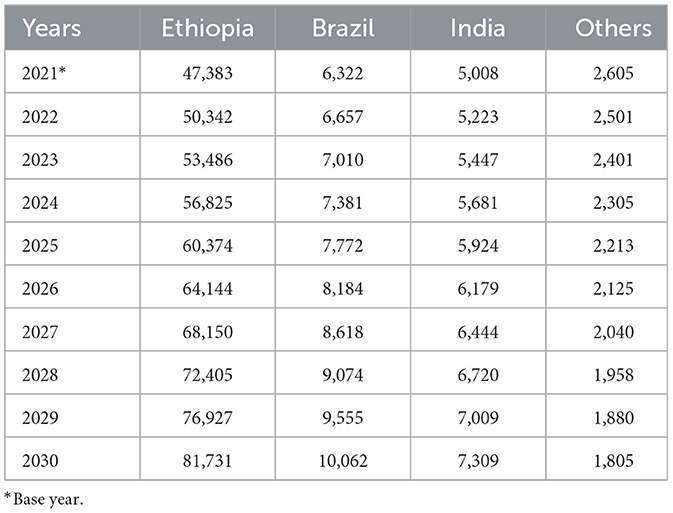
Table 4. Prediction of Saudi's green coffee imports.
The estimated AIDS model parameters were tested for consistency with economic theory by evaluating adding-up, homogeneity, symmetry, and negativity restrictions, as shown in Table 5.
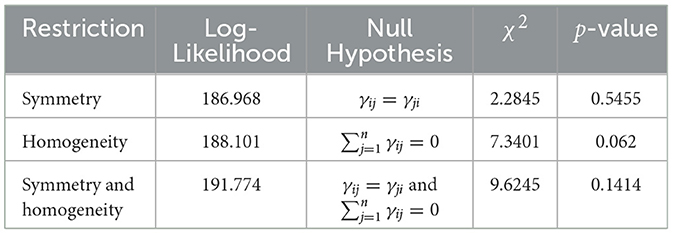
Table 5. Results of likelihood ratio tests for theoretical restrictions.
The results indicate that the model satisfies the adding-up, homogeneity, and symmetry conditions, supporting its consistency with economic theory. However, the negativity condition is only partially met, suggesting limitations in the model's ability to capture consumer behavior fully.
The results of this study align with and extend previous research on differentiated demand in agricultural markets, particularly in the context of coffee. The dominance of Ethiopian coffee in Saudi Arabia's imports, characterized by its high income elasticity (1.114), is consistent with findings from other studies that highlight the importance of origin-specific attributes in shaping consumer preferences. For instance, Marescotti et al. (2016) and Grieco (2022) have shown that geographical indications and country-of-origin branding significantly influence consumer demand, particularly for premium products like Ethiopian coffee. The high price elasticity of Ethiopian coffee (−1.029) further supports the notion that consumers perceive it as a luxury good, as observed in studies by Teuber (2010) and Liu et al. (2019), which emphasize the role of quality and flavor profiles in driving demand for specialty coffees.
Brazilian coffee, with its lower price elasticity (−0.629), aligns with findings from studies such as Capps et al. (2023)and Yohannes and Matsuda (2016), which suggest that more affordable, stable products are often treated as necessities in consumer demand models. This is particularly relevant in markets like Saudi Arabia, where Brazilian coffee serves as a reliable, everyday option. Similarly, the high price elasticity of Indian coffee (−1.635) reflects its niche position in the market, consistent with research by Alamo and Malaga (2012), who found that price sensitivity varies significantly across coffee origins and types.
The substitutive relationship between Ethiopian and Indian coffees, as well as the complementary relationship between Ethiopian coffee and imports from other countries (Colombia, Vietnam, and Kenya), underscores the importance of origin-specific differentiation in consumer preferences. These findings are in line with studies by Bouamra-Mechemache et al. (2008) and Davis and Stewart (2002), which highlight how consumers differentiate between products based on attributes such as flavor, quality, and branding. The projected growth in imports from Ethiopia, Brazil, and India, coupled with declining imports from other countries, further supports the argument that Saudi consumers are increasingly prioritizing quality and origin-specific characteristics, as noted in the Specialty Coffee Transaction Guide and research by Storer (2017).
From a policy perspective, these findings emphasize the need for targeted trade policies that ensure stable access to preferred coffee origins. The high elasticity of Ethiopian coffee suggests that even small price reductions could significantly boost demand. In contrast, the stability of Brazilian coffee imports highlights the importance of maintaining competitive pricing and supply reliability. These insights are particularly relevant for policymakers and importers, as they align with the broader literature on trade policy and consumer behavior in agricultural markets (Feleke and Walters, 2005; Daviron and Ponte, 2005).
This study examined the demand for imported green coffee in Saudi Arabia using the Almost Ideal Demand System (AIDS) model, focusing on the differentiated demand for coffee from Ethiopia, Brazil, India, and other countries. The primary objectives were to estimate price and income elasticities and to understand how consumer preferences vary by origin. The findings reveal that Ethiopian coffee, with its high income elasticity (1.114), is perceived as a luxury good, while Brazilian coffee, with lower price elasticity (−0.629), is considered a necessity. Indian coffee, despite its high price elasticity (–1.635), occupies a smaller market share, indicating a niche position. The results also highlight the substitutive relationship between Ethiopian and Indian coffees and the complementary relationship between Ethiopian coffee and imports from other countries. These findings underscore the importance of origin-specific attributes in shaping consumer preferences and have significant implications for importers, exporters, and policymakers.
These insights have significant implications for importers, exporters, and policymakers. Importers should prioritize sourcing Ethiopian coffee due to its high demand elasticity and premium status, while maintaining Brazilian coffee as a stable, affordable option, and promoting Indian coffee as a competitive alternative in price-sensitive segments. For exporters, Ethiopian producers should emphasize the unique flavor profiles and premium quality of their coffee to appeal to affluent Saudi consumers, while Brazilian exporters should focus on maintaining supply stability and competitive pricing. Indian exporters could explore opportunities to increase market share through competitive pricing strategies. Policymakers should consider reducing tariffs or implementing trade agreements to ensure stable access to preferred coffee origins, particularly Ethiopia and Brazil, which would support consumer welfare and foster a competitive and sustainable trade environment.
While this study provides valuable insights, it is important to note that the findings are based on historical data and certain theoretical assumptions, which may not fully capture all market dynamics. Future research could build on these findings by incorporating additional data sources, exploring the impact of emerging trends such as sustainability and ethical sourcing, and refining the model to account for external factors like climate change and geopolitical shifts. Such efforts would further enhance our understanding of the evolving coffee market in Saudi Arabia and beyond.
The raw data supporting the conclusions of this article will be made available by the authors, without undue reservation.
EA: Writing – review & editing, Project administration, Conceptualization, Writing – original draft. BC: Writing – review & editing. AK: Writing – original draft. MA: Conceptualization, Data curation, Software, Validation, Writing – original draft. AA: Writing – review & editing, Project administration, Resources, Investigation. YK: Writing – review & editing, Conceptualization.
The author(s) declare that financial support was received for the research and/or publication of this article. This research receives specific funding from Researchers Supporting Project number (RSPD2025R819), King Saud University, Riyadh, Saudi Arabia.
The authors declare that the research was conducted in the absence of any commercial or financial relationships that could be construed as a potential conflict of interest.
The author(s) declare that no Gen AI was used in the creation of this manuscript.
All claims expressed in this article are solely those of the authors and do not necessarily represent those of their affiliated organizations, or those of the publisher, the editors and the reviewers. Any product that may be evaluated in this article, or claim that may be made by its manufacturer, is not guaranteed or endorsed by the publisher.
Alamo, C. I., and Malaga, J. E. (2012). “Coffee differentiation: demand analysis at retail level in the US market,” in 2012 Annual Meeting, February 4-7, 2012, Birmingham, Alabama. Atlanta, GA: Southern Agricultural Economics Association.
Bouamra-Mechemache, Z., Réquillart, V., Soregaroli, C., and Trévisiol, A. (2008). Demand for dairy products in the EU. Food Policy 33, 644–656. doi: 10.1016/j.foodpol.2008.05.001
Bresnahan, T. F. (1987). Competition and collusion in the American automobile industry: the 1955 price war. J. Ind. Econ. 35, 457–482. doi: 10.2307/2098583
Brown, D. J., and Schrader, L. F. (1990). Cholesterol information and shell egg consumption. Am. J. Agric. Econ. 72, 548–555. doi: 10.2307/1243023
Bussolo, M. (2006). The impact of commodity price changes on rural households: The case of coffee in Uganda, volume 4088. Washington, DC: World Bank Publications. doi: 10.1596/1813-9450-4088
Capps, O., Cheng, M., Kee, J., and Priestley, S. L. (2023). A cross-sectional analysis of the demand for coffee in the United States. Agribusiness 39, 494–514. doi: 10.1002/agr.21779
Daviron, B., and Ponte, S. (2005). The Coffee Paradox: Global Markets, Commodity Trade and the Elusive Promise of Development. London: Zed books. doi: 10.5040/9781350222984
Davis, D. E., and Stewart, H. (2002). Changing consumer demands create opportunities for us food system. Food Rev./Natl. Food Rev. 25, 19–23. doi: 10.22004/ag.econ.266243
Feleke, S. T., and Walters, L. M. (2005). Global coffee import demand in a new era: Implications for developing countries. Rev. Appl. Econ. 1, 223–237.
Grieco, F. (2022). The European Coffee Market: Differentiated Demand and Producers' Strategies (PhD thesis). Torino: Politecnico di Torino.
Henningsen, A., and Hamann, J. D. (2008). Systemfit: a package for estimating systems of simultaneous equations in r. J. Stat. Softw. 23, 1–40. doi: 10.18637/jss.v023.i04
International Coffee Organization (ICO) (2012). Annual review. Available online at: https://ico.org/documents/cy2013-14/annual-review-2012-13-e.pdf (accessed January 22, 2025).
Liu, C.-C., Chen, C.-W., and Chen, H.-S. (2019). Measuring consumer preferences and willingness to pay for coffee certification labels in Taiwan. Sustainability 11:1297. doi: 10.3390/su11051297
Marescotti, A.Belletti, G., et al. (2016). Differentiation strategies in coffee global value chains through reference to territorial origin in Latin American countries. Cult. Hist. Digit. J. 5:e007. doi: 10.3989/chdj.2016.007
Moschini, G., Moro, D., and Green, R. D. (1994). Maintaining and testing separability in demand systems. Am. J. Agric. Econ. 76, 61–73. doi: 10.2307/1243921
Nevo, A. (2001). Measuring market power in the ready-to-eat cereal industry. Econometrica 69, 307–342. doi: 10.1111/1468-0262.00194
Nicholson, W. (2005). Microeconomic Theory: Basic Principles and Extensions. Nashville, TN: South Western Educational Publishing.
Pohlan, H. A. J., and Janssens, M. (2010). Growth and production of coffee. Soils Plant Growth Crop Product. 3:101.
Storer, G. X. (2017). “Direct trade coffee and product differentiation in the coffee market,” in The Value Of Your Life Blog. Available online at: https://grantxstorer.com/direct-trade-coffee-and-product-differentiation-in-the-coffee-market/ (accessed July 5, 2017).
Teuber, R. (2010). Geographical indications of origin as a tool of product differentiation: the case of coffee. J. Int. Food Agribus. Mark. 22, 277–298. doi: 10.1080/08974431003641612
Yang, S.-R., and Koo, W. W. (1994). Japanese meat import demand estimation with the source differentiated AIDS model. J. Agric. Resour. Econ. 19, 396–408.
Yohannes, M. F., and Matsuda, T. (2016). Weather effects on household demand for coffee and tea in japan. Agribusiness 32, 33–44. doi: 10.1002/agr.21434
Keywords: green coffee, almost ideal demand system, Saudi Arabia, import demand, differentiated demand
Citation: Aljohani ES, Chidmi B, Kotb A, Alderiny M, Aldakhil A and Krimly Y (2025) Estimating the demand for imported green coffee in Saudi Arabia using the Almost Ideal Demand System. Front. Sustain. Food Syst. 9:1516742. doi: 10.3389/fsufs.2025.1516742
Received: 24 October 2024; Accepted: 06 March 2025;
Published: 20 March 2025.
Edited by:
Wenjin Long, China Agricultural University, ChinaReviewed by:
Justice Gameli Djokoto, Dominion University College, GhanaCopyright © 2025 Aljohani, Chidmi, Kotb, Alderiny, Aldakhil and Krimly. This is an open-access article distributed under the terms of the Creative Commons Attribution License (CC BY). The use, distribution or reproduction in other forums is permitted, provided the original author(s) and the copyright owner(s) are credited and that the original publication in this journal is cited, in accordance with accepted academic practice. No use, distribution or reproduction is permitted which does not comply with these terms.
*Correspondence: Benaissa Chidmi, YmVuYWlzc2EuY2hpZG1pQHR0dS5lZHU=
Disclaimer: All claims expressed in this article are solely those of the authors and do not necessarily represent those of their affiliated organizations, or those of the publisher, the editors and the reviewers. Any product that may be evaluated in this article or claim that may be made by its manufacturer is not guaranteed or endorsed by the publisher.
Research integrity at Frontiers
Learn more about the work of our research integrity team to safeguard the quality of each article we publish.