 Mohamad G. Abiad1†
 Maha Hoteit2,3,4†
 Maroun Khattar5
 Ferial Fattouh5
 Dana Malli5
 Esraa Antar5
 Jana El Cheikh Mohammad5
 Nour Badereddine5
 Sami El Khatib6,7
 Hussein F. Hassan4*
- 1Laboratories for the Environment, Agriculture, and Food (LEAF), Department of Nutrition and Food Sciences, Faculty of Agricultural and Food Sciences, American University of Beirut, Beirut, Lebanon
- 2PHENOL Research Group (Public Health Nutrition Program-Lebanon), Faculty of Public Health, Lebanese University, Beirut, Lebanon
- 3Food Sciences Unit, National Council for Scientific Research Lebanon (CNRS-L), Beirut, Lebanon
- 4Department of Nutrition and Food Science, School of Arts and Sciences, Lebanese American University, Beirut, Lebanon
- 5Faculty of Public Health, Lebanese University, Beirut, Lebanon
- 6Department of Food Sciences and Technology, School of Arts and Sciences, Lebanese International University, Beirut, Lebanon
- 7Center for Applied Mathematics and Bioinformatics (CAMB), Gulf University for Science and Technology, Hawally, Kuwait
Introduction: Hospital food services generate significant amounts of plate waste daily; thus, hospital waste has gained much attention in previous years.
Aim: This study aims to determine the magnitude of plate waste in Lebanese hospitals and highlight its economic and environmental repercussions.
Methods: A descriptive cross-sectional study was conducted between April 2023 and September 2023 and involved 155 inpatients from cardiovascular, gastrointestinal, obstetrics-gynecology (OBGYN), and surgical wards of 16 hospitals across the Lebanese governorates. For each patient, sociodemographic and medical characteristics were collected through a questionnaire. Plate waste % was calculated by collecting the waste at each meal after collecting the trays from the patients’ rooms to the kitchen, either through weighing or by visual estimation. To calculate the economic implication, the amount of each ingredient of the wasted food in grams was multiplied by its corresponding price, expressed as USD per hospital bed per day. For the environmental implication, the water footprint, the amount of greenhouse gases (GHG) emitted, and the amount of nitrogen lost to the environment were calculated.
Results: The plate waste represented 31.4% of the amount served, equating to an annual waste volume of 366 tonnes in the participating hospitals. The mean waste cost was USD 1.04 per hospital bed per day. On average, waste from a hospital bed per day resulted in the emission of 0.85 kg CO2-eq, the loss of 580.25 liters of fresh water, and 3.08 g of nitrogen to the environment.
Conclusion: Lebanese hospitals should take pivotal steps to reduce and manage plate waste and eventually alleviate its adverse impacts on the country’s fragile economic system and scarce environmental resources.
1 Introduction
About one-third of the food available for human consumption globally is lost or wasted (FAO, 2014a). Based on the “United Nations Environment Programme” (UNEP) Food Waste Index Report (UNSD, 2022), 17% (931 million tonnes) of the total amount of food accessible to consumers in 2019 was wasted by households, shops, restaurants, and other food services. This food waste has significant economic consequences, totaling over USD 1 trillion annually (FAO, 2014a). In addition, this food waste has environmental and sustainability implications as it contributes between 8 and 10% of the world’s greenhouse gas emissions at a time when climate action is lagging, raising the importance of tackling this global issue (UNSD, 2022). For instance, based on a report by the Food and Agriculture Organization of the United Nations in 2011, if food wastage were a country, it would rank as the third largest emitting country in the world, following China and the USA (FAO, 2014b). The decomposition of food waste in open dumps and landfills, in particular, significantly increases greenhouse gas emissions (FAO, 2022). This results in an unstable climate prone to abrupt environmental changes and extreme weather occurrences that have a detrimental effect on crop yields, lower the nutritional value of foods, disturb the supply systems, and jeopardize food security (FAO, 2022). For these reasons, minimizing food loss and waste is crucial for modifying agrifood systems. This can enhance productivity and guarantee the efficient use of natural resources, which will benefit society overall and support economic progress (FAO, 2022).
At the hospital level, food waste can occur in different stages (i.e., production, service) and has several types (avoidable, possibly avoidable, or unavoidable) (Buzby and Guthrie, 2002). At the production level, food and beverages that are thrown out even if they are still edible are avoidable. Possibly avoidable waste refers to foods and beverages that some people consume but others do not, or food that becomes edible when prepared (Buzby and Guthrie, 2002). Waste resulting from parts that cannot and should not be consumed is unavoidable (Buzby and Guthrie, 2002). At the service level, food served to inpatients is avoidable or possibly avoidable and is defined as the amount of food fit for patients’ consumption but was left uneaten, and is usually referred to as “plate waste” (Segrè, 2015), which might reflect low patient meal satisfaction, can put patients at risk of malnutrition, hidden hunger, or death, and negatively impact the environment and economy. For these reasons, plate waste and subsequent patient intake can be improved by serving high-quality meals that meet the needs of the patient without compromising the economic and environmental assets.
When it comes to the economy, some studies tackled the economic impact of plate waste in hospitals. A study done in 1992 in Saudi Arabia showed that, on average, the plate waste is equivalent to about 40% of the meal cost per patient per day (Al-Shoshan, 1992). In Australia, hospitals generate 126.8 tons of food waste annually through their various foodservices, accounting for twenty-two thousand eight hundred sixteen dollars and fifteen cents (USD 22,816.15) annually (Carino et al., 2020). In Portugal, hospitals were shown to generate 8.7 thousand tons of food waste per year, equivalent to USD 37.9 million (Dias-Ferreira et al., 2015).
In terms of environment and sustainability, a study done in Portugal found that hospitals’ food waste accounted for 16.4 thousand tonnes of CO2 equivalent (CO2-eq) annually (Dias-Ferreira et al., 2015). Additionally, a recent study in 2023 in Iran found that every kilogram of plate waste led to the gas emission of 1.4 kg of CO2-eq and a wastage of about 1,000 L of water (Anari et al., 2023a). When it comes to food groups, they impact the environment differently, making responsible consumption and reduction of waste a must. For instance, a reduction in beef and ultra-processed foods reduced carbon and water footprints by 21.1 and 20%, respectively (da Cruz et al., 2024).
Reducing food waste offers several benefits for people and the environment, such as increased food security, combating climate change, cost savings, and less strain on the land, water, biodiversity, and waste management systems (UNEP, 2021). Due to all these factors, responsible consumption is one of the United Nations’ Sustainable Development Goals (SDG 12), and one of its targets (SDG 12.3) aims at halving food waste at the retail and consumer level and food loss across supply chains by 2030, while SDG 13 calls for climate action (UNEP, 2021). Due to the scarcity of studies assessing this subject in Lebanon and the region, this study was conducted to (1) determine the magnitude of plate waste in Lebanese hospitals, (2) assess the economic cost of this generated waste, and (3) evaluate the environmental impact of plate waste in the participating hospitals. Understanding these aspects is crucial to develop effective strategies to reduce waste and optimize resource utilization in hospital settings.
2 Methods
A descriptive cross-sectional study was conducted between April 2023 and September 2023. Inpatients from cardiovascular, gastrointestinal, obstetrics-gynecology (OBGYN), and surgical wards of 16 hospitals in Lebanon were enrolled in the investigation. Hospitals were distributed across the Lebanese governorates as follows: Beirut and Mount Lebanon (43.75%), North Lebanon and Akkar (25%), South Lebanon and Nabatieh (25%), and Beqaa and Baalbeck-Hermel (6.25%), and had a total of 2,575 occupied beds, with the number of occupied beds for each hospital ranging from 24 to 325 (average of 161 beds per hospital). The majority of hospitals were located in urban areas (13), while the rest (3) were located in rural areas.
2.1 Study participants
Patients were considered the primary sampling units in this study. Participants were selected based on a convenience sampling strategy, and patients who fit the eligible criteria were included based on their willingness to participate in the study. The dietitian in charge of recruiting patients and the ward nurse identified patients who met the inclusion criteria. The dietitians then visited each eligible patient and invited them to participate. In each study ward, the sampling approach aimed to ensure that a diverse range of perspectives (including age and sex differences) were considered.
Eligible patients met the following inclusion criteria: aged 18–65 years, feeding initiation within the first 36 h after hospital admission, lack of enteral or parenteral nutritional support, not being on “nothing by mouth” (NPO) status, able to give a written consent form, and having spent at least one day and consumed at least three meals during their hospital stay (Simzari et al., 2017; van Bokhorst–de van der Schueren et al., 2012). In addition, patients on full-liquid or mechanically altered diets in the corresponding wards were excluded. Informed consent was obtained individually from all included participants in the study.
2.2 Sampling strategy
We thoroughly reviewed existing literature about rates of food waste in comparable settings, which helped us estimate the right sample size for our cross-sectional study on food waste among hospital inpatients. In order to estimate a percentage in a finite population, we used the following formula (Pourhoseingholi et al., 2013):
In the above formula, “n” represents the required sample size, “Z” represents the Z-value (1.96 for a 95% confidence level), “P” represents the estimated proportion of food waste (from literature, e.g., 0.30), and “d” represents the desired precision or margin of error (e.g., 0.05). Taking into account the finite population correction for our inpatient population, we adjusted the formula as follows:
where “N” represents the total number of inpatients during the study period. Anticipating a non-response rate of (e.g., 10%), the sample size was further adjusted:
Based on the above calculations and adjustments, the final sample size needed was 120 patients. We added 35 patients to compensate for dropouts. The total sample size (n = 155) was deemed adequate to provide reliable and generalizable results within the context of our study.
2.3 Ethical considerations
The Institutional Review Board (IRB) at the Lebanese American University (LAU) approved the study protocol; approval number: LAU.SAS.HHI.2023. Patients signed a written consent confirming their participation in the study.
2.4 Data collection
2.4.1 Demographic, socioeconomic, clinical, and anthropometric data
Basic demographic, socioeconomic, clinical, and anthropometric data for each patient were collected using a questionnaire. This included patients’ age, sex, weight and height, residency, marital status, residence area, household size, number of rooms in the home, level of education, occupation, ward name, reason for hospital admission, and length of stay (LOS).
2.4.2 Plate waste
Meals were provided to patients from the kitchen with their name, room number, and type of diet on the plate. All of the meals evaluated were of standard diet. To evaluate plate waste in the participating hospitals, we used plate waste, which refers to the percentage of the served food that is discarded. Plate waste was measured in two ways: by weighing the food served and left on the plate in grams using a portable high-precision electronic kitchen scale (TOPAZ) from numed with a 5,000 g capacity and a 1 g readability, in addition to various displaying units (g, lb., fl:oz., ml), or by visually estimating the amount of food in hospitals that did not have a high-precision scale for weighing. In hospitals where weighing was applicable, dietitians were asked to weigh the food before sending it to patients and to weigh the quantity that was thrown out thereafter. Each food item on the plate was weighed separately, and the empty plate’s weight was removed. For visual estimation, participating hospitals provided us with the standard recipes and portion size (measured in grams) for each item served to patients, and this was used in our estimations using a 5-point scale (everything was eaten, ¼ of the plate was wasted, ½ of the plate was wasted, ¾ of the plate was wasted, all the plate was wasted). For example, if half of the plate was wasted, the amount lost was calculated by dividing the usual portion size (provided by the hospital) of each item wasted by two. We considered that the portion sizes that were served corresponded to the standardized portion size of the hospital. After visually estimating the amount left as a whole meal, the weight of each item was computed from the recipes provided by the hospitals.
As such, the weight of the food was obtained before and after each meal, that is, the amount of food served and the amount of food scraps to calculate plate waste (PW), using Equation 1:
The weights of the food served and discarded at breakfast, lunch, dinner, and snacks were measured by the responsible dietitian for each eligible patient during their hospital stay, and the average amounts of food served and discarded per patient per day (or hospital bed per day) were calculated according Equations 2 and 3:
In each hospital, two dietitians (a total of 32) served as the research assistants, and a meeting was held with them before data collection to explain the study purpose and how plate collection and weighing should be done to minimize inaccuracies.
Plate waste was reported per governorate, area, meal timing, hospital ward, and food group. For food groups, recipes were obtained for the food served, and ingredients were categorized into corresponding groups in adherence to the Mediterranean diet (MD). The reason we chose the MD, which encourages the consumption of plant-based foods, including healthy fats, is because this diet is ranked as the best diet globally and was advocated by “The National Nutrition Strategy and Action Plan,” which the Lebanese Ministry of Public Health implemented as the most suitable for developing standard dietary guidelines (National Lebanon Strategy and Action Plan Nutrition, 2021). As such, each food item was weighed separately. This was done since dividing food items into groups can help in knowing which food groups are most discarded by the patients and can thus serve as an efficient approach to reduce the waste and eventually minimize the economic and environmental impacts. Food items included in each food group are shown in Supplementary Table S1.
2.4.3 Financial calculations
The financial value of discarded food was obtained using data from the “Lebanese Ministry of Economy & Trade” in Lebanese Pounds (LBP) and converted to equivalent US Dollars at the market rate during the research period (Ministry of Economy and Trade, 2023). The cost of plate waste was compared for meal timing and wards.
2.4.4 Environmental impact
For the environmental impact of plate waste, we calculated the water footprint, the amount of greenhouse gases (GHG) emitted, and the amount of nitrogen lost to the environment due to plate waste. The study also calculated and presented the environmental impact of different food groups. Food groups were divided in terms of adherence to the Mediterranean diet in this part as well.
Water footprint, which means the amount of used water during the preparation of a product, directly and indirectly (Hoekstra et al., 2011), was calculated by multiplying each component of the discarded food (kg) by its corresponding water footprint (L/kg).
For the amount of greenhouse gases emitted by the wasted food, we used the carbon footprint, which the FAO defines as the total volume of greenhouse gases released throughout a product’s lifecycle, expressed in kilograms of CO2-equivalents (FAO, 2014b). As such, each ingredient of the plate waste was multiplied by the corresponding carbon footprints, and the total greenhouse gas emitted from the wasted food was determined and expressed as kilogram CO2-equivalent (CO2-eq) per kilogram of plate waste.
The ingredients’ corresponding water and carbon footprints were determined using the food commodities’ carbon and water footprint dataset developed by Petersson et al. (2021) and Barilla Center for Food and Nutrition Double Pyramid (2024). As for the nitrogen content of wasted food, each ingredient’s protein content was divided by its corresponding nitrogen factor (N factor) extracted from the USDA Research website (Service UAR, 2023).
2.5 Statistical analysis
The gathered data underwent thorough data cleansing and were subsequently transferred to the Statistical Package for the Social Sciences (SPSS; Version 25.0, IBM Corp: Armonk, NY, USA) for analysis at a 95% confidence interval (p < 0.05 is considered significant). Since plate waste data is highly variable, the data was not normally distributed and was explored using the Shapiro–Wilk test for normality. Frequencies (N) and percentages (%) were used for categorical variables like age and sociodemographic characteristics, whereas continuous variables such as the amount of plate waste, cost, and environmental impacts (water, CO2, and nitrogen) were summarized through means and standard deviations (SD). Differences between sexes were explored using Mann–Whitney and chi-square tests, while differences among hospital wards and governorates were explored using the Kruskal-Wallis. Differences between two categorical variables (i.e., sex and marital status…) were assessed using a chi-square test.
3 Results
3.1 Characteristics of study participants
The study included 155 inpatients from cardiovascular (n = 54), gastrointestinal (n = 21), OBGYN (n = 24), and surgical (n = 56) wards. Among the participants, 58.1% were females. Most participants were residing in Beirut & Mount Lebanon (n = 69, 44.5%).
Table 1 summarizes the study participants’ basic demographic and socioeconomic characteristics and hospital stay information. Participants had a mean age of 49 years (SD: 15), and the majority (81.9%) had a length of hospital stay <7 days. Almost half of the participants (54.2%) were aged between 51 and 65 years. The mean Body Mass Index (BMI) was 25.38 (SD: 5.56) for male participants and 27.68 (SD: 6.44) for female participants. In addition, more than half of the participants were either overweight or obese (54.3%). A significant difference in the BMI existed between the two sexes (p = 0.048). Most participants (75.5%) had a household monthly income of <USD 500, and the majority of participants (87.7%) reported a decline in their monthly income amid the economic crisis that hit Lebanon since 2019. Almost half of the participants (51%) had a crowding index below 1, which indicates a higher socioeconomic status. The crowding index is calculated by dividing the number of people living in a household by the number of rooms in the house (excluding bathrooms, balconies, porches, foyers, hallways and half-rooms); values above 1 indicate that a household is crowded and eventually has a lower socioeconomic status (WHO, 2018).
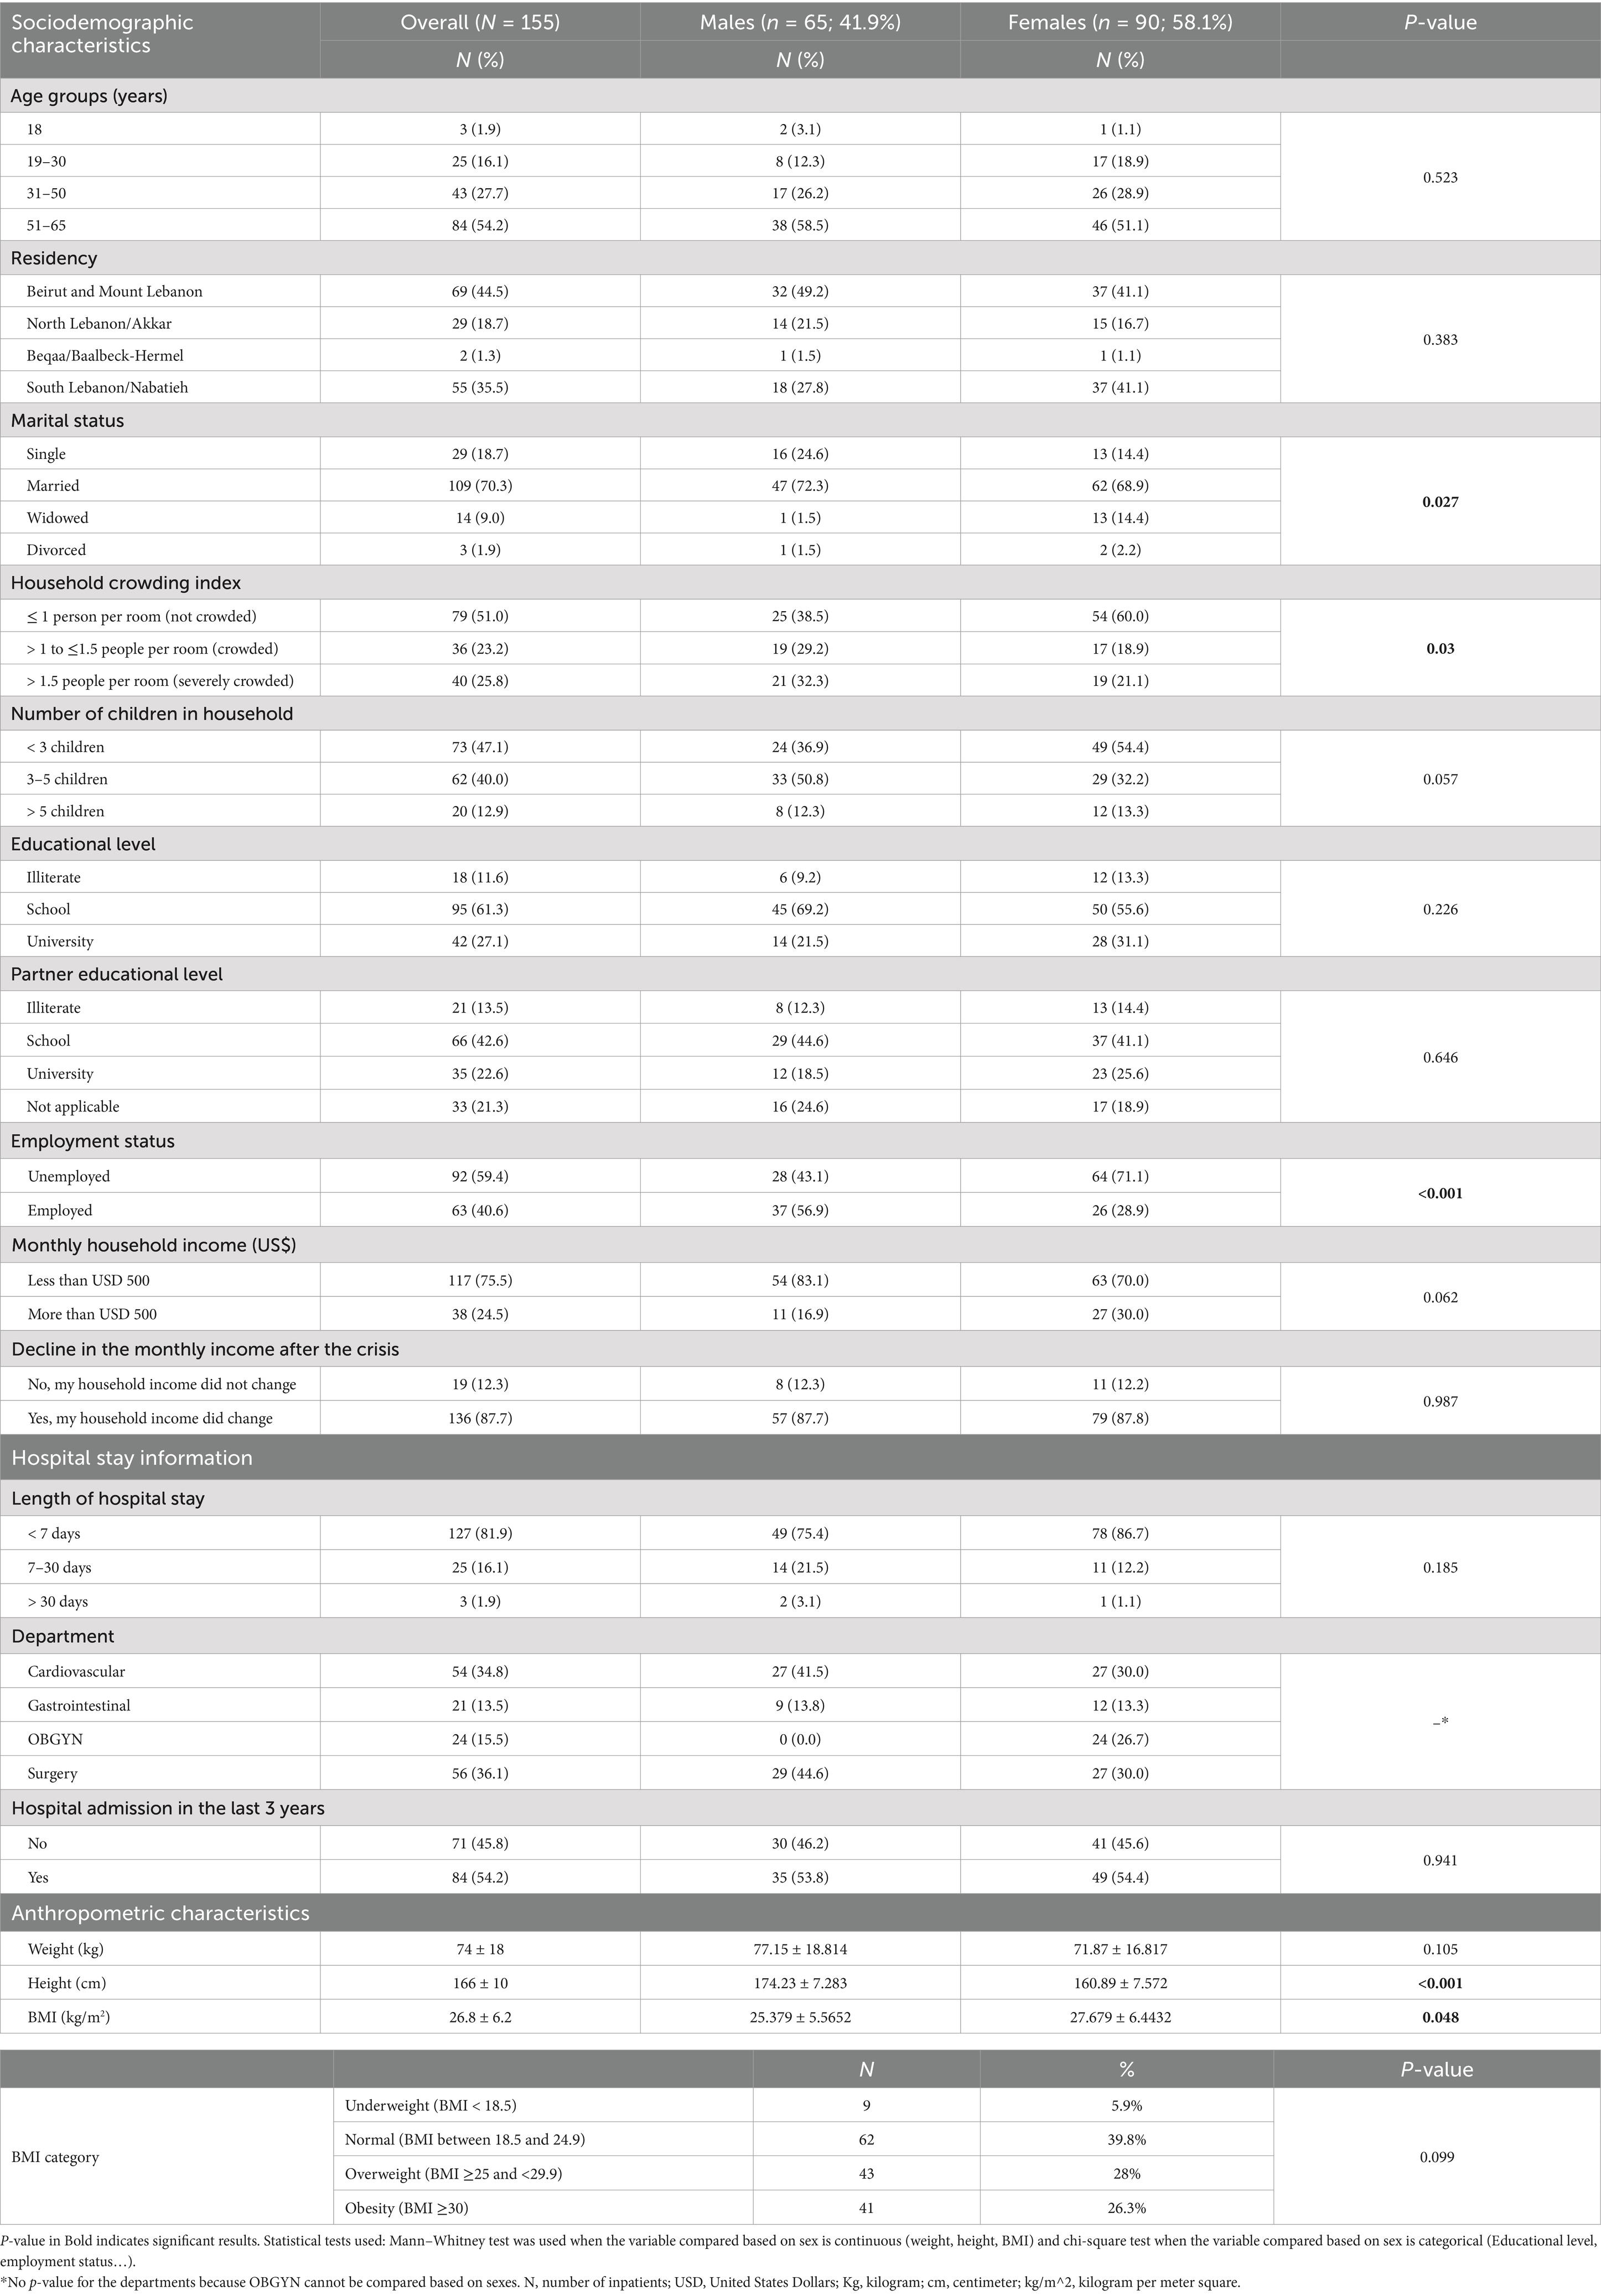
Table 1. Sociodemographic characteristics, hospital stay information, and anthropometric characteristics of the study population, overall and by sexes.
A significant difference was found between sexes when it comes to employment status (p < 0.001), marital status (p = 0.027), and household crowding index (p = 0.03).
3.2 Plate waste quantification
3.2.1 Plate waste generation
A total of 1,094 meals (202 breakfast, 258 lunch, 229 dinner, and 405 snacks) were examined. The mean daily served food was 1.24 kg (SD: 0.43) per hospital bed per day, of which 0.39 kg (SD: 0.25) was discarded per bed, equivalent to 31.4% waste of the total food served. The waste equals 142.3 kg per hospital bed per year. For the participating hospitals with 2,575 occupied beds (n = 16), the waste can be estimated to be 366.42 tonnes annually.
Based on areas, hospitals located in rural areas (n = 3) were found to have a higher mean plate waste equivalent to 0.429 kg (SD: 0.458) per hospital bed per day compared to those located in urban areas (n = 13), which had a mean plate waste of 0.379 kg per hospital bed per day (SD: 0.211) (Figure 1). No significant difference was found in the amount of waste between areas.
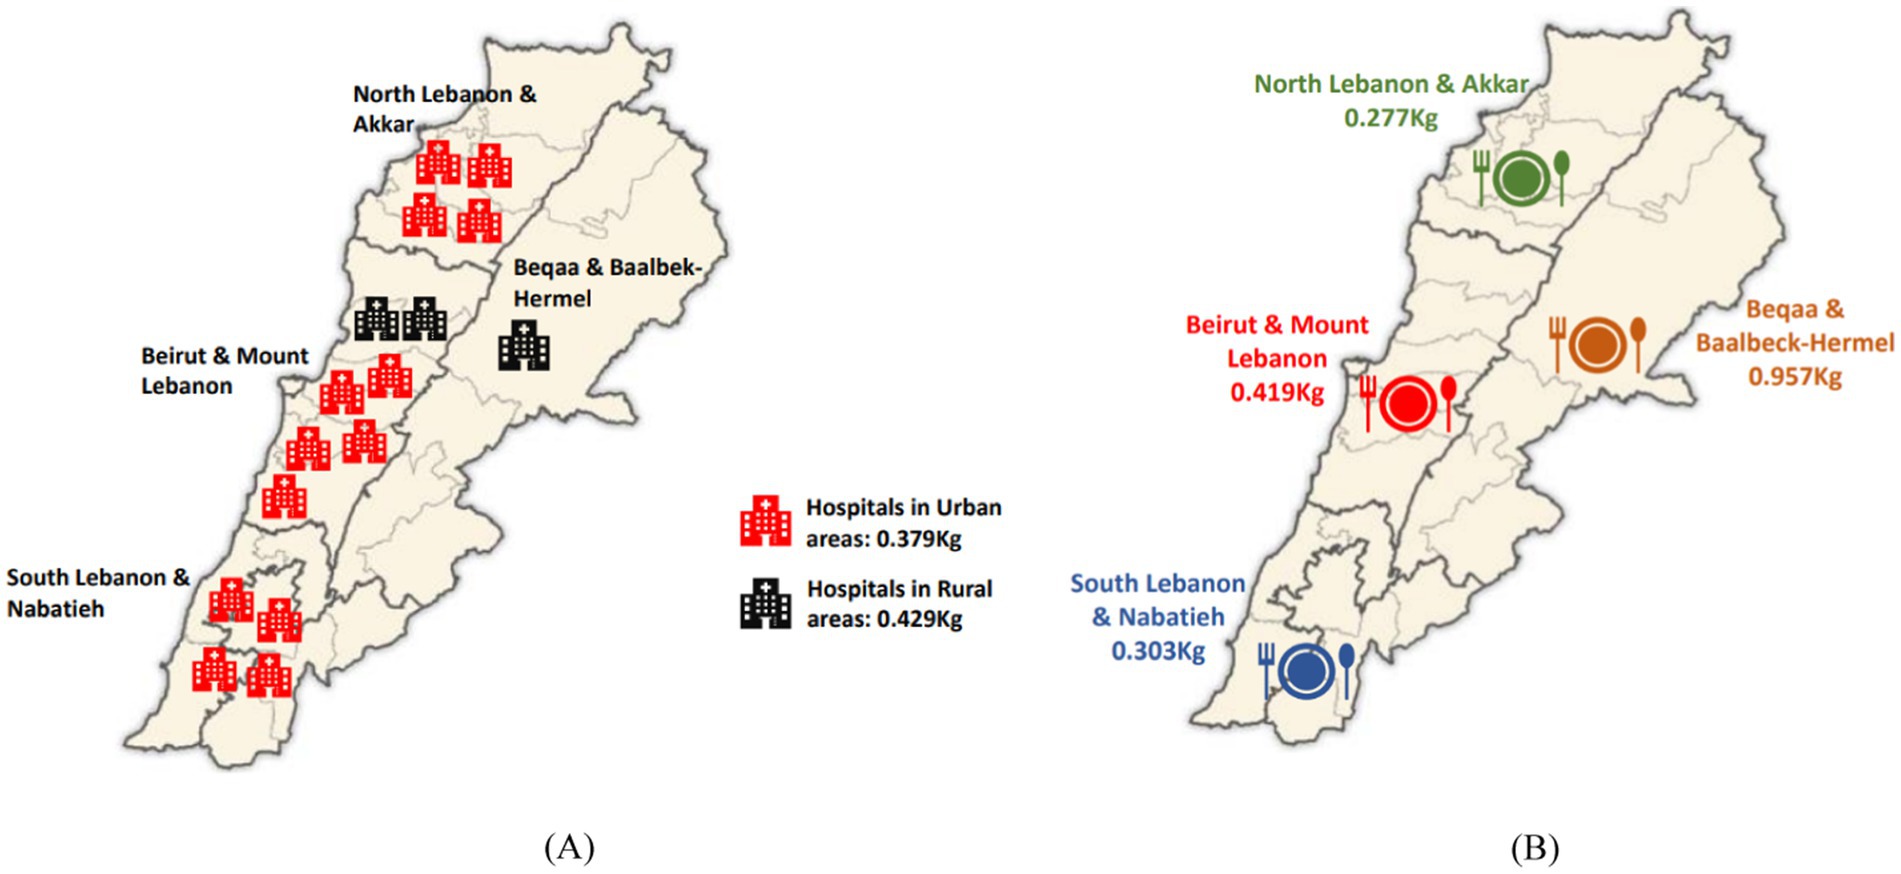
Figure 1. Plate waste based on urban vs. rural areas (A) and based on governorates (B).
Based on the governorates, the hospital in Beqaa and Baalbeck-Hermel (n = 1) had the highest mean waste per hospital bed per day, equivalent to 0.957 kg (SD: 0.409), and the hospitals located in North Lebanon and Akkar governorates (n = 4) had the lowest mean waste per hospital bed per day, equivalent to 0.277 kg (SD: 0.166) (Figure 1). A significant difference was found in the amount of plate waste among governorates (p = 0.039), and hospitals located in the North and Akkar governorates had significantly the lowest weight waste.
3.2.2 Plate waste per meal timing
Mean daily wasted food was 0.05 kg (SD: 0.038), 0.14 kg (SD: 0.091), 0.13 kg (SD: 0.112), and 0.06 kg (SD: 0.082) for breakfast, lunch, dinner, and snacks, respectively. The highest mean daily plate waste percentage was for lunch, representing 37% of the wasted weight, followed by dinner (34%), and snacks (16%), while the lowest mean daily plate waste was for breakfast (13%). Snacks were significantly wasted in larger amounts (57% of the amount served) compared to breakfast (21.7% of the amount served), lunch (28.57% of the amount served), and dinner (34.7% of the amount served) (p < 0.001).
3.2.3 Plate waste per hospital ward
Mean daily plate waste was 0.409 kg (SD: 0.379), 0.402 kg (SD: 0.403), 0.397 kg (SD: 0.417), and 0.32 kg (SD: 0.316) in the OBGYN, gastrointestinal, surgical, and cardiovascular wards, respectively. The highest mean daily plate waste was in the OBGYN ward, and the lowest mean daily plate waste was in the cardiovascular ward. No significant difference was found regarding the amount of plate waste among the studied wards.
A summary of plate waste according to meals, wards, areas, and governorates is shown in Supplementary Table S2.
3.2.4 Plate waste per food group
Table 2 shows the amount served and wasted from each food group and the percentage of waste in decreasing order. Vegetables were the most wasted food groups in our study (55.5%), followed by fats, olives, nuts and seeds (40%). Grains and cereals (13.97%) and eggs (13.89%) were the least wasted food groups. The standard size of a serving in grams (Estimation of Serving Weights for Individual Commodities, 1997; USDA, 2021) is provided in Supplementary Table S3.

Table 2. Percentage wasted from each food group.
3.3 Economic impact of plate waste
To estimate the financial burden of plate waste, we calculated the cost of plate waste considering the market currency exchange rate of USD 1 = LBP 89,500. The mean cost of plate waste in the studied hospitals was USD 1.04 (LBP 93,461) per hospital bed per day, equivalent to USD 379.6 per hospital bed per year. The highest mean waste cost was for breakfast (USD 0.39), followed by lunch and dinner, with almost the same mean waste cost (USD 0.3 and USD 0.29, respectively), and the lowest mean waste cost was for snacks (USD 0.06) (Table 3). Considering the 16 participating hospitals, we can estimate the waste cost to be USD 977,470 annually in these hospitals only. Generally, for every 1 kg of plate waste at hospitals, the cost can be estimated to be USD 2.67.
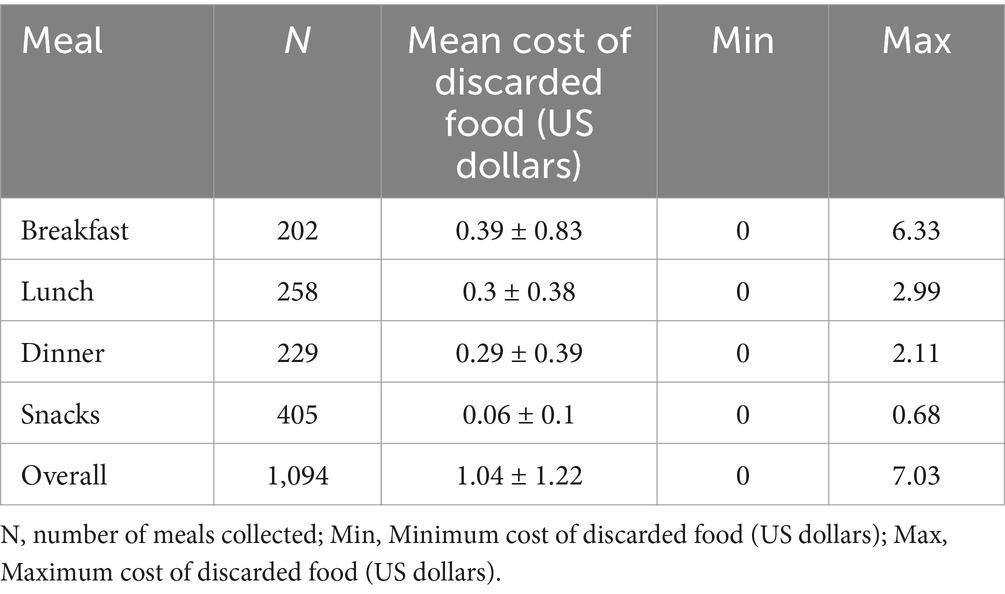
Table 3. Cost of plate waste, per meal, and overall.
In the studied wards, the highest waste cost was in the surgical ward (USD 1.25 per hospital bed per day), followed by the OBGYN ward (USD 1.2), the gastrointestinal ward (USD 0.91), and the lowest mean waste cost was in the cardiovascular ward (USD 0.81). No significant difference was found between the studied wards concerning waste costs for every meal and overall. In the cardiovascular ward, lunch had the highest mean waste cost, while breakfast mean waste cost was the highest in all the other wards (Table 4).
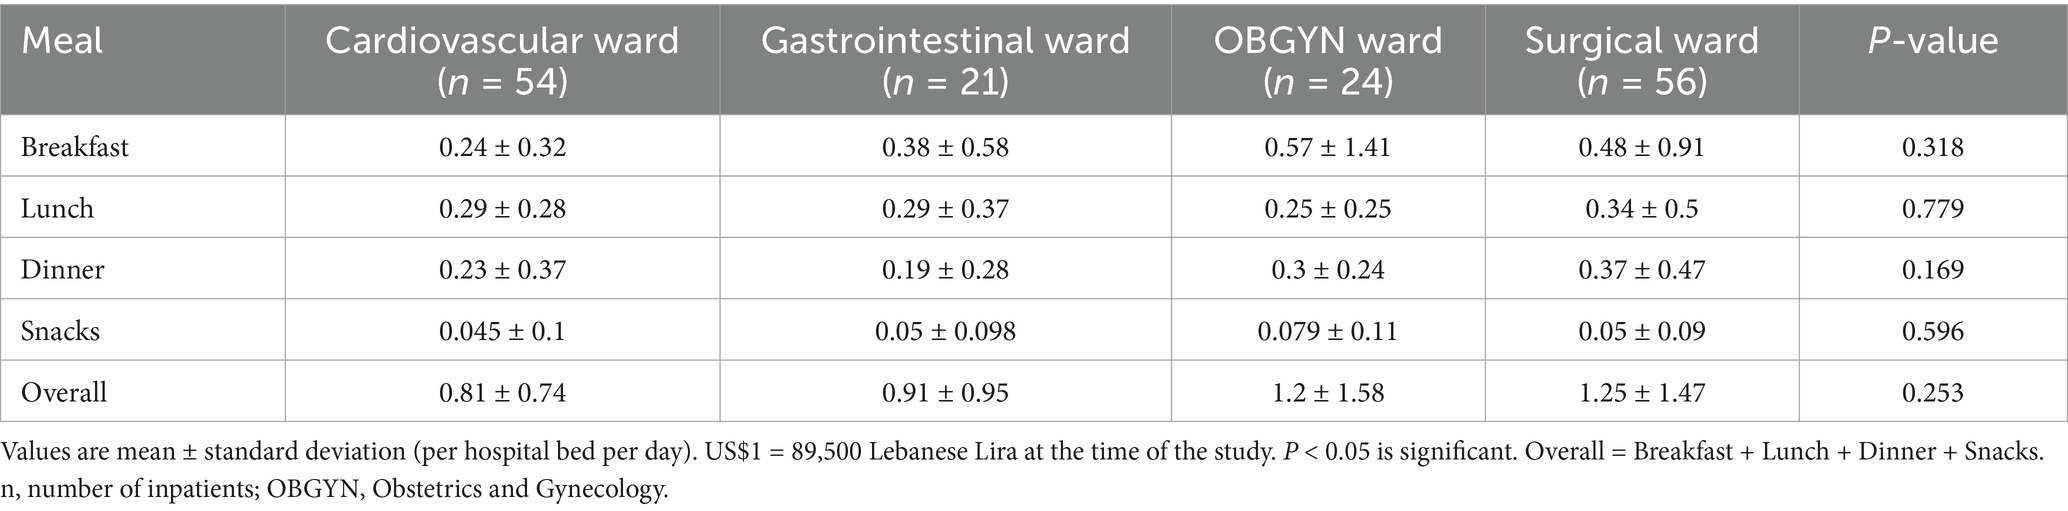
Table 4. Plate waste cost (dollar) per hospital bed per day based on hospitals’ wards.
3.4 Environmental impact of plate waste
Supplementary Table S4 shows the environmental footprints (EFPs) of every food item. The mean water footprint of the examined plate waste (0.39 kg) was 580.25 liters (SD: 582), the mean carbon footprint was 0.85 kg CO2-eq (SD: 1.5), and the mean nitrogen footprint was 3.08 g (SD: 4.31) per hospital bed per day (Table 5). This means that, on average, 1 kg of plate waste contributes to 1,487.8 liters of water use, 2.18 kg CO2-eq, and 7.9 g of nitrogen emissions.
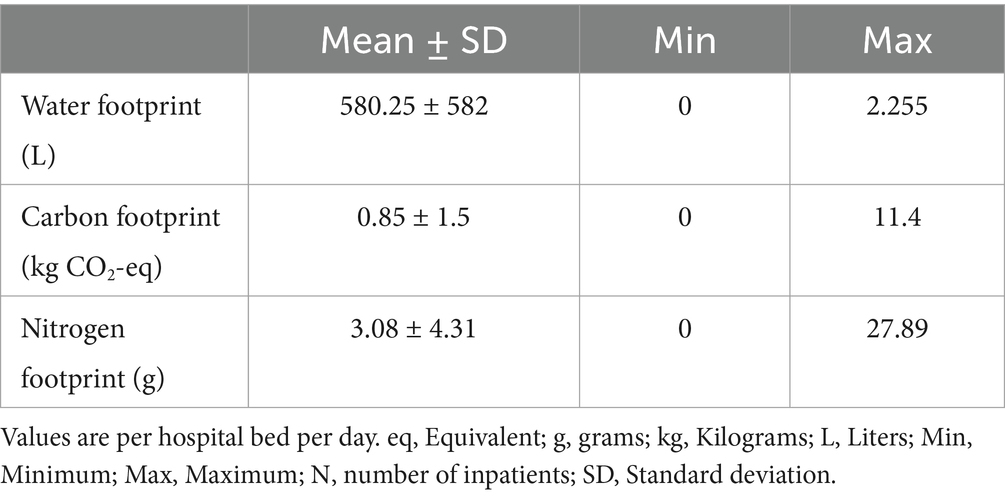
Table 5. Environmental impact of plate waste, per hospital bed per day (n = 155).
Dairy products and “meat, fish, poultry” contributed to the highest greenhouse gas emissions (GHGEs), with 0.24 (SD: 0.56) kg CO2-eq and 0.23 (SD: 0.43) kg CO2-eq, respectively. As for water footprint, dairy products contributed to the highest footprint (158.12 ± 371.8 L), followed by sweets (128.75 ± 351.21 L). For nitrogen loss, “meat, fish, poultry” contributed to the highest loss to the environment (0.76 ± 1.18 g), followed by vegetables (0.62 ± 0.71 g), dairy products (0.58 ± 1.52 g), and “grains and cereals” (0.48 ± 3.32 g). Mean water, carbon, and nitrogen footprints from the amount of waste coming from animal products were 284.25 liters, 0.48 kg CO2-eq, and 1.36 g nitrogen, respectively, while the mean water, carbon, and nitrogen footprints coming from the waste of vegetable products were 167.25 liters, 0.266 kg CO2-eq and 1.33 g nitrogen, respectively (Table 6), which means that animal products contributed to the highest EFPs in the sample.
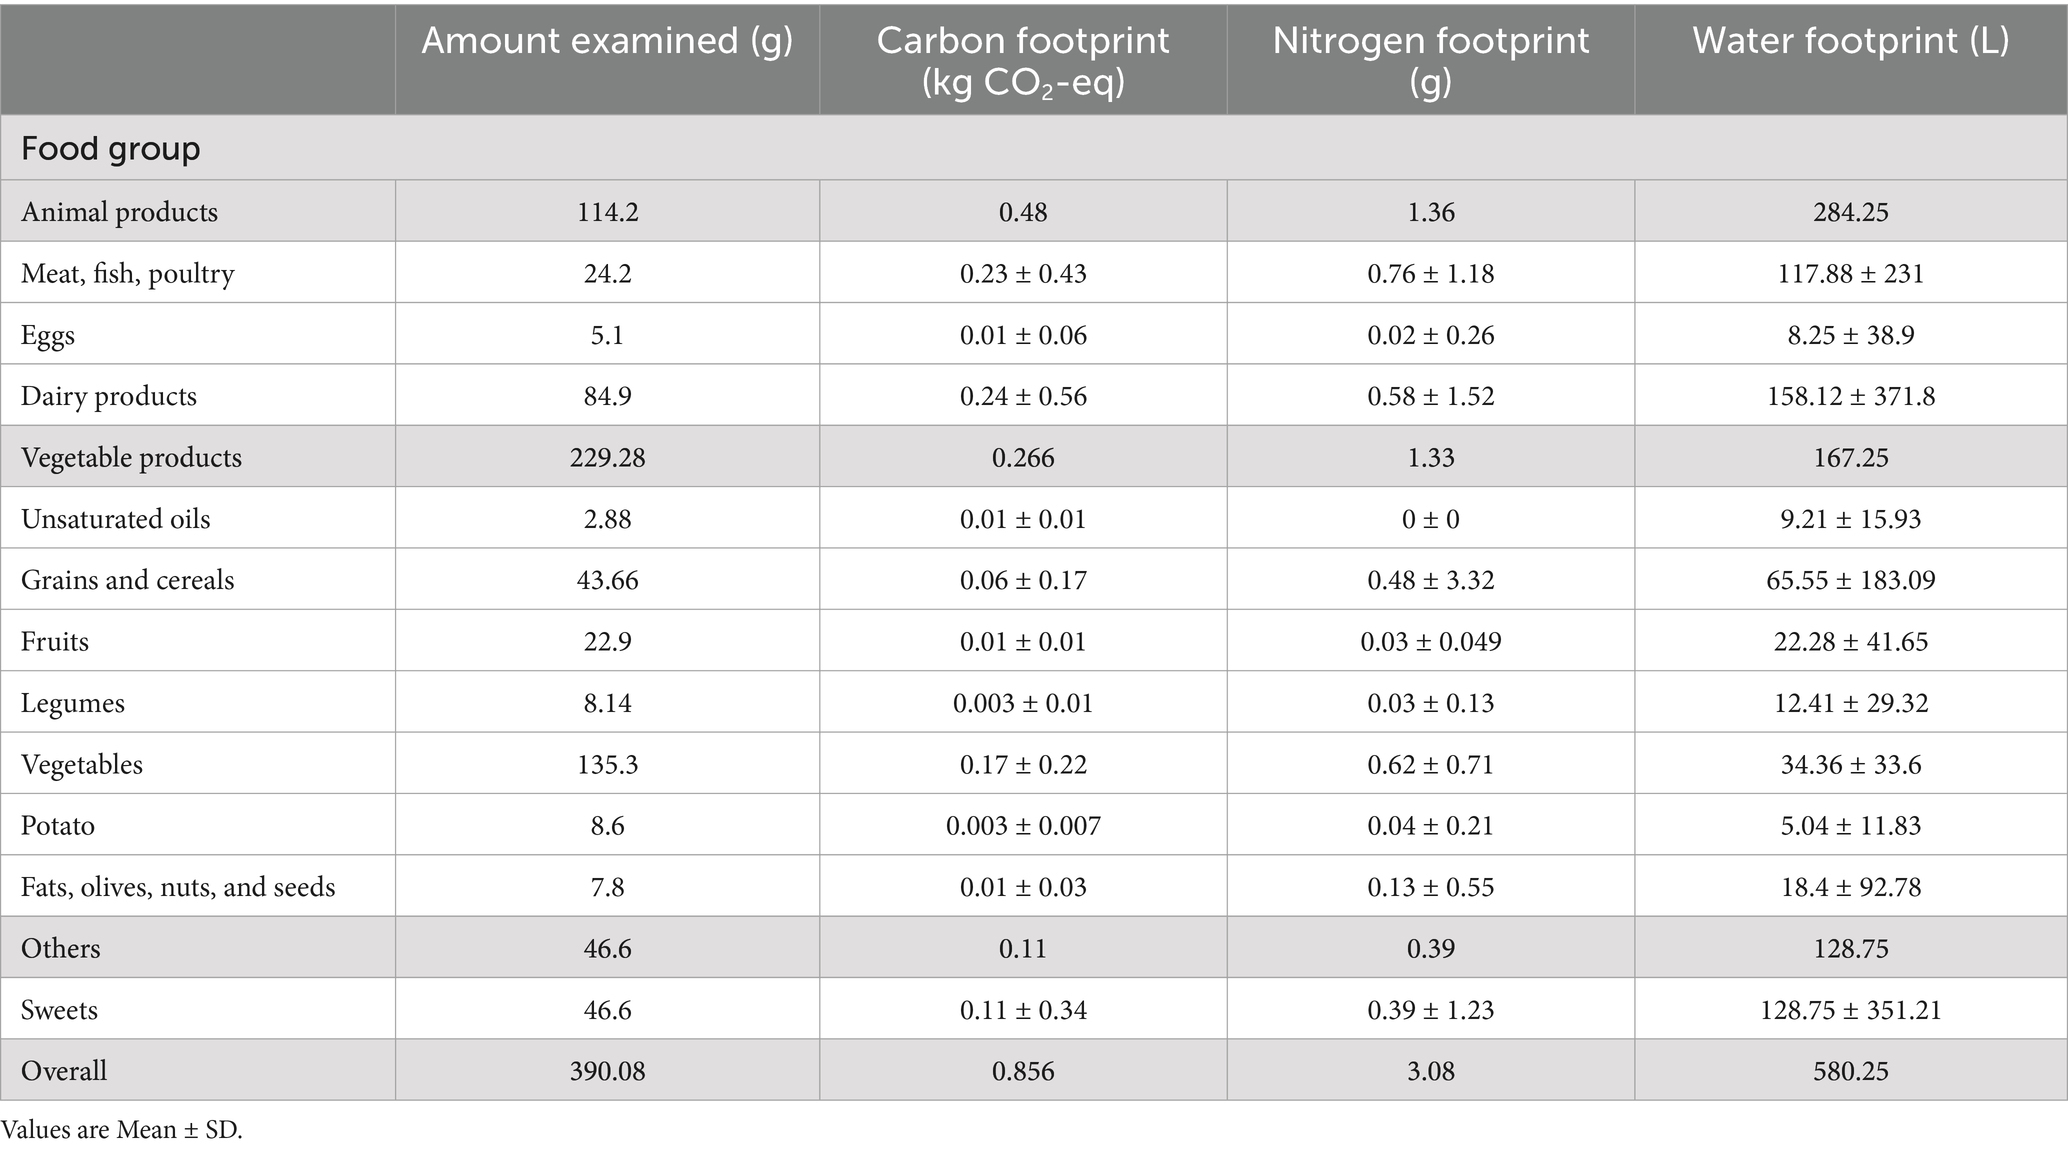
Table 6. Environmental impact of plate waste per food group wasted, per hospital bed per day.
Considering all the participating hospitals with a total of 2,575 occupied beds, we can estimate the water, carbon, and nitrogen footprints to be 1,494,143.75 liters, 2,188.75 kg CO2-eq, and 7,931 g nitrogen per day, respectively.
4 Discussion
4.1 Plate waste quantification
4.1.1 Plate waste generation
This is the first study to quantify plate waste in Lebanese hospitals and report its economic and environmental perspectives. Plate waste was significantly the lowest in North Lebanon and Akkar governorate hospitals, with the highest percentage of food insecurity (52.5%) (WFP, 2020). Concerning hospital areas, our results revealed that hospitals in rural areas generate more waste than hospitals in urban areas, which aligns with the findings in Saudi Arabia, in which plate waste is found to be affected by cultural differences, with rural hospitals generating a larger amount of waste than urban ones (Al-Shoshan, 1992).
Based on our findings, the mean daily percentage of plate waste represented 31.4% of the food served, and this is particularly high. For instance, plate waste exceeding 30% in hospital settings is categorized as high (Edwards and Nash, 1997). Similar results were obtained in a study done in Iran, where the mean total daily percentage of plate waste was 31.3% (Simzari et al., 2017). Other studies reported a lower mean total daily percentage of plate waste. For instance, a study done in Qatar by Al-Muhannadi et al. (2021) showed that plate waste represented 26.8% of the total amount served, and another study in Saudi Arabia showed that the percentage of plate waste represented 18.2% of the total amount served (Alharbi et al., 2020). On the other hand, many studies reported a higher mean total daily percentage of plate waste, especially in European countries. A study done in the Netherlands found that 38% of the food served was wasted (van Bokhorst–de van der Schueren et al., 2012). In Portugal, the percentage of plate waste represented 56.4% of the food served (Gomes et al., 2020), and in Italy, 41.6% of the total food served was wasted (Schiavone et al., 2019). Additionally, in Malaysia, the waste represented 41.9% of the total amount served (Jamhuri et al., 2019), and in Iran, the mean waste represented 50.1% of the served food (Anari et al., 2023a).
4.1.2 Plate waste per meal timing
Our findings revealed that the highest mean daily waste was at lunch (0.14 kg per hospital bed per day), representing 37% of the total waste weight. Similar results were found in Iran, where plate waste at lunch was the highest and represented 37.7% of the waste weight (Simzari et al., 2017). Our findings also align with a study in Malaysia which found that the highest waste occurs during lunchtime (Razalli et al., 2021). Different results were obtained in other studies. For instance, plate waste is higher for dinner in a study done in Qatar by Al-Muhannadi et al. (2021) and in a study done in Saudi Arabia by Al-Muhannadi et al. (2021) and Alharbi et al. (2020). The variation in the results might be due to the time at which meals were served, the portion size of every meal, or the treatment given to patients.
4.1.3 Plate waste per hospital ward
Our findings showed that the most waste occurred in the OBGYN ward, followed by the gastrointestinal ward, then the surgical ward, and that the lowest waste occurred in the cardiovascular ward. A study done in Portugal in which the OBGYN was not part of the studied wards shows that the highest waste is from the gastrointestinal ward, followed by the surgical ward, rather than the cardiovascular ward, similar to our findings (Dias-Ferreira et al., 2015). On the contrary, a study done in Iran showed that the highest waste is in the cardiac ward compared to the other wards (Dehnavi et al., 2017).
4.1.4 Plate waste per food group
According to our findings, vegetables were the food group with the most waste, with 55% of the amount served wasted. A study done in Iran showed similar results where patients discard cooked vegetables and bread more than meat, fish, and poultry (Anari et al., 2023b). Similarly, vegetables are the most wasted group in West Asia (Jamhuri et al., 2019) and in Italy (Schiavone et al., 2019). In a study done in Spain, inpatients generally showed a low acceptance for vegetables while desserts are widely accepted, which aligns with our findings (Díaz and García, 2013). Different results from one study done in Malaysia show that protein-rich foods are the most discarded (Razalli et al., 2021).
4.2 Economic impact of plate waste
Our findings revealed that the mean cost of plate waste is USD 1.04 per hospital per day. This cost is higher than in a study done in Iran by Anari et al. (2023a), which found that, on average, plate waste costs USD 0.89. However, this same study revealed that the mean cost is higher in the surgical wards (USD 0.96) compared to the other wards (Anari et al., 2023a), similar to our results in which the surgical ward mean cost is the highest (USD 1.25). Another study done in Portugal showed a lower value for waste cost and found that the average cost of plate waste is USD 0.95 (reported as 0.88€ in the study) per patient per day (Gomes et al., 2020). In contrast, another study in Portugal showed a higher mean waste cost of USD 4.23 (3.9€) per hospital bed per day (Dias-Ferreira et al., 2015). In our study, the cost of 1 kg of plate waste at hospitals is estimated at USD 2.67. A report done in Irish hospitals reveals a slightly lower cost for every kilogram of waste (USD 2.17 or 2€ as reported in the report) (Green Healthcare, 2013).
Based on our findings, the waste cost was estimated to be USD 977,470 annually in the participating hospitals only, and this makes up a notable economic burden on the Lebanese healthcare system, which has already been facing financial difficulties ranging from shortages in medical equipment and staff to hospital closures (Sanayeh and Chamieh, 2023).
4.3 Environmental impact of plate waste
Even though hospitals generate a significant amount of plate waste daily, studies that have assessed the environmental impact of plate waste in hospital settings are scarce. Our results revealed that 582.25 liters of water are wasted per hospital bed daily. Anari et al. (2023a) found less water waste in Iran, where 541 liters of water are wasted per patient per day. Concerning CO2-eq emissions, our findings showed an average of 0.85 kg CO2-eq per hospital bed per day. Almost similar amounts were found in Iran (0.8 kg CO2-eq) (Anari et al., 2023a) while lower estimates are found in Portugal (0.4 kg CO2-eq) (Gomes et al., 2020). On the other hand, a study done in Portugal showed a higher value for CO2-eq emissions of 1.8 kg per hospital bed per day (Dias-Ferreira et al., 2015). Concerning the nitrogen content of plate waste, our study showed that 3.08 g of nitrogen is lost per hospital bed per day; however, no previous studies assessed the amount of nitrogen lost from plate waste in hospitals. The environmental impact of animal products was the highest for all the EFPs assessed in our study. Although the “meat, fish, and poultry” group was wasted in lower amounts compared to other groups (17% of the amount served), the EFPs of this group were particularly higher than most of the groups, with the highest nitrogen loss to the environment coming from this group, highlighting the importance of reducing plate waste coming from this group as it has high EFPs. This can be done by adjusting portion sizes in hospitals to eventually reduce the waste of all food groups, especially those that have high EFPs.
The findings of our study are alarming in a country facing many environmental challenges, such as water shortages, waste accumulation in landfills, forests destroyed by chainsaws with entire regions being threatened by desertification, and surging air pollution, as reported by UNDP in 2021 (UNDP, 2021). This estimated climate change in Lebanon is expected to negatively impact water resources and exacerbate water shortages, causing less water availability, increased drought periods, less agricultural productivity, higher energy demand, weakened tourism, sea level rise, and damaged infrastructure, putting forests at risk and increasing mortality and morbidity risks (UNDP, 2021). In addition, the UNDP identified waste and wastewater as candidate drivers, amongst others, for greenhouse gas (GHG) emissions and energy consumption in Lebanon (UNDP, 2021), and our findings revealed that the impact of hospital plate waste regarding this is noticeable, further exacerbating climate change. For instance, compared to environmental constraints that were set taking into account data from 152 countries, the amount of CO2 emitted only from the plate waste in our study exceeds 40% of the limit set (1,866 g CO2-eq/cap/day), the amount of fresh water use exceeds 70% of the limit set (786 L/cap/day), and the amount of nitrogen lost to the environment exceeds 10% of the limit set (27.4 g Nitrogen/cap/day) (Chaudhary and Krishna, 2019).
4.4 Policy implication
As revealed in our study, a significant amount of food is wasted at hospitals (31.4%), and this waste is higher than the average food waste (25.4%) in the Eastern Mediterranean Region (EMR), reported in a recent review (Hoteit et al., 2024a). Plus, this waste contributes significantly to the economic and environmental burdens in a country struggling financially and environmentally. Efficient strategies and interventions are thus needed in order to limit this waste and reduce its negative impacts. One of the most efficient ways to reduce plate waste is reducing portion sizes. For instance, a study done by Ofei et al. (2015) showed that a significant positive relation exists between the portion size served and the amount of plate waste, highlighting the importance of regulating the portion size served to patients. This can be done by adopting a trolley meal system at hospitals, as suggested by Ofei et al. (2015), which serves as an efficient approach to minimize plate waste by allowing patients to choose their portion sizes. Besides quantity, Hoteit et al. (2024b) showed that food quality was significantly negatively associated with plate waste in Lebanese hospitals. This highlights the importance of prioritizing the quality and presentation of food as a way to enhance the acceptability and appeal of meals and eventually decrease plate waste (Hoteit et al., 2024b). In addition, room service was shown to significantly decrease plate waste from 29 to 12% in Australia (McCray et al., 2018), therefore, this might serve as an efficient approach to decrease plate waste that could be implemented in Lebanese hospitals. Lastly, knowing which food group and items are the most discarded by patients can serve as an efficient approach in minimizing plate waste: in our study, serving less vegetables and replacing them with less wasted food groups such as fruits, can reduce the waste significantly while improving the overall intake and nutritional status of the patients.
Other than reducing plate waste, managing the waste generated has environmental implications depending on the waste management method used in hospitals, as suggested by Hassan et al. (2024). In Lebanese hospitals, the majority of food waste collected is mixed with other waste and primarily disposed of in landfills, which is the least desirable approach to food waste management as it exacerbates environmental issues (Hassan et al., 2024). For these reasons, more focus needs to be placed on this concerning subject in order to emphasize its significance and assist hospital food service managers in taking the appropriate actions to resolve this problem and enhance the situation of hospital food waste in Lebanon. Other approaches that can be implemented by Lebanese hospitals are reusing excess food for human consumption or diverting food waste to animal feed (Hassan et al., 2024).
Compared with other studies, the differences in results might be due to many factors, including methodological approaches. For instance, the different data collection tools and sampling techniques used among studies can lead to different results. Different hospital wards and types of diets included in the different studies might impact the comparison of results.
4.5 Strengths and limitations
The present study examined the amount of plate waste generated at Lebanese hospitals and reported its economic and environmental ramifications. To date, no studies have assessed the level of plate waste at hospitals and eventually reported its impacts on the country. All of the studies done in Lebanon regarding food are done at the household and restaurant levels, while those assessing plate waste at hospitals along the food supply chain are nonexistent despite their significant waste generation every day. This study is the first to quantify the nitrogen lost to the environment due to plate waste, thus adding to the literature a facet of waste that has not yet been explored in Lebanon or globally. Our findings can be used to inform researchers and policymakers about the importance of this topic so they can start taking progressive steps to improve the situation regarding hospital plate waste in Lebanon and the region and implement effective programs and policies to reduce and manage this category of waste.
Nonetheless, our study has some limitations worthy of consideration. This study has several limitations that should be noted. First, we employed two different methods for measuring plate waste: 17% (n = 26 patients) of the plate waste was assessed using visual estimation, and the rest (83%, n = 129) was assessed using weighing, which may introduce variability in our results. Second, there is a potential clustering effect at the hospital level that was not accounted for in our analysis. This may impact the generalizability of our findings and could lead to unaccounted variance. Finally, we recognize the need for a clearer rationale behind the analyses of total plate waste, aggregate plate waste, economic impact, and environmental impact concerning the different variables. Few studies have reported the economic and environmental impacts of plate waste in the literature, as most studies focused on quantifying food loss and waste in general, making it challenging to find studies to compare with our results. Moreover, some hospitals did not own calibrated scales to measure the plate waste, so we relied on visual estimation to calculate the plate waste, which is subject to inaccuracies. Additionally, for the hospitals that did not own a calibrated scale, the dished-up portion was assumed to be equivalent to the standard portion of each hospital, and this is also subject to inaccuracies. Furthermore, data concerning harvesting, production, and consumption of food items in the Lebanese population is lacking. So, we could only compare our environmental data at the wastage level with constraints done on 152 countries that include all the food supply chain processes (production, consumption…). Moreover, the absence of purchasing power parity (PPP) data for each country was a limiting factor that may impact the comprehensiveness of our analysis regarding plate food waste. Plus, some areas like Akkar and Baalbeck-Hermel were not represented adequately in this study.
5 Conclusion
In conclusion, our findings showed that 31.4% of the food served is wasted, with vegetables being the most discarded food group. Notably, the highest level of plate waste was observed during lunch, and the mean waste cost was 1.04 USD dollars per hospital bed per day. Furthermore, the EFPs of plate waste were 580.25 liters of fresh water waste, 0.85 kg CO2-eq emission, and 3.08 g nitrogen lost to the environment per hospital bed per day, with animal products contributing the most to the EFPs in the sample. As revealed in this study, hospitals contribute significantly to daily plate waste, imposing an economic burden on the healthcare system and exacerbating existing environmental challenges in the country. Together, the impacts threaten the food security of the population. The findings thus call for public health policies and interventions, as well as effective food service management strategies, to mitigate the adverse impacts of this waste on Lebanon’s scarce environmental resources and fragile economic infrastructure. This would require comprehensive interventions such as portion control, monitoring the most wasted food items in hospitals, purchasing quality ingredients, training of chefs to ensure quality meals, doing regular total waste and plate waste studies, and conducting client satisfaction surveys.
Data availability statement
The raw data supporting the conclusions of this article will be made available by the authors, without undue reservation.
Ethics statement
The studies involving humans were approved by Institutional Review Board (IRB) at the Lebanese American University (LAU) approved the study protocol; approval number: LAU.SAS.HHI.2023. The studies were conducted in accordance with the local legislation and institutional requirements. The participants provided their written informed consent to participate in this study.
Author contributions
MA: Conceptualization, Formal analysis, Investigation, Methodology, Validation, Writing – original draft, Writing – review & editing. MH: Conceptualization, Data curation, Formal analysis, Investigation, Methodology, Project administration, Supervision, Writing – original draft, Writing – review & editing. MK: Data curation, Formal analysis, Investigation, Writing – original draft, Writing – review & editing. FF: Data curation, Formal analysis, Investigation, Writing – original draft, Writing – review & editing. DM: Data curation, Formal analysis, Investigation, Writing – original draft, Writing – review & editing. EA: Data curation, Formal analysis, Investigation, Writing – original draft, Writing – review & editing. JE: Data curation, Formal analysis, Investigation, Writing – original draft, Writing – review & editing. NB: Data curation, Formal analysis, Investigation, Writing – original draft, Writing – review & editing. SK: Writing – review & editing, Methodology, Resources, Writing – original draft. HH: Conceptualization, Funding acquisition, Methodology, Project administration, Resources, Supervision, Validation, Writing – original draft, Writing – review & editing.
Funding
The author(s) declare that no financial support was received for the research, authorship, and/or publication of this article.
Acknowledgments
The authors would like to thank the following hospital dietitians for their support: Mariane El Chamy (Family Medical Center – Zgharta), Marwa Safa (Sahel General Hospital), Lama Mattar (Ain Wazein Medical Village), Naya Feghali (Saint George Hospital University Medical Center), Fatima Shaer (Raee Hospital).
Conflict of interest
The authors declare that the research was conducted in the absence of any commercial or financial relationships that could be construed as a potential conflict of interest.
Generative AI statement
The author(s) declare that no Generative AI was used in the creation of this manuscript.
Publisher’s note
All claims expressed in this article are solely those of the authors and do not necessarily represent those of their affiliated organizations, or those of the publisher, the editors and the reviewers. Any product that may be evaluated in this article, or claim that may be made by its manufacturer, is not guaranteed or endorsed by the publisher.
Supplementary material
The Supplementary material for this article can be found online at: https://www.frontiersin.org/articles/10.3389/fsufs.2025.1516331/full#supplementary-material
References
Alharbi, N., Yahia Qattan, M., and Haji, A. J. (2020). Towards sustainable food services in hospitals: expanding the concept of ‘plate waste’ to ‘tray waste. Sustain. For. 12:6872. doi: 10.3390/su12176872
Al-Muhannadi, A., Vishwas, S., Estoya, S., Hamatosa, J., and Daradkeh, G. (2021). Assessment and evaluation of food waste at Al-Khor hospital -Hamad Medical Corporation in the state of Qatar. Food Sci Q Manage. 109, 25–32. doi: 10.7176/fsqm/109-04
Al-Shoshan, A. A. (1992). Study of the regular diet of selected hospitals of the Ministry of Health in Saudi Arabia: edible plate waste and its monetary value. J. R. Soc. Health 112, 7–11. doi: 10.1177/146642409211200102
Anari, R., Amini, M., Nikooyeh, B., Ghodsi, D., and Neyestani, T. R. (2023b). Why patients discard their food? A qualitative study in Iranian hospitals. Bethesda, MD: U.S. National Library of Medicine.
Anari, R., Nikooyeh, B., Ghodsi, D., Amini, M., and Neyestani, T. R. (2023a). An in-depth analysis of hospital food waste in terms of magnitude, nutritional value, and environmental and financial perspectives: a cross-sectional study. Waste Manage. Res. J. Sust. Circ. Econ. 42, 167–177. doi: 10.1177/0734242x231176733
Barilla Center for Food and Nutrition Double Pyramid. (2024). Healthy food for people, sustainable food for the planet. United Nations system standing committee on nutrition. Available at: https://www.unscn.org/layout/modules/resources/files/Double_pyramide.pdf (accessed February 12, 2024).
Buzby, J., and Guthrie, J. (2002). Plate waste in school nutrition programs - USDA ERS. United States Department of Agriculture. Available at: https://www.ers.usda.gov/webdocs/publications/43131/31216_efan02009.pdf?v=41423 (accessed July 10, 2024).
Carino, S., Porter, J., Malekpour, S., and Collins, J. (2020). Environmental sustainability of hospital foodservices across the food supply chain: a systematic review. J. Acad. Nutr. Diet. 120, 825–873. doi: 10.1016/j.jand.2020.01.001
Chaudhary, A., and Krishna, V. (2019). Country-specific sustainable diets using optimization algorithm. Environ. Sci. Technol. 53, 7694–7703. doi: 10.1021/acs.est.8b06923
da Cruz, G. L., da Costa Louzada, M. L., Silva, J. T., Maria Fellegger Garzillo, J., Rauber, F., Schmidt Rivera, X., et al. (2024). The environmental impact of beef and ultra-processed food consumption in Brazil. Public Health Nutr. 27:e34. doi: 10.1017/s1368980023002975
Dehnavi, Z., Faghani, M., Khorasanchi, Z., Safari Bidokhti, M., Seifi, N., and Norouzy, A. (2017). Investigation of the volume of food waste in Qaem and imam Reza hospitals in Mashhad, Iran. J. Nutr. Fasting Health 5, 178–183. doi: 10.22038/jnfh.2018.32196.1114
Dias-Ferreira, C., Santos, T., and Oliveira, V. (2015). Hospital food waste and environmental and economic indicators – a Portuguese case study. Waste Manag. 46, 146–154. doi: 10.1016/j.wasman.2015.09.025
Díaz, A., and García, A. C. (2013). Evaluation of factors affecting plate waste of inpatients in different healthcare settings. Nutr. Hosp. 28, 419–427. doi: 10.3305/nh.2013.28.2.6262
Edwards, J., and Nash, A. (1997). Catering services. Measuring the wasteline. Health Service J. 107, 26–27.
Estimation of Serving Weights for Individual Commodities. (1997). Available at: https://www.ers.usda.gov/webdocs/publications/40920/44516_aer772ap2.pdf?v=0 (Accessed February 25, 2024).
Gomes, A., Saraiva, C., Esteves, A., and Gonçalves, C. (2020). Evaluation of hospital food waste—a case study in Portugal. Sustain. For. 12:6157. doi: 10.3390/su12156157
Green Healthcare. (2013). Green healthcare Programme. Available at: https://www.lenus.ie/bitstream/handle/10147/324073/ReducingFoodWasteinirsishHospitalsResultsguidanceandtipsfroma3yearprogramme.pdf?sequence=1 (accessed February 10, 2024).
Hassan, H. F., Khattar, M., Fattouh, F., Malli, D., Antar, E., El Cheikh Mohamad, J., et al. (2024). Food waste Management in Lebanese Hospital Food Services: findings from a first-of-its-kind cross-sectional study in the Arab region. J. Agric. Food Res. 16:101127. doi: 10.1016/j.jafr.2024.101127
Hoekstra, A., Chapagain, A., Aldaya, M., and Mekonnen, M. (2011). Fao.org. Food and agriculture Organization of the United Nations (FAO). Rome: FAO.
Hoteit, M., Antar, E., Malli, D., Fattouh, F., Khattar, M., Baderddine, N., et al. (2024a). A review on hospital food waste quantification, management and assessment strategies in the eastern Mediterranean region. J. Agric. Food Res. 15:100959. doi: 10.1016/j.jafr.2023.100959
Hoteit, M., Badreddine, N., El Cheikh Mohamad, J., Khattar, M., Fattouh, F., Malli, D., et al. (2024b). Quantifying hospital plate waste and identifying its correlates from patients’ perspectives in Lebanon. Sci. Rep. 14:29003. doi: 10.1038/s41598-024-80205-8
Jamhuri, N., Yi, H. C., Lai, B. S., Samwil, S., Abdullah, A., Kahairudin, Z., et al. (2019). Food wastage in hospital among Cancer inpatients and its relation with nutrition impact symptoms. Asian J. Dietetics. 2019, 69–74.
McCray, S., Maunder, K., Krikowa, R., and MacKenzie-Shalders, K. (2018). Room service improves nutritional intake and increases patient satisfaction while decreasing food waste and cost. J. Acad. Nutr. Diet. 118, 284–293. doi: 10.1016/j.jand.2017.05.014
Ministry of Economy and Trade. (2023). Basket (weekly): Ministry of Economy & trade, republic of Lebanon. Ministry of Economy & Trade, republic of Lebanon. Available at: https://www.economy.gov.lb/en/services/center-for-pricing-policies/mini---basket-weekly (accessed February 12, 2024).
National Lebanon Strategy and Action Plan Nutrition. (2021). Ministry of Public Health – Lebanon. Available at: https://mophweb.intouchmena.com/userfiles/files/Prevention/Nutrition/Lebanon%20National%20Nutrition%20Strategy_20220322%20F.pdf (accessed February 12, 2024).
Ofei, K. T., Holst, M., Rasmussen, H. H., and Mikkelsen, B. E. (2015). Effect of meal portion size choice on plate waste generation among patients with different nutritional status. An investigation using dietary intake monitoring system (DIMS). Appetite 91, 157–164. doi: 10.1016/j.appet.2015.04.043
Petersson, T., Secondi, L., Magnani, A., Antonelli, M., Dembska, K., Valentini, R., et al. (2021). A multilevel carbon and water footprint dataset of food commodities. Sci. Data. 8:127. doi: 10.1038/s41597-021-00909-8
Pourhoseingholi, M. A., Vahedi, M., and Rahimzadeh, M. (2013). Sample size calculation in medical studies. Washington, DC: U.S. National Library of Medicine.
Razalli, N. H., Cheah, C. F., Mohammad, N. M., and Abdul, M. Z. (2021). PLATE WASTE study among hospitalised patients receiving texture-modified diet. Nutr. Res. Pract. 15, 655–671. doi: 10.4162/nrp.2021.15.5.655
Sanayeh, E. B., and Chamieh, C. E. (2023). The fragile healthcare system in Lebanon: Sounding the alarm about its possible collapse - health economics review. Berlin: Springer.
Schiavone, S., Pelullo, C., and Attena, F. (2019). Patient evaluation of food waste in three hospitals in southern Italy. Int. J. Environ. Res. Public Health 16:4330. doi: 10.3390/ijerph16224330
Segrè, A. (2015). Food waste and food security - FAO. Food and agriculture Organization of the United Nations (FAO). Rome: FAO.
Service UAR (2023). NUOnet (nutrient use and outcome network) database. Washington, DC: Agricultural Research Service.
Simzari, K., Vahabzadeh, D., Saeidlou, S., Khoshbin, S., and Bektas, Y. (2017). Food intake, plate waste and its association with malnutrition in hospitalized patients. Nutr. Hosp. 34, 1376–1381. doi: 10.20960/nh.1102
UNDP (2021). Lebanon State of the Environment and Future Outlook: Turning the Crises Into Opportunities. Available at: https://www.undp.org/lebanon/publications/lebanon-state-environment-and-future-outlook-turning-crises-opportunities (accessed February 12, 2024).
UNEP. (2021). UNEP food waste index report 2021. Available at: https://www.unep.org/resources/report/unep-food-waste-index-report-2021 (accessed February 8, 2024).
UNSD (2022). The sustainable development goals extended report 2022 - UNSD. Available at: https://unstats.un.org/sdgs/report/2022/extended-report/Extended-Report_Goal-12.pdf (accessed February 8, 2024).
USDA (2021). FNDDS download databases. USDA ARS. Available at: https://www.ars.usda.gov/northeast-area/beltsville-md-bhnrc/beltsville-human-nutrition-research-center/food-surveys-research-group/docs/fndds-download-databases/ (Accessed February 25, 2024).
van Bokhorst–de van der Schueren, M. A., Roosemalen, M. M., Weijs, P. J., and Langius, J. A. (2012). High waste contributes to low food intake in hospitalized patients. Nutr. Clin. Pract. 27, 274–280. doi: 10.1177/0884533611433602
WFP (2020). Lebanon: M-VAM vulnerability and food security assessment July – August 2020 - Lebanon [Internet]. Available at: https://reliefweb.int/report/lebanon/lebanon-m-vam-vulnerability-and-food-security-assessment-july-august-2020 (Accessed February 12, 2024).
Keywords: plate waste, hospitals, patients, cost, environment, sustainable
Citation: Abiad MG, Hoteit M, Khattar M, Fattouh F, Malli D, Antar E, El Cheikh Mohammad J, Badereddine N, El Khatib S and Hassan HF (2025) Beyond the tray: analyzing hospital plate waste for economic and environmental sustainability. Front. Sustain. Food Syst. 9:1516331. doi: 10.3389/fsufs.2025.1516331
Edited by:
Shalander Kumar, International Crops Research Institute for the Semi-Arid Tropics (ICRISAT), IndiaReviewed by:
Nurul Huda Razalli, National University of Malaysia, MalaysiaJelena Lonska, Rezekne Higher Education Institution, Latvia
Ana Ilić, University of Zagreb, Croatia
Copyright © 2025 Abiad, Hoteit, Khattar, Fattouh, Malli, Antar, El Cheikh Mohammad, Badereddine, El Khatib and Hassan. This is an open-access article distributed under the terms of the Creative Commons Attribution License (CC BY). The use, distribution or reproduction in other forums is permitted, provided the original author(s) and the copyright owner(s) are credited and that the original publication in this journal is cited, in accordance with accepted academic practice. No use, distribution or reproduction is permitted which does not comply with these terms.
*Correspondence: Hussein F. Hassan, aHVzc2Vpbi5oYXNzYW5AbGF1LmVkdS5sYg==
†These authors have contributed equally to this work