 Xiaoling Qiu
 Xinmei Wang
 Zeni Wang
 Wei He
- 1Key Laboratory of the Evaluation and Monitoring of Southwest Land Resources (Ministry of Education), Sichuan Normal University, Chengdu, China
- 2The Faculty Geography Resource Sciences, Sichuan Normal University, Chengdu, China
Clarifying the relationship between the supply and demand of food ecosystem services and portraying the pattern of supply and demand flows are significant for regional ecological management and food security. The minimum cumulative resistance (MCR) model was used to simulate the trend of resource flows under conventional spillover effects and construct the regional food ecosystem service flow pattern. Then, based on the supply–demand matching dimension using the Bayesian belief network, the optimization areas were identified, and the corresponding optimization strategies were proposed. The results showed the following: (1) the spatial heterogeneity of regional food ecosystem services supply and demand was strong. The supply areas were widely distributed in the western and northern regions, while the demand areas were clustered in the eastern and southern coastal regions. (2) The flow pattern of regional food ecosystem services was mainly composed of 187 service flows centered around the Pudong New Area and other places, with flows ranging from 1,134 to 20,000 t. Shanghai, Hangzhou, and Nanjing were the main inflows, while Nantong and Xuancheng emerged as important outflows of food ecosystem services. Additionally, Zhejiang Province had the most frequent internal movements, while Jiangsu Province had the largest flow of food ecosystem services. (3) From the perspective of matching supply and demand, there were obvious spatial differences between important optimization areas and sub-optimization areas. The former was concentrated in the southern region, while the latter was continuously distributed in the western part of the study area. In the future, regional production potential should be further explored to enhance the supply capacity of food ecosystem services. The research methodology can effectively portray regional food ecosystem service flow patterns and identify priority areas for optimization, which can provide scientific guidance for ecosystem service management and food security.
1 Introduction
Ecosystem services (ESs) refer to all the benefits that humans obtain from ecosystems (Xu et al., 2021), including provisioning services (such as food and water), regulating services, cultural services, and supporting services (Polishchuk and Rauschmayer, 2012; Lele et al., 2013). With the rapid development of society, intense human activities have increased the risk of ecosystem imbalance. This has resulted in a decrease in the stability of ecosystem services and an increasingly obvious contradiction between supply and demand, which poses a certain threat to regional ecological development (Yurui et al., 2021; Guan et al., 2023). Therefore, the integrated perspective of ecological supply and social demand has become a hot topic in ecosystem services research (Yurui et al., 2021; Guan et al., 2023). It is worth noting that there are often spatial differences between ES supply and consumption areas, which result in the excess ecosystem services in one region flowing to neighboring regions with natural or anthropogenic behavioral interventions (Guan et al., 2020; Chen et al., 2022). Research on ecosystem service flows has emerged. Ecosystem service flows are important for the realization of ecosystem services (Goldenberg et al., 2017), and related explorations are conducive to promoting a dynamic balance between ecosystem service provisioning and the developmental needs of human societies, which is an important way to maintain the sustainable use of ecological resources (Dang and Li, 2023).
Ecosystem service flow (ESF) refers to the dynamic flow relationships of ESs between supply and demand due to the spatial mismatch of ecosystem service supplies and demands (Zhang et al., 2023). It provides an effective integration of ES supply and demand and an in-depth exploration of their relationships (Wu J. et al., 2023), portraying the specific process of ES production-transmission-use (Shen and Wang, 2021). ESF emphasizes the spatial and temporal correspondences between service-providing areas (SPA) and service-benefiting areas (SBA) (Xu et al., 2019), which is categorized into three types: in situ service flows, omnidirectional service flows and directed service flows (Wang and Zhou, 2019). At present, the exploration of ecosystem service flows is still at an early stage, and most closely related research has focused on conceptual discernment and the construction of theoretical frameworks (Zhang and Lu, 2020). However, some scholars have conducted case studies on this topic, resulting in four different types of ESF, namely, biophysical, trade, species, and information flows, and the research results are intended to support ecological resource management and ecological spatial planning (Kleemann et al., 2020). Notably, most ESF studies have focused on service types with strong natural attributes, such as water provisioning, while less attention has been given to ecosystem services with strong social attributes, especially food provisioning services.
Food provisioning services are one of the most fundamental and important components of ecosystem services (Sun et al., 2024). In recent years, scholars have increasingly recognized the importance of food ecosystem service flows for ecosystem wellbeing, social welfare, and social stability, and have conducted new research on food ecosystem service flows (Feurer et al., 2021; Liu et al., 2022). Unlike food trade research, which primarily focuses on the real flows and trading processes of food, research on food ESF emphasizes the depiction of the matching, flow, and balance of food ecosystem service functions within regions. It highlights a theoretically optimized flow process, aiming to maintain and enhance regional ecosystem sustainability and service supply capacity, and to provide references for ecological protection and resource management (Dang, 2020). Liu et al. (2022) pondered the impacts of different threshold distances on the flow of ecosystem services and investigated the spatial changes in the supply and demand of food resources after flows. Zhou and Liu (2024) focused on quantitative approaches and quantified food service flows with a socioecological network perspective, further focusing on the evolutionary process of ES supply and demand flows, which facilitates ecosystem benefit transfer. However, the focus of most current research is on the spatial connection of service supply and demand, with less attention given to the characterization and optimization of food ecosystem service supply and demand flow patterns (Dang, 2020). Specifically, researchers often limit their analysis of supply and demand flow relationships to the spatial locations of supply and demand areas, neglecting the impact of transportation conditions and not adequately presenting the specific flow paths of food ecosystem services. Secondly, there is less attention paid to the research on the effective integration of ecosystem service flows with spatial pattern optimization, with relatively little discussion on the identification of optimization areas, which is not conducive to subsequent ecological intervention construction in the region. Therefore, constructing a brand-new research framework on the pattern of food ecosystem service supply and demand flows to scientifically tap the potential of regional food ecosystem service provisioning is a pressing issue in current regional food security and ecosystem research and management.
Linear programming (Shi et al., 2020; Chen et al., 2024a), the Two-Step Floating Catchment Area method (Liu et al., 2022), and the breakpoint model (Du, 2023; Ji, 2024) are among the primary methodologies utilized to simulate the flow of food ecosystem services. These approaches all adhere to Tobler’s First Law of Geography, which posits that nearby areas have more frequent ecological exchanges with deficit sites and are more likely to ecologically compensate them. Meanwhile, as far as spatial optimization is concerned, the Cellular Automata (Cao et al., 2024) and PLUS model (Yang et al., 2025) are the main methods in the current research, and these models can better simulate land use changes and optimize regional spatial patterns (Shi et al., 2020). However, these methods fail to account for factors such as transportation conditions and the matching relationship between the supply and demand of ecosystem services. Consequently, this limits the ability to accurately depict and optimize the patterns of food ecosystem service supply and demand flows, which in turn impedes the achievement of more efficient ecological protection.
The Minimum Cumulative Resistance (MCR) model plays a significant role in ecology and landscape planning research and has been widely utilized in various fields, including land use change (Jiang et al., 2022), biodiversity conservation (Qiu et al., 2024), and urban planning (Li et al., 2021). This model evaluates the accessibility of energy passage by considering the multiple resistances encountered as energy moves across space (Wu Y. et al., 2023). Incorporating the MCR model can effectively integrate the impacts of various factors, such as transportation, on the flow of food ecosystem services. It simulates the potential for flow from a cumulative resistance perspective, thereby enhancing the accuracy of flow simulation. Moreover, the Bayesian belief network (BBN) is an inference model that visualizes the probability of things being connected with powerful logical analysis (Zeng and Li, 2019). Network models are constructed by acting on the joint probabilities of interactions among variables and have been widely used in recent years in risk assessments (Zhang et al., 2020), ecological security risk early warnings (Du et al., 2023), and spatial optimizations of ecosystem services (Huang et al., 2024) to provide theoretical support for ecosystem service improvements. Using the Bayesian network can comprehensively consider the ecological benefits and social development needs and accomplish the win–win development of ecological benefits and socioeconomic benefits (Wu J. et al., 2023). Therefore, in this study, the MCR model and Bayesian belief networks were utilized to portray the pattern of ecosystem service supply and demand flows and to identify ecological optimization zones. These efforts were aimed at elucidating the potentially optimal food ecosystem service flow processes and identifying areas within the region that require optimization, thereby providing a reference and foundation for regional ecological protection and restoration initiatives.
The Yangtze River Delta (YRD) is one of the most economically developed and densely populated regions in China (Wang C. et al., 2021), with its economy contributing approximately 24% to China’s GDP and a population density of 4.5 times the national average (Shen et al., 2023). Despite the central position and great influence of the YRD region in China’s socio-economic development, there is a significant imbalance in the distribution of resources within it. The northern part of the region, a key agricultural hub, boasts extensive arable land but has a relatively low population density. In contrast, the affluent eastern coastal cities are densely populated but grappling with limited arable land resources. This spatial mismatch between food production and consumption has resulted in a pronounced imbalance in the supply and demand of food resources. Consequently, there is an increasing and recurring exchange of food ecosystem services within the YRD, with these services being transported from areas of surplus to those of deficit to satisfy escalating consumption demands. Therefore, in this study, the food ecosystem service supply and demand flow pattern was constructed in the YRD, through the production, delivery, and consumption of food supply services. Additionally, the Bayesian network was used to identify supply–demand optimization areas, providing a basis for the sustainable development of the natural environment and social system from a supply–demand matching perspective. The main objectives of this study are as follows: (1) evaluate food supply and demand at different scales and analyze the contradictions in food ecosystem service within the region; (2) explore the relationships between urban food flows in the region, and portray the potentially optimal pattern of food service flows; and (3) determine the optimization areas based on Bayesian networks and flow patterns. The results of this study are intended to provide more scientific references and ideas for food security and ecological planning in the YRD.
2 Materials and methods
2.1 Study area
The Yangtze River Delta (YRD) is located in the eastern coastal region of China (114°50′–122°30′E, 27°10′–35°10′N) and encompasses all of Jiangsu, Zhejiang, Anhui Provinces, and Shanghai Municipality, totaling 41 cities (Figure 1). The topography of the study area slopes from southwest to northeast and is dominated by plains. The total land area is 358,000 km2 and cultivated land accounts for 46% of the total area, which is mainly located in northern Anhui and Jiangsu provinces, which are among the main grain-producing areas in China. The YRD contains the largest urban agglomeration in China and is one of the most active, open, and innovative regions in China (Zhong et al., 2024), with a total GDP of CNY 24.5 trillion in 2020. The favorable geographical location has a strong absorption capacity for the population, with a total population of 235 million in 2020, which means that the region has already become a large food-consuming area, and the large population causes the regional ecological pressure to be too large. The imbalance between regional development and population distribution has led to a large difference between regional food supply and demand, and the contradiction is more prominent, which seriously restricts the stable development of the region and affects regional food security.
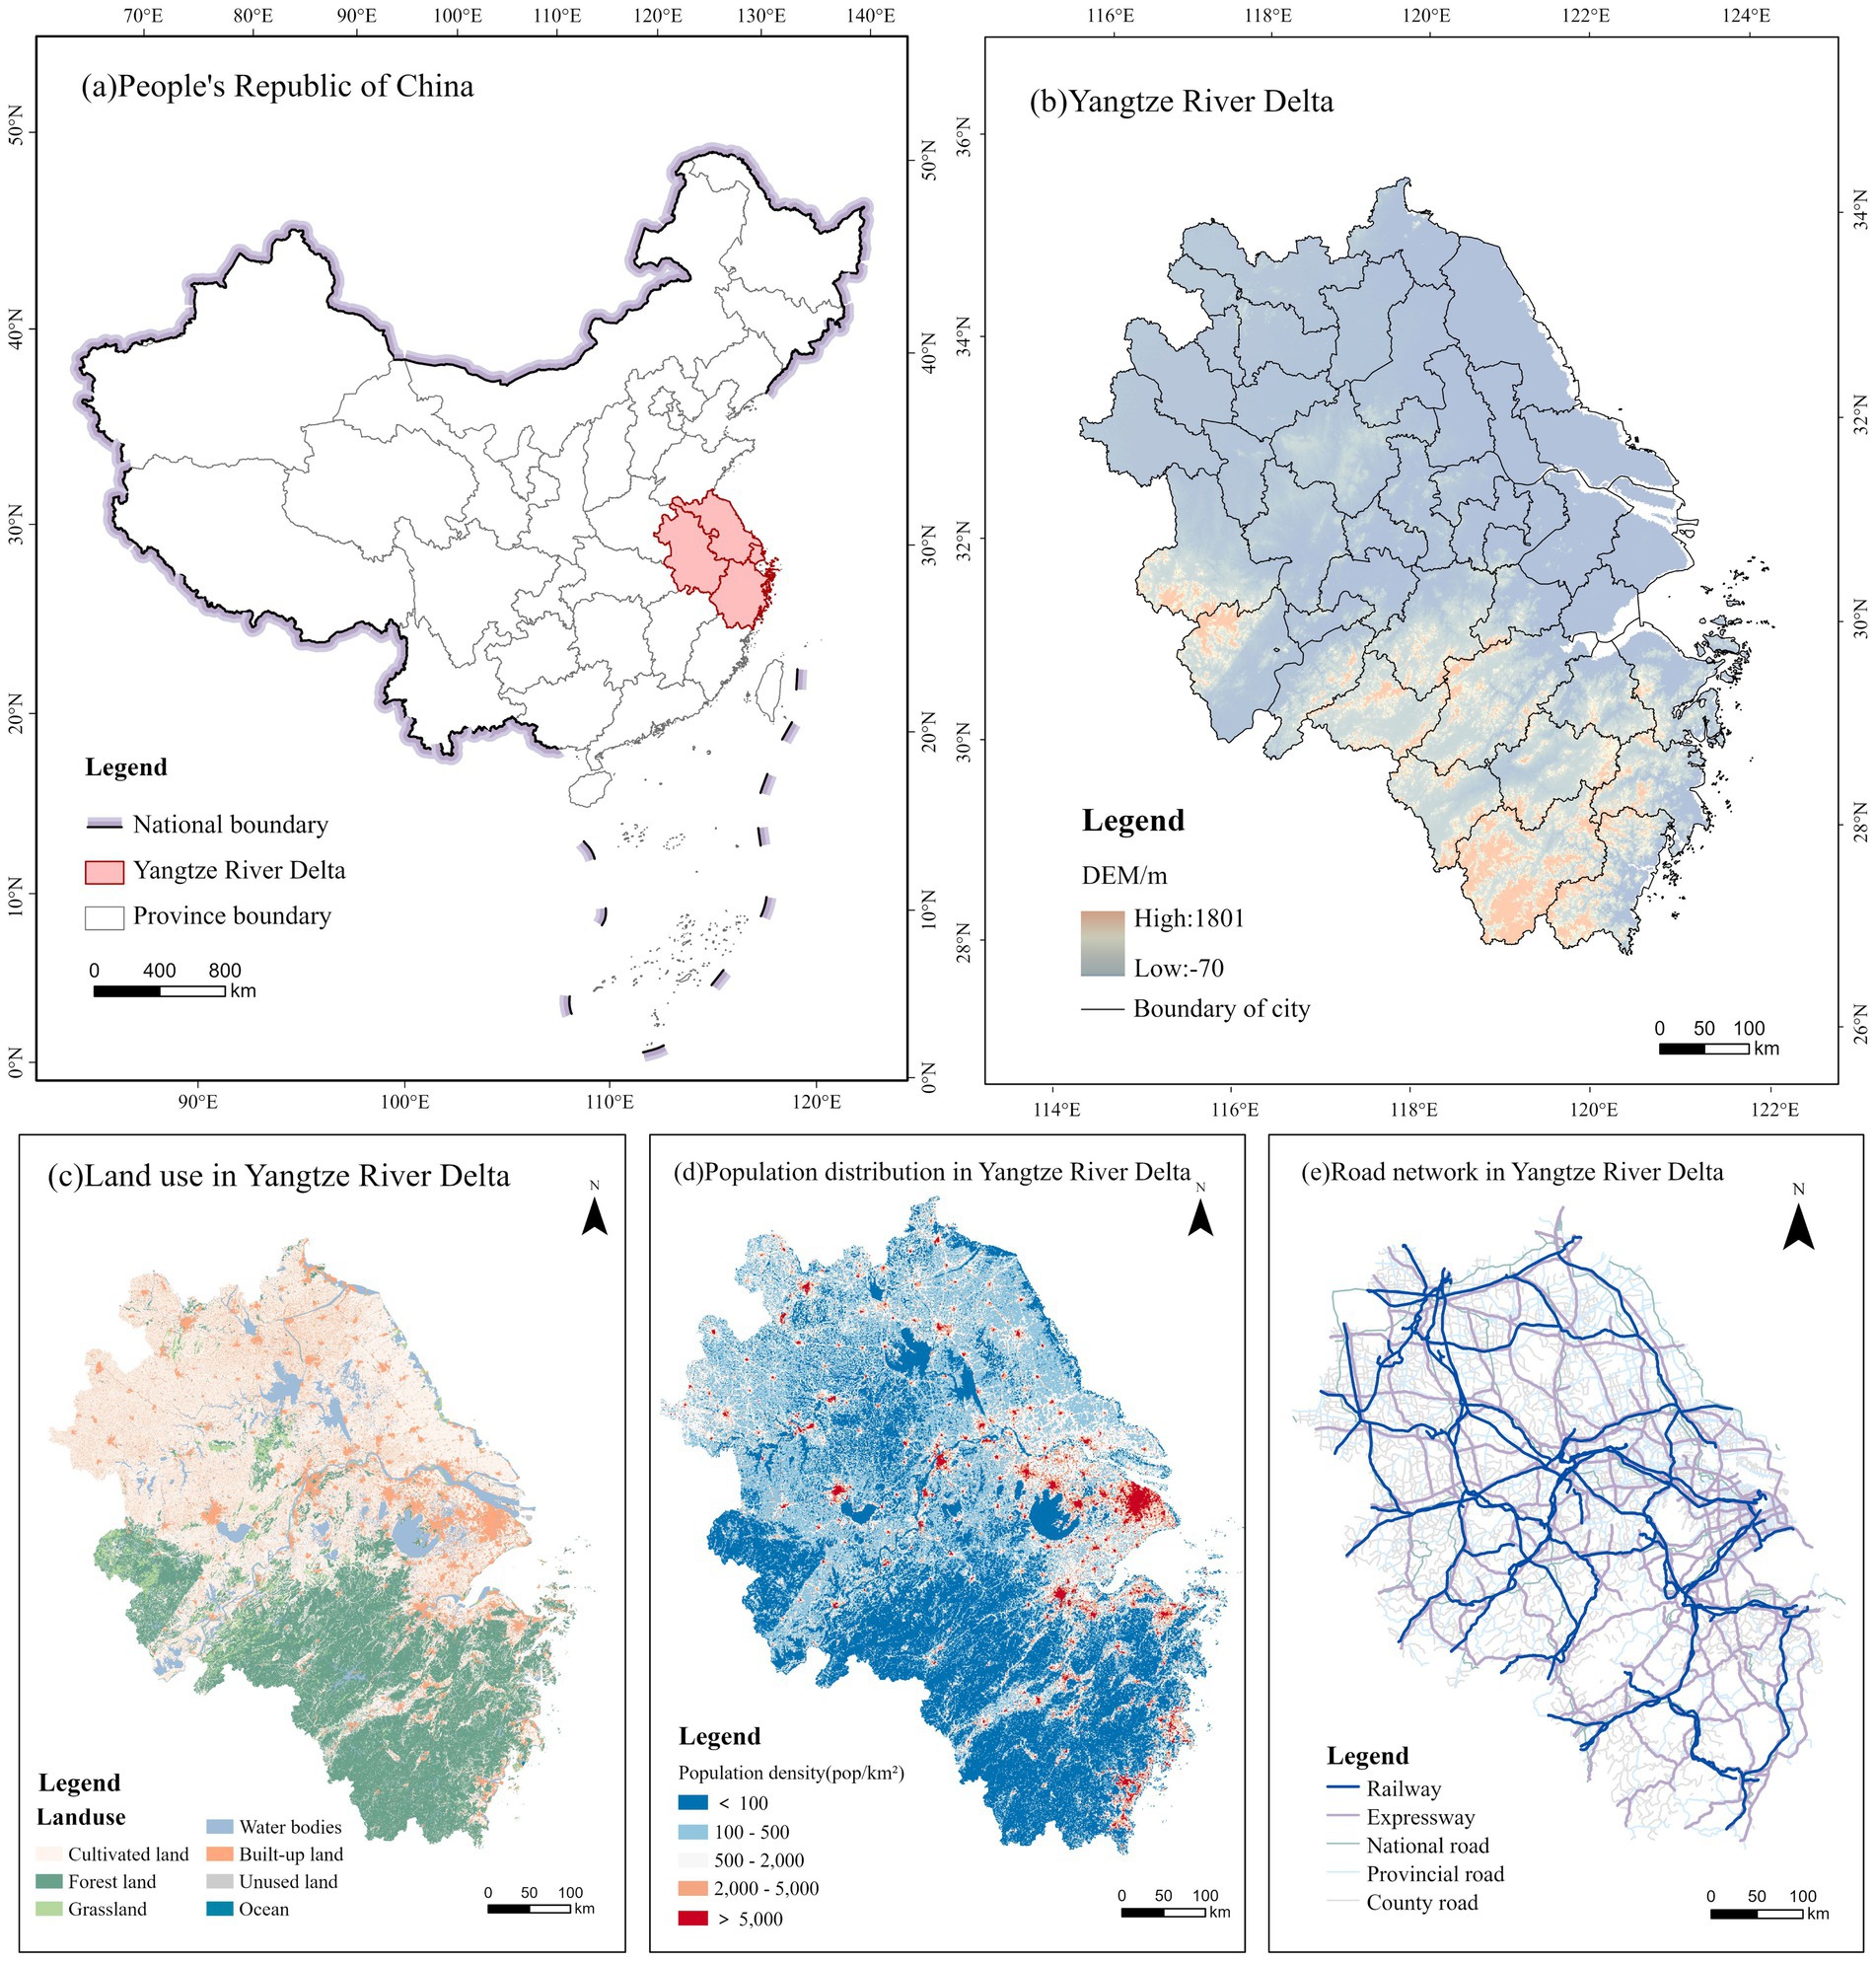
Figure 1. Study area. (A) The study area is located in the PRC. (B) Elevation map of the YRD. (C) Land use map of the YRD. (D) Map of the population distribution in the YRD. (E) Map of the road network in the YRD.
2.2 Materials and data processing
The data used in this study included land use data, nighttime light (NTL) data, normalized vegetation index (NDVI) data, grain yield data, road network data, and population distribution data (Table 1). Considering data availability and the size of the study area, all spatial datasets were resampled to a resolution of 1,000 m and unified into the Krasovsky_1940_Albers projection coordinate system. We revised the population distribution data of each province according to the 7th census data and combined the cultivated land NDVI data with the grain output of each province to spatialize the grain data.
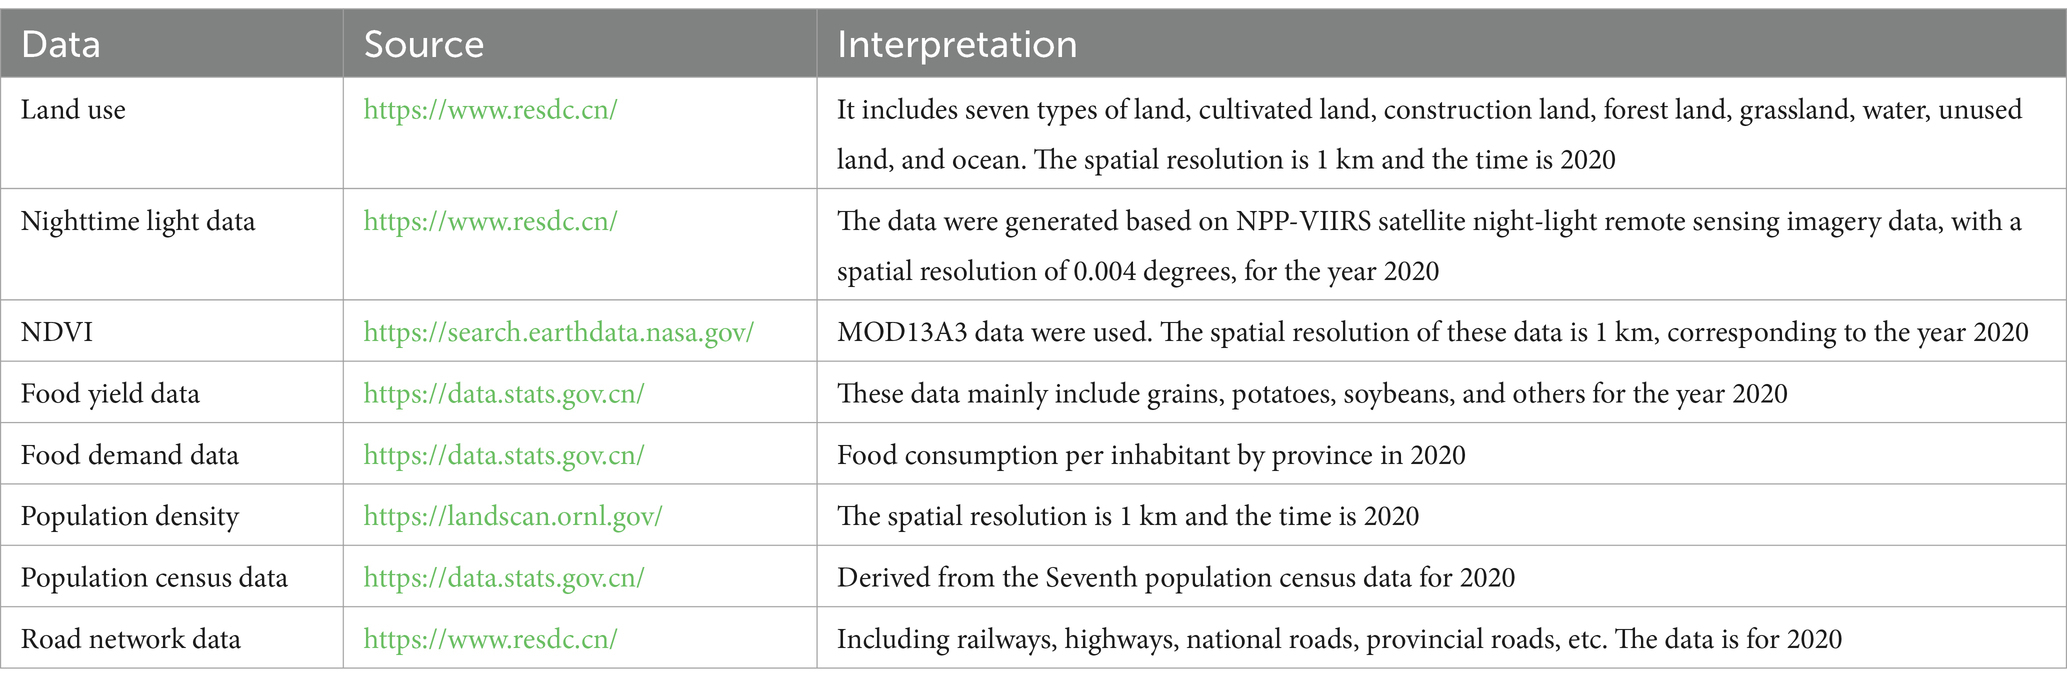
Table 1. Data materials and sources.
2.3 Analytical framework
Based on the ecosystem service flow perspective, a research framework for depicting the potentially optimal food ecosystem service flow patterns within the region was proposed in this paper (Figure 2). First, the supply and demand of regional food services were analyzed. Second, the minimum cumulative resistance (MCR) model was used to analyze the food flow trends and portray the potentially optimal food service flow patterns. Finally, the Bayesian network and service flow trends were used to determine the optimization areas and corresponding optimization strategies were proposed. Compared with existing studies, this framework can effectively identify the spatial mismatch between the supply and demand of food ecosystem services, scientifically reveal the direction and intensity of the potentially optimal food ecosystem service flows, and show the balancing process of regional food ecosystem services (Zhou and Liu, 2024).
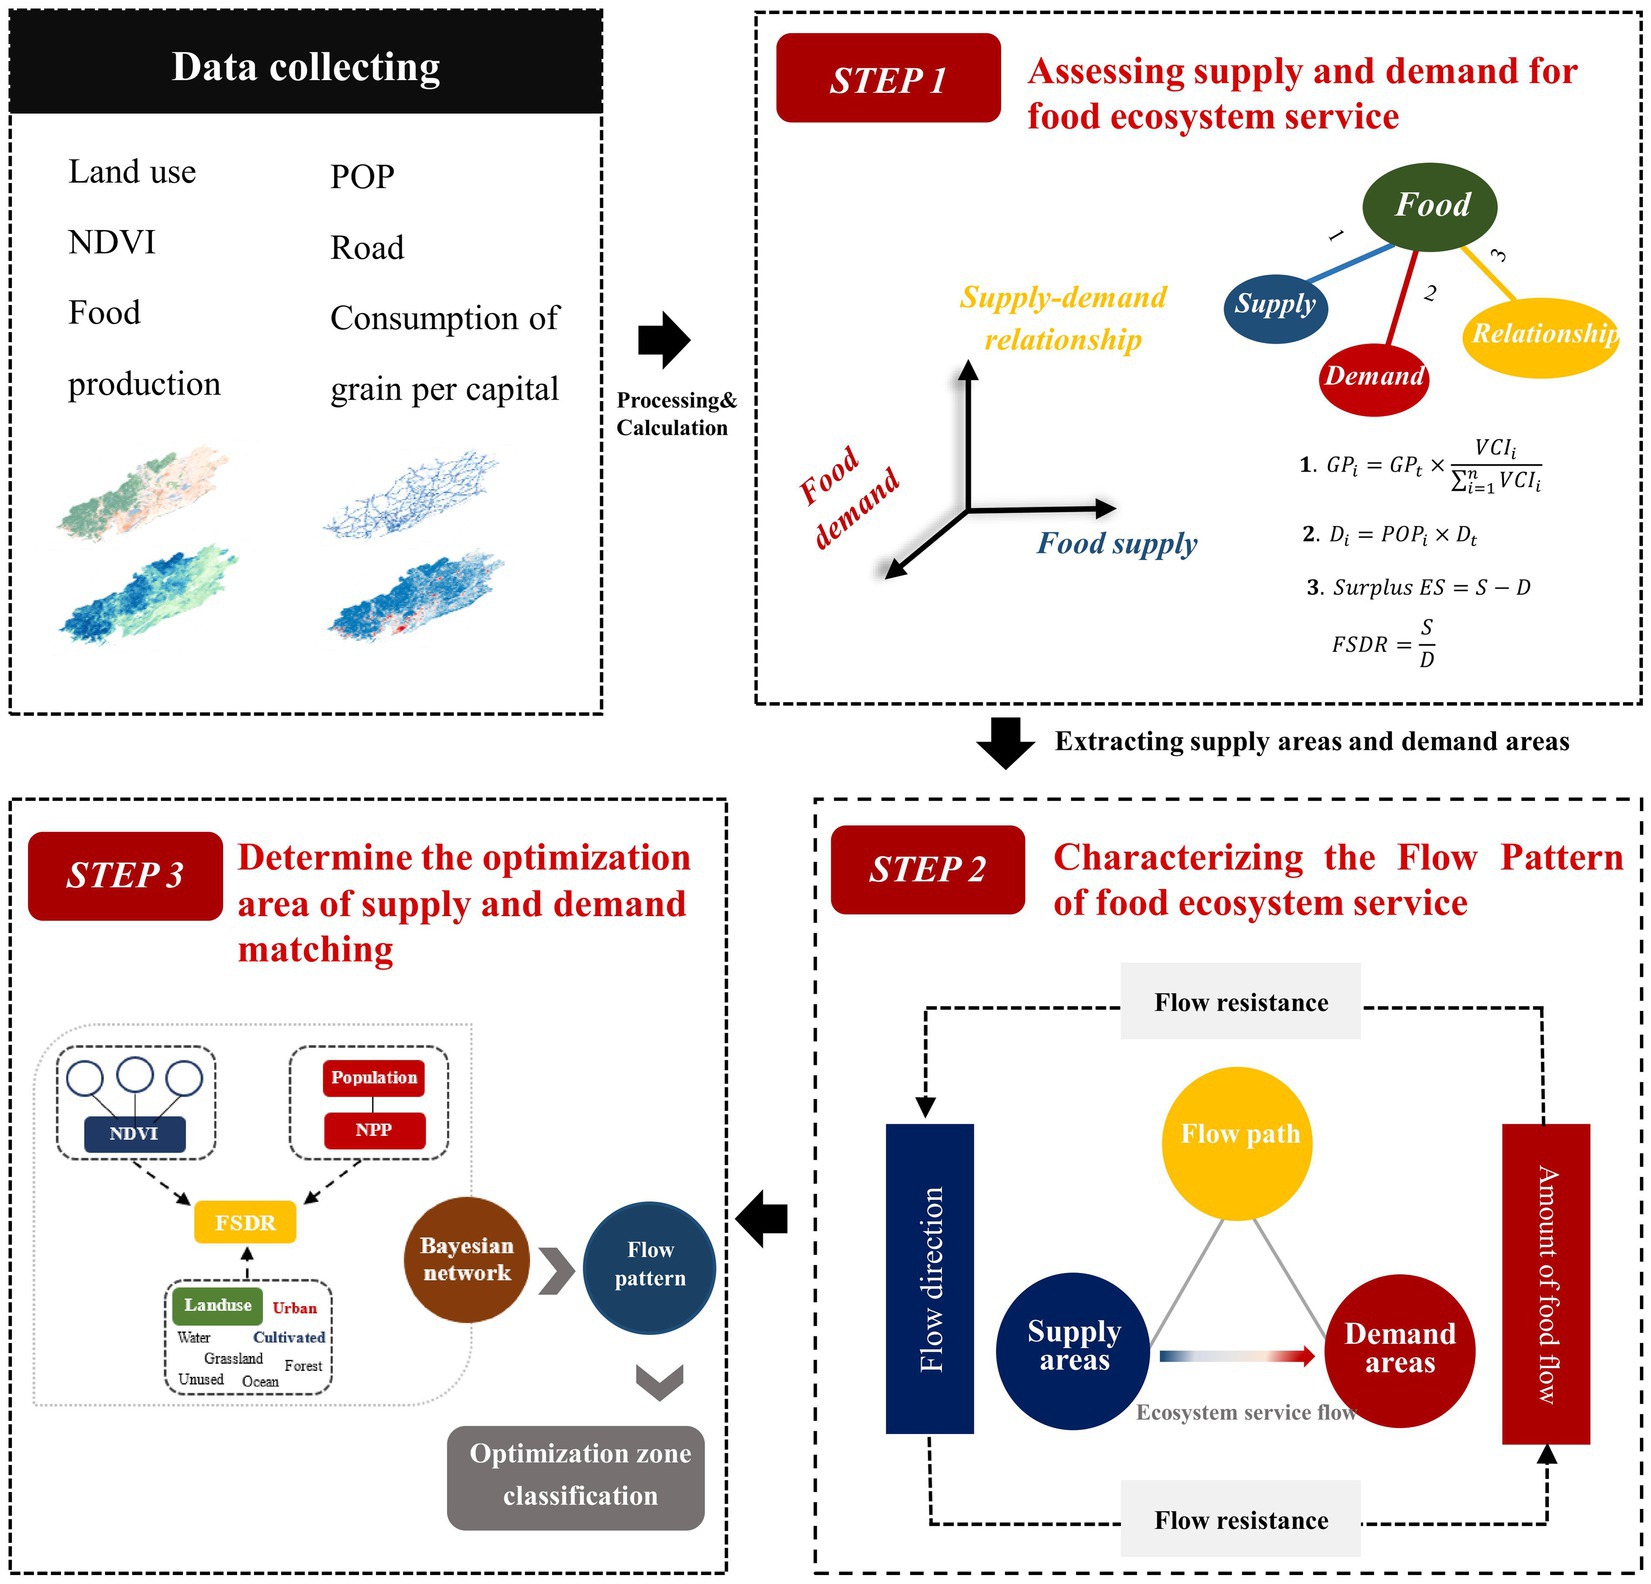
Figure 2. Research framework.
2.3.1 Analysis of the supply and demand for food services
2.3.1.1 Food supply assessment
Food provisioning services are the most basic provisioning services among ESs and are directly related to food security and social stability (Vargas et al., 2019; Fei et al., 2023). In this paper, we consider the differences in food production between croplands and incorporate NDVI data for arable land into the process of spatializing food production (Li et al., 2021; Zhang et al., 2022; Chen et al., 2024b). First, the cropland vegetation condition index (VCI) was calculated from the NDVI data. Second, the total regional food production was spatialized based on the ratio of the cropland VCI to the total cropland VCI in each grid to determine the food supply capacity of each grid in the study area (Liu et al., 2022; Ji, 2024). The formula is shown in Equations 1, 2:
Where is the food yield of cropland raster i in the study area, is the total food yield (t) in the study area. denotes the annual NDVI value of cropland raster i, and and represent the maximum and minimum values of the annual NDVI for the cropland rasters in the study area, respectively.
2.3.1.2 Food demand assessment
In this paper, we use regional per capita food consumption and population distribution data to characterize the distribution of food demand in the YRD (see Equation 3). In addition, in this study, we define food demand as ration consumption only, which mainly includes cereals, potatoes, and beans (Zhou and Liu, 2024). According to the regional statistical yearbook, the annual per capita food consumption in Jiangsu Province, Zhejiang Province, Anhui Province, and Shanghai Municipality in 2020 was 122.1 kg, 137.3 kg, 148.3 kg, and 111.4 kg, respectively.
Where is the food demand of grid , is the population size of grid corrected based on the data of the seventh population census, and is the per capita food consumption of each province in that year, which is derived from the volume of food trade.
2.3.2 Analysis method of ecosystem service flow
Ecosystem service flows are usually composed of elements such as supply areas, demand areas, flow directions, flow paths, and flow sizes (Xiao et al., 2017). To portray the potentially optimal pattern of food ecosystem service flows within the region, our analysis was conducted based on the theoretical modes of food ecosystem service flows. Therefore, in this study, the primary modes of food transportation—railways and highways—were used as the main pathways for food ecosystem service flows (Liu et al., 2022), meaning that these flows converge from the supply region along the road to the demand region. Referring to related studies, areas with surplus food after meeting local food demand were defined as food service supply areas in this paper, which can provide food services to other areas (Liu et al., 2022; Zhou and Liu, 2024). Considering the specificity of food transport, we unified the scale to the district and county scales, meaning that districts and counties with food surpluses are considered service supply areas. Districts with food supply–demand ratios (FSDR) less than 1 were food system service deficit districts, and their demands need to be met by food ecosystem service flows, which were defined as demand places in the food flow pattern (Liu et al., 2022; Zhou and Liu, 2024).
The first law of geography describes the connection and spatial proximity between geographical features. Therefore, we believe that the ESs in a certain area tend to be more closely connected with those in surrounding areas (Shi et al., 2020). Therefore, we invoked the concept of the least cumulative resistance to portray the flow trends of food service flows and selected the spatial distances among the supply and demand areas, traffic conditions, and food demand along the counties to construct resistance surfaces (Table 2); the larger the resistance value is, the greater the cost of food resource flows (Chen et al., 2023). The resistance values are used to determine the correspondences between the supply locations and the demand locations, depicting the directions and flows of food flow. The supply area with the lowest resistance near the demand area was used as the first replenishment location, and if there was still a gap, compensation was sought from the supply location with the next smallest resistance value until the local food demand was met. In this study, we adopted a two-way selection mechanism between the demand and supply areas and adopted the “locally optimal” strategy. The selection of food replenishment sites needs to consider the minimum resistance values of both the demand and supply areas to comprehensively portray the food resource flows from different perspectives.
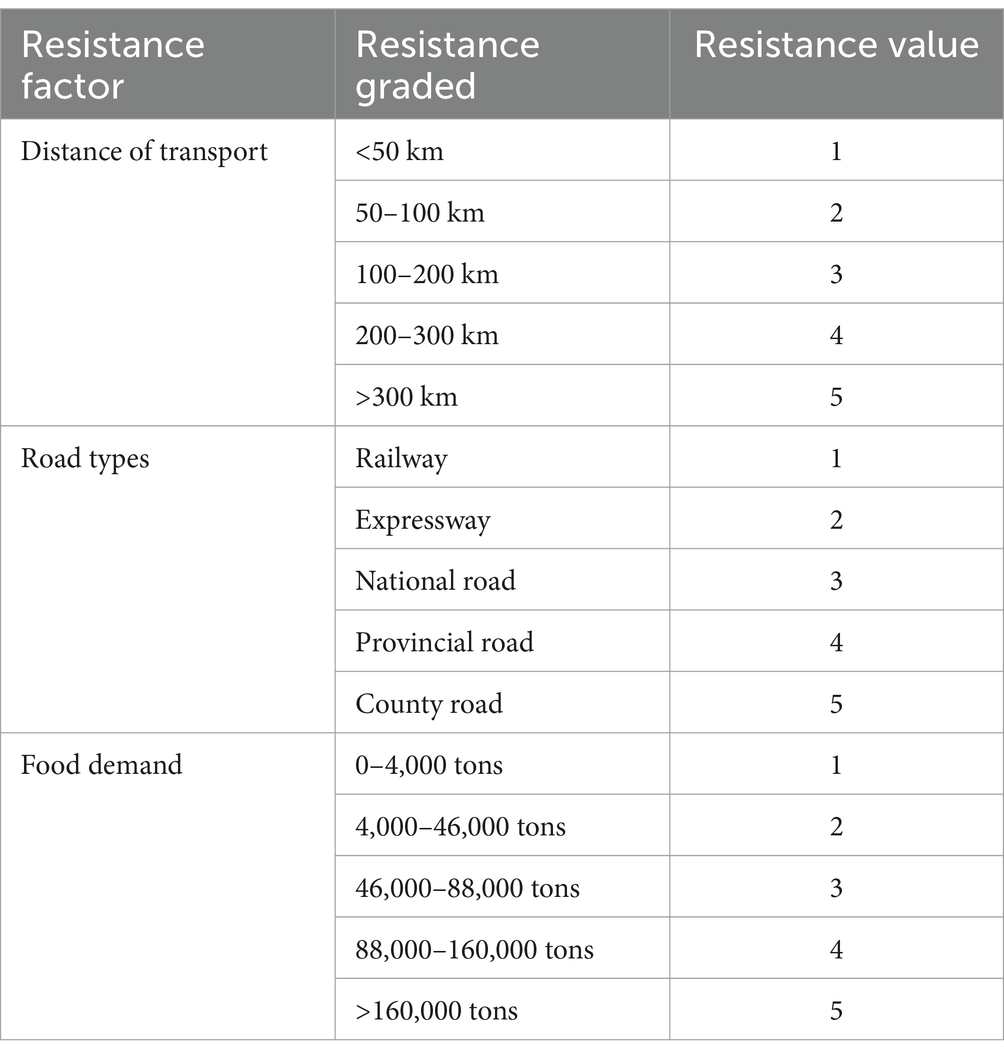
Table 2. Resistance layer weight and factor resistance value.
2.3.3 Selecting optimization areas using a Bayesian network
Introducing Bayesian networks into the process of optimizing the supply and demand of ESs can provide theoretical support for subsequent ecological management (Wu J. et al., 2023). A Bayesian network is commonly used to analyze the degree of interaction between the target variable and the influencing factors and the complexity of the correlations between influencing factors. The model consists of nodes with directed edges that connect the nodes; that is, the drivers and factor interrelationships are important components of the Bayesian network. The strength of the relationship between a parent node and a child node is reflected in the conditional probability values (Zhou and Kong, 2024), and the joint probability is obtained by multiplying the conditional probabilities of the nodes together. It proves the powerful functionality of Bayesian networks in probabilistic analysis (Tang et al., 2019). And its expression is shown in Equation 4:
Considering the comprehensive interrelationships between social demand and ecological supply, the land use type, population distribution, nighttime light data, vegetation normalization index, precipitation, elevation, and slope were screened as the influencing factors on the balance between the supply and demand, after which a Bayesian network was constructed (Dang et al., 2019). According to the raster data discretization method, the above variables were classified into high, medium, and low levels, corresponding to three states, namely, I, II, and III, respectively (Table 3). In addition, the conditional probabilities of the other nodes of the network are obtained by calculations using the conditional probability formula, and the model is represented as Equation 5:
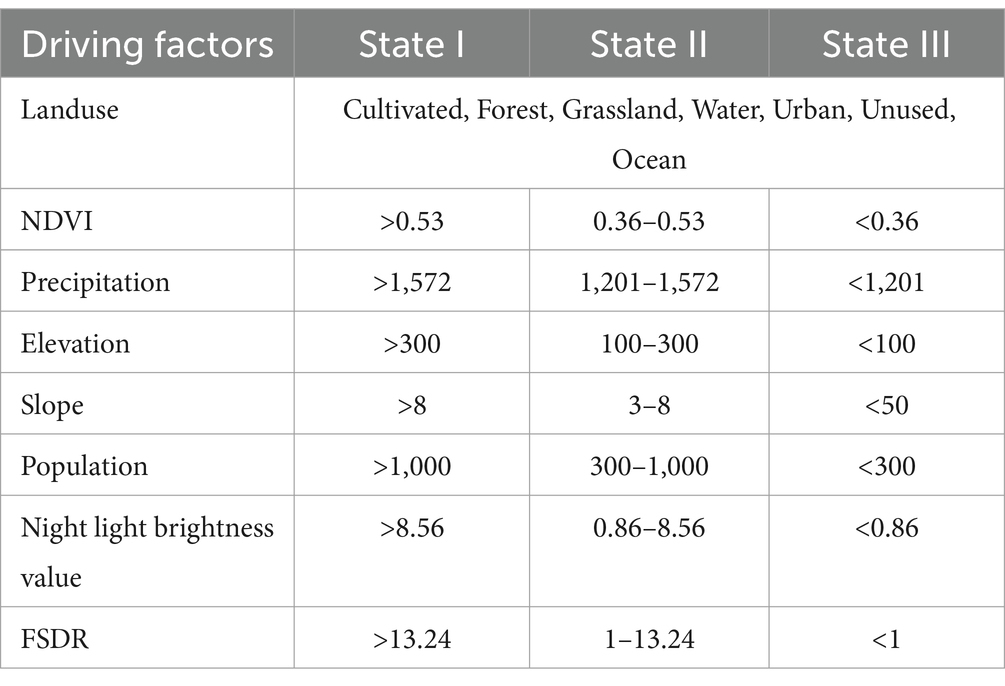
Table 3. State classification of factors.
Visualizing the spatial distribution of subsets and screening the intersection areas with the key states of the key variables that are in an optimal service supply–demand balance as the optimization area. First, the variable key states were identified. We calculated the conditional probability between each influencing factor and the supply–demand relationship of food ecosystem services using a Bayesian network and the state with the most pronounced probability for each influencing factor was defined as the key state of the variable when the FSDR was in the optimal matching state. Next, the key variables were determined. There were differences in the degree of influence of each influence factor in the Bayesian network on the target node, and we used the node sensitivity to assess the relative importance of the network nodes, namely, the degree of sensitivity of the FSDR to perceiving the changes in the other factor nodes. Finally, the optimization area was circled.
We defined the region where the key state subsets of key variables occur simultaneously in the optimal matching state of supply and demand (FSDR = High) as the optimal state distribution region (OSDA), that is, the high-level region of supply–demand matching for the ideal situation. After that, the results were compared with the current status, and the area in the OSDA where the actual supply and demand matching is not optimal (FSDR = medium/low) was defined as the suitable optimization area, which means that the area had key configurations that reached a high level of supply–demand matching, but the actual were not optimally matched. In addition, the urgency of optimization was further considered based on the feasibility of ecological optimization. The suitable optimization areas in the counties participating in this service flow were defined as important optimization areas, and the suitable optimization areas in counties that were not involved in this flow were defined as sub-important optimization areas.
3 Results
3.1 Spatial distribution of food supply and demand
In 2020, the food supply in the YRD was 84,454,200 tons, and the food demand was 31,033,800 tons. There was an obvious spatial imbalance between food production and consumption, with stronger spatial heterogeneity (Figure 3). The food supply in the YRD showed an apparent pattern of being high in the north low in the south, and higher in the west than in the east (Figures 3A1,A2). Heifei, Chuzhou, Lu′an, and Yancheng, primarily situated in plain and hilly regions, had strong food supply capabilities. Specifically, the combined food production of these four cities reached 18.1463 million tons, accounting for 21.48% of the total food supply in the YRD. Moreover, high food demand values were distributed in a sporadic pattern, primarily in coastal areas with high population densities (Figures 3B1,B2). In 2020, Shanghai, Wenzhou, Hangzhou, and Suzhou were notable for their significant food demand, with respective demands of 2.7793, 1.4839, 1.4173, and 1.3913 million tons. And the combined food demand of these four cities constituted 22.79% of the total food demand in the YRD for that year.
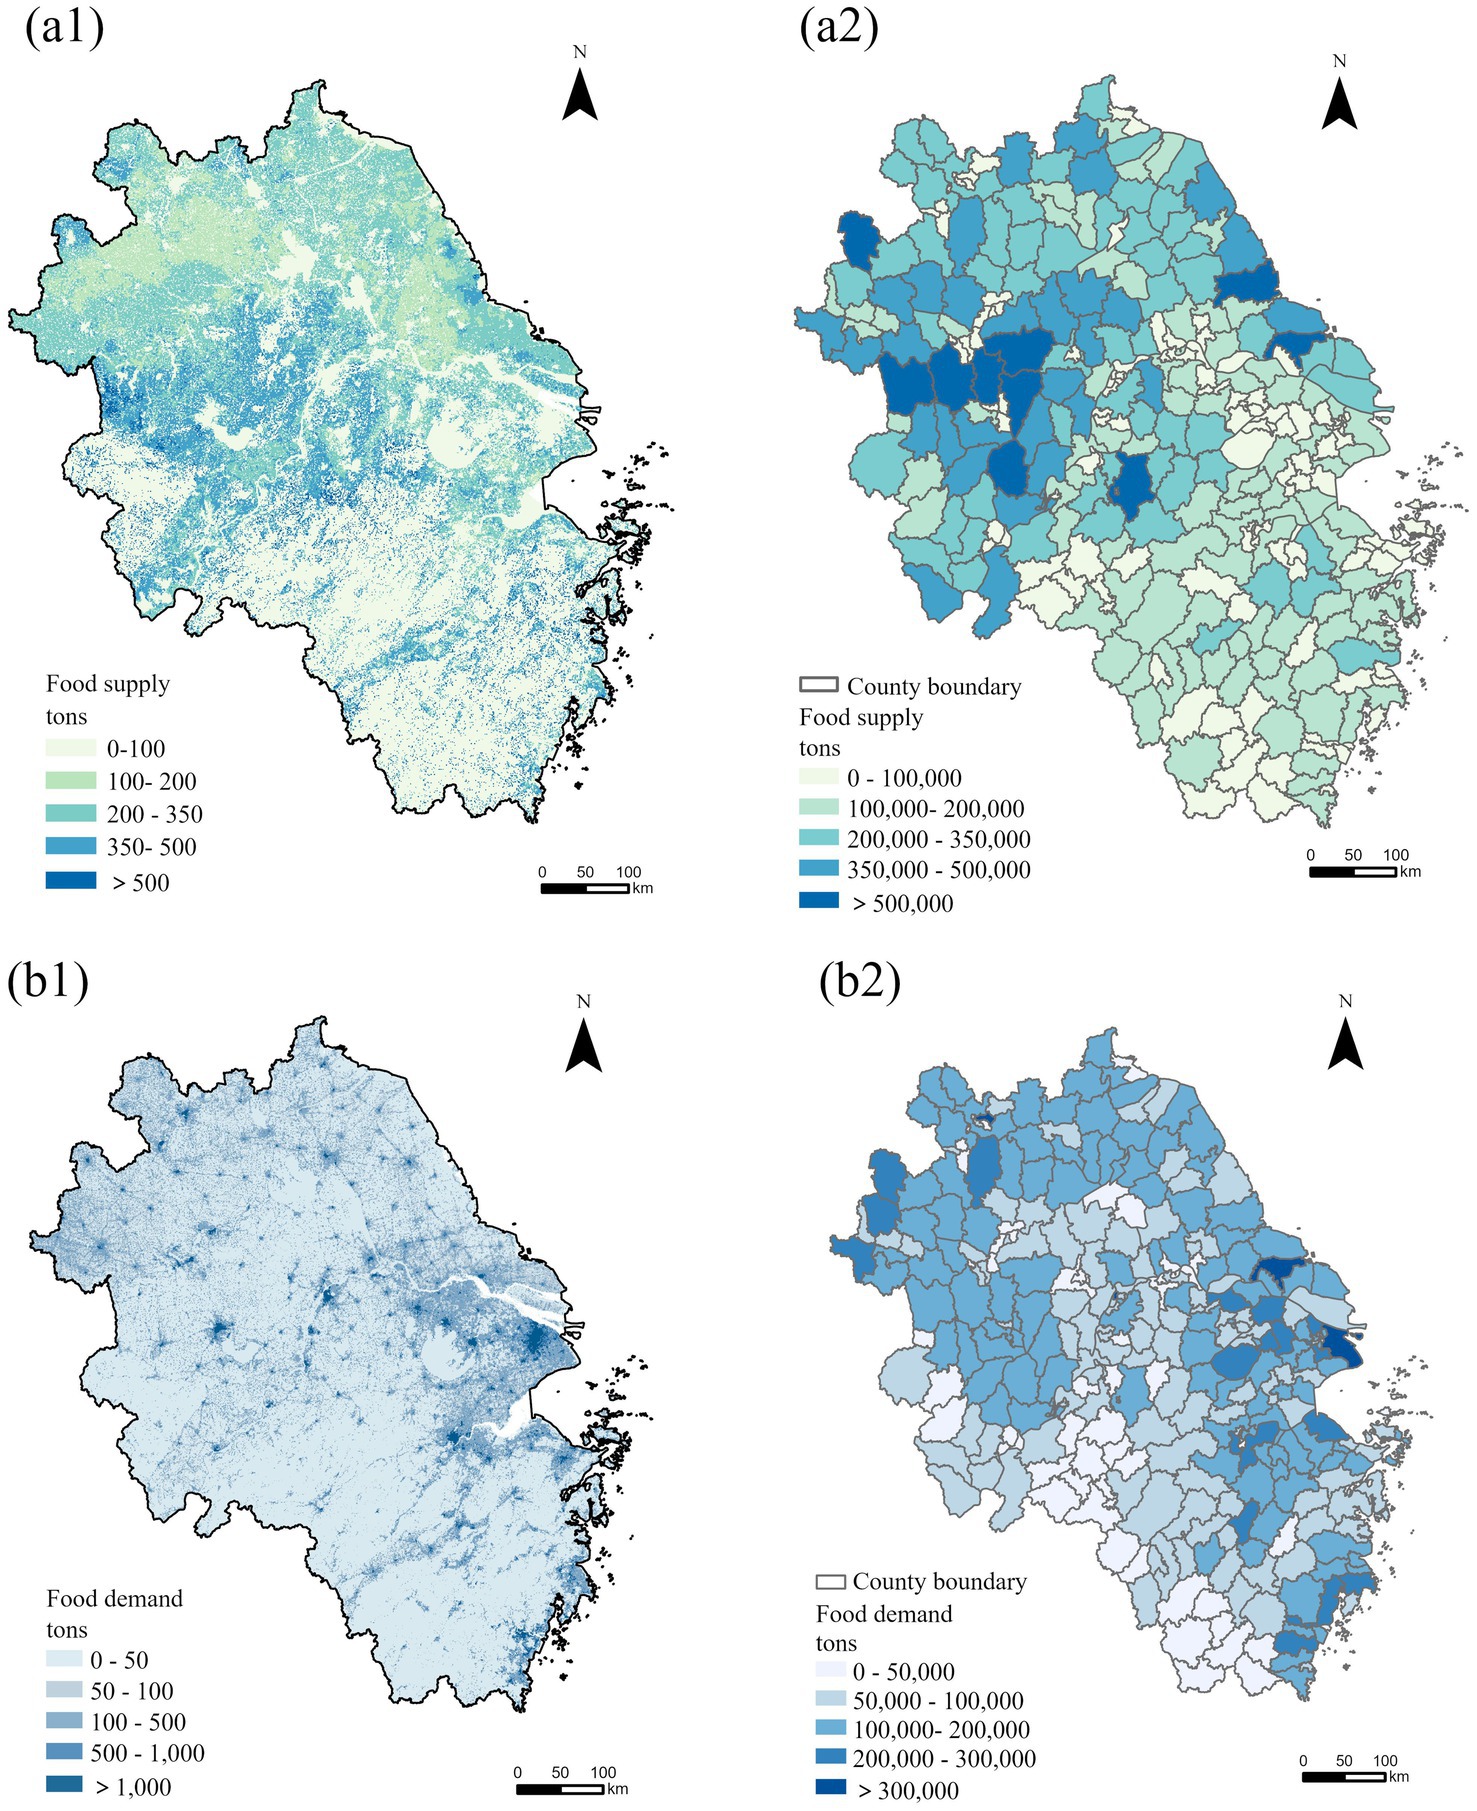
Figure 3. Spatial distribution of food supply and demand in the YRD. (A1) Food supply in raster-scale areas; (A2) food supply in district-and county-scale areas; (B1) food demand in raster-scale areas; (B2) food demand in district-and county-scale areas.
Spatially, the contradiction between supply and demand for food ecosystem services was significantly smaller in the north than in the south (Figure 4A1), and the eastern coastal areas in the YRD experienced severe food deficits. The overall self-sufficiency of food ecosystem services in the districts and counties of the YRD was optimistic (Figure 4A2), with 64% of the districts and counties experiencing food surpluses, 34% of the districts and counties experiencing food surpluses of more than 100,000 tons, and 7% of the districts and counties experiencing food surpluses of more than 300,000 tons. In addition, there were significant spatial differences in the food supply–demand ratios. The 21 districts with food supply–demand ratios (FSDRs) below 0.1 were primarily clustered in the municipal districts of provincial capital cities (Figure 4B). Among them, Shanghai stood out for its significant reliance on imported food, with an overall FSDR of 0.33 for the municipality, which was significantly below the standard level for supply–demand equilibrium.
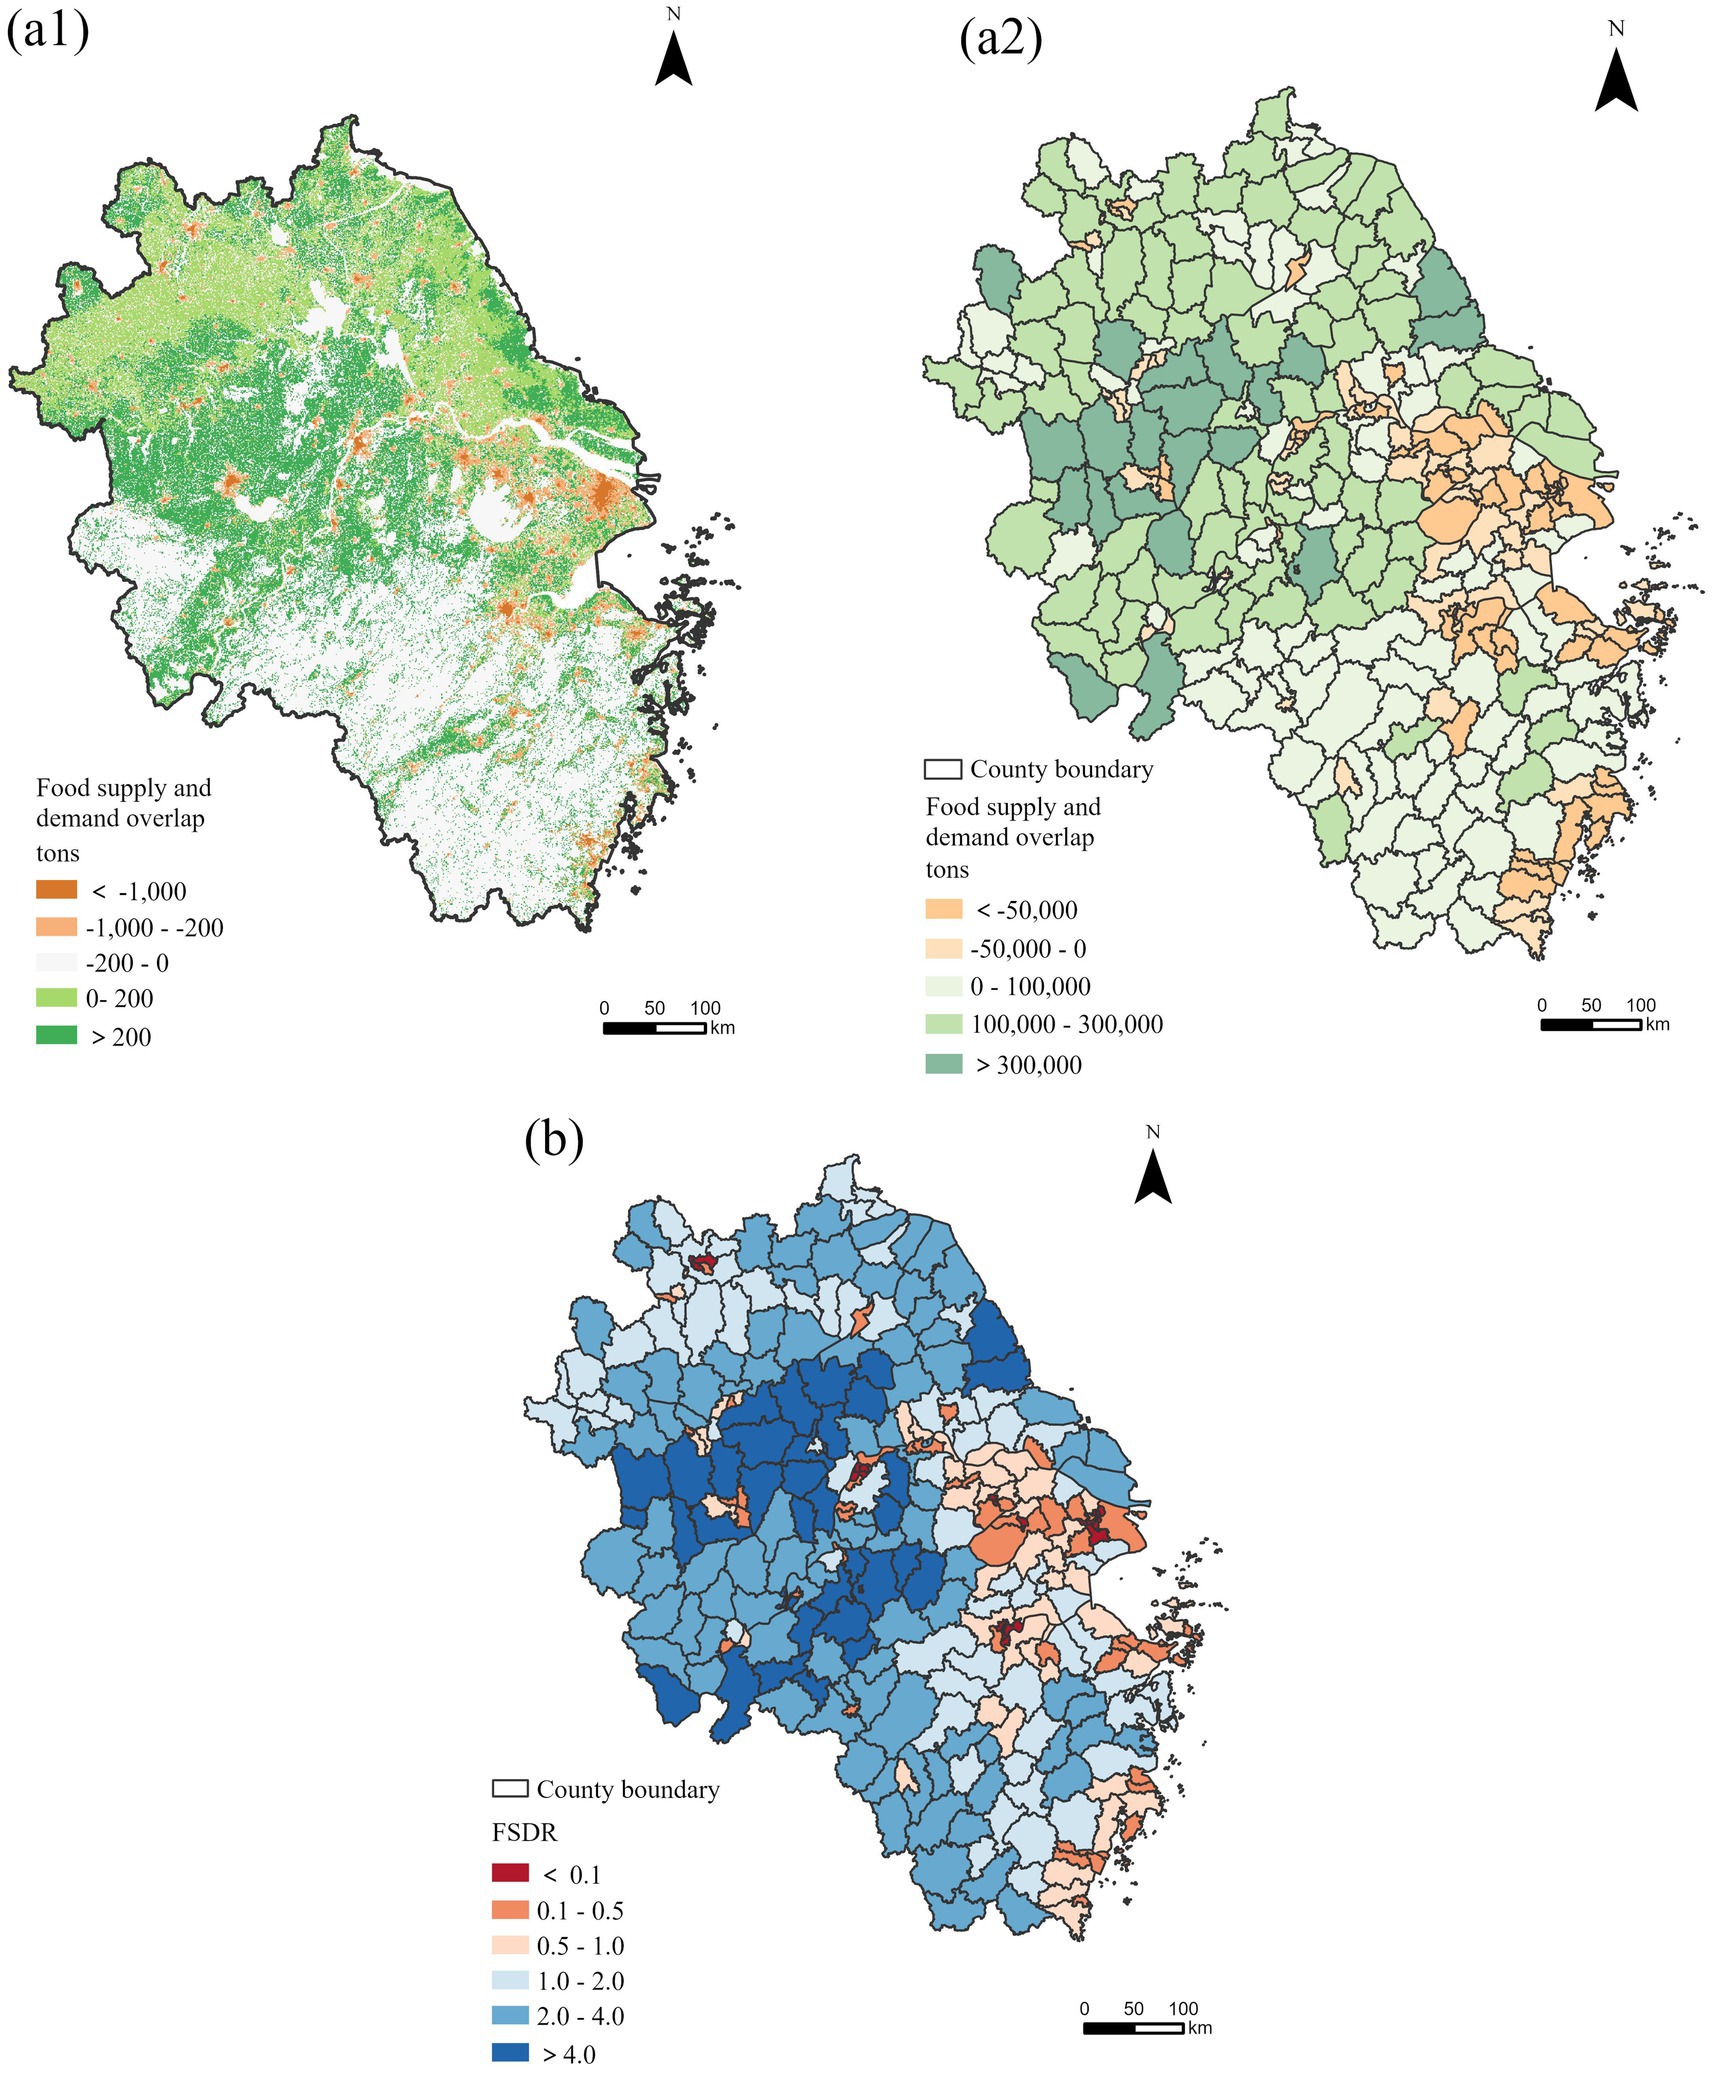
Figure 4. Spatial distribution of food supply–demand relationship in the YRD. (A1) Food supply and demand overlay in raster-scale areas; (A2) food supply and demand overlay in district-and county-scale areas; (B) food supply–demand ratio in raster-scale areas.
3.2 Constructing patterns of food ecosystem service flows
The supply of services was widely distributed in the western part of the YRD, while the demand was concentrated in the eastern and southern coastal areas (Figure 5A). The demand areas were scattered in the municipal districts of the western cities, while they were clustered in the east. In terms of cities, Chuzhou City, Lu′an City, Yancheng City, and Xuancheng City were the supply agglomerations, while Shanghai City, Suzhou City, Wenzhou City, and Wuxi City were the major demand areas. As the economic situation obviously affects population agglomerations and arable land protection, the eastern part of the study area had a higher level of economic development, a stronger pulling force on the neighboring population, and a smaller proportion of arable land, so the greater demand for food in the area was accompanied by a weaker food production capacity in the region, leading to more prominent food conflicts in the eastern part, which has become the main food deficit agglomeration area. From a theoretical perspective, using roads as pathways, a close food network between supply and demand was established in the YRD (Figure 5B), and food ecosystem services flow through the road network within the region. There was obvious spatial differentiation in the flows of food ecosystem services, which were susceptible to the influence of spatial distances. The eastern and southern regions had established closer food linkages with neighboring cities, with higher resource mobility, while the western and northern regions had relatively sparse food linkages.
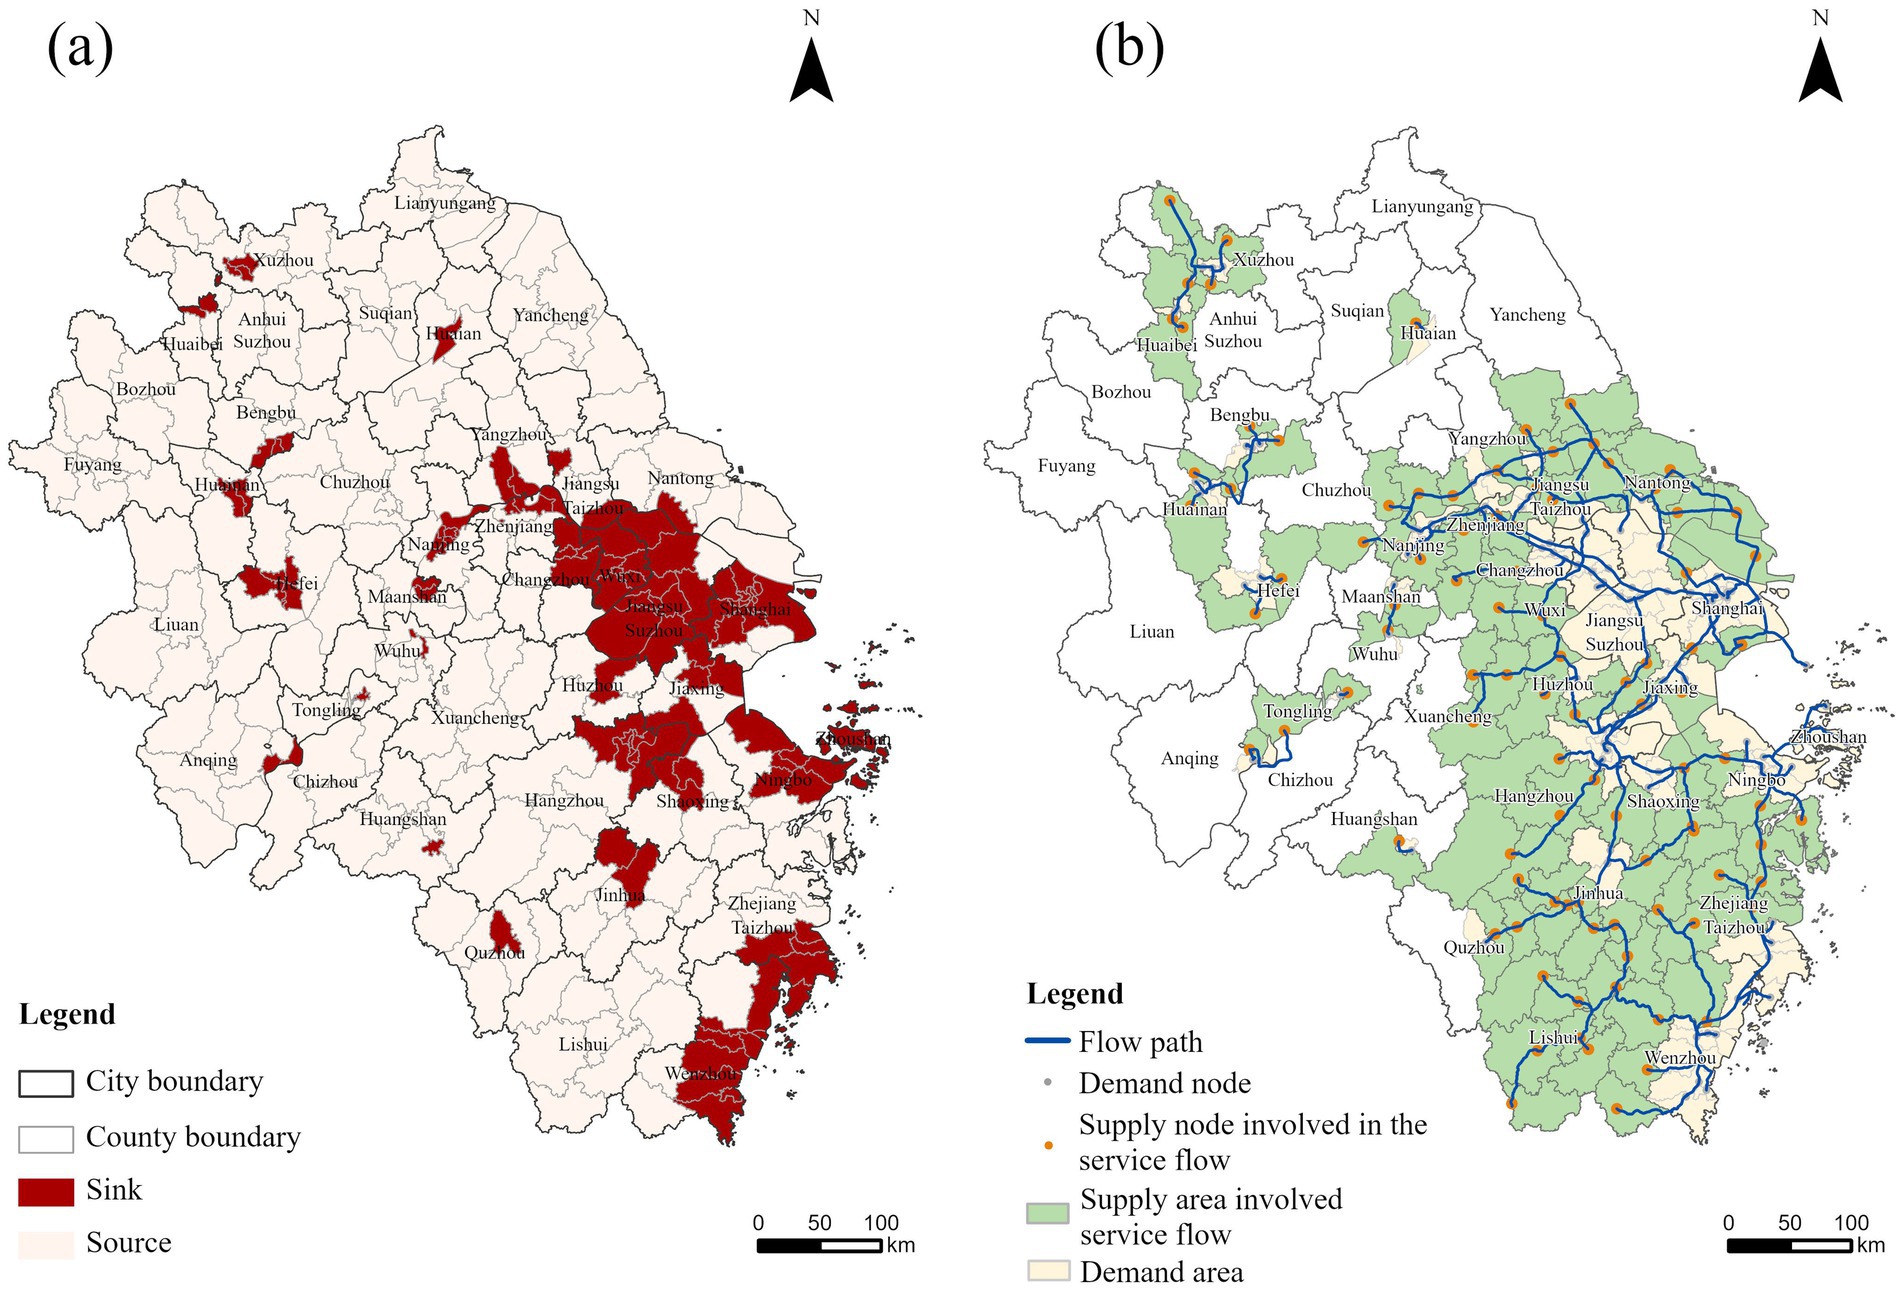
Figure 5. Food ecosystem service supply-demand areas and flow paths in the YRD. (A) Spatial distribution of source and sink areas; (B) Spatial distribution of flow paths.
A total of 187 food service flows were identified, all of which followed the principle of the lowest cumulative resistance cost and flowed from supply to demand locations (Figure 6). First, interdistrict and county food flows were dominated by the first tier (1,134–20,000 tons), in which the Wenzhou districts and counties became the main demand areas, the supply areas were more dispersed, and intracity district and county flows accounted for a larger proportion. The demand areas in the fifth tier of food service flow (150,000–21,3,022 tons) were the Putuo District, Yangpu District, Baoshan District and Minhang District, all of which are municipal districts of Shanghai, with most of the food supply coming from Jiangsu Province. Second, the food network in the YRD had formed a network topology that was dominated by districts and counties such as the Pudong New District, Guangde City, and Lucheng District, with decentralized core nodes. In the food network, the demand nodes were dominated by districts and counties such as the Pudong New Area, Lucheng District, and Gulou District and accounted for a larger proportion of the core nodes, while the number of supply nodes such as Guangde City, Jurong City, and Liyang City was relatively small. In addition, the network as a whole was dispersed, and there was a majority of nodes with a low degree of centrality, which means that most nodes were located at the edge of the network and had fewer neighboring nodes. Overall, most of the strong links were concentrated in the geographic neighborhoods of the core nodes, and most of the food flows were concentrated in local areas, with relatively few food flows with large spatial spans.
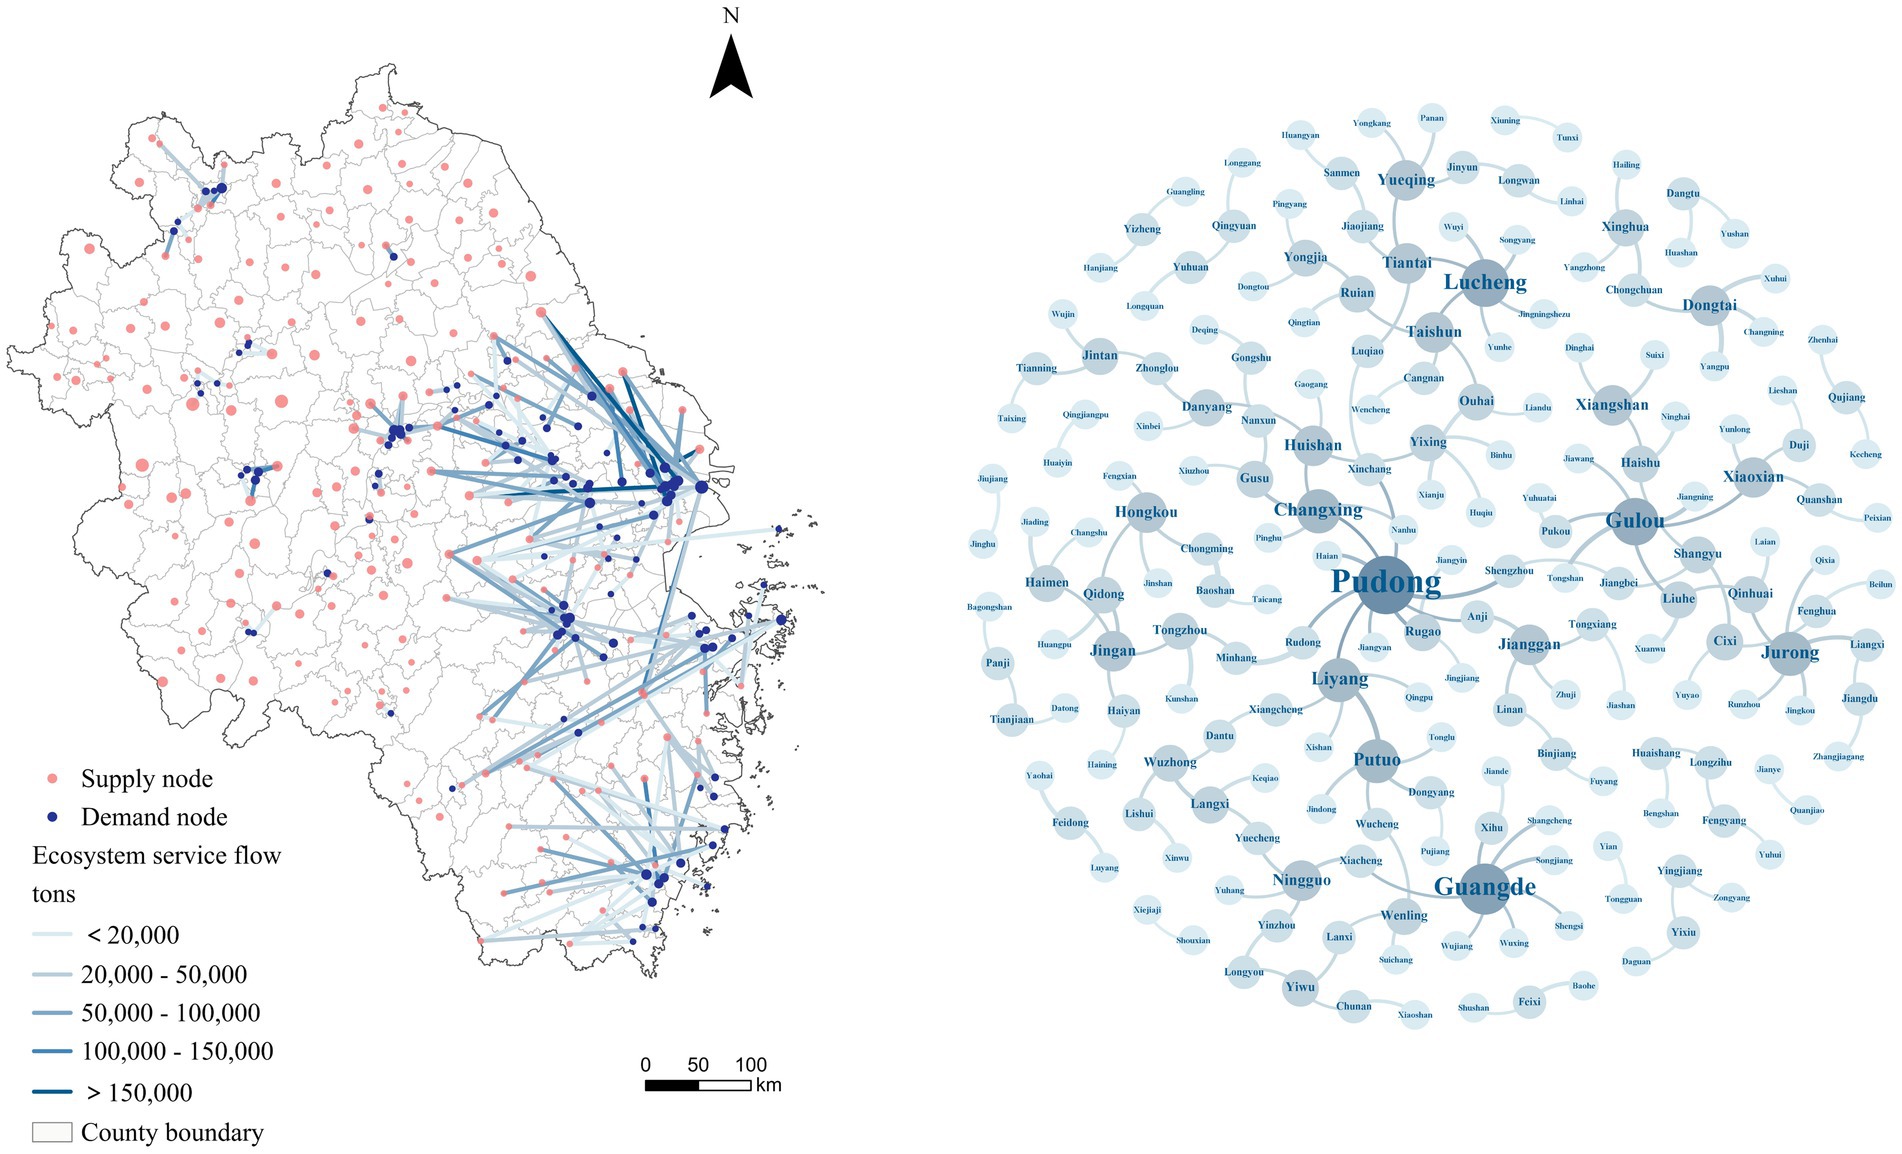
Figure 6. Food service flow trends and network topology at the county level in the YRD. In the flow spatial distribution graph, the size of supply and demand points indicates the level of static surplus or deficit, while the color of the connecting lines signifies the volume of flow. In the network topology graph, the color and size of the nodes represent the degree of external connectivity.
The imbalance between supply and demand of food ecosystem services was prevalent in the cities of the YRD, where food ecosystem services were closely linked and flowing clearly. Large urban populations were often accompanied by higher demands for ecological services, and Shanghai, Hangzhou and Nanjing became the core node cities for the food service flows in the YRD (Figure 7), as the main food inflows. Theoretically, the three cities had a total food flow of 4,724,300 tons, accounting for 30.70% of the total food service flow in the study area, with a high food throughput capacity. In particular, Shanghai had the largest food service flow inflow, with an inflow of 1.604 million tons and no food outflows. Hangzhou and Nanjing had the dual status of being both supply and demand areas, but the service flows were mostly inward replenishments, and most of the food outflows were remitted to other districts and counties in the city, with smaller outflows to the outside. In addition, the outflows from Nantong City and Xuancheng City became important food service outflows, with a total of 1,612,100 tons of outflows, where the service is mainly pooled to Shanghai and Hangzhou city. Notably, Wenzhou City and Suzhou City in Jiangsu Province also provided the main inflows of food services, with an external inflow of 1,163,500 tons. The two cities had high degrees of economic development, with strong industrial bases and high development potentials, a strong pull of population mobility, and a high demand for food resources. In addition, Zhoushan City was the only city with a unidirectional inflow of services, and Hefei City, Maanshan City, Huai’an City, Wuhu City, and Huainan City had only intracity flows of services. Overall, the food flows were dominated by interprovincial city-to-city flows, with provincial capitals and metropolitan area core regions receiving the main food service inflows. Inter-provincially, the total flow of ecosystem services in the Yangtze River Delta reached 7,693,700 tons. Within intra-provincial movements, Zhejiang Province exhibited the highest frequency, with a flow volume of 2,142,400 tons. And Jiangsu province stood out with the largest flow of food ecosystem services, amounting to 3,416,800 tons, positioning it as the most significant provider of food ecosystem services to Shanghai.
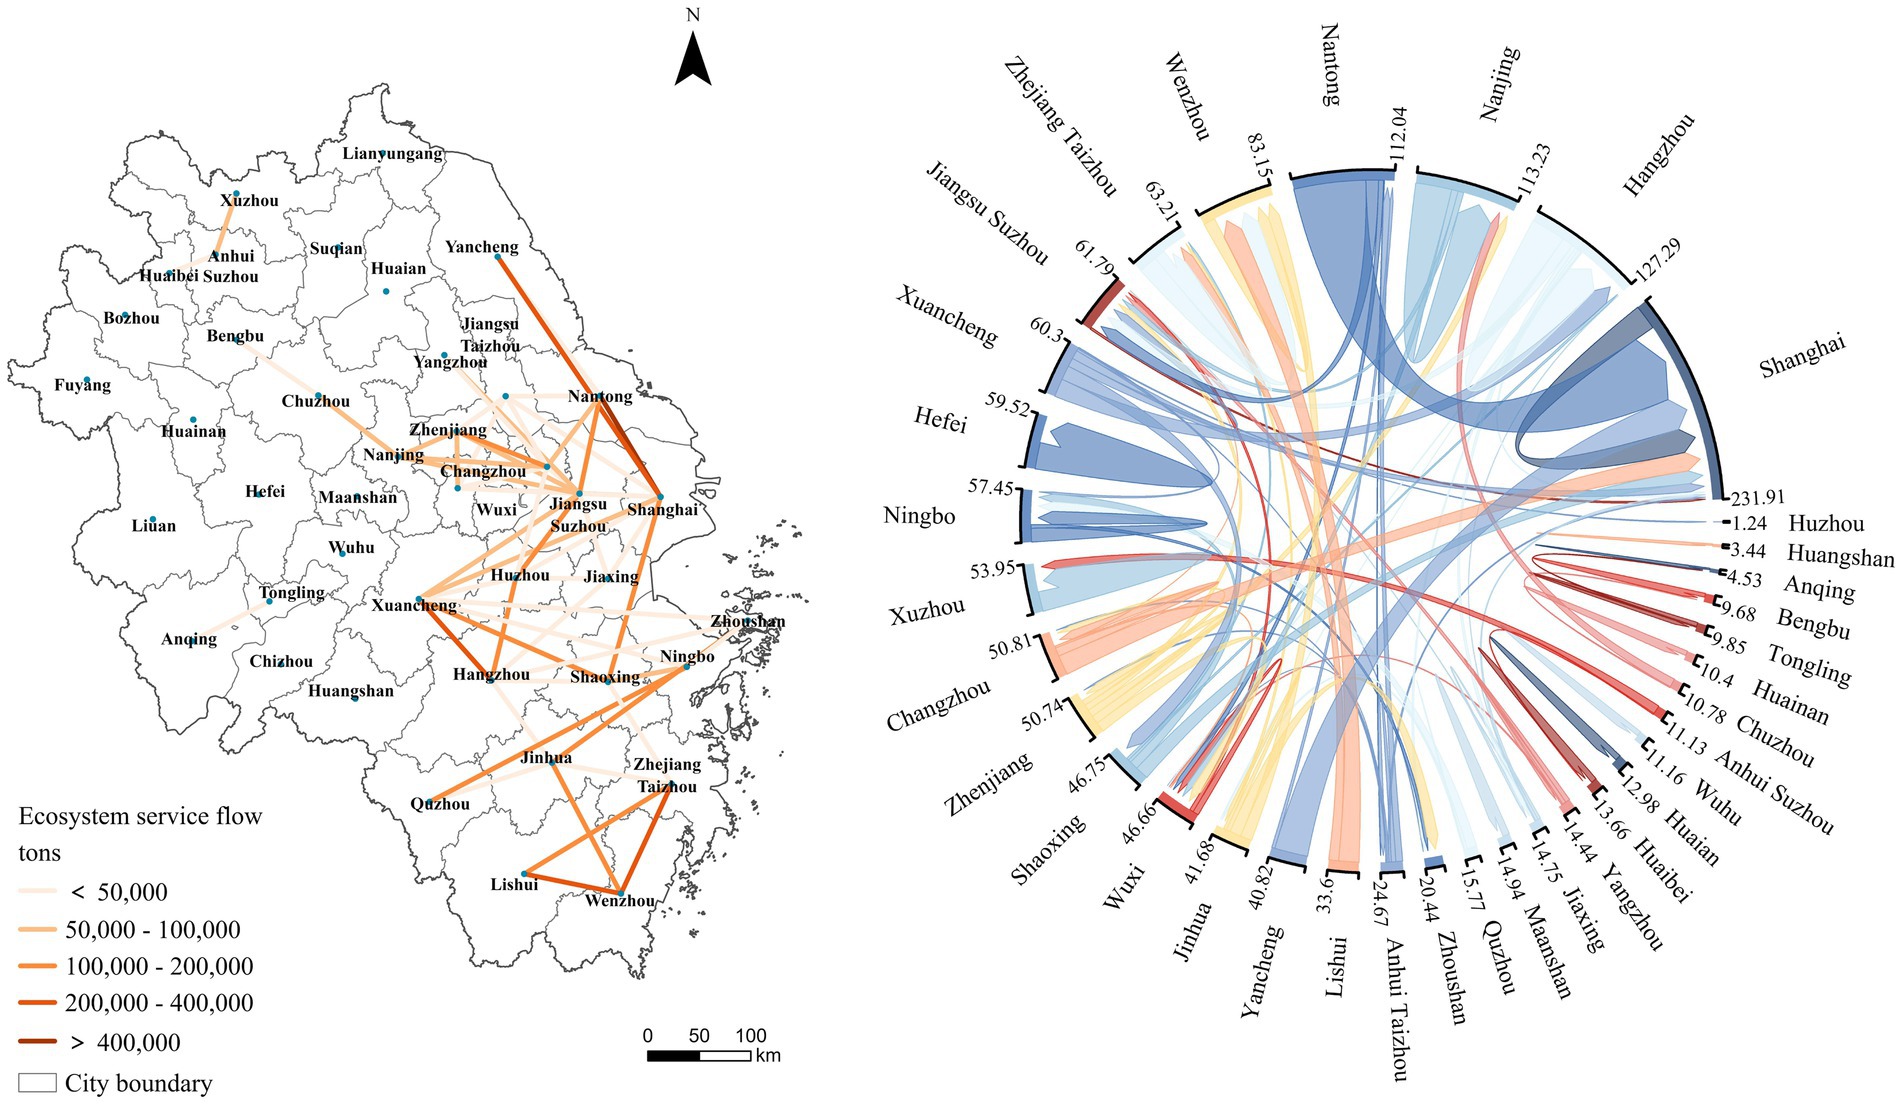
Figure 7. Patterns of urban-scale food service flows in the YRD. In the flow space distribution graph, the color of the connecting lines represents the volume of flow. In the chord diagram, the arrows indicate the direction of flow, and the thickness of the lines represents the amount of flow.
3.3 Optimization of patterns based on the relationship between supply and demand
Based on the Bayesian network, we clearly showed the complex linkages among ecological supply, social demand and food ecosystem service supply–demand matching (Figure 8). We defined the nodal FSDR as the target variable and used the variance coefficient reduction (VR) to assess the degree of influence of the drivers on the food supply–demand balance. The results of the study showed that the percentages of variance reductions were as high as 32.87, 26.02, 24.51, and 23.01% for land use, population, NTL and NDVI, respectively. The sensitivities of the remaining variables to the FSDR were all less than 10.00% of the variance reduction percentage, showing that the food supply and demand balance was too slow to reflect the changes in the status of the remaining variables. Overall, due to the presence of land types such as forest and grassland, the influences of population data and NTL on the balance of food service supply and demand were more pronounced than that of the NDVI.
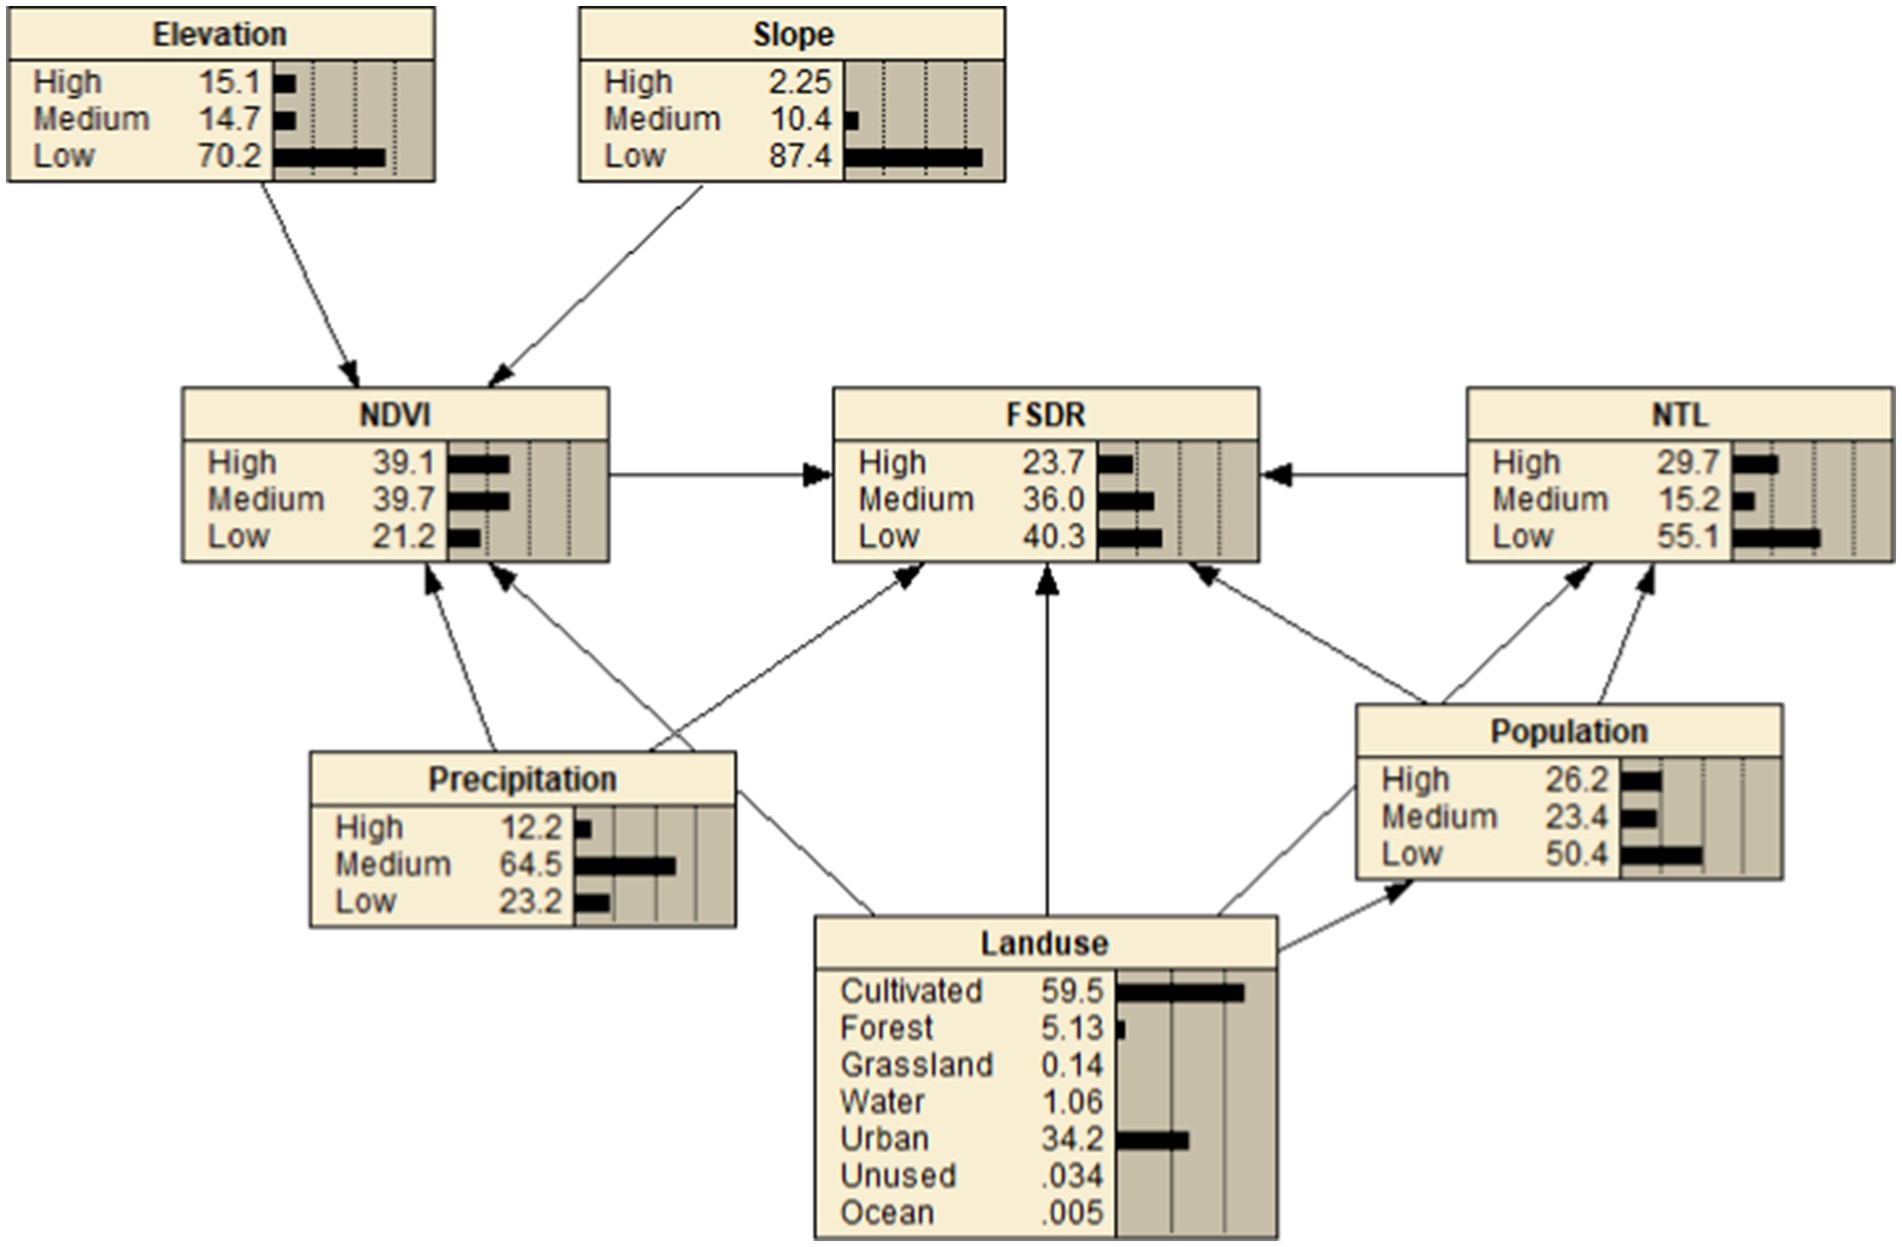
Figure 8. Bayesian belief network for matching supply and demand for food service.
The subset of optimal states for matching food service supply and demand was {Landuse = Cultivated, Population = Low, Night light = Low, and NDVI = High}, and the results are shown in Figure 9A. The areas with optimal state distributions were mainly concentrated in the western part of the YRD, and Chuzhou city, Lu′an city, and Xuancheng city had the best conditions for food service supplies; these areas could serve as the main food production areas in the YRD and provide a guarantee for regional food flow and food security. In addition, the suitable optimization areas were widely distributed in the western and southern parts of the study area (Figure 9B), where ecological optimization can improve the ecosystem service capacity of the region with maximum efficiency to promote the balanced development of ecosystems and social systems. It is worth noting that only Lu′an City, Chuzhou City and Huainan City in the western part of Anhui Province had good service provisioning effects, while most of the remaining areas had poor service provisioning effects and did not reach the ideal situation, which might be related to the lack of food production of arable land (Zhu et al., 2022; Feng et al., 2022).
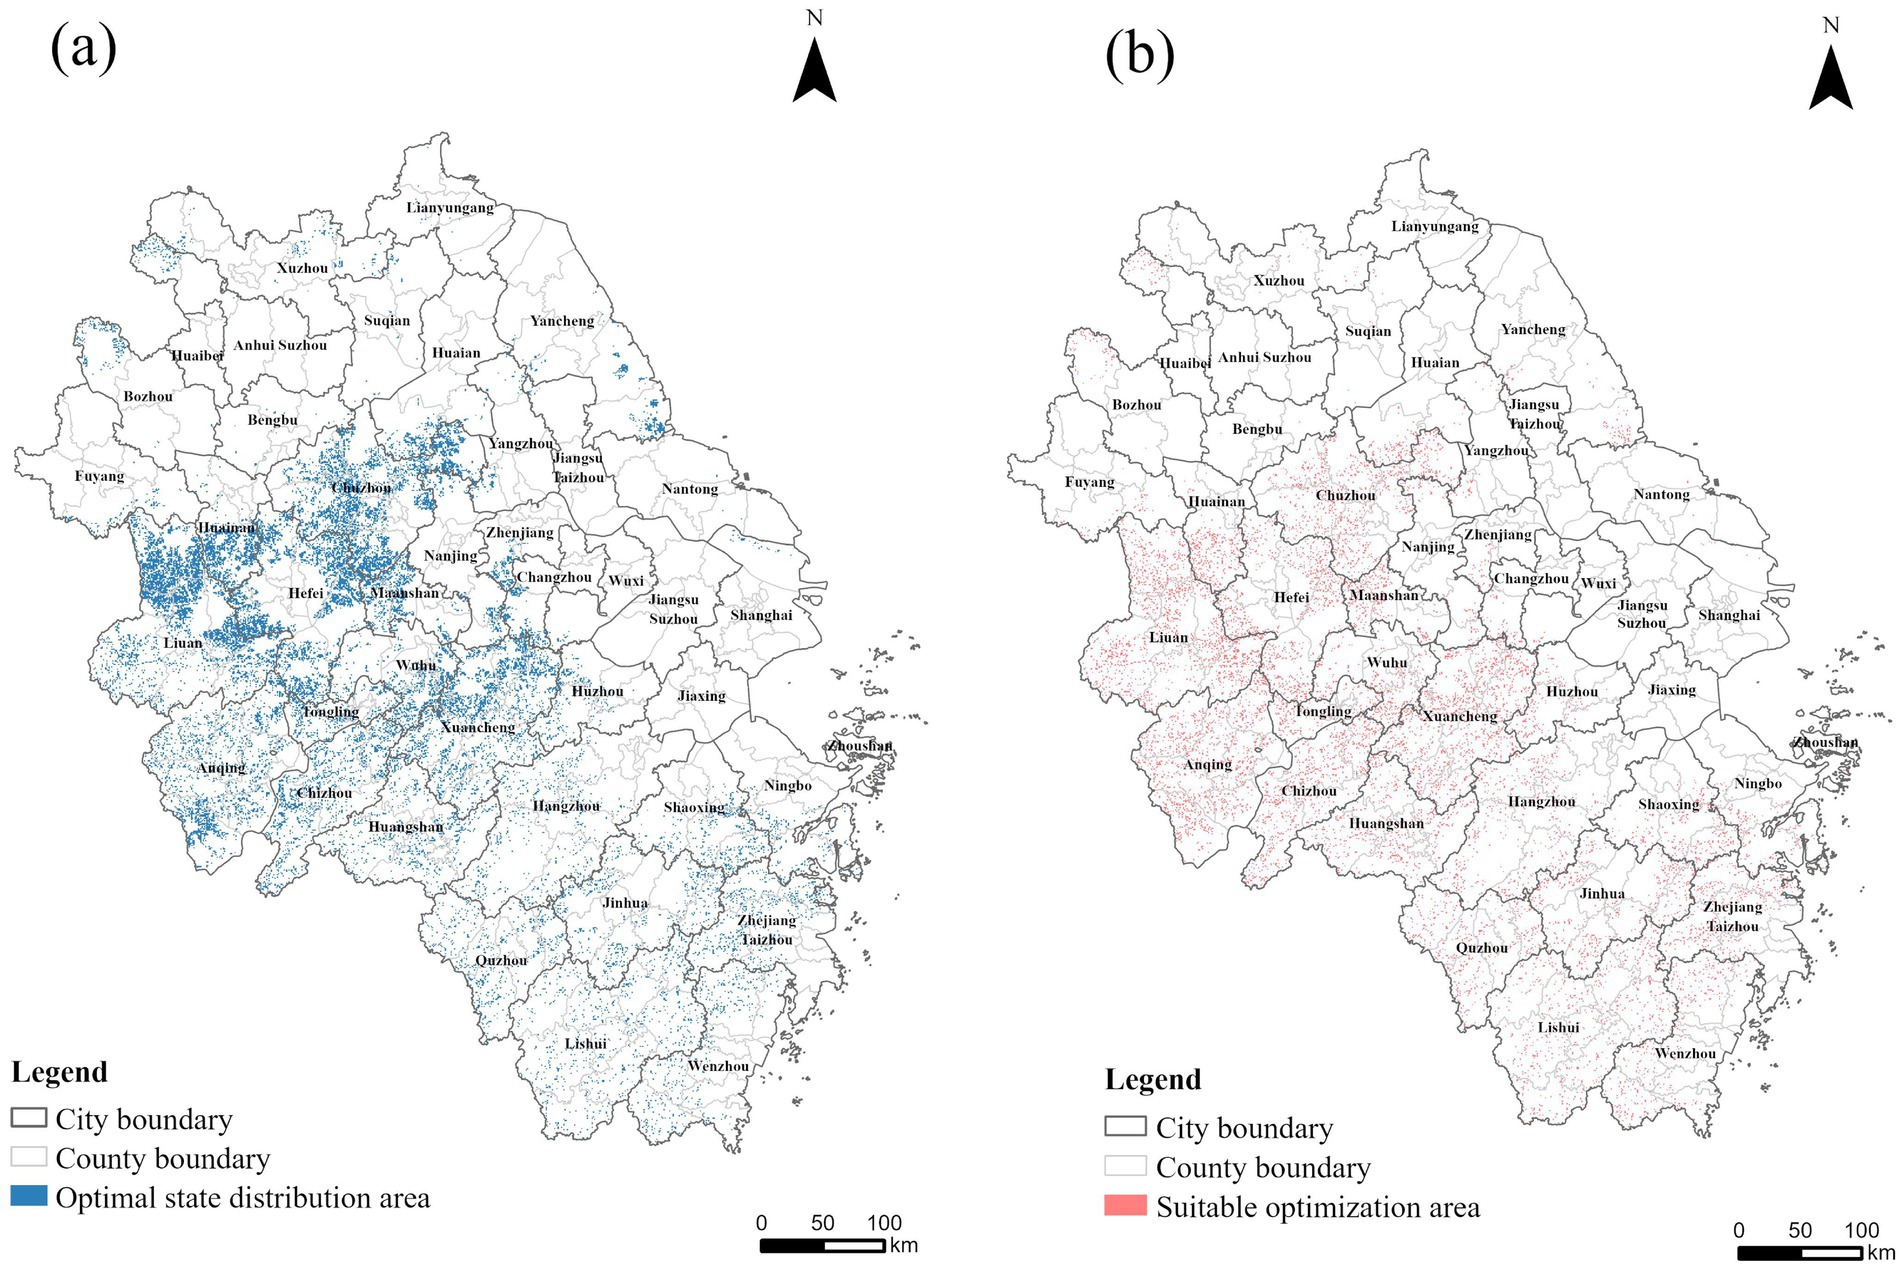
Figure 9. Spatial optimization distribution of food ecosystem services. (A) Optimal supply-demand matching areas; (B) Suitable optimization areas.
Based on the flow pattern of food ecosystem services, the suitable optimization areas were classified into two categories, which were important optimization areas and sub-important optimization areas, which aimed to provide guidance for subsequent food ecological optimizations. The important optimization areas were mainly distributed in the southern part of the YRD, with Zhejiang Province occupying an important position (Figure 10). Among them, suitable optimization areas for food services still existed in service demand areas such as the Huangyan District, Pujiang County, and Kecheng District, where ecological restoration initiatives demand prioritized implementation. Strengthening the rectification of non-agricultural and non-grain use of farmland within a region is conducive to increasing the region’s food self-sufficiency rate, thereby reducing the region’s dependence on external food services and alleviating the contradiction of food resource constraints in the region. In addition, the sub-important optimization areas were clustered in the western part of the study area in a ring shape, with Anhui Province accounting for the largest area. Increasing the investments in agricultural science and technology and accelerating the construction of high-standard farmland to enhance the supply capacity of regional food services are highly important to the overall food security in the YRD and can provide the necessary resources to support the stable development of the region in the future, thus promoting the overall high-quality development of the region.
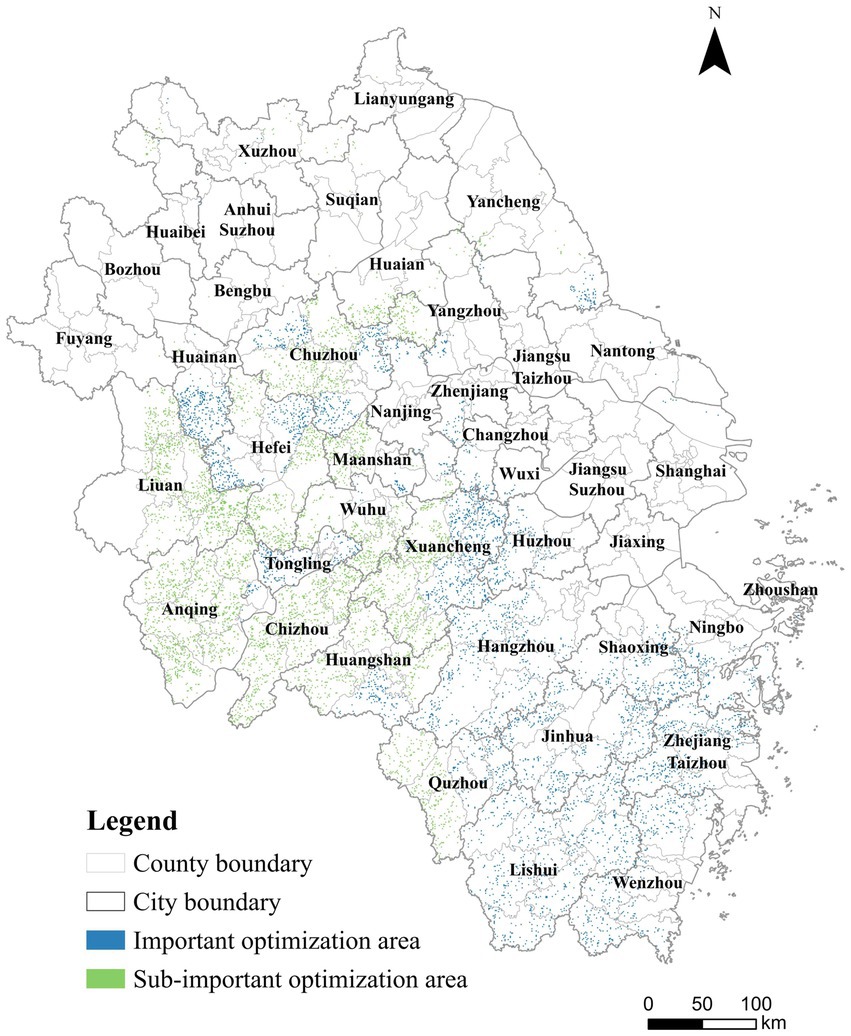
Figure 10. Distribution of important optimization areas and sub-important optimization areas of matching supply and demand for food service.
4 Discussion
4.1 The reliability and rationality of depicting patterns of food ecosystem service flows
Depicting the supply and demand flow patterns of food ecosystem services and identifying optimization areas are of significant importance for regional ecological management and food security, which also presents a significant challenge. Therefore, this study explores the possible optimal food ecosystem service flow patterns in the YRD by constructing a theoretical framework, which is more scientific and reasonable compared to previous research. Liu et al. (2022) and Zhou and Liu (2024) simulated the ecosystem service flows by using the E2SFCA algorithm, which emphasized the effect of distance on the flows and flow directions. Shi et al. (2020) used the inverse distance weights between ES supply and demand areas as the flow costs and analyzed the flows of ecosystem services within the city of Shanghai using linear programming and the simplex method. Different from that, we introduced the concept of the MCR in this study, considered multiple influencing factors comprehensively, and determined the supply–demand flow relationships and flow paths from the perspective of flow resistance. Then the direction and flow of food ecosystem services under the natural spillover effect were accurately depicted, and the possible optimal food ecosystem services flow pattern was constructed. Ben et al. (2016) used linear optimization to simulate interprovincial grain trade flows and concluded that the Yangtze River Delta is a dense area for grain trading with obvious internal flows. Jiangsu was found to supply a large scale of grain to Shanghai, which is highly similar to the findings of this paper. Notably, to compensate for micro-scale grain trade data limitations, scholars have employed methodologies including the social equity method (Fan et al., 2018), the CHINAGRO model (Yang T. et al., 2022), and input–output tables (Wang et al., 2023) to characterize virtual food flows through virtual water and land resource transfers. Intriguingly, their analytical frameworks and findings exhibit significant parallels with those presented in this study. Su et al. (2023) constructed an ecological compensation method based on the flow of arable land resources, utilizing the relationship between food production and consumption. The study found that most cities in the YRD are of the outflow type, with Shanghai and Hangzhou having the largest inflows. Shen et al. (2023) explored the pattern of agricultural virtual water flows in the YRD region and discovered that Shanghai tends to establish closer trade relations in agricultural products with bordering regions. The study also revealed that Jiangsu Province is gradually becoming the most important source of virtual water for Shanghai within the YRD. The existing studies are in close alignment with the research findings of this paper. The optimization of ecological functions is the purpose of spatial pattern construction. Zeng and Li (2019) and Tang et al. (2019) used Bayesian belief networks to screen a subset of key variables and extract ecosystem service optimization zones based on a realistic perspective; Wu J. et al. (2023) used Bayesian networks to determine subsets of optimal states and analyze them in comparison with the real situation and then extracted optimization areas. These studies confirm the rationality of using Bayesian beliefs for identifying optimized zones in this paper.
4.2 The connection between food trade and supply and demand flows for food ecosystem services under food security
Food security is not only affected by the supply and demand of food ecosystem services but also closely related to food consumption and trade, of which food trade has become an important means of balancing regional differences in food supply and demand (Yin et al., 2024). From the actual situation of regional food trade, in the YRD region, the economy is flourishing, the population is dense, and the demand for food is high. It has become the region with the most concentrated food demand and the most active food circulation (Yao, 2021). Interprovincial food linkages play an important role, and Shandong Province, Henan Province, and other regions have become the main sources of food trade in the YRD (Yang Q. et al., 2022). This is because the demand for food mainly consists of four parts: rations, feed grain, industrial grain and seed grain. Although the demand for rations is less than the total regional food supply, the regional food production cannot fully support the amount of food needed for regional development, which leads to the region still in an overall food deficit and needs external replenishment (Yao, 2021). Secondly, the structure imbalance of food varieties is also one of the main reasons for the gap between regional food supply and demand. With the development of the economy, the living standard of people has been greatly improved, and people’s demand for food has gradually tended to be diversified and high-quality (Wu, 2023). On the one hand, rice and wheat are the main types of food production in the region, and the production of beans is relatively small but in high demand, so beans are obviously dependent on the other areas.
There are certain differences between the actual pattern of food trade and the pattern of food ecosystem services supply and demand flows due to their differing focuses and influencing factors. Food trade is a conscious food transaction activity, and the distribution and circulation of food under market mechanisms is a key concern of its research (Wang J. et al., 2021). Driven by a high focus on economic profits, food surplus regions tend to maintain closer ties with economically developed regions, and food transfers tend to flow toward developed regions, impacting a wide range of areas (Dang, 2020). In food trade research, economic factors such as market transactions, prices, quantities, and trade policies of food commodities are the core concerns, to maximize economic benefits (Guan et al., 2022). In contrast, the flow of food ecosystem services emphasizes the connection between natural ecosystems and human wellbeing, focusing on reflecting the possible optimal flow process within a region, and representing the long—term and fundamental ecological and social values. This flow is also subject to practical factors such as transportation conditions, the distance between the supply and beneficiary areas, and the supply–demand relationship of ecosystem services, resulting in a relatively limited scope of influence (Wang and Zhou, 2019). Moreover, the focus of the food ESF is on matching the supply of and demand for ecosystem services within regions. This research highlights the complementarity of ecosystem services across different areas within a region, aiming to contribute to the region’s sustainable development and maximize the overall benefits of ecosystems (Zhu et al., 2019). Overall, the research on ecosystem service flows provides a complementary perspective for analyzing food production and trade from an ecological standpoint, which contributes to a more comprehensive understanding of regional ecosystem services and food security (Guan et al., 2022). In the future management of regional food security, the potential risks and potentials in regional food production and trade can be assessed in the context of regional food ecosystem service flow patterns, to optimize food trade and promote food security and ecological balance (Xiao et al., 2022).
4.3 Directions for ecological restoration and policy recommendations
Strengthening sustainable food production capacity is an essential foundation for achieving national food security and ensuring stable economic development (Gao et al., 2024) Identifying priority ecological restoration areas from the perspective of supply–demand balance and exploring the potential of regional food ecosystem services can make ecological interventions generate higher ecological and social values (Qiu et al., 2024). This could improve the efficiency and feasibility of ecological protection and restoration, and implement the food crop production strategy based on farmland management and technological application (Chen Zhen et al., 2024).
The areas without a food supply capacity in the identified optimization areas occupied relatively large areas and were concentrated in the southern and western parts of the study area. The matching of food service supply and demand in important optimization areas was poor, with a large number of locations without a supply capacity and a relatively small number of patches with FSDR > 10, which were scattered in Huainan City, Hefei City, Yancheng City and other places. Since most of the districts and counties in the important optimization areas were in a state of tight balance between supply and demand and were also greatly affected by the service demand areas, the ecological optimization of these areas has a certain degree of urgency and importance, and the ecological restoration of these areas can maximize the stability of the service flows and alleviate the contradiction of the regional food resource constraints. Strengthening the remediation of nonagricultural and nonfood cultivated lands and improving the market adaptability to increase the food supply capacity to a greater extent have become the focus of future developments in this field. In addition, the degree of matching of food ecosystem services in the sub-important optimization areas was relatively good, and the patches with FSDR > 10 occupied a large area and were distributed in a ring-like contiguous patch, which was concentrated in the southern part of Anhui Province, such as Lu′an city, Anqing city and other places. This type of area has a good supply base for food services, and ecological optimization work in this area is conducive to improving the overall food security in the YRD. Increasing investments in agricultural science and technology and accelerating the construction of high-standard farmland to explore the potential for increased food production are priorities for the future development of these areas, which will help to give full play to the advantages of natural resources to create a higher level of Jianghuai Granary and promote the transfer of ecological and social resources.
4.4 Research prospects
There is still room for continued depth and refinement in this study. First, remote sensing data, such as NDVI, are influenced by factors like cloud cover and atmospheric conditions, introducing some uncertainty into the results. To enhance the robustness of the data in the future, the reliance on a single data source can be diminished by integrating data from various remote sensing sources (Wang, 2021; Shen et al., 2021). Second, since the assignments of resistance factors have not yet reached a unified standard, this paper, while referencing previous research on resistance assignment in the MCR model, acknowledges that the standard values and assignment results inevitably retain a degree of subjectivity. Therefore, it is essential to optimize the data using more accurate information in the future to enhance the relevance of the research findings. Third, the constraints of regional boundaries greatly simplify the complexity of actual food flows within the region and neglect the close connections the region has with the outside world. Future research should consider the inflow of external ecosystem services, emphasize the openness of the ecosystem, and analyze ecological service flows across a broader area. Additionally, achieving a balance in food ecosystem services involves not only spatial equilibrium but also structural and temporal balances. In future research, incorporating the specific supply and demand volumes of individual crops, as well as historical food surplus data, into the calculations of food ecosystem service supply and demand will more accurately reveal regional food supply and demand patterns. Finally, while this study has explored the potentially optimal flow pattern of food ecosystem services in the YRD by constructing a framework, the research findings still need to be further verified with micro-level empirical data. Furthermore, the key to enhancing research accuracy and practical relevance lies in effectively integrating food ecosystem service supply–demand flows with actual food trade patterns to accurately characterize service flow mechanisms. In future research, building on field investigations to obtain micro-level empirical data should be prioritized to validate the scientific validity and practical applicability of the findings. Concurrently, the integration of interdisciplinary theoretical frameworks and methodological approaches will further refine the research framework, thereby driving forward the continuous advancement of ecosystem service flow studies.
5 Conclusion
Portraying the pattern of food ecosystem service supply and demand flows and exploring the direction of ecological optimization are important measures to improve the sustainability of regional ecosystems. It can provide a complementary ecological perspective for food security and is significant for regional ecosystem management. A new research framework for food ecosystem service supply and demand flow patterns was proposed. Using the MCR model to simulate the flow trend of food ecosystem services under conventional spillover effects, we clarified the food service network relationship, and ultimately constructed the service flow pattern. Then, the optimization areas were identified using the Bayesian belief network based on the food ecosystem service supply–demand balance dimension, which could provide support for ecosystem management. The results of the study showed that regional food ecosystem service flows were concentrated in local areas centered on districts and counties such as the Pudong New Area, with smaller spatial spans and lower flows. The majority of these flows occurred between cities within the same province. Provincial capital cities and the core region of the metropolitan area were the primary recipients of food ecosystem services, and Shanghai and Hangzhou were the core node cities. Additionally, Jiangsu Province had the largest flow of food ecosystem services and emerged as the most important source for Shanghai. Furthermore, the spatial heterogeneity of important and sub-important optimization areas for food ecosystem services was obvious, and the western and southern regions with tight balance between food supply and demand were the key areas for exploring the potential of food ecosystem services in the future. The research results could offer a reference for ecosystem service management and food security and offer support for regional ecological civilization construction.
Data availability statement
The original contributions presented in the study are included in the article/supplementary material, further inquiries can be directed to the corresponding author.
Author contributions
XQ: Conceptualization, Formal analysis, Investigation, Methodology, Resources, Software, Visualization, Writing – original draft. XW: Conceptualization, Resources, Writing – review & editing. ZW: Investigation, Resources, Writing – review & editing. WH: Conceptualization, Methodology, Validation, Writing – review & editing.
Funding
The author(s) declare that financial support was received for the research, authorship, and/or publication of this article. This study was funded by the Key Program of Sichuan Provincial Science and Technology Department (22ZDYF0134).
Conflict of interest
The authors declare that the research was conducted in the absence of any commercial or financial relationships that could be construed as a potential conflict of interest.
Generative AI statement
The authors declare that no Gen AI was used in the creation of this manuscript.
Publisher’s note
All claims expressed in this article are solely those of the authors and do not necessarily represent those of their affiliated organizations, or those of the publisher, the editors and the reviewers. Any product that may be evaluated in this article, or claim that may be made by its manufacturer, is not guaranteed or endorsed by the publisher.
References
Ben, P., Wu, S., Li, X., and Zhou, S. (2016). China’s inter-provincial grain trade and its virtual cultivated land flow simulation. Geogr. Res. 35, 1447–1456. doi: 10.11821/dlyj201608004
Cao, X., Wang, H., Zhang, B., Liu, J., and Yang, J. (2024). Sustainable management of land use patterns and water allocation for coordinated multidimensional development. J. Clean. Prod. 457:142412. doi: 10.1016/j.jclepro.2024.142412
Chen, Y., Lu, Y., Meng, R., Li, S., Zheng, L., and Song, M. (2024a). Multi-scale matching and simulating flows of ecosystem service supply and demand in the Wuhan metropolitan area, China. J. Clean. Prod. 476:143648. doi: 10.1016/j.jclepro.2024.143648
Chen, Y., Qiao, X., Yang, Y., Zheng, J., Dai, Y., and Zhang, J. (2024b). Identifying the spatial relationships and drivers of ecosystem service supply–demand matching: a case of Yiluo River basin. Ecol. Indic. 163:112122. doi: 10.1016/j.ecolind.2024.112122
Chen, Y., Zhai, Y., and Gao, J. (2022). Spatial patterns in ecosystem services supply and demand in the Jing-Jin-Ji region, China. J. Clean. Prod. 361:132177. doi: 10.1016/j.jclepro.2022.132177
Chen, Z., Guo, J., Ou, M., Zhang, X., and He, H. (2024). Multi-scenario Simulation of Construction Land Supply and Demand underthe Dual Constraints of Food and Ecology Security:A Case Study of Nanjing City in Jiangsu Province. China Land Sci. 38, 61–72.
Chen, Z., Lin, J., and Huang, J. (2023). Linking ecosystem service flow to water-related ecological security pattern: a methodological approach applied to a coastal province of China. J. Environ. Manag. 345:118725. doi: 10.1016/j.jenvman.2023.118725
Dang, H., and Li, J. (2023). Supply-demand relationship and spatial flow of urban cultural ecosystem services: the case of Shenzhen, China. J. Clean. Prod. 423:138765. doi: 10.1016/j.jclepro.2023.138765
Dang, K. B. (2020). Potential, flow and demand of rice provisioning ecosystem services – case study in Sapa district, Vietnam. Ecol. Indicat. 118:106731. doi: 10.1016/j.ecolind.2020.106731
Dang, K. B., Windhorst, W., Burkhard, B., and Müller, F. (2019). A Bayesian belief network–based approach to link ecosystem functions with rice provisioning ecosystem services. Ecol. Indicat. 100, 30–44. doi: 10.1016/j.ecolind.2018.04.055
Du, H. (2023). Ecological compensation in the Beijing-Tianjin-Hebei region based on ecosystem services flow. J. Environ. Manag. 331:117230. doi: 10.1016/j.jenvman.2023.117230
Du, W., Liao, X., Tong, Z., Rina, S., Rong, G., Zhang, J., et al. (2023). Early warning and scenario simulation of ecological security based on DPSIRM model and Bayesian network: a case study of east Liaohe river in Jilin Province, China. J. Clean. Prod. 398:136649. doi: 10.1016/j.jclepro.2023.136649
Fan, P., Liang, L., Xu, M., and Zhang, S. (2018). Study on inter-provincial cultivated land ecological compensation from perspective of virtual cultivated land flow. China Popul. Resour. Environ. 28, 91–101.
Fei, L., Shuang, M., and Xiaolin, L. (2023). Changing multi-scale spatiotemporal patterns in food security risk in China. J. Clean. Prod. 384:135618. doi: 10.1016/j.jclepro.2022.135618
Feng, Y., Ke, M., and Zhou, T. (2022). Spatio-temporal dynamics of non-grain production of cultivated land in China. Sustain. For. 14:14286. doi: 10.3390/su142114286
Feurer, M., Rueff, H., Celio, E., Heinimann, A., Blaser, J., Htun, A. M., et al. (2021). Regional scale mapping of ecosystem services supply, demand, flow and mismatches in southern Myanmar. Ecosyst. Serv. 52:101363. doi: 10.1016/j.ecoser.2021.101363
Gao, Q., Wang, Y., and Dou, Y. (2024). Spatial-temporal differentiation and driving factors of agricultural green development level in the Yanatze Economic Belt. Chin. J. Eco-Agric. 3, 1–14. doi: 10.12357/cjea.20240170
Goldenberg, R., Kalantari, Z., Cvetkovic, V., Mörtberg, U., Deal, B., and Destouni, G. (2017). Distinction, quantification and mapping of potential and realized supply-demand of flow-dependent ecosystem services. Sci. Total Environ. 593-594, 599–609. doi: 10.1016/j.scitotenv.2017.03.130
Guan, D., Deng, Z., Zhou, L., Fan, X., Yang, W., Peng, G., et al. (2023). How can multiscenario flow paths of water supply services be simulated? A supply-flow-demand model of ecosystem services across a typical basin in China. Sci. Total Environ. 893:164770. doi: 10.1016/j.scitotenv.2023.164770
Guan, J., Song, Z., and Liu, W. (2022). Change of the global grain trade network and its driving factors. Prog. Geogr. 41, 755–769. doi: 10.18306/dlkxjz.2022.05.002
Guan, Q., Hao, J., Ren, G., Li, M., Chen, A., Duan, W., et al. (2020). Ecological indexes for the analysis of the spatial–temporal characteristics of ecosystem service supply and demand: a case study of the major grain-producing regions in Quzhou, China. Ecol. Indicat. 108:105748. doi: 10.1016/j.ecolind.2019.105748
Huang, H., Xue, J., Feng, X., Zhao, J., Sun, H., Hu, Y., et al. (2024). Thriving arid oasis urban agglomerations: optimizing ecosystem services pattern under future climate change scenarios using dynamic Bayesian network. J. Environ. Manag. 350:119612. doi: 10.1016/j.jenvman.2023.119612
Ji, Q. (2024). Cross-scale coupling of ecosystem service flows and socio-ecological interactions in the Yellow River Basin. J. Environ. Manag. 367:122071. doi: 10.1016/j.jenvman.2024.122071
Jiang, H., Peng, J., Zhao, Y., Xu, D., and Dong, J. (2022). Zoning for ecosystem restoration based on ecological network in mountainous region. Ecol. Indic. 142:109138. doi: 10.1016/j.ecolind.2022.109138
Kleemann, J., Schröter, M., Bagstad, K. J., Kuhlicke, C., Kastner, T., Fridman, D., et al. (2020). Quantifying interregional flows of multiple ecosystem services – a case study for Germany. Glob. Environ. Chang. 61:102051. doi: 10.1016/j.gloenvcha.2020.102051
Lele, S., Springate-Baginski, O., Lakerveld, R., Deb, D., and Dash, P. (2013). Ecosystem services: origins, contributions, pitfalls, and alternatives. Conserv. Soc. 11:343. doi: 10.4103/0972-4923.125752
Li, Y.-Y., Zhang, Y.-Z., Jiang, Z.-Y., Guo, C.-X., Zhao, M.-Y., Yang, Z.-G., et al. (2021). Integrating morphological spatial pattern analysis and the minimal cumulative resistance model to optimize urban ecological networks: a case study in Shenzhen City, China. Ecol. Process. 10:63. doi: 10.1186/s13717-021-00332-2
Liu, W., Zhan, J., Zhao, F., Zhang, F., Teng, Y., Wang, C., et al. (2022). The tradeoffs between food supply and demand from the perspective of ecosystem service flows: a case study in the Pearl River Delta, China. J. Environ. Manag. 301:113814. doi: 10.1016/j.jenvman.2021.113814
Polishchuk, Y., and Rauschmayer, F. (2012). Beyond “benefits”? Looking at ecosystem services through the capability approach. Ecol. Econ. 81, 103–111. doi: 10.1016/j.ecolecon.2012.06.010
Qiu, X., He, W., and Zheng, S. (2024). Research on ecological network identification in rare animal habitats based on the max Ent model and ant colony algorithm: a case study of Giant panda National Park, China. Biodivers. Conserv. 33, 3207–3229. doi: 10.1007/s10531-024-02909-7
Shen, J., and Wang, Y. (2021). Allocating and mapping ecosystem service demands with spatial flow from built-up areas to natural spaces. Sci. Total Environ. 798:149330. doi: 10.1016/j.scitotenv.2021.149330
Shen, X., Jiang, M., Lu, X., Liu, X., Liu, B., Zhang, J., et al. (2021). Aboveground biomass and its spatial distribution pattern of herbaceous marsh vegetation in China. Sci. China Earth Sci. 64, 1115–1125. doi: 10.1007/s11430-020-9778-7
Shen, X., Kong, Q., Yu, X., and Dai, M. (2023). Research on the pattern of agricultural virtual water flow in Yangtze River Delta: based on water resource expanded MRIO model. China Rural Water Hydropower :17–25+34. doi: 10.12396/znsd.222415
Shi, Y., Shi, D., Zhou, L., and Fang, R. (2020). Identification of ecosystem services supply and demand areas and simulation of ecosystem service flows in Shanghai. Ecol. Indic. 115:106418. doi: 10.1016/j.ecolind.2020.106418
Su, D., Wang, J., Wu, Q., Fang, X., Cao, Y., Li, G., et al. (2023). Exploring regional ecological compensation of cultivated land from the perspective of the mismatch between grain supply and demand. Environ. Dev. Sustain. 25, 14817–14842. doi: 10.1007/s10668-022-02690-z
Sun, X., Zheng, H., Liu, Z., Ren, Y., and Tang, H. (2024). Research progress and prospects of multi-scale agroecosystem services. Acta Ecol. Sin. 44, 9443–9457. doi: 10.20103/j.stxb.202312272840
Tang, C., Li, J., Zhou, Z., Zeng, L., Zhang, C., and Ran, H. (2019). How to optimize ecosystem services based on a Bayesian model: a case study of Jinghe River basin. Sustain. For. 11:4149. doi: 10.3390/su11154149
Vargas, L., Willemen, L., and Hein, L. (2019). Assessing the capacity of ecosystems to supply ecosystem services using remote sensing and an ecosystem accounting approach. Environ. Manag. 63, 1–15. doi: 10.1007/s00267-018-1110-x
Wang, C., Li, W., Sun, M., Wang, Y., and Wang, S. (2021). Exploring the formulation of ecological management policies by quantifying interregional primary ecosystem service flows in Yangtze River Delta region, China. J. Environ. Manag. 284:112042. doi: 10.1016/j.jenvman.2021.112042
Wang, H., Hongchong, W., Zhao, W., Shen, L., and Zhang, L. (2023). Analysis on characteristics of water-energy-food circulation and pressure changes in the Changjiang River Economic Belt. Yangtze River 54:2–11+1. doi: 10.16232/j.cnki.1001-4179.2023.05.001
Wang, J., Dai, C., Zhou, M., and Liu, Z. (2021). Research on global grain trade network pattern and its influencing factors. J. Nat. Resour. 36:1545. doi: 10.31497/zrzyxb.20210615
Wang, J., and Zhou, W. (2019). Ecosystem service flows: recent progress and future perspectives. Acta Ecol. Sin. 39, 4213–4222. doi: 10.5846/stxb201807271605
Wang, Y. (2021). Spatiotemporal change of aboveground biomass and its response to climate change in marshes of the Tibetan plateau. Int. J. Appl. Earth Obs. Geoinf. 102:102385. doi: 10.1016/j.jag.2021.102385
Wu, J., Fan, X., Li, K., and Wu, Y. (2023). Assessment of ecosystem service flow and optimization of spatial pattern of supply and demand matching in Pearl River Delta, China. Ecol. Indicat. 153:110452. doi: 10.1016/j.ecolind.2023.110452
Wu, L. (2023). Full understanding of China’s food security from perspective of the greater food approach. Soc. Sci. J. :191–200+2+239.
Wu, Y., Li, C., Gao, B., Wang, M., Wu, Y., and Zheng, K. (2023). Construction of urban ecological security pattern in highland lakes cites: the case of Dali City. Acta Ecol. Sin. 43, 1–14. doi: 10.20103/j.stxb.202206211757
Xiao, H., Guo, Y., Wang, Y., and Wu, Y. (2022). From utility assessment to process measurement: progress in research on ecosystem services flow. Landscape Archit. 29, 32–37. doi: 10.14085/j.fjyl.2022.10.0032.06
Xiao, L., Haiping, T., and Haoguang, L. (2017). A theoretical framework for researching cultural ecosystem service flows in urban agglomerations. Ecosyst. Serv. 28, 95–104. doi: 10.1016/j.ecoser.2017.09.014
Xu, J., Xiao, Y., Xie, G., Wang, Y., and Jiang, Y. (2019). Computing payments for wind erosion prevention service incorporating ecosystem services flow and regional disparity in Yanchi County. Sci. Total Environ. 674, 563–579. doi: 10.1016/j.scitotenv.2019.03.361
Xu, Q., Yang, R., Zhuang, D., and Lu, Z. (2021). Spatial gradient differences of ecosystem services supply and demand in the Pearl River Delta region. J. Clean. Prod. 279:123849. doi: 10.1016/j.jclepro.2020.123849
Yang, D., Zhang, P., Zhang, J., Liu, Y., Liu, Z., and Chen, Z. (2025). Land use assessment under dynamic evolution: multi-objective optimization and multi-scenario simulation analysis. J. Environ. Manag. 373:123456. doi: 10.1016/j.jenvman.2024.123456
Yang, Q., Zhao, R., Luo, H., Zhu, R., Xiao, L., Xie, Z., et al. (2022). Spatial pattern and responsibility sharing of carbon transfer in China’s inter-provincial grain trade. Trans. Chinese Soc. Agric. Eng. 38, 1–10. doi: 10.11975/i.issn.1002-6819.2022.16.001
Yang, T., Zhang, X., Gao, X., Hu, Q., Wang, Q., Lun, F., et al. (2022). Study on inter-provincial grain trade and its impacts on virtual water and soil resources in China. Pratacult. Sci. 39, 1686–1697. doi: 10.11829/i.issn.1001-0629.2021-0441
Yao, S. (2021). Analysis on Grian supply and demand balance of Yangtze River Delta. J. Yunnan Agric. Univ. (Soc. Sci.) 15, 85–94. doi: 10.3969/j.issn.1004-390X(s).202012005
Yin, Z., Hu, J., Zhang, J., Zhou, X., Li, L., and Wu, J. (2024). Temporal and spatial evolution of global major grain trade patterns. J. Integr. Agric. 23, 1075–1086. doi: 10.1016/j.jia.2023.10.032
Yurui, L., Xuanchang, Z., Zhi, C., Zhengjia, L., Zhi, L., and Yansui, L. (2021). Towards the progress of ecological restoration and economic development in China’s loess plateau and strategy for more sustainable development. Sci. Total Environ. 756:143676. doi: 10.1016/j.scitotenv.2020.143676
Zeng, L., and Li, J. (2019). A Bayesian belief network approach for mapping water conservation ecosystem service optimization region. J. Geogr. Sci. 29, 1021–1038. doi: 10.1007/s11442-019-1642-x
Zhang, J., He, C., Huang, Q., and Li, L. (2023). Understanding ecosystem service flows through the metacoupling framework. Ecol. Indic. 151:110303. doi: 10.1016/j.ecolind.2023.110303
Zhang, W., Liu, G., and Yang, Z. (2020). Urban agglomeration ecological risk transfer model based on Bayesian and ecological network. Resour. Conserv. Recycl. 161:105006. doi: 10.1016/j.resconrec.2020.105006
Zhang, X., and Lu, Q. (2020). Review of ecosystem service flow in the urban scale. Environ. Protect. Sci. 46, 55–63. doi: 10.16803/j.cnki.issn.1004-6216.2020.06.010
Zhang, X., Wang, Y., Yuan, X., Shao, Y., and Bai, Y. (2022). Identifying ecosystem service supply-demand imbalance for sustainable land management in China’s loess plateau. Land Use Policy 123:106423. doi: 10.1016/j.landusepol.2022.106423
Zhong, R., Pu, L., and Pei, F. (2024). A framework to assess the comprehensive sustainability of human consumption and production: a case study of the Yangtze River Delta in China. J. Clean. Prod. 434:140049. doi: 10.1016/j.jclepro.2023.140049
Zhou, K., and Kong, F. (2024). Structure and function of river network and the influence mechanism in plainpolder area: a case study of southern flood district in Kunshan. Acta Ecologica Sinica. 44. doi: 10.20103/j.stxb.202302280357
Zhou, Y., and Liu, Z. (2024). A social-ecological network approach to quantify the supply-demand-flow of grain ecosystem service. J. Clean. Prod. 434:139896. doi: 10.1016/j.jclepro.2023.139896
Zhu, W., Li, S., and Zhu, L. (2019). Ecosystem service footprint flow and the influencing factors within provinces, China. Geogr. Res. 38, 337–347. doi: 10.11821/dlyj020171049
Keywords: ecosystem service flow, food supply and demand, flow pattern, Bayesian network, Yangtze River Delta
Citation: Qiu X, Wang X, Wang Z and He W (2025) Supply and demand flow patterns and optimization of food ecosystem services in China’s Yangtze River Delta. Front. Sustain. Food Syst. 9:1514478. doi: 10.3389/fsufs.2025.1514478
Edited by:
Liming Ye, Ghent University, BelgiumReviewed by:
Xiangjin Shen, Chinese Academy of Sciences (CAS), ChinaBrian Dermody, Utrecht University, Netherlands
Copyright © 2025 Qiu, Wang, Wang and He. This is an open-access article distributed under the terms of the Creative Commons Attribution License (CC BY). The use, distribution or reproduction in other forums is permitted, provided the original author(s) and the copyright owner(s) are credited and that the original publication in this journal is cited, in accordance with accepted academic practice. No use, distribution or reproduction is permitted which does not comply with these terms.
*Correspondence: Wei He, Y2R3aGVAMTYzLmNvbQ==