 Qianqian Wang
 Wangfang Xu
 Rongzhu Cheng
- 1School of Economics and Management, Zhejiang Sci-Tech University, Hangzhou, Zhejiang, China
- 2China Academy for Rural Development, Zhejiang University, Hangzhou, Zhejiang, China
- 3College of Management, Sichuan Agricultural University, Chengdu, Sichuan, China
Introduction: The global beef trade, as a critical component of the meat trade, plays an important role in balancing beef supply and demand worldwide. However, research on the evolution of its network patterns remains relatively limited. This article aims to explore the evolution of global beef trade network patterns and provide insights into its implications for sustainable development.
Methods: Using complex network theory, this paper constructs weighted and unweighted global beef trade networks based on international trade data and conducts an in-depth analysis of the evolution of global beef trade patterns from 2013 to 2022 across the overall, individual, and clustering levels.
Results: The analysis reveals an increasing trend in connectivity, efficiency, and tightness within the global beef trade network. In the unweighted network, the core beef-importing countries are primarily concentrated in Germany, the United Arab Emirates, and the Netherlands. However, in the weighted network, the core importing countries shift to the United States, Japan, and China. Meanwhile, the core beef-exporting countries consistently remain Australia, Brazil, and New Zealand in both network types. Additionally, the analysis identifies clustering and regionalization characteristics within the global beef trade blocks.
Discussion: These findings highlight the evolving dynamics of global beef trade, emphasizing the roles of key countries and the structural shifts in the trade network. The study provides targeted recommendations for promoting sustainable development in the beef trade sector.
1 Introduction
The demand for meat has been increasing along with rising global residents' income and the improvements in dietary structure (Godfray et al., 2018). As a significant segment of the meat industry, beef has experienced growing global demand (Kibona et al., 2022). However, due to resource and environmental capacity constraints, many countries and regions are unable to meet beef production needs independently (Chen et al., 2022). Consequently, international trade has become a vital mechanism for balancing and stabilizing the supply and demand in the global beef market (Caro et al., 2014). In recent years, global beef trade has shown remarkable growth. Using import values as a key indicator, data from the UN Comtrade database indicate that the total import value of the global beef trade increased from USD 39.11 billion in 2013 to USD 66.11 billion in 2022, with an average annual growth rate of 6.01%. This growth highlights the expansion of the global beef trade market over the past decade. It can be said that global beef trade constitutes an essential part of international agricultural trade, and its evolution not only affects food security and supply chain stability, but also has a link to global economic development and environmental sustainability.
Research on beef trade can be generally categorized into three areas. The first focuses on supply-demand dynamics, product structures and market competitiveness in the beef trade, utilizing statistical data to conduct comprehensive investigations at global or national levels (Reeves and Hayman, 1975; Anderson et al., 2002; Bindon and Jones, 2001; Fields et al., 2018). The second area investigates the impact of factors such as animal diseases, environmental regulations, and food safety on beef trade, mainly employing econometric models to analyze specific influencing factors (Darbandi et al., 2021; Webb et al., 2018; de Waroux et al., 2019; Wilson et al., 2003). The third area introduces advanced technological tools, such as machine learning, to forecast trends and patterns in beef trade by leveraging large datasets and complex algorithms (Batarseh et al., 2019; Jeong et al., 2024).
It is notable that the aforementioned studies have tended to emphasize the independence of individual countries' trade and cannot adequately capture the complex and interconnected relationships in global trade systems. Complex network analysis offers a robust framework for abstracting and simplifying real-world social systems, enabling a more precise investigation of interactions and influences between nodes (Strogatz, 2001; Pagani and Aiello, 2013; Costa et al., 2007). By representing trade relationships as networks, researchers can examine the structural characteristics of these networks, uncover relationships between countries, identify key players in trade, and reveal regional clustering and cooperation patterns. This approach offers a comprehensive understanding of the dynamic and intricate features of the global trade system (An et al., 2018; Hou et al., 2018; Wang et al., 2021). Consequently, complex network theory has gained widespread application as an effective analytical tool in international trade research (Li et al., 2003; Serrano and Boguñá, 2003; Fagiolo et al., 2009; Fan et al., 2014, 2021).
Despite the importance of the global beef trade in the international economy, systematic studies on the evolution of its network patterns remain relatively limited. For example, what are the trends in the evolution of the global beef network structure in recent years? Which countries or regions occupy central roles in the global beef trade network? Does the global beef trade network exhibit regional and clustering characteristics, and if so, how have these evolved? The answers to the above questions are particularly important for countries, especially major beef trading nations. Clarifying the relationships within the beef trade network can help nations adjust their industrial policies, thereby promoting the sustainable development of global beef trade.
To address these issues, this paper conducts an in-depth analysis of the relatively underexplored field of beef trade networks. First, topological structure indicators in complex networks are selected to analyze the overall structural characteristics of the global beef trade network. These indicators provide a quantitative basis for examining the network's topological features and dynamic evolution. Second, both unweighted and weighted centrality indicators are employed to comprehensively identify the countries and regions that play dominant roles in beef trade. Finally, block modeling analysis is applied to identify role similarities and grouping structures within the beef trade network, providing deeper insights into trade relationships between countries. Therefore, this study not only enriches the application of complex network theory in agricultural trade research but also provides a reference framework for analyzing trade networks of other agricultural products.
2 Materials and methods
2.1 Complex network analysis indicators
2.1.1 Whole network analysis
Complex networks are characterized by a variety of metrics that reflect their overall characteristics. In this study, four key indicators—average distance, network density, network diameter and average clustering coefficient—are selected to explore the evolution of the overall characteristics of the global beef trade network (Hao et al., 2018; Bai et al., 2023).
1. Average Distance
Average distance measures the average shortest path length between any two nodes in the network. It is calculated using the following formula:
where AD is the average distance, N is the total number of nodes, d(i, j) is the shortest path length between node i and node j. It quantifies the average number of steps along the shortest paths required to connect any two nodes within the network. A larger average distance indicates poor connectivity and low efficiency, requiring more steps for nodes to reach each other.
2. Network Density
Network density quantifies the proportion of actual connections to all possible connections within the network. For a directed network, this metric is calculated as follows:
where D, E and N represent the network density, actual number of edges, and the number of nodes, respectively. Network density reflects the extent of interconnectedness in trade networks, with higher densities indicating more integrated trade relationships.
3. Network Diameter
Network diameter represents the longest shortest path between any two nodes, and can be expressed as:
where ND is network diameter, d(i, j) is the shortest path length between nodes i and j. The network diameter provides a measure of the maximum distance within the network, indicating the longest direct trade connection in the network.
4. Average Clustering Coefficient
The clustering coefficient assesses the degree to which nodes in the network are clustered together. For a directed whole network, the average clustering coefficient is calculated as:
where C is average clustering coefficient, N is the total number of nodes, Ei is the number of edges between the neighbors of node i, and ki is the degree of node i. A higher average clustering coefficient indicates that countries tend to form tightly connected trading groups or clusters.
The changes in average distance and network diameter indicate the connectivity and efficiency of the global beef trade network, while network density and average clustering coefficient reflect the tightening and regionalization of the trade network. These structural indicators provide essential support for optimizing supply chain resilience, enhancing trade efficiency, and addressing unexpected external shocks.
2.1.2 Centrality analysis
Centrality is used to identify the most important or influential nodes in a network and serves as a critical structural metric. This article employs the commonly used degree centrality to measure node influence (Freeman, 1979). Degree centrality quantifies the number of direct connections a node has. In an undirected network, degree centrality refers to the total count of edges connected to a node. In directed networks, it is divided into in-degree (number of incoming edges) and out-degree (number of outgoing edges). The calculation formulas are as follows:
where di, , , N represent the degree centrality of node i, the out-degree centrality of node i, the in-degree centrality of node i, and the total number of nodes, respectively. aij is an element of the adjacency matrix, which indicates whether there is a directed edge from node i to node j (1 if yes, 0 if no), so is aji.
In weighted networks, it is essential it is essential to consider both the number of connections and the weights of those edges. This is measured using the node strength metric, which can be divided into out-strength and in-strength for directed networks. The calculation formulas are as follows:
where si, , , N represent strength of node i, out-strength of node i, in-strength of node i, and the total number of nodes, respectively. wij and wji stand for weight of the edge from node i to node j, and the weight of the edge from node j to node i.
The application of centrality indicators in the beef trade network identifies core countries or regions involved in beef trade and underscores their critical role in maintaining global trade stability. This analysis provides policymakers with valuable insights to identify dependencies and implement diversification strategies to mitigate supply chain risks.
2.1.3 Block modeling analysis
Block modeling analysis, introduced by White et al. (1976), is a method for studying network position models. As an effective tool, it can identify and understand structural patterns within complex networks. By grouping nodes with similar relationships into blocks, block modeling analysis could reveal the equivalence of roles within the network.
The application of block modeling analysis to the beef trade network identifies role distributions among regional clusters and peripheral countries. This approach facilitates the analysis of regional cooperation and the global competitive pattern, providing decision-makers with valuable insights to help peripheral countries better integrate into the global beef trade network.
In this article, we use the commonly employed CONCOR (CONvergence of iterated CORrelations) algorithm to iterate based on the correlation matrix between nodes until the correlation matrix converges (Breiger et al., 1975). The brief procedural steps are as follows: first, the number of blocks in the overall network is determined using the CONCOR algorithm. Subsequently, a density table and an image matrix between the blocks are derived. Finally, a simplified graph is presented, which more clearly illustrates the structure of each block within the entire network.
2.2 Data description
The HS codes used in this article to determine the classification of beef include HS0201 (fresh beef) and HS0202 (frozen beef). The data were sourced from UN Comtrade database (UN Comtrade Database, 2024). This study employs import value data to characterize trade relationships, as imports are potentially more accurate (Webb et al., 2018). Therefore, the global import trade value is calculated as the sum of the import values of fresh beef and frozen beef. The study covers a decade-long period from 2013 to 2022, with specific focus on the years 2013, 2017, and 2022. These years are selected to analyze the evolving trade network characteristics of beef-importing countries. Additionally, the software used in this study is Ucinet 6 and Netdraw.
2.3 Global beef trade network construction
The global beef trade is a typically complex network. In this article, countries or regions are represented as nodes, and import relations as edges to construct a directed complex network of global beef trade. To better understand the global beef trade network, both unweighted and weighted networks are constructed.
In the unweighted network, the trade relations are represented by the adjacency matrix A, where each element aij indicates whether node i imports beef from node j (1 if it imports, 0 otherwise). In the weighted network, the trade relations are represented by the adjacency matrix W, where each element wij represents the value of beef trade imported by node i from node j.
It should be noted that the global beef trade network in this article only includes the countries and regions reported in the UN Comtrade database, resulting in minor variations in the number of nodes each year. However, these differences are minimal, and their impact on the comparability of complex network indicators can be reasonably disregarded in this study.
3 Results
3.1 Visualization of the beef trade network
To more intuitively examine the characteristics of the global beef trade network, this study utilizes Netdraw software to visualize the networks for the years 2013, 2017, and 2022 (Figures 1–3). The node size in the figures represents the out-degree centrality value, with larger nodes indicating higher out-degree centrality. Preliminary observations reveal certain changes in the beef trade networks over the years, particularly regarding the central positions of some countries or regions. However, more detailed analysis requires further examination using additional metrics.
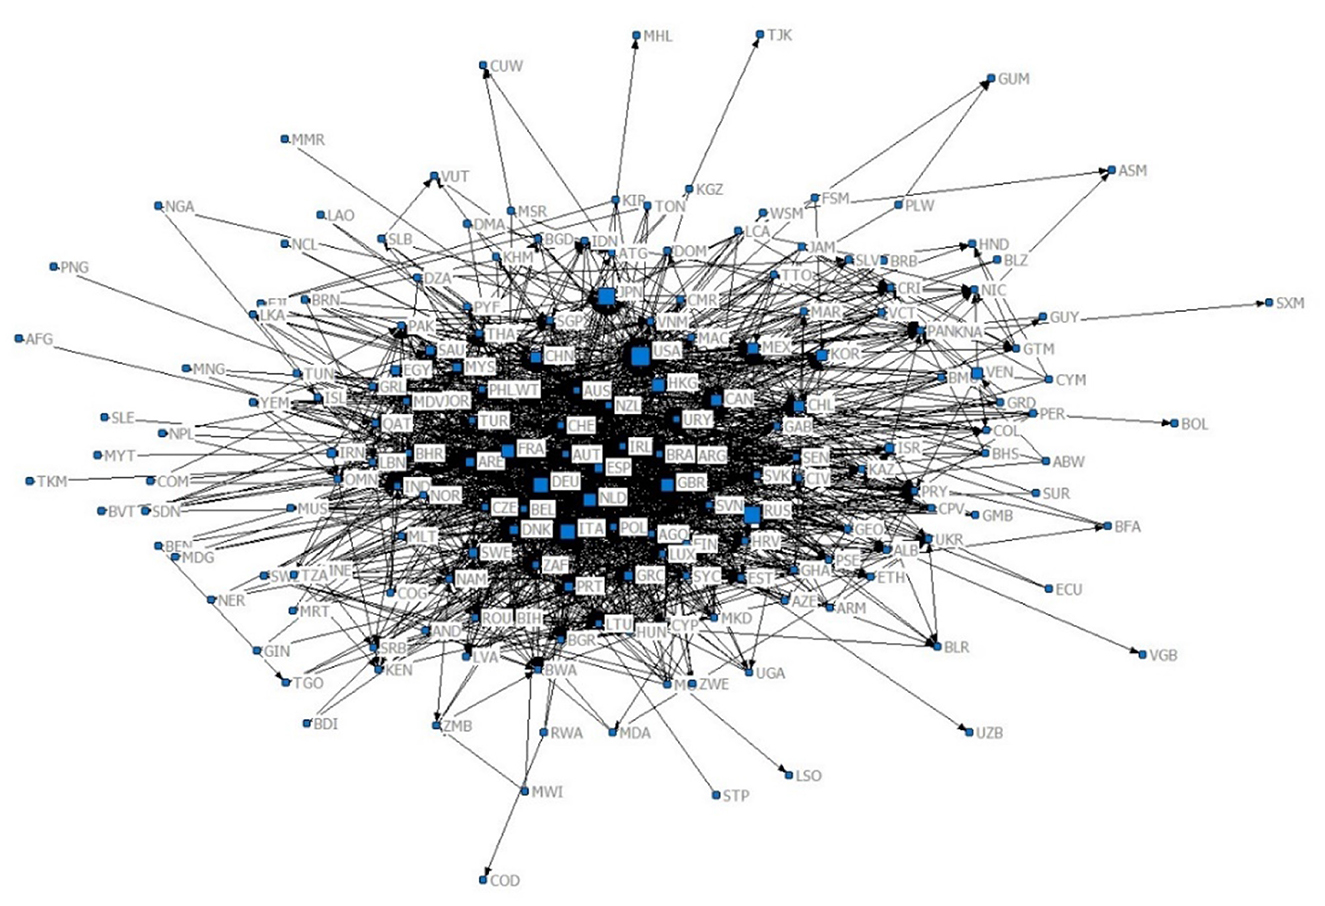
Figure 1. Global beef trade network in 2013. The three-letter codes in the figure represent the ISO-defined international standard country (region) codes.
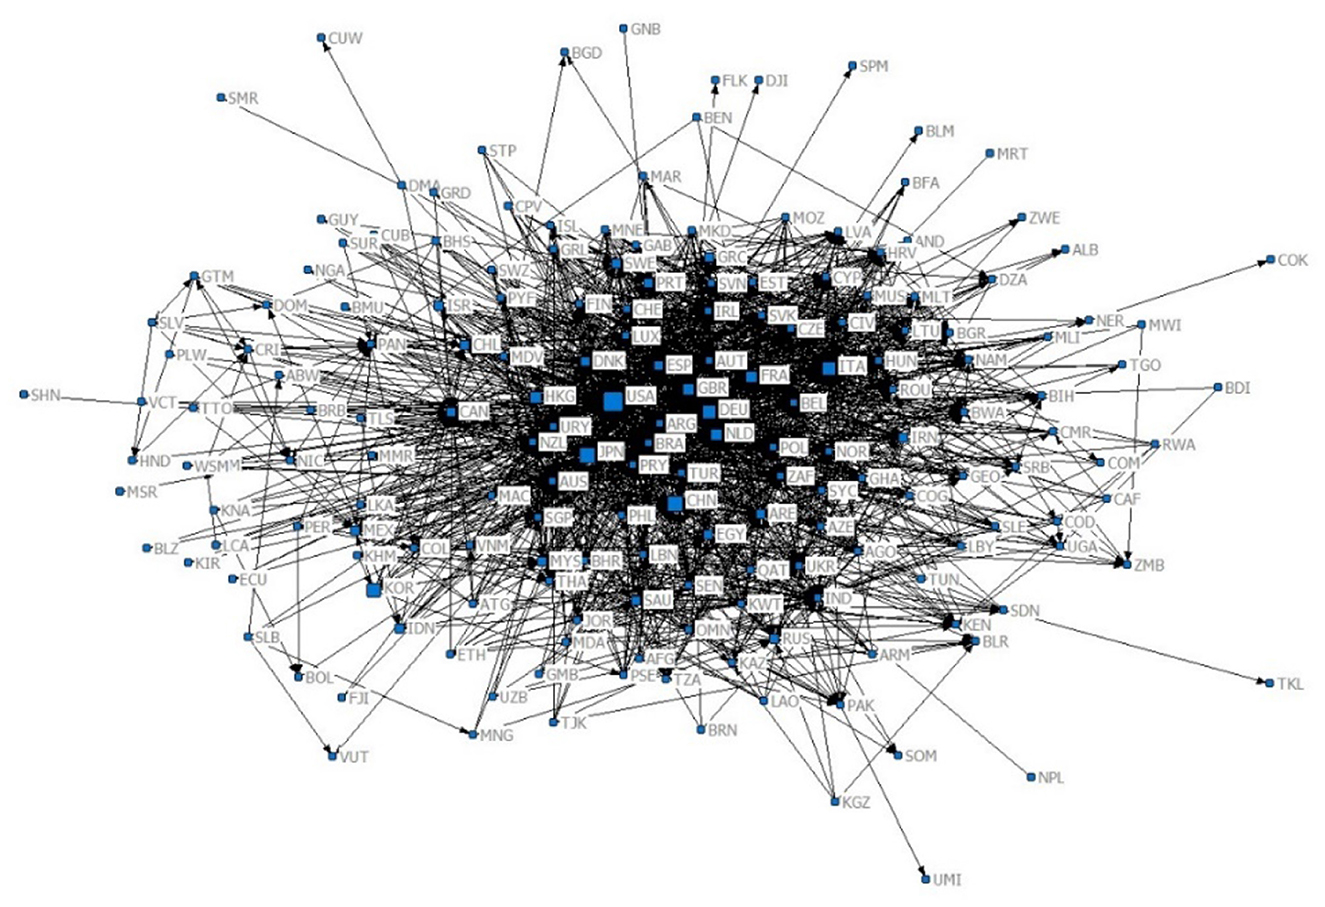
Figure 2. Global beef trade network in 2017.
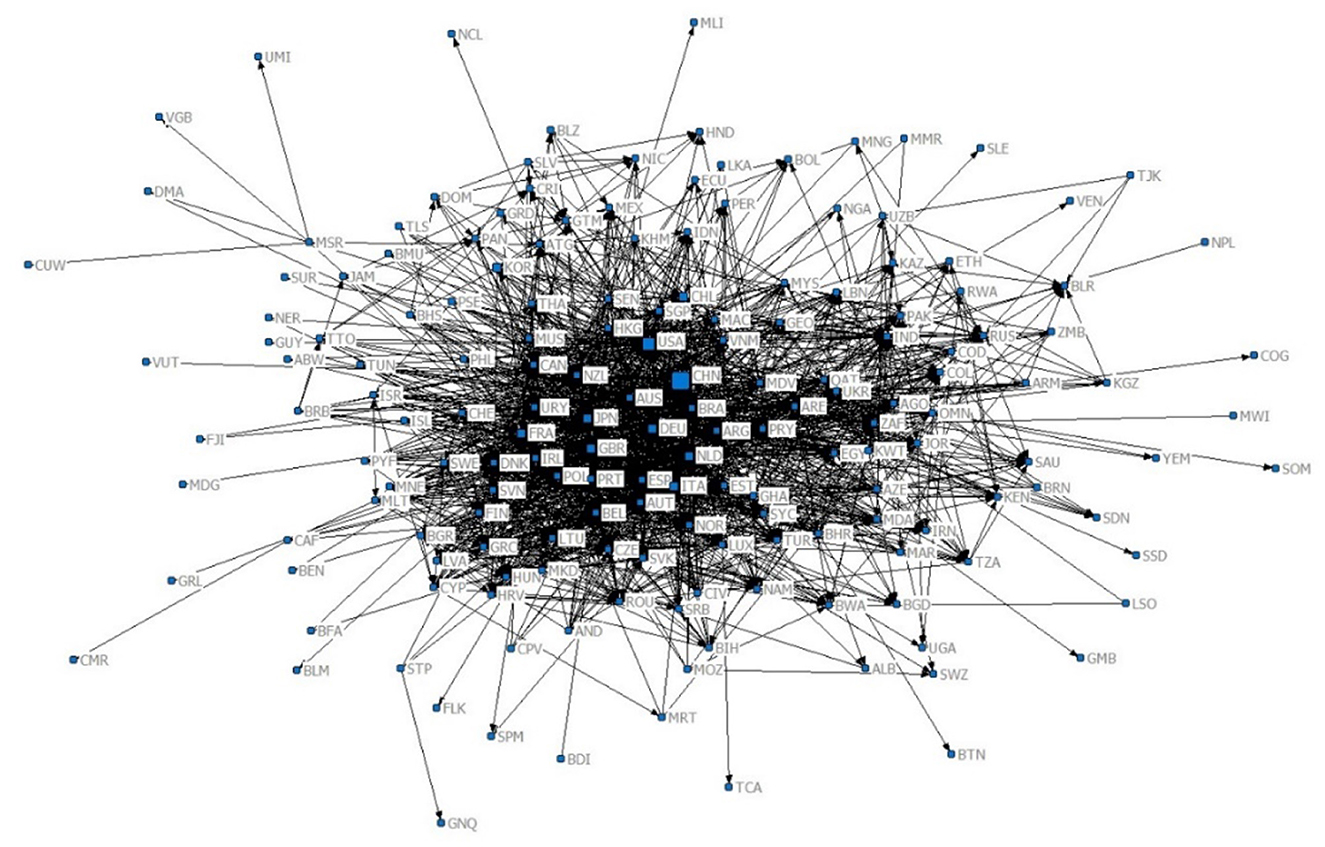
Figure 3. Global beef trade network in 2022.
3.2 Overall evolutionary characteristics of the global beef trade network
Understanding network connectivity and other structural characteristics is essential for analyzing the beef trade network. To simplify the analysis, this article employs an unweighted network that focuses solely on whether nodes are connected. The overall evolutionary characteristics of the global beef trade network are reflected using the four major topological indicators of the abovementioned complex networks.
As shown in Figures 4, 5, the average distance exhibited an overall decreasing trend from 2013 to 2022. It reached its lowest point in 2015, followed by a slight increase before declining again after 2019. This overall trend indicates that the connectivity of the beef trade network has increased over the past decade, enabling faster trade between countries or regions. Regarding network density, a significant overall upward trend is evident from 2013 to 2022, despite minor fluctuations during the period. This indicates closer and more interconnected relationships between countries in the global beef trade network. The network diameter decreased from 9 in 2013 to 6 in 2022, demonstrating higher connectivity and efficiency in the global beef trade. The average clustering coefficient showed some fluctuations over the 10 years, but generally exhibited an upward trend, suggesting a tendency toward forming tight trade clusters in the global beef trade network. Notably, possibly influenced by the COVID-19 pandemic, the year 2020 exhibited a higher network diameter and a lower average clustering coefficient.
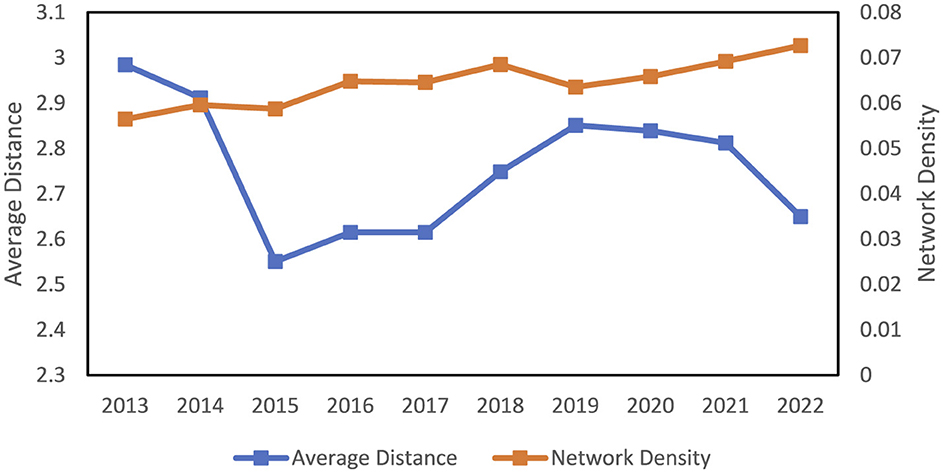
Figure 4. Evolution of average distance and network density.
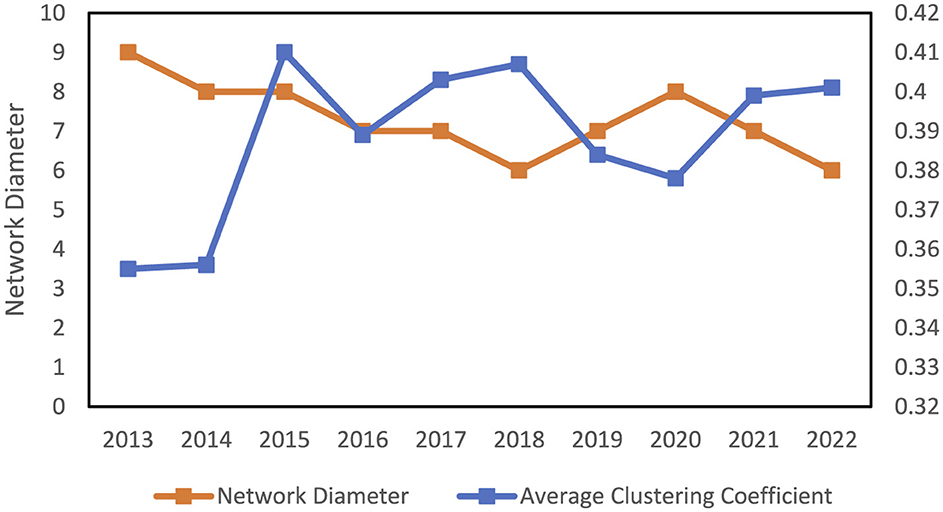
Figure 5. Evolution network diameter and average clustering coefficient.
3.3 Centrality of the global beef trade network
Centrality indicators reflect a country's position in the global beef trade. Out-degree and in-degree metrics indicate the number of countries with which a country engages in beef trade relations, without considering trade value. To more accurately capture the influence of weighted impacts, this article also utilizes out-strength and in-strength metrics in the weighted network, providing a more comprehensive evaluation of the global beef trade centrality. Table 1 lists the top 10 countries or regions based on centrality rankings for the year 2013. It can be seen that countries such as France, Germany, the United Arab Emirates, and the Netherlands ranked among the top for out-degree, indicating they had extensive beef import trade relationships with a large number of other countries. From the perspective of in-degree, the leading positions were mainly occupied by beef-producing countries such as the United States, Australia, New Zealand, and Brazil, suggesting their roles as preferred beef import sources for other countries or regions.
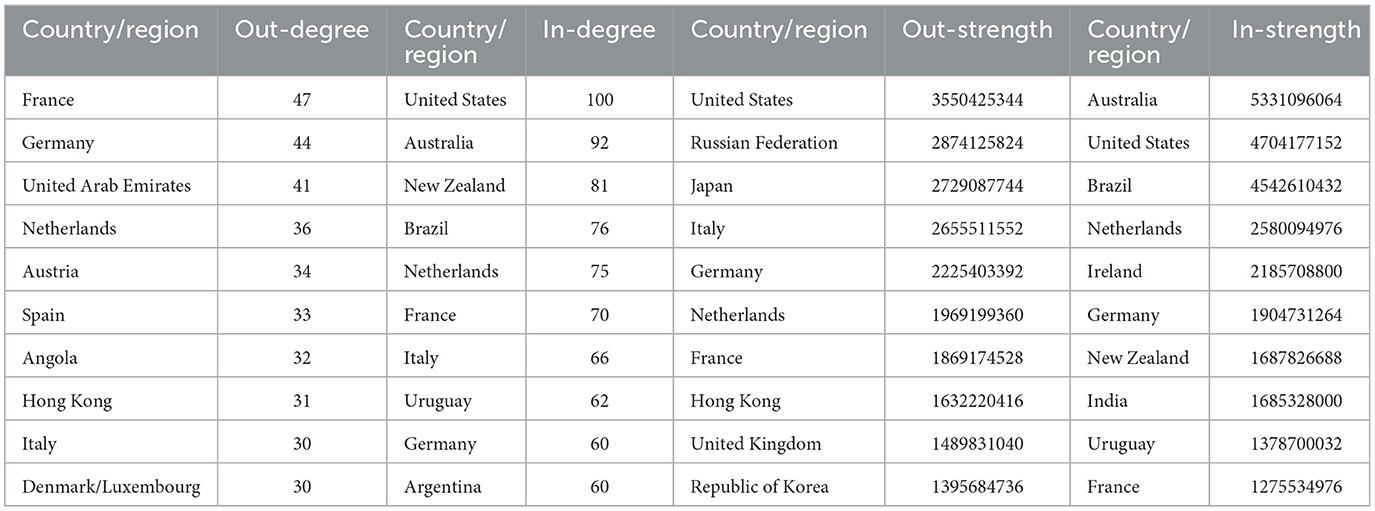
Table 1. The top 10 countries (regions) ranked by node centrality in 2013.
In terms of out-strength, significant changes were observed compared to out-degree rankings. This indicates that the most influential beef-importing countries or regions may vary when trade value weights are considered. Notably, some countries or regions such as the Hong Kong Special Administrative Region of China, emerged as major beef importers in both unweighted and weighted networks. This demonstrates that they not only maintain extensive import connections with a large number of countries or regions but also import substantial trade volumes. However, the countries or regions that ranked in the top 10 for both in-strength and in-degree remain largely unchanged, with only slight variations in their rankings, showing that these countries or regions consistently serve as important beef import sources regardless of whether trade values are considered.
As shown in Table 2, compared to 2013, the rankings of the top 10 countries or regions for out-degree and in-degree in 2017 changed very little, remaining relatively stable. Specifically, for the out-degree indicator, beef-importing countries or regions were still dominated by countries such as Germany, France, and the Netherlands. For the in-degree indicator, the main sources of beef imports continued to be led by the United States, Australia, and New Zealand, among others. In the weighted network, compared to 2013, the Russian Federation dropped out of the top 10 in terms of out-strength, while China surged from outside the top 10 in 2013 to third place, indicating a rapid increase in China's import value and its rising import status. for in-strength, Germany and France dropped out of the top 10 rankings, while Canada and Poland entered the top 10, becoming important sources of beef imports.
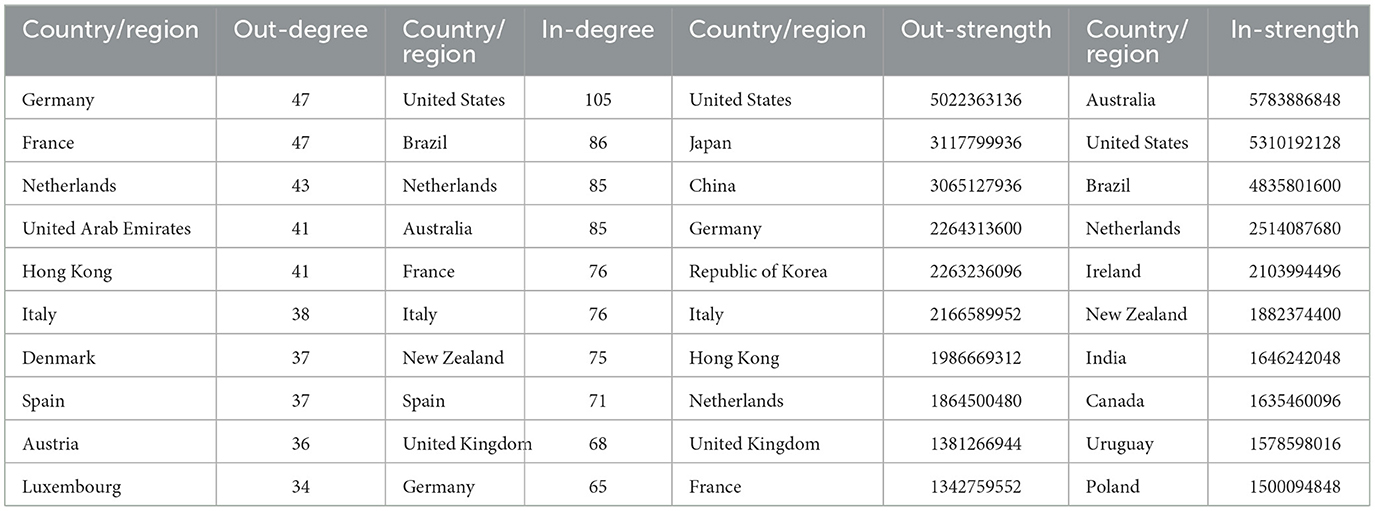
Table 2. The top 10 countries (regions) ranked by node centrality in 2017.
From Table 3, it can be seen that for the unweighted network, a significant change in 2022 compared to 2013 and 2017 was that Maldives was ranked first with an out degree of 57. This indicates that the Maldives imported beef from 57 different countries or regions, highlighting a new feature of diversity in import sources. Meanwhile, the top ten in-degree rankings remained relatively stable. For the weighted network, in 2022 compared to 2013 and 2017, China ranked first in terms of out-strength, indicating that China became the largest beef importer globally. In terms of in-strength, Brazil has become the world's largest beef exporter. Additionally, it is noteworthy that the United States occupies a central position in beef trade regardless of imports and exports.
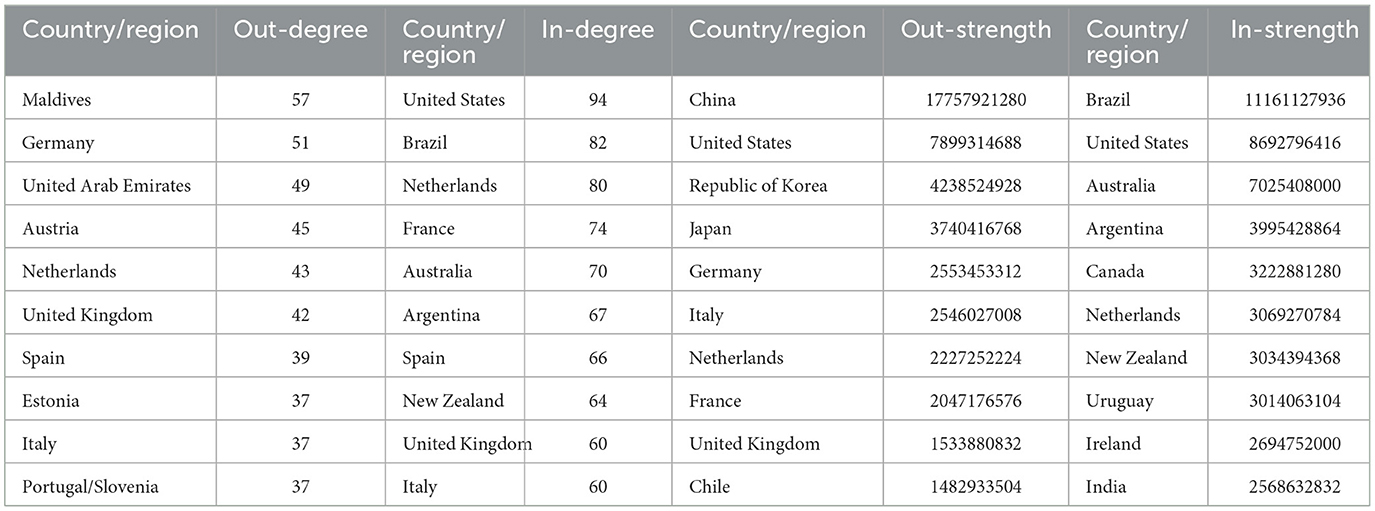
Table 3. The top 10 countries (regions) ranked by node centrality in 2022.
3.4 Block modeling analysis of the global beef trade network
Block modeling is an effective method for identifying the positional roles of nodes within a network. This study primarily focuses on analyzing the overall structure and connection relationships of the network. Therefore, an unweighted network is employed to explore its organizational structure. Based on the R-squared values, this article selects a max depth of splits of 3 and convergence criteria of 0.2, dividing the global beef trade network into 8 blocks. The number of countries or regions included in each block is summarized in Table 4.
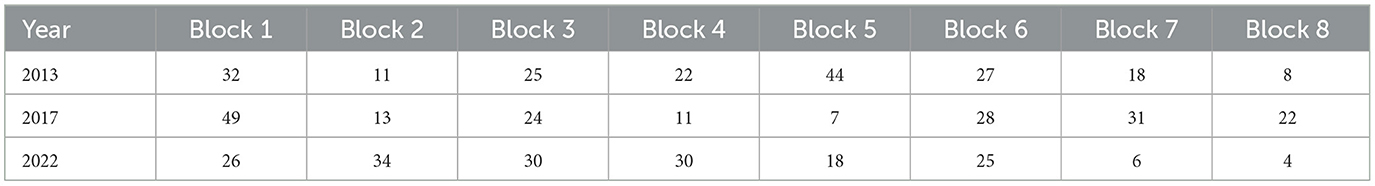
Table 4. The number of countries (regions) in each block.
In 2013, Block 1 included countries or regions such as the Bahamas and Panama. Many countries or regions within this block were located in the Caribbean and Central America, with many being small island nations. Block 2 comprised countries or regions such as the Democratic Republic of the Congo and Honduras, which were distributed across multiple continents. Most of these regions exhibited relatively small economies. Block 3 included countries or regions like Saudi Arabia and Yemen, which were primarily located in the Middle East, Africa, South Asia, and Southeast Asia. Block 4 encompassed countries or regions such as China, Indonesia, and Fiji, primarily distributed across Asia and Oceania. Block 5 was composed of countries or regions such as Finland and Poland, predominantly located in Europe with higher levels of economic development. Block 6 predominantly consisted of countries in Africa, such as Zimbabwe and Niger. Block 7 featured agriculturally advanced countries or regions such as the United States, New Zealand, Australia, and Brazil, which played significant roles in global agriculture and livestock industries. Block 8 comprised countries or regions such as Lesotho and Malawi, mainly located in Africa, where agriculture played a significant role in their economies.
The blocks in 2017 were formed by reorganizing the blocks from 2013. Specifically, Block 1 and Block 2 in 2017 were mainly composed of countries or regions from Blocks 3 and 4 in 2013. Block 3 in 2017 was primarily derived from countries or regions originally part of Blocks 1 and 4 in 2013. Block 4 mainly consisted of countries or regions from Blocks 1 and 2 in 2013. Block 5 was composed of countries or regions scattered across Blocks 3, 5, and 6 in 2013. Blocks 6, 7, and 8 were primarily formed from countries or regions originally in Blocks 7, 5, and 6 in 2013, respectively. Additionally, some blocks included newly added countries or regions.
In comparison to 2017, the changes in the blocks in 2022 were as follows: the main countries or regions in Block 1 originated from Block 1, Block 3, and Block 4 in 2017. Block 2 mainly included countries or regions from Block 1 and Block 2 in 2017. Block 3 was primarily composed of countries or regions from Block 1, Block 7, and Block 8 in 2017. Block 4 and Block 6 were mainly derived from Block 7 and Block 6 in 2017, respectively. The countries or regions in Block 5, Block 7, and Block 8 were scattered across various blocks from 2017.
To investigate the relationships between different blocks, this article presents the density matrix of the global beef trade network (Table 5). The values on the diagonal of the matrix indicate the degree of intra-block relationships, with higher values indicating tighter internal relationships within the block. The off-diagonal values represent the relationship degree between two blocks, with higher numbers indicating closer inter-block relationships. As shown in Table 5, there were significant differences in the degree of closeness both within and between each block.
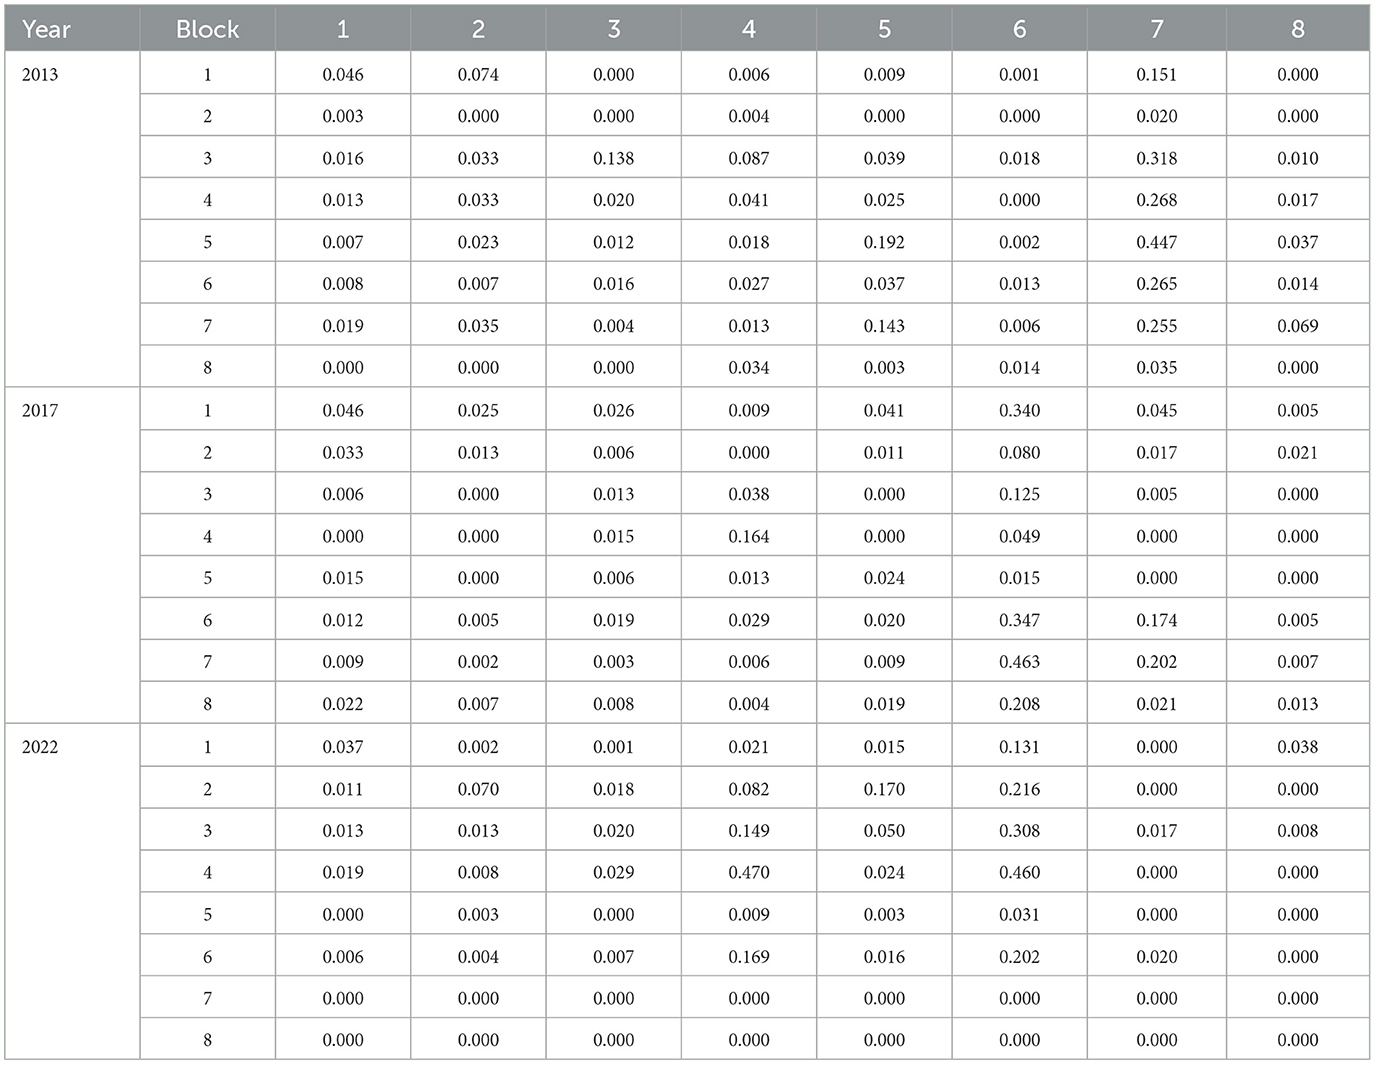
Table 5. Density matrix of the global beef trade network.
To further clarify the relationships among the blocks, an image matrix is derived from the density matrix. Specifically, if the density matrix value is greater than the beef trade network density in the current year, it is assigned a value of 1 in the image matrix; otherwise, it is 0. The image matrix for the 3 years is presented in Table 6.
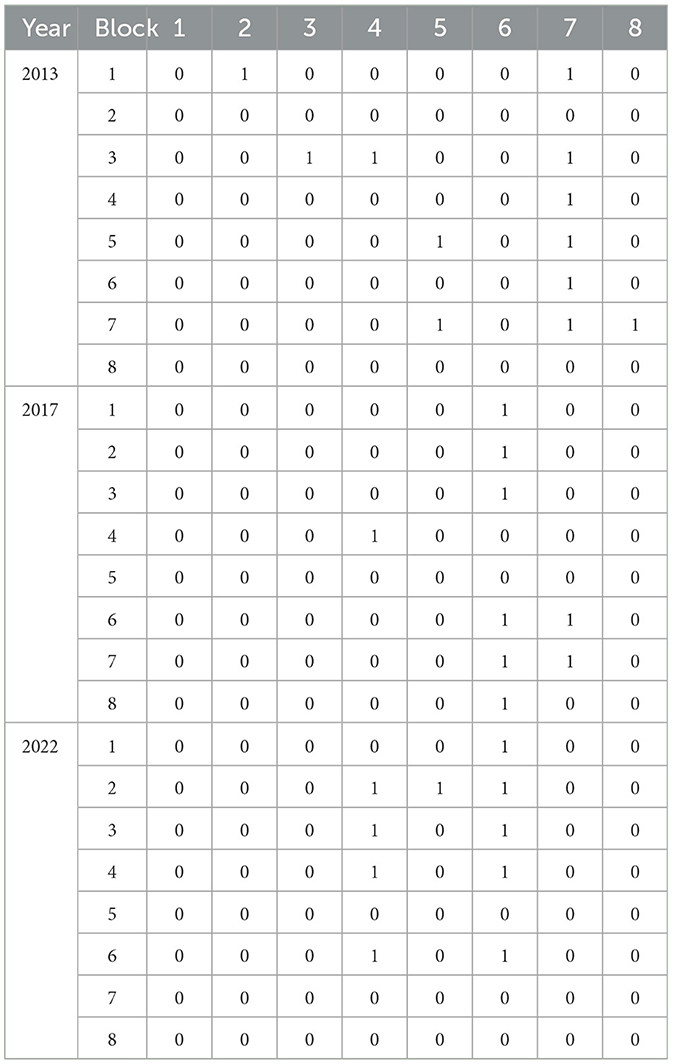
Table 6. Image matrix of the global beef trade network.
In addition, a simplified diagram (Figure 6) visually depicts the inter-block relationships. The results showed that in 2013, Block 7 occupied a central position in the beef trade network, establishing close trade relationships with all other blocks except Block 2. Most of the blocks were oriented toward Block 7, indicating that Block 7 had become a major source of beef imports. Moreover, Block 7 exhibited significant internal characteristics, suggesting frequent beef trade activities among the countries within this block. The other seven blocks displayed independent or marginal roles, with close trade relationships established only between one or two other blocks. Blocks 3 and 5 also exhibited strong internal characteristics.
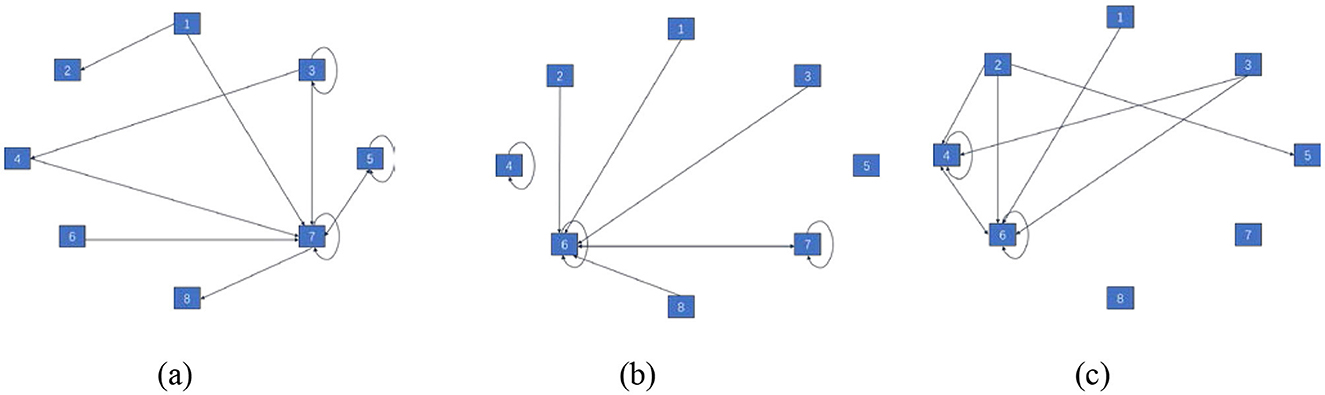
Figure 6. Diagram of simplified relationships between blocks. (A) 2013. (B) 2017. (C) 2022.
By 2017, the structure of the blocks had shifted to center around Block 6. The previous analysis showed that most of the countries or regions in Block 6 in 2017 originated from Block 7 in 2013. This indicated that the beef network group composed of countries like Brazil, the United States, and New Zealand played a key role in the global beef network, establishing close connections with multiple blocks (Blocks 1, 2, 3, 7, and 8). Additionally, Block 4 displayed internal characteristics, with frequent trade activities occurring primarily within the block. Block 5 remained isolated, showing no significant beef trade relationships either with other blocks or internally.
The block modeling for 2022 exhibited a dual-core structure, with Block 4 (comprising countries such as Canada, China, and the United Kingdom) and Block 6 (comprising countries such as Brazil, the United States, and New Zealand) playing crucial bridging roles in the global beef trade network. The relationships among the other blocks were relatively loose, with Blocks 7 and 8 being particularly isolated and playing peripheral roles within the network.
The evolution of the block modeling from 2013 to 2022 reveals that the global beef trade network has transitioned from full participation of all blocks in 2013, to a structure with one isolated block in 2017, and finally to a structure with two isolated blocks in 2022. This indicates an increasing trend toward regionalization and group formation in global beef trade.
4 Conclusion and discussion
The application of complex network theory in international trade effectively reveals both the global and local characteristics of trade network systems, highlighting the interdependencies among various trade entities. This approach represents a significant advancement over traditional economics, which typically focuses on the analysis of individual countries (Cai and Song, 2016; Qiang et al., 2020).
Using global beef trade data from 2013 to 2022, this article constructs a global beef trade network and conducts an in-depth analysis of its evolution from three levels: overall, individual, and clustering.
From an overall perspective, the structure of the global beef trade network has become increasingly complex. Specifically, although the average distance fluctuated between 2013 and 2022, it showed an overall downward trend, with significant decreases during the periods of 2013–2015 and 2019–2022, indicating that the network has become more tightly connected with improved overall connectivity. Network density showed a steady upward trend, reflecting the participation of more countries or regions in the trade network and the increasing closeness of trade relationships. The network diameter decreased from 9 in 2013 to 6 in 2022, suggesting a gradual shortening of distances between the farthest nodes and reflecting enhanced tightness in the network. Furthermore, despite noticeable fluctuations, the average clustering coefficient showed an overall upward trend over the decade, indicating the formation of regional trade clusters and the strengthened localized trade relationships.
These changes in topological indicators reflect the combined influence of globalization, regional cooperation, trade policies, and social demand. Specifically, the increasing demand for beef in emerging markets has led major exporting countries to establish direct trade relationships with more partners. Simultaneously, advancements in modern logistics shortened trade paths, reducing average distance and network diameter while increasing network density. However, a phased increase in average distance during 2015–2019 may be related to global economic fluctuations and trade protectionism. For instance, Sino-US trade friction and adjustments in free trade policies by certain economies may have weakened some direct trade connections. Furthermore, the deepening of regional trade cooperation and the signing of several free trade agreements such as CPTPP and RCEP further strengthened regional ties, driving greater local network tightness. External shocks also had a significant impact on the network structure. For example, the COVID-19 pandemic in 2020 disrupted some trade relationships. However, as supply chains recovered, the network diameter rapidly shortened, demonstrating the resilience of the beef trade network.
From an individual perspective, this study uses degree centrality to measure the position and importance of countries or regions. In the unweighted network, which considers only the number of connections, the evolution of centrality in 2013, 2017 and 2022 showed that countries such as Germany, the United Arab Emirates, and the Netherlands ranked high in out-degree centrality. This highlights their role as key hubs for importing beef from a diverse range of trading partners. In contrast, countries with high in-degree rankings are concentrated in the United States, Australia, and Brazil, which have become significant sources of beef imports for many countries or regions. In the weighted network, which accounts for the value of import trade, significant changes occurred in the out-strength rankings. Countries such as the United States, Japan, and China demonstrate high out-strength centrality, highlighting their role as large-value importers, even though they maintain a limited number of trade partners. Notably, China's rapid expansion in beef imports over the decade has established it as the world's largest importer, significantly reshaping global trade patterns. This growth has been driven by the increasing demand for high-quality beef in China, supported by rising incomes and changes in dietary preferences. Meanwhile, countries such as Australia, Brazil, and New Zealand consistently rank high in in-strength centrality due to their abundant livestock resources and export-oriented production systems. These nations play a pivotal role in stabilizing the beef supply chain and meeting global demand.
From a clustering perspective, block modeling analysis for 2013, 2017, and 2022 reveals distinct trade blocks with varying levels of connectivity and influence. Blocks represented by countries such as Brazil, the United States, and New Zealand have consistently maintained central roles, reflecting their dominant positions in beef production and trade. These countries are characterized by their strong export capacities and stable trade relationships, and form the backbone of global beef trade. Blocks formed by countries such as Canada, China, and the United Kingdom have also gained prominence over time. However, the growing number of isolated blocks reflects fragmented trade integration in certain regions, particularly in parts of Africa, where infrastructural and technological challenges limit participation in global trade. Consequently, the global beef trade network has evolved into a regionalized and clustered competitive structure.
The analysis of the global beef trade network reveals the evolution of trade patterns, enabling countries and regions to better understand their positions within the global beef trade and identify their competitive strengths and weaknesses. In addition, specific recommendations tailored to different countries and regions are essential for promoting the healthy and sustainable development of global beef trade. First, under the current trend of increasing connectivity in the beef trade network, core exporting countries such as Australia and Brazil should enhance cold chain logistics and infrastructure to ensure the stability of exports. Meanwhile, these countries could actively explore emerging international markets to improve supply chain resilience. Furthermore, with the rising demand for premium and environmentally friendly beef, major exporters must adopt sustainable technologies to reduce the environmental impact of production, aligning with global demand for green products. Second, for major importing countries such as China and Japan, efforts should focus on diversifying supply sources and strengthening regional cooperation to mitigate supply chain disruption risks. Additionally, these countries need to establish and enhance beef reserves to safeguard food security during supply chain interruptions. Third, for emerging and peripheral countries and regions, international technical assistance and infrastructure investments are essential to enhance their participation in the global beef trade network. Fourth, countries and regions within regional trade clusters should optimize internal trade policies to boost external market competitiveness, thereby improving overall network connectivity and resilience. The research in this article still has the limitation of not considering the impact of crises on the international beef trade network and their propagation processes, which will serve as a direction for future research.
Data availability statement
The original contributions presented in the study are included in the article/supplementary material, further inquiries can be directed to the corresponding authors.
Author contributions
QW: Writing – original draft, Conceptualization, Formal analysis, Funding acquisition, Methodology. WX: Conceptualization, Formal analysis, Funding acquisition, Investigation, Writing – original draft. RC: Data curation, Validation, Writing – review & editing.
Funding
The author(s) declare financial support was received for the research, authorship, and/or publication of this article. This research was funded by Humanities and Social Sciences Youth Fundation, Ministry of Education of China, grant number 23YJC790138.
Conflict of interest
The authors declare that the research was conducted in the absence of any commercial or financial relationships that could be construed as a potential conflict of interest.
Publisher's note
All claims expressed in this article are solely those of the authors and do not necessarily represent those of their affiliated organizations, or those of the publisher, the editors and the reviewers. Any product that may be evaluated in this article, or claim that may be made by its manufacturer, is not guaranteed or endorsed by the publisher.
References
An, Q., Wang, L., Qu, D., and Zhang, Z. (2018). Dependency network of international oil trade before and after oil price drop. Energy 165, 1021–1033. doi: 10.1016/j.energy.2018.09.098
Anderson, D., Kerr, W. A., Sanchez, G., and Ochoa, R. (2002). “Cattle/beef subsector's structure and competition under free trade,” in Structural Changes as a Source of Trade Disputes Under NAFTA, eds. R. A. Loyns, K. Meilke, R. D. Knutson and A. Yunez-Naude (Al-tona: Texas A & M University, University of Guelph, and El Colegio de Mexico), 231–258.
Bai, Z., Liu, C., Wang, H., and Li, C. (2023). Evolution characteristics and influencing factors of global dairy trade. Sustainability 15, 931. doi: 10.3390/su15020931
Batarseh, F., Gopinath, M., Nalluru, G., and Beckman, J. (2019). Application of machine learning in forecasting international trade trends. arXiv [Preprint]. arXiv:1910.03112. doi: 10.48550/arXiv.1910.03112
Bindon, B. M., and Jones, N. M. (2001). Cattle supply, production systems and markets for Australian beef. Aust. J. Exp. Agric. 41, 861–877. doi: 10.1071/EA01052
Breiger, R. L., Boorman, S. A., and Arabie, P. (1975). An algorithm for clustering relational data with applications to social network analysis and comparison with multidimensional scaling. J. Math. Psychol. 12, 328–383. doi: 10.1016/0022-2496(75)90028-0
Cai, H., and Song, Y. (2016). The state's position in international agricultural commodity trade. China Agric. Econ. Rev. 8, 430–442. doi: 10.1108/CAER-02-2016-0032
Caro, D., LoPresti, A., Davis, S. J., Bastianoni, S., and Caldeira, K. (2014). CH4 and N2O emissions embodied in international trade of meat. Environ. Res. Lett. 9:114005. doi: 10.1088/1748-9326/9/11/114005
Chen, K., Huang, T., Zhang, X., Liu, X., Jian, X., Zhugu, R., et al. (2022). Drivers of global methane emissions embodied in international beef trade. Environ. Sci. Technol. 56, 11256–11265. doi: 10.1021/acs.est.2c03509
Costa, L. D. F., Rodrigues, F. A., Travieso, G., and Villas Boas, P. R. (2007). Characterization of complex networks: a survey of measurements. Adv. Phys. 56, 167–242. doi: 10.1080/00018730601170527
Darbandi, E., Radmehr, R., and Saghaian, S. H. (2021). The impact of consumer beef safety awareness on US beef exports. Int. Trade J. 35, 135–156. doi: 10.1080/08853908.2020.1742255
de Waroux, Y. L. P., Garrett, R. D., Graesser, J., Nolte, C., White, C., and Lambin, E. F. (2019). The restructuring of South American soy and beef production and trade under changing environmental regulations. World Dev. 121, 188–202. doi: 10.1016/j.worlddev.2017.05.034
Fagiolo, G., Reyes, J., and Schiavo, S. (2009). World-trade web: topological properties, dynamics, and evolution. Phys. Rev. E. 79:036115. doi: 10.1103/PhysRevE.79.036115
Fan, T., Li, H., Ren, X. L., Xu, S., Gou, Y., and Lü, L. (2021). The rise and fall of countries on world trade web: a network perspective. Int. J. Mod. Phys. C. 32:2150121. doi: 10.1142/S0129183121501217
Fan, Y., Ren, S., Cai, H., and Cui, X. (2014). The state's role and position in international trade: a complex network perspective. Econ. Model. 39, 71–81. doi: 10.1016/j.econmod.2014.02.027
Fields, K. H., Therrien, D. A., Halstrom, D., Haggard, J., and Clayton, P. (2018). International beef trade: a value proposition. Anim. Front. 8, 16–22. doi: 10.1093/af/vfy013
Freeman, L. C. (1979). Centrality in social networks conceptual clarification. Soc. Netw. 1, 215–239. doi: 10.1016/0378-8733(78)90021-7
Godfray, H. C. J., Aveyard, P., Garnett, T., Hall, J. W., Key, T. J., Lorimer, J., et al. (2018). Meat consumption, health, and the environment. Science 361:eaam5324. doi: 10.1126/science.aam5324
Hao, X., An, H., Sun, X., and Zhong, W. (2018). The import competition relationship and intensity in the international iron ore trade: from network perspective. Resour. Policy 57, 45–54. doi: 10.1016/j.resourpol.2018.01.005
Hou, W., Liu, H., Wang, H., and Wu, F. (2018). Structure and patterns of the international rare earths trade: a complex network analysis. Resour. Policy 55, 133–142. doi: 10.1016/j.resourpol.2017.11.008
Jeong, S., Munisamy, G., Kulkarni, A., and Batarseh, F. (2024). Deploying machine learning methods to predict global trade patterns: the case of beef. J. ASABE 67, 219–232. doi: 10.13031/ja.15619
Kibona, C. A., Yuejie, Z., and Tian, L. (2022). Towards developing a beef meat export-oriented policy in Tanzania: exploring the factors that influence beef meat exports. PLoS ONE 17:e0270146. doi: 10.1371/journal.pone.0270146
Li, X., Jin, Y. Y., and Chen, G. (2003). Complexity and synchronization of the world trade web. Physica A. 328, 287–296. doi: 10.1016/S0378-4371(03)00567-3
Pagani, G. A., and Aiello, M. (2013). The power grid as a complex network: a survey. Physica A. 392, 2688–2700. doi: 10.1016/j.physa.2013.01.023
Qiang, W., Niu, S., Wang, X., Zhang, C., Liu, A., and Cheng, S. (2020). Evolution of the global agricultural trade network and policy implications for China. Sustainability 12:192. doi: 10.3390/su12010192
Reeves, G. W., and Hayman, A. H. (1975). Demand and supply forces in the world beef market. Q. Rev. Rural Econ. 28, 121–151.
Serrano, M. A., and Boguñá, M. (2003). Topology of the world trade web. Phys. Rev. E. 68:015101. doi: 10.1103/PhysRevE.68.015101
UN Comtrade Database (2024). Available at: https://comtradeplus.un.org/ (accessed May 21, 2024).
Wang, C., Huang, X., Hu, X., Zhao, L., Liu, C., and Ghadimi, P. (2021). Trade characteristics, competition patterns and COVID-19 related shock propagation in the global solar photovoltaic cell trade. Appl. Energy 290:116744. doi: 10.1016/j.apenergy.2021.116744
Webb, M., Gibson, J., and Strutt, A. (2018). The impact of diseases on international beef trade: market switching and persistent effects. Food Policy 75, 93–108. doi: 10.1016/j.foodpol.2018.01.006
White, H. C., Boorman, S. A., and Breiger, R. L. (1976). Social structure from multiple networks. I. Blockmodels of roles and positions. Am. J. Sociol. 81, 730–780. doi: 10.1086/226141
Keywords: global beef, trade network, complex network, patterns, sustainable development
Citation: Wang Q, Xu W and Cheng R (2025) Exploring the evolution of global beef trade network patterns based on complex network analysis. Front. Sustain. Food Syst. 9:1490578. doi: 10.3389/fsufs.2025.1490578
Received: 03 September 2024; Accepted: 02 January 2025;
Published: 24 January 2025.
Edited by:
Catherine Keske, University of California, Merced, United StatesReviewed by:
Hai Lin, China Agricultural University, ChinaYuquan Chen, China Agricultural University, China
Copyright © 2025 Wang, Xu and Cheng. This is an open-access article distributed under the terms of the Creative Commons Attribution License (CC BY). The use, distribution or reproduction in other forums is permitted, provided the original author(s) and the copyright owner(s) are credited and that the original publication in this journal is cited, in accordance with accepted academic practice. No use, distribution or reproduction is permitted which does not comply with these terms.
*Correspondence: Qianqian Wang, cWlhbnFpYW53YW5nQHpzdHUuZWR1LmNu; Wangfang Xu, MTE5MjIwMzNAemp1LmVkdS5jbg==