 Ayesha Siddiqa1,2*
 Adnan Khaliq1
 Tariq Mehmood1
 Muhammad Farhan J. Chughtai1
 Ana M. Sanchez-Migallon3
 Samreen Ahsan1
 Amanullah Sabir4*
 Isam A. Mohamed Ahmed5*
- 1Institute of Food Science and Technology, Khawaja Fareed University of Engineering and Information Technology, Rahim Yar Khan, Punjab, Pakistan
- 2School of Agriculture, Food and Ecosystem Sciences, Faculty of Science, The University of Melbourne, Parkville, VIC, Australia
- 3Department of Organic Chemistry, Faculty of Chemical Sciences and Technologies, University of Castilla La Mancha, Ciudad Real, Spain
- 4College of Food Science and Technology, Guangdong Ocean University, Zhanjiang, China
- 5Department of Food Sciences and Nutrition, College of Food and Agricultural Sciences, King Saud University, Riyadh, Saudi Arabia
Introduction: Tagetes erecta L. is a valuable medicinal plant and its edible flowers are a rich source of secondary metabolites that may vary at different blooming stages.
Objective: Current study aimed to evaluate the phytochemical profile of flowers at different blooming stages with varying treatments.
Methodology: Extracts were prepared by employing solvent extraction with ultra-sonification as pretreatment and by varying solvents to assess the phenolic and antioxidant activities. The high-performance liquid chromatography analysis was performed to quantify bioactive polyphenolics to validate effect of various stages and treatments on sample extracts.
Results: Study found that ultrasound-pretreated samples resulted higher yield and phenolic contents than solvent extraction (CSE) alone. The highest carotenoid content (427.39 mg/100 g) was observed for the pretreated full-bloom flower samples (MAF-1). Radical scavenging activities were observed highest (DPPH 96.19% and ABTS* 160.09 mmol TE/100 g) in Tagetes sample MAF-1 followed by MEF-1 and MAI-1. A highly significant and positive correlation was observed among all variables of phenolic and antioxidant assays. Various bioactive compounds including phenolic acids, flavonoids and carotenoids were quantified by HPLC-DAD. Results showed that the ultra-sonified extracts (MAF-1) resulted in higher gallic acid (109 mg/g), quercetin (11.74 mg/g), lutein (1.76 mg/g) and zeaxanthin (2.14 mg/g) followed by MEF-1 > MAI-1 > MEI-1.
Conclusion: The study results showed that the ultrasound-assisted extracts resulted in higher bioactive contents and antioxidant activities expected to deliver more value as additive to functional foods. It also reflects the potential of Tagetes flowers for the functional foods aiming to control early age-related disorders (ARDS).

Graphical Abstract.
1 Introduction
The demand and use of natural bioactive components in food are growing with increasing consumer knowledge and industrial development (Barut et al., 2022). Carotenoids, mainly xanthophylls, are bioactive components that have gained increasing commercial and consumer attention. It can be used as a nutritional supplement for food fortification and in the pharmaceutical sector due to its potential therapeutic effect (Chitrakar et al., 2019). Extensive research has been conducted to evaluate various edible flowers and plants. It has been recognized that Tagetes erecta (Marigold) flowers are not only safe but also rich in phytochemicals of a therapeutic nature. It is one of the significant, economic and industrial plants that is now largely cultivated for commercial purposes (Chitrakar et al., 2019; Vural et al., 2023). According to an estimation, a large quantity of marigold flowers is grown worldwide (600,000 tons) (Singh et al., 2020) and has numerous commercial applications (Wu et al., 2023). The global market demand for marigold lutein is also continuously increasing, which may increase to USD 357 million by 2022 (Ma, 2017) and is expected to reach USD 405 million by 2027 (Saha et al., 2020). This increasing demand is a major challenge; therefore, to meet this challenge, local sources need to be investigated and improvements in extraction methods are required to obtain better yields, reduce costs, and increase shelf stability for commercial applications. Among various species, Tagetes erecta L. is a commercially grown species and indigenous to Pakistan (Baig et al., 2021). Almost 40–50% of the flower consists of petals of various colors from light yellow to dark orange. Commonly identified bioactive compounds in marigolds are phenolics, flavonoids and carotenoids. Various databases reported different carotenoids in different marigold varieties includes; lutein, zeaxanthin, alpha-carotene, beta carotene, alpha cryptoxanthin, beta-cryptoxanthin (Rodrigues et al., 2019), and flavonoids including flavonols, flavanols, and flavones, mainly quercetin, qercetagetin, rutin, catechin, apigenin, acacetin, hesperidin, hesperetin, and patuletin etc. (Wu et al., 2023). These compounds give specific characteristics to marigold plants such as carotenoids, carotenes give color to marigold flowers, isothiocyanates contribute to the aroma while cyclotides are familiar as nutritious plant peptides.
Marigold flowers are a rich source of secondary metabolites that can be easily extracted and processed for commercial purposes. The significance of the proposed research is based on literature reporting that marigold extracts are rich in phytochemicals of therapeutic nature that play an important role as antioxidants (Kang et al., 2018), analgesic (Bashir and Gilani, 2008), anti-inflammatory (Chung et al., 2017), anti-viral (Siriamornpun et al., 2012), anti-clastogenic (Wang et al., 2006), anti-tumorigenic (Gansukh et al., 2019), cardioprotective (Madaan et al., 2017). Recent studies have reported that it contributes to human cognitive functions being accumulated in the brain and macula, which helps to control age-related macular degenerative disorders (Jia et al., 2017; Yang et al., 2020) and cataracts (Padmanabha and Vallikannan, 2018). Tagetes erecta L. is commercially important because of its bioactive components. Commercially available lutein is derived from the petals of marigold flowers (Kaimainen et al., 2015) and has approved GRAS (generally recognized as safe) status, as well as an EU-approved commercial food colorant and food additive (E161b) for utilization in food products (Weigel et al., 2018). The European Food Safety Authority (EFSA Panel on Food Contact Materials, Enzymes, Flavourings and Processing Aids (CEF), 2010) has recommended its daily allowance of 1 to 5 mg reported in EFSA (EFSA Panel on Food Contact Materials, Enzymes, Flavourings and Processing Aids (CEF), 2010), because it is not naturally synthesized in the body and therefore; must be incorporated through diet (Jivan and Abbasi, 2019) to fulfill dietary requirements (Madaan et al., 2017). Therefore, diets rich in functional components are warranted against numerous age-related disorders (Nwachukwu et al., 2016). Functional beverages are now becoming more popular owing to additional health benefits to control age-related disorders especially age-related macular degenerative disorders (AMDs) (Corbo et al., 2014). Natural beverages such as juices, are rich sources of nutrients and act as a contemporary vehicle for numerous bioactive compounds and their fortification may improve sensory attributes (Rodríguez-Roque et al., 2016). Carotenoids are highly recognized bioactive components that are widely employed in the development of functional beverages, mainly fruit juices, drinks and milk (Rodríguez Roque, 2014). Marigold supplementation into various food products including dairy products (milk, yogurt, ghee) (Bhat et al., 2022; Xavier et al., 2014), beverages (Rodríguez-Roque et al., 2016) and tea (Ma et al., 2020) has been confirmed to not only improved the sensory attributes and bioavailability of bioactive components but also exert positive health effects.
The primary objective of this study is to quantify the phenolics, carotenoid content, and antioxidant activities of marigold flowers at various stages of blooming from the start of the season to the end of the flowering time. In addition, research aimed to evaluate the comparison of employing ultrasound as pre-treatment and conventional solvent extraction by using different organic solvents. Ultrasonication is one of the advanced extraction techniques in which ultrasound radiations of specific intensity are applied to extract bioactive compounds from cell materials. Ultrasound assisted extraction for bioactive compounds is based on two stages; washing stage, a relatively fast stage in which the extraction solvent easily penetrates the cell and causes breakage of cell walls to free inbound components while in the second stage components leach down through porous cells solid to the solvent matrix. In this study, the ultrasonication process is employed due to its ability to break cell wall of plant material and facilitate the extraction of phenolic compounds and may resulted higher antioxidant activities in pre-treated (UAE) extracts (He et al., 2024). Furthermore, the antioxidant assays and quantification (HPLC) of marigold flowers will justify the possibility of supplementing phenolics and carotenoids enriched extract to develop functional juice to accomplish the RDA of lutein and provide critical future insights into their potential to be utilized in nutraceuticals and pharmaceutical food products.
2 Methodology
2.1 Sample collection and preparation
Marigold flowers were collected at various blooming stages (Initial, full bloom, late) (Annex 1) from the local nursery of KFUEIT, Rahim Yar Khan, Pakistan. The marigold flower species was verified by a horticulture expert from the Department of Horticulture, Agriculture Engineering and Sciences, Khwaja Fareed University of Engineering and Information Technology. The samples were dried in an air-based food dehydrator (Model No. DI-2400) under specific conditions (Temperature, 40°C, Time 3–4 h). Dried flower petals were ground to a fine powder (60 mesh size), labeled, and kept separately in air-tight polyethylene bags and stored at −18°C.
2.2 Moisture analysis
Marigold flower sample moisture analysis was performed according to the standard gravimetric method AOAC 925.10 (Association of Official Analytical Chemists, 2023). Marigold flower petals of all different stages were weighed (5 g) for the estimation of moisture content. All samples were subjected to a hot-air oven (Qualtex Universal Series, 2000) at 105 ± 5°C for approximately 24 h. After the complete removal of moisture, samples were cooled in a desiccator, and moisture content was measured by the following formula;
2.3 Extract preparation and purification
The extracts were prepared by mixing marigold flower powder samples of 5 g each into 50 mL of selected solvents; Ethanol (80%), Hexane (80%), and acetone (80%) (Surendranath et al., 2016), (Jalali-Jivan and Abbasi, 2020). In this method, samples were divided into six sets, three with pre-treatment and three without pre-treatment solvent extraction (Table 1). Extraction with pre-treatment as ultrasonification by using an Ultrasonifier (Branson, model Digital Sonifier 450) was performed by employing the optimal conditions (Amplitude 40%; Time: 5 min) reported by Shi et al. (2023). All the samples were carefully labeled and mixed with different solvents at a ratio of 1:10. After overnight incubation at room temperature (~25°C), the samples were stirred on a magnetic stirrer at 500 rpm in dim light. Samples were then filtered through Whatman filter paper No. 1 before being subjected to a rotary vacuum evaporator at 30°C for 10 min., and the concentrated extract was collected and pooled in Falcon tubes (50 mL).

Table 1. Sample treatment plan for extraction from marigold samples.
2.3.1 Purification
Marigold oleoresin was purified to remove solvent residues by alkali treatment with KOH (50%) and ethanol (80%) by mixing at 250 rpm at a specific temperature of 50°C for 15 min (Jalali Jivan and Abbasi, 2019). Subsequent phase separation was performed to separate the oil phase, from the pure extract (Manzoor et al., 2022). The samples were again centrifuged at 250 rpm for 5 min until two clear phases were obtained from which the orange colored liquid was collected and off-white solid coagulates were discarded.
2.4 Phytochemical analysis
2.4.1 Total carotenoids
The carotenoid content was measured using the method of Manivannan et al. (2021). For this purpose, marigold powder extracts were prepared by multiple re-extractions with a fresh solvent until the residues became colorless. After extraction, the oleoresin was subjected to rotary vacuum evaporation to separate the carotenoid pigments. Clear extracts were obtained and pooled to make up the volume and subjected to a spectrophotometer (Thermo Fisher Scientific, Waltham, MA, USA) at 450 nm for total carotenoid assessment. Carotenoid contents were calculated (Equation 1) and expressed in mg/100 g marigold dry powder weight.
A → Absorbance, DF → Dilution Factor, V → Volume of extract, C 1% → Concentration of 1% solution, A 1% → Absorbance of 1% solution.
2.4.2 Total phenolic content
The total phenolic content of T. erecta was measured using the reducing Folin Ciocalteu Reagent following the method of Manivannan et al. (2021). For this purpose, the sample extract (25 μL) was mixed with 25 μL of FC reagent +200 μL of water and allowed to stand for reaction (5 min at 25°C). Sodium carbonate solution (10% w:w) was prepared and 25 μL was added to the above reaction mixture, resulting in a blue color as the endpoint. Reaction samples were allowed to stand at 25°C for 60 min in the dark and then subjected to a UV–Vis spectrophotometer (Thermo Fisher Scientific, Waltham, MA, USA) for absorbance measurement at a wavelength of 765 nm against gallic acid standard concentration ranging from 0–200 μg/mL. TPC was calculated (Equation 2) and expressed as mg GAE/g of dry sample weight;
Where; C → Total content of Phenolic compounds, c → Concentration of Gallic acid (mg/L), V → Volume of extract, m → Weight of extract in gram.
2.4.3 Total flavonoid content
The total flavonoid content in marigold sample extracts was determined by employing the method adopted by Siriamornpun et al. (2012), marigold extract sample (80 μL) was mixed with an equal amount (80 μL) of sodium nitrite solution (50 g/L) and a 120 μL of 2% aluminum chloride The sample extract was then mixed with 120 μL of sodium acetate and incubated for 2.5 h. The reaction mixture was vortexed for proper mixing, and the absorbance was measured at 440 nm with standard Quercetin (0–50 μg/mL). The results for TFC were calculated (Equation 3) and are expressed in mg QE/g of dry weight.
Where; C → Concentration of Quercetin (mg/mL), V → Volume of Plant extract (mL), m → Weight of pure plant extract (g).
2.5 Antioxidant assays
2.5.1 DPPH (2,2-diphenyl-1-picrylhydrazyl) assay
Antioxidant assays of different marigold extracts were performed by measuring the DPPH radical scavenging activity, employed by Li et al. (2007), with slight modification in the method. Prepared extract samples at various concentrations from 50 to 100 μL aliquots were measured in labeled test tubes. The volume of aliquots was adjusted to 1,000 μL by using a methanol solution for the standard curve. 25 μL of sample extract was added into 275 μL of 0.1 mM DPPH (2 mg DPPH into 50 mL methanol) solution and was prepared and mixed well by shaking before incubation (dark cool place temp. 30°C for 30 min). As radical DPPH has the potential to capture hydrogen from the sample extract was indicated by its color transformation from purple to yellow. Samples were then subjected to UV–Vis spectrophotometer at a wavelength of 517 nm against the ascorbic acid standard curve (0–200 μg/mL). The absorbance was recorded to calculate (Equation 4) the free radical scavenging potential of the marigold extracts by using the following formula;
Where; Ac is the blank standard and As is the sample extract.
2.5.2 FRAP (ferric reducing antioxidant power) assay
The ferric ion−reducing antioxidant potential (FRAP) of Tagetes erecta was measured by the antioxidant activities measuring method employed by Duan et al. (2024). The FRAP reagent reaction mixture (dye) was prepared using 2,4,6 Tris(2-pyridyl)-s-triazine (10 mM), Ferric chloride (20 mM) and sodium acetate (300 mM) in 1:1:10. After reagent mix preparation, 20 μL marigold extract sample was mixed with 280 μL of FRAP dye solution and incubated in the dark for 10 min at 37°C. After incubation, absorbance was recorded at 593 nm using a UV-spectrophotometer. The standard curve for ferric ion reducing antioxidant potential was derived by varying the concentration of Trolox from 0 to 100 μg/mL and the results were obtained by applying linear regression Eq. model (Equation 5) and expressed as mmol of Trolox/g DW.
2.5.3 ABTS (2,2-azinobis-(3-ethylbenzthiazolin-6-sulfonic acid)) assay
The ABTS+ assay was performed to measure the radical scavenging potential of the marigold extract by following the method reported by Manzoor et al. (2022) with slight modifications reported by Ali et al. (2021). ABTS mix was prepared by mixing ABTS (7 mM) with potassium persulfate (140 mM) and the mixture was allowed to stand overnight at 22°C in the dark. The absorbance of ABTS+ stock solution was measured by subjecting dye at 734 nm (Abs 0.75 cm−1). Sample aliquots were mixed with 10 μL of extract and 290 μL of ABTS+ in a well plate (incubated for 06 min) before recording its absorbance against a standard curve of Trolox (0–500 μg/mL) at the same wavelength of 734 nm. The antioxidant activity of extracts was measured (Equation 6) in mmol of Trolox equivalent per gram (mmol TE/g) of dry powder using the following equation:
where; Y → represents the absorbance and X → mM of Trolox eq.
2.6 Chroma color analysis
The color of dried marigold flower samples at all three stages (full bloom, start and end season), and their extracts were analyzed by the colorimetric method (Gombač et al., 2021). Colorimetric values in CIELAB color coordinates; L*, a*, and b* were determined by using a chroma meter (Minolta Chroma meter CR-400). Chroma and Hue were calculated using the following Equation 7:
where; a* and b* indicate color directions; +a* → Red Direction, −a* → Green direction, b* → yellow direction. However, L* reflects the degree of lightness and darkness ranges from 0 to 100.
2.7 Quantification of marigold bioactive compounds through HPLC
Prior to quantification of bioactive compounds, marigold sample extracts (1 mL) prepared with ultrasonication were filtered (0.45 syringe filters), diluted with extraction solvent (1:10) and filled in HPLC vials (Shi et al., 2023). Quantification of targeted bioactive compounds of extract samples was carried out by following the standard method of Suleria et al. (2020). High performance liquid chromatography (HPLC, Waters Alliance system, 2690) equipped with a reversed phase column (Synergi Hydro-RP) of dimensions 4.6 × 250 mm with particle size 4 μm protected by guard column C18 ODS (Phenomenex, Torrance, CA, USA) and connected with a diode array detector (DAD Model 2,998, Waters). Binary mobile phase system consists of two mobile phases; Mobile Phase A [Milli-Q® H2O/acetonitrile (95:5)] and Mobile Phase B [Milli-Q® H2O/acetonitrile (50/50)]. Flow rate was set to 0.8 mL/min and injection volume was set to 25 μL and column was operated at room temperature 25°C. Detector wavelengths was set at 280, 320, 370 and 450 for data acquisition. Various compounds identification was achieved by comparing retention time (RT) and the absorption spectra of the peak with standards (Sigma-Aldrich, Castle Hill, NSW, Australia).
2.8 Development of functional drink
Based on phytochemical profiling purified ultrasound pre-treated samples from different flowering stages were selected for further supplementation. To develop a functional drink, considering the recommended dietary allowance of lutein, the purified extract was added in various concentrations to drinks (Table 2). The drink was further evaluated for sensory characteristics, quality, and stability during the product storage study.

Table 2. Treatment plan for supplementation of purified extract in drink.
2.8.1 Sensory analysis
Supplementation of marigold powder extract was done with varying levels of supplementation. The treatment plan varies between 0 and 10 mg supplementation of purified extract in juice as follows; T0 → 0 mg, T1 → 1 mg, T2 → 5 mg, T3 → 10 mg. Sensory profile evaluation was performed using the 9-point hedonic scale (1–9) to assess sensory characteristics, including; color, taste, flavor, appearance, and total acceptability. Sensory evaluation was performed by trained panelists (10 food professionals) and consumers (40) of different age groups (18–50 years), selected randomly from the Institute of Food Science and Technology, KFUEIT, RYK, Pakistan. The samples were coded and randomly placed in sensory booths. Fifty milliliters of each treatment drink were presented to panel members and observations were recorded on Sensory Performa.
2.9 Statistical analysis
All experiments were performed in triplicate by using a randomized complete block design (RCBD). Solvents and marigold flowering stages were considered distinct factors, whereas the parameters evaluated were treated as dependent factors. Analysis of variance (ANOVA) and mean comparison test (LSD) was performed using the SPSS program (Package version 28.0.1, 2021). Mean values are presented as standard deviation (± SD). Correlation analysis was carried out to determine the association among various variables, while principal component analysis (PCA) was performed to understand variability using the XLSTAT 2023 package.
3 Results and discussion
3.1 Moisture analysis
The moisture content of the marigold flower samples was measured at various blooming stages (Figure 1). Freshly procured flowers at each stage were subjected to moisture analysis to assess the moisture percentage. The moisture percentage in late-bloom samples was naturally lower (60.02%) than that of the highest (80.85%) for fresh full-bloom flowers followed by the initial stage (75.55%). Several factors can significantly affect the moisture content of edible flowers, such as growth or environmental conditions, maturity stage, harvest or post-harvest conditions, and drying methods (Bhave et al., 2020). Loss of moisture may be a result of environmental conditions such as temperature, which increases up to 40°C until the late season. The trend of higher moisture content in spring samples and lower moisture content in the off-season is supported by previous research conducted by Arefin et al. (2015).

Figure 1. Moisture percentage of flower samples at various blooming stages.
3.2 Extraction yield
Current research has focused on improving extraction from marigolds by employing various solvents at various blooming stages to obtain the maximum extract yield. The extraction methods were also varied by employing assisted ultrasound treatment. It has been observed that the solvent’s nature, including solubility, dissolution strength, safety, cost effectiveness, and environmental safety, play important roles in extraction efficiency. The extraction results from marigold flowers showed highly significant differences in terms of marigold extract (oleoresin) at different flowering stages with different solvents employed for extraction, and extraction methods (Table 3). Furthermore, the two-way interactions between flowering stage × solvents, flowering stage × UAE, and solvent × pre-treatment method also showed highly significant differences (p < 0.05). Similarly, highly significant differences were observed in the case of the three-way interaction among flowering times × solvents × pre-treatment techniques. The maximum extract yield was observed in pre-treated full bloom flower extracts (MAF-1: 24.26 mg/g) followed by ultrasound-assisted ethanol based extracts of full bloom sample (MEF-1: 17.66 mg/g) while the lowest yield was recorded for late season flower samples extracted with hexane with CSE (MHL-2: 5.22 mg/g). The solvent extraction efficiency is determined by the polarity of the extracted compounds, which is referred to as the extraction power of the solvent (Essien et al., 2020). Apart from the polarity concept of solvents, yield also depends on extraction conditions such as time, temperature and assisted treatments (Manzoor et al., 2022; Moomin et al., 2023). Higher yields of acetone are also supported by previous research, which reported that it is an efficient solvent that has substantial potential to extract carotenoids from marigolds (Surendranath et al., 2016). Thus, the presented results showed that the maximum extraction yield could be obtained using flowers acquired at full bloom and with the ultrasound-assisted extraction (UAE) method as compared to conventional solvent extraction. The results also showed that among the various solvents employed for extraction, acetone yields higher for various growth stages compared to other solvents due to its polarity and efficiency in extracting polyphenolic compounds (Subbiah et al., 2020).

Table 3. Extract yield at various blooming stages with varying solvents and methods.
In another research study, marigold lutein extract yield was observed higher with acetone, i.e., 15–20 mg/g per gram of dry marigold petal powder (Jalali-Jivan and Abbasi, 2020). Evidence suggests that acetone is not only recognized for its higher yield, but is also considered a safe, green, and environmentally friendly solvent for use in the food and pharmaceutical industries (Jalali-Jivan et al., 2021). The obtained results of average yield are also supported by a recent research database that compared conventional solvent and ultrasound-assisted extraction and confirmed that the ultrasound-assisted extraction yield was higher (21.23 mg/g) than that of conventional solvent extraction (Manzoor et al., 2022). Current research has confirmed that pre-treatments like ultrasonication improve the extraction of bioactive components like phenolics, and carotenoids like lutein and their retention during storage (Sowbhagya et al., 2013).
3.3 Phytochemical screening of marigold extracts
Evidence confirms that the phytochemical profile of extracts can vary based on factors such as the part of the plant being used, its growth conditions, maturity stage at the time of harvest, extraction method, and the type of solvent used for extraction (Youssef et al., 2020). Based on the literature and extraction results, the pre-treated samples were further employed for the phytochemical analysis of marigold extracts.
3.3.1 Total carotenoids content
Total carotenoid content in various extracts ranged between 263.11 and 427.39 mg per 100 grams (Table 4). The extract results showed that the maximum carotenoid content was recorded for MAF-1 (427.39 mg/100 g) followed by MHF-1 (375.76 mg/100 g) in full bloom marigold flower samples of peak season. In contrast to full bloom, total carotenoids of initial stage samples were observed higher in MAI-1 (354.49 mg/100 g) followed by MEI-1 (338.11 mg/100 g). However, the lowest carotenoid content was observed in hexane extracts of marigold flower samples of the end season (MHL-1: 263.11 mg/100 g). Late-season flower samples resulted in lower carotenoid content and presented a lower chroma index representing lower chroma index, as flower color is considered an important indicator of carotenoids that may be affected by environmental conditions. Literature reported that carotenoid content may vary depending on the genotype (Akshaya et al., 2017), variety, part of the plant, and level of maturity (Duan et al., 2024). It also depends on the plant source, processing, preservation, storage conditions (heat), and forms (powder, concentrates, extracts, etc.) (Šivel et al., 2014). Among the carotenoids, lutein, zeaxanthin and cryptoxanthin are reported as significant contributors to color pigmentation in marigold flower petals. Marigold flowers of dark color and more petals are found to have high carotenoid content (Akshaya et al., 2017) and are suitable for xanthophylls’ extraction and exploitation for commercial food applications.
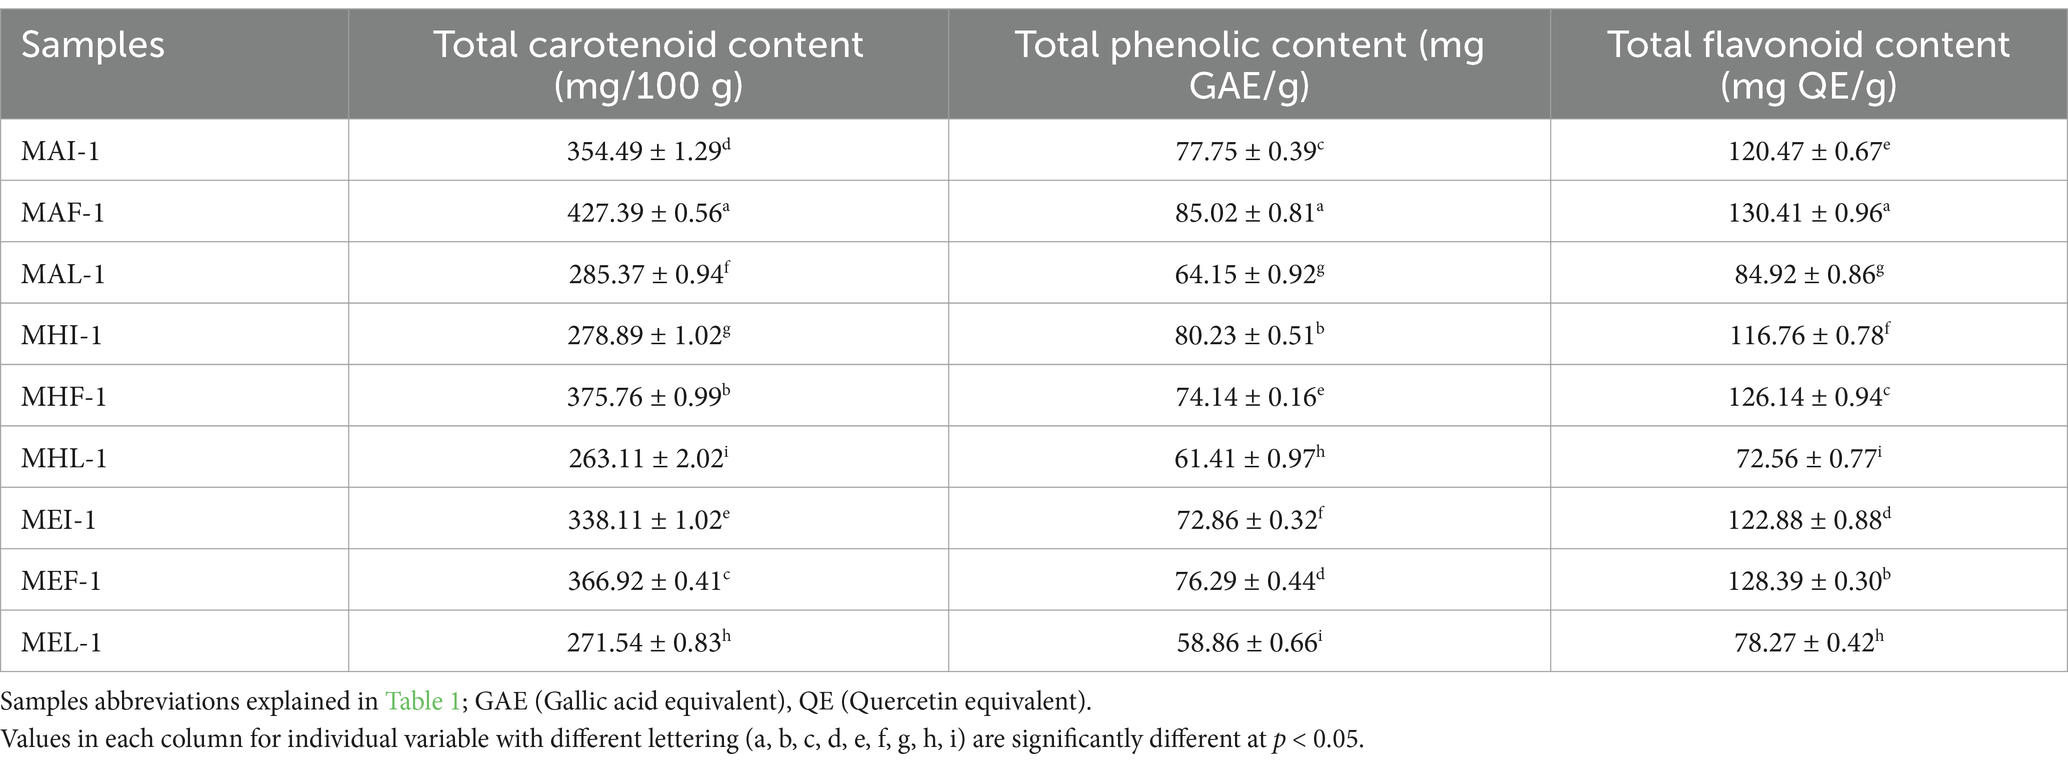
Table 4. Total carotenoids, total phenolics, and total flavonoid content in marigold extracts at different stages in pre-treated samples.
Various studies have reported that marigold has 18 different carotenoid compounds (Rodrigues et al., 2019) including, lutein (Kashyap et al., 2022), zeaxanthin, α-carotene (Tiwari et al., 2022), β-carotene (Elvira-Torales et al., 2019), α-cryptoxanthin, β-cryptoxanthin (Dias et al., 2018), phytoene, phytofluene, α-zeacarotene, β-zeacarotene, neoxanthin and antheraxanthin (Sowbhagya et al., 2004). These results are in line with previous research that reported that carotenoid content in various genotypes ranged from 19 to 525 mg per 100 g marigold flower. Tagetes genotypes of dark orange to yellow-orange colored flower petals were found higher in total carotenoids (Akshaya et al., 2017). The higher carotenoid content observed in the marigold acetone extract (15–20 mg per gram) is supported by previous research (Jalali-Jivan et al., 2019). It has also been reported that hexane extracts have a lower carotenoid content because of the specific solubility, stability and absorptivity of carotenoids (such as lutein and beta carotene) in organic solvents (Surendranath et al., 2016). Similarly, previous studies have supported the idea that extraction methods significantly affect the content of biologically active components. Carotenoid recovery can be improved to 97% by modifying extraction methods and conditions (Duan et al., 2024). In the present study, carotenoid content was slightly higher than in previous studies, which may be due to the application of ultrasound (40% amplitude for 5 min) that facilitates solvent penetration and leaching of the inbound components (polyphenolics) by breaching the plant cell wall (Manzoor et al., 2022; Ordóñez-Santos et al., 2021).
The findings of the current research are also supported by previous research results (Tungmunnithum et al., 2020), which reported that the combination of ultrasound technique with extraction resulted in enriched bioactive components in extracts from medicinal plants that can be utilized in functional food development. These results are also supported by previous evidence that ultrasound radiation causes cavitation in cells to free bound components, making it available for improved extraction (Jalali-Jivan et al., 2019). Thus, the extraction of carotenoids has been improved by employing ultrasound pre-treatment, which not only provides a high extraction yield but also lowers the degradation rate.
3.3.2 Total phenolic contents
Total phenolic content was determined in pretreated sample extracts against standard gallic acid using a spectrophotometer and expressed as GAE on a dry weight basis (Table 4). The results of quantification for total phenolic content varied between 58.86 mg GAE/g to 85.02 mg GAE/g. TPC values for ultrasound assisted acetone based extracts of fully bloomed marigold flower sample (MAF-1) resulted in higher phenolic content (85.02 mg GAE/g) followed by MAI-1 (80.23 mg GAE/g) UAE extracts (hexane × initial stage) of marigold flower samples. In contrast to these results, end season sample extract of MEL-1 exhibited the lowest phenolic contents (58.86 mg GAE/g).
The total phenolic content was observed higher with acetone, followed by ethanol and hexane for full bloom and initial stage samples, whereas for end stage samples TPC values were much lower even with acetone. This fact is supported by Subbiah et al. (2020) who reported that environmental conditions (high temperature/heat) cause a substantial reduction in phenolics and flavonoids in marigold flowers, which in turn causes a significant reduction in the antioxidant potential of extracts. Evidence reported that Tagetes erecta contains 18 phenolic acids and their derivatives, including gallic acid, quercetin, di-gallic acid, chromotropic acid, caffeic acid, syringic acid, p-coumaric acid, α-coumaric acid, ellagic acid, ferulic acid, iso-ferulic acid, sinapic acid, chlorogenic acid, protocatechuic acid, chlorogenic acid, p-OH benzoic acid, vanillic acid, and 3,4,5 tri-methoxy cinnamic acid (Manivannan et al., 2021; Moliner et al., 2018). Results for total phenolic content were correlated with previous research (Siriamornpun et al., 2012) that evaluated TPC content in marigold extracts 55–60 mg GAE per g DW in fresh and dried marigold flower samples, respectively. Another study reported total phenolic content in methanolic extracts of marigold 74.8 mg TAE per gram dry powder (Kang et al., 2018). Evidence reported that the highest TPC content was recorded with polar solvents (ethanol) compared to non-polar solvents (hexane), 223 mg GAE and 3.1 mg GAE per gram of extract, respectively (Li et al., 2007). Literature also confirmed that extraction is a complex process that is not only influenced by the solvent or its polarity but also by the chemical and physical properties of components and their concentration in extracts (Zhu et al., 2020). Thus, the evaluated results with acetone as an efficient solvent for total phenolic content are supported by the fact that polar solvents have more potential to solubilize and extract phenolic compounds (Li et al., 2007).
3.3.3 Total flavonoid content
The total flavonoid content ranged between 72.56 and 130.41 mg QE/g in various marigold extracts (Table 4). The quantification results of total flavonoid content revealed that extract prepared with ultrasound assisted method showed a higher TFC value (130.41 mg QE/g) for MAF-1 followed by MEF-1 (128.39 mg QE/g) for full bloomed sample extracts. The total flavonoid content of the end-season sample extracts was the lowest for MHL-1 (TFC 72.56 mg QE/g). This variation might be based on the type of flavonoids that have different solubilities in different solvents. Evidence has reported that marigold has numerous important flavonoids mainly in glycosylated forms including flavanols; quercetin, qercetagetin, quercitrin, rutin (Wu et al., 2023), flavanols; catechin, kaempferol, flavones; apig-6-arbinose-8-galactose, apig-6-rhamnose-8-glucose, apig-7-neohespiroside, apigenin, acacetin neo-rutinoside, flavanones; naringin, naringenin, hesperidin, hesperetin, and patuletin (Rhama and Madhavan, 2011), 6-hydroxykaempferol-3-O-hexoside, etc. The extraction method is also important for obtaining potential flavonoids in the extract, which may result in higher antioxidant activities in Tagetes plant species (Ayub et al., 2017). It has been observed that extracts contain various flavonoids, mainly flavonols thereby, resulting in different antioxidant activities with different solvents based on the type of component, its solubility based on polarity (Youssef et al., 2020). Previous research confirmed that total flavonoid content varies by modifying the method of extraction thereby, giving a TFC value of 110 mg QE/g with the conventional solvent extraction method that increased to 140 mg QE/g with the advanced extraction method (SCFA). The obtained results are supported by another study that reported a higher TFC value (133 mg RTE/g) in dried marigold extract than in fresh flowers (TFC 107 mg RTE/g) (Siriamornpun et al., 2012). The results also showed that the total flavonoid content was higher with acetone followed by ethanol in full-bloom sample extracts than in late-stage samples. This fact is supported by previous research by Li et al. (2007), who evaluated various cultivars of Chinese marigold flowers and reported that the total flavonoid content was higher in polar solvents like ethanol compared to hexane, varying from 28 to 93 mg RE per gram. The current study found a higher flavonoid content than that reported in previous studies due to ultrasound pre-treatment. These results are supported by recent evidence which confirmed that ultrasound radiation caused cavitation. The ultrasonic waves generate tiny bubbles that swiftly implode, releasing energy, shear strains, and micro-jets that enhance organic solvent infiltration and resulted cell wall disruption. The approach enhances mass transfer, extraction yield, and preservation of heat-sensitive bioactive components, hence resulting in higher bioactive content as compared to conventional extraction methods (Manzoor et al., 2022).
3.4 Antioxidant assays (DPPH, FRAP, ABTS)
The antioxidant potential is the free radical scavenging activity of MFP extracts against oxidants that cause oxidative damage to cells. The total antioxidant activity of the extracts was determined by the most suitable, reliable and easy-to-perform methods including DPPH, ABTS, and FRAP assays. The antioxidant potential of various marigold flower powder extracts, treated with ultrasound was evaluated in various solvents (Table 5). The highest DPPH radical scavenging activity was observed in acetone based extracts of full bloom flower samples (MAF-1: 96.19%) followed by MEF-1 (85.56%) of same stage samples. However, antioxidant activities in end-season/late flowering stage samples showed the least radical scavenging activities (MAL-1 > MEL-1 > MHL-1). Extracts of marigold flowers at full blooming showed significant scavenging activities owing to their potential to scavenge free radical ABTS+. The highest RSA was observed in the extract sample of MAF-1 followed by the MAI-1 (160.09 mmol TE/100 g and 141.23 mmol TE/100 g, respectively). However, the MHL-1 extract samples of MFP showed minimal free radical scavenging activity at 42.27 mmol TE/100 g (Table 5).
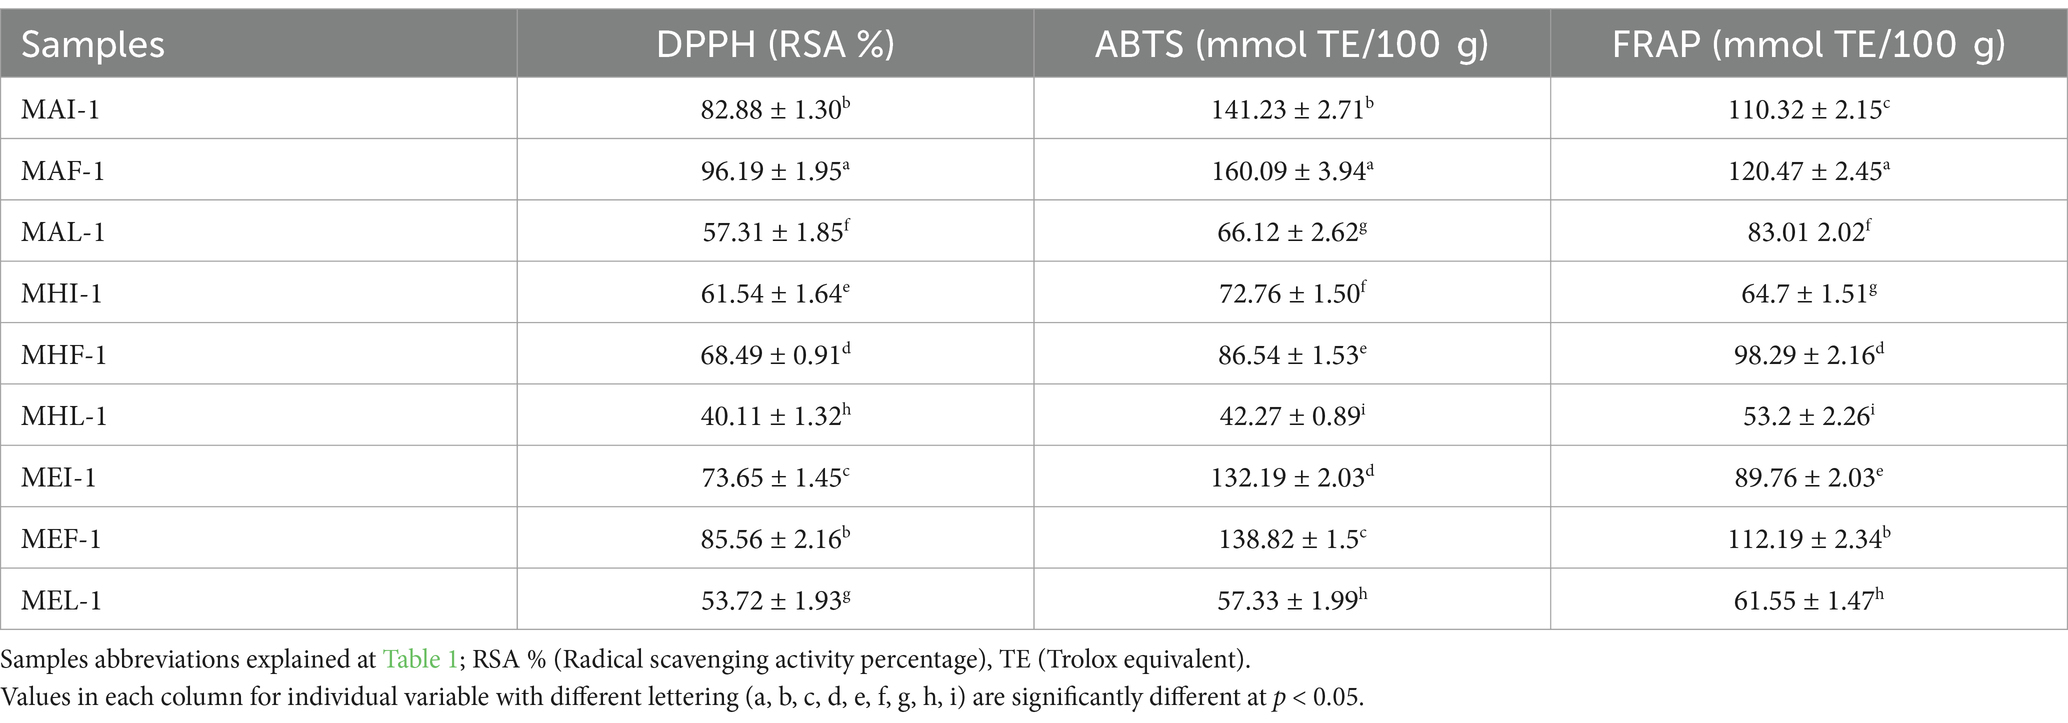
Table 5. Antioxidant activities of marigold extracts at different blooming stages in pre-treated samples.
A ferric-reducing antioxidant power (FRAP) assay was performed to investigate the free radical scavenging potential of the MFP extract by estimating the conversion rate of ferric ions (Fe+3) concentration to ferrous ions (Fe+2). The results showed that marigold flower samples of full bloom had higher reducing power (FRAP) for the extracts compared to other stage samples. Ferric radical scavenging activities were highest in MAF-1 (120.47 mmol TE/100 g) followed by MEF-1 (112.19 mmol TE/100 g) marigold full-bloom flower extract samples. In contrast to this MHL-1 showed the lowest reducing power (53.20 mmol/TE/100 g). Among the extracts the highest radical scavenging activities (DPPH and ABTS) and reducing power assay (FRAP) were observed highest in acetone based extracts followed by ethanol and hexane extracted samples at various stages. This fact was supported by research evidence which reported that phenolic and flavonoid compounds are hydrophilic in nature and have better solubility in polar solvents (like acetone, and ethanol) (Shi et al., 2024; Subbiah et al., 2020). Thus, the increase in phenolic and flavonoid contents may improve the antioxidant activities of MFP extracts (Gong et al., 2012).
Furthermore, it was seen that various Tagetes species exhibit percent inhibition of DPPH in ethanol up to 89% (Ingkasupart et al., 2015) and 92% DPPH in methanolic extract (Ćetković et al., 2004). Another research also investigated the antioxidant activities of marigold extracts and reported that antioxidant potential is correlated with the content of total phenolics and flavonoids in extracts (Li et al., 2007). The observed DPPH radical scavenging potential was also supported by previous research studies in which marigold genotypes were investigated, and it was observed that DPPH % ranged between 68 and 82% (Akshaya et al., 2017). Literature reported that orange cultivars of Tagetes represent the higher DPPH % recorded between 76.16 and 89.90% (Ingkasupart et al., 2015). The higher inhibition percentage of MP acetone extract is supported by Surendranath et al. (2016) who reported that it has more potential to extract lutein from samples and other phenolics that reduce oxidative stress by donating electrons to scavenge free radicals and turn it into a stable form. Results for FRAP and ABTS+ were also in agreement with previous research, which reported that radical scavenging potential is positively correlated with the bioactive contents of extracts. The highest scavenging activity (ABTS+ 172 mmol TE) was observed in the genotype with the highest flavonoid content, while the highest reducing power (FRAP 141 mmol TE) was observed in the genotype with the highest phenolic content (Manivannan et al., 2021). Lower antioxidant activities in late season samples may also result from stressful environmental conditions such as higher temperature and genetic factors may affect the flavonoid content (Aryal et al., 2019; Shi et al., 2024), which in turn cause significant reduction in antioxidant potential (Gong et al., 2012) that depends on the number and position of free hydroxyl groups of flavonoids.
Our results showed a large variation in radical scavenging activities with various solvents at different marigold flowering stages. This variation is supported by previous studies that compared total antioxidant activities (DPPH, FRAP, ABTS+) in MF extracts prepared using conventional solvent extraction (CSE) and ultrasound-assisted extraction (UAE) (Garcia-Castello et al., 2015). Literature has reported that the UAE method resulted in higher radical scavenging activities (DPPH 92.87%; ABTS+ 0.74 mM TE) and reducing power (FRAP 0.95 mM TE) per gram dry weight of marigold flower petals compared to conventional solvent extraction (Manzoor et al., 2022). In conclusion, the study results support the fact that UAE has no adverse effect on the antioxidant potential of the matrix indicating no degradation of bioactive components such as phenols and flavanols that are the major contributors to scavenging activities. Plant growth, flowering stages, season, and maturity may cause considerable variation in the radical scavenging and antioxidant activities of the extract. Also, the choice of solvent depends on the target compounds, which have a specific nature to be extracted based on their polarity and solubility. The antioxidant potential of marigold flowers and extracts has been exploited in commercial food and pharmaceutical industries owing to its potential to treat various chronic disorders, cognitive, ophthalmological, NAFLD and age-related disorders such as AMDs.
3.5 Quantification of bioactive compounds in marigold extracts
Quantification of bioactive compounds including phenolics, flavonoids and carotenoids in various marigold extracts was performed through HPLC-DAD. Presented results showed the distribution of various bioactive compounds at various wavelengths (λ) and retention time (RT) including phenolic acids [gallic acid (RT 5.76 min; 280 λ), coumaric acid (RT 38.36 min; 313 λ), syringic acid (RT 29.33 min; 280 λ), sinapic acid (RT 42.02 min; 313 λ)], flavonoids [quercetin (RT 54.63 min, 350 λ), catechin (RT 22.34 min; 280 λ) and kaempferol (RT 56.77 min; 350 λ)] and carotenoids [lutein (RT 6.03 min; 450 λ), zeaxanthin (RT 7.24 min, 450 λ) and fucoxanthin (RT 4.79 min; 450 λ)] in different solvent extracts of marigold (Table 6).
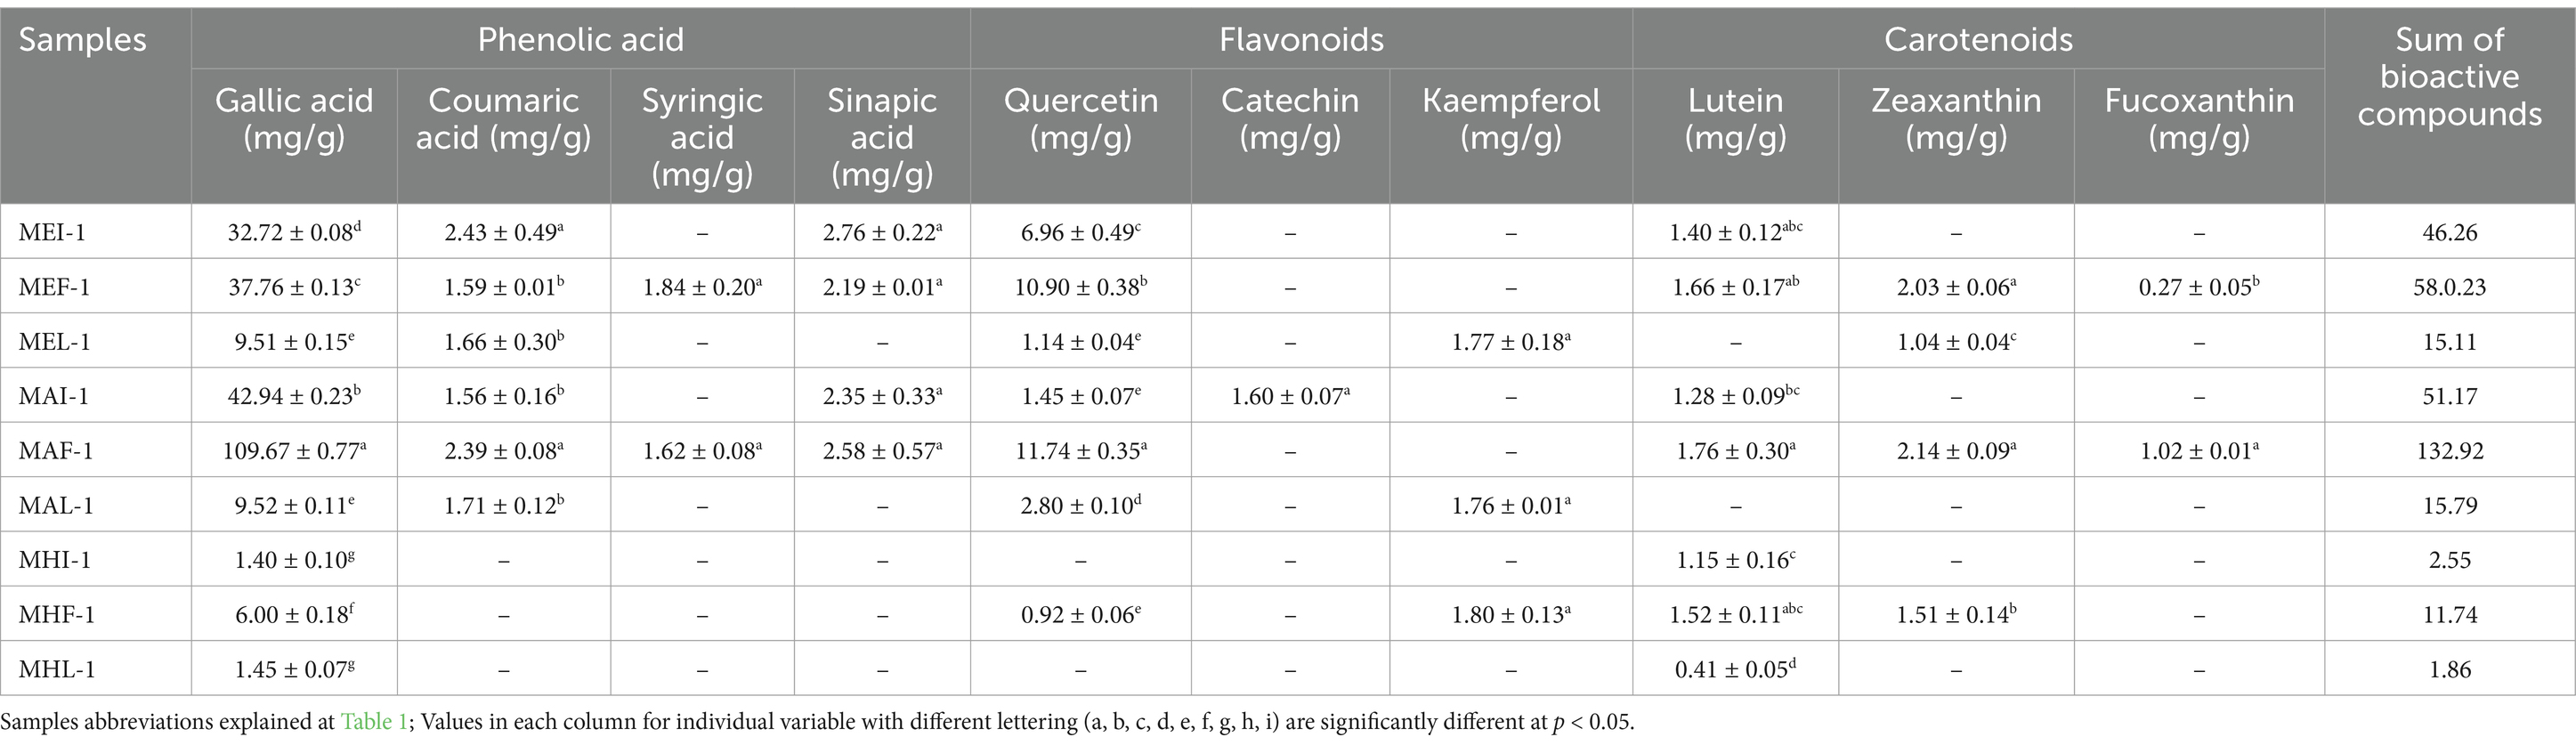
Table 6. Quantitative comparative analysis of bioactive compounds in various ultrasound extracts of marigold flowers.
The highest total concentration of bioactive compounds was observed in ultrasound treated acetone extract (MAF-1) followed by ethanol extract. Among phenolic acids, gallic acid found in all extract samples while coumaric acid and syringic acid were not detected in hexane extracts. Other important class of polyphenolics detected was flavonoids including Quercetin, catechin and kaempferol. Highest concentration of Quercetin was found in MAF-1 (11.74 mg/g) followed by MEF-1 (10.90 mg/g) while the lowest concentration was observed in MHF-1 (0.92 mg/g). Among carotenoids; lutein was detected (0.41–1.76 mg/g) in all extract samples except late stage extracts of marigold flower. This may be due to the loss of bioactive compounds that are thermolabile and can be easily degraded at higher temperature (Jalali-Jivan et al., 2021). Lutein and zeaxanthin detected at specific wavelengths (430–575 nm) and retention time is also in line with previous studies of Kashyap et al. (2022) and Liu et al. (2011).
Current research findings supported by previous literature reported that efficient extraction of carotenoids is highly dependent on appropriate solvent selection (Becerra et al., 2020). Results showed that marigold hexane extracts resulted least content of lutein and other carotenoids not detected in all stage sample extracts (Table 6). This may also be resulted due to higher polarity of xanthophylls than the extracting solvent (hexane), making it more suitable for non-polar carotenoids (like carotenes) than polar xanthophylls. Presented results are also supported by previous study reported that acetone resulted highest lutein recovery due to its strong ability to dissolve polar carotenoids (Low et al., 2020). Evidence also reported that the polar functional groups of lutein and zeaxanthin make them more soluble and extractable in polar solvents like acetone, ethanol and tetrahydrofuran than hexane (Saini and Keum, 2018; Kopec et al., 2012). Morón-Ortiz et al. (2024) reported that organic solvents pose high risk (health and environmental) and resulted relatively low carotenoid yield upon extraction.
Presence of phytochemicals like phenolic acids in marigold extract samples also reflects that extract has good pharmaceutical and nutritional properties. Gallic acid (C7H6O5) is a natural phenolic compound mostly present in medicinal plants and has known for its pharmacological activities like anti-inflammatory, cardiovascular, gastrointestinal, neuropsychological and metabolic functions (Kahkeshani et al., 2019). Quercetin (C15H10O7) is an important member of flavonoid which is highly recognized for its antioxidant, anti-cancerous and antiaging properties (Shi et al., 2023). Lutein (C40H56O2) consists of hydroxyl group and has ability to cross the blood ocular barrier (BOB) and helps to control age related macular disorders (Duan et al., 2024).
3.6 Chroma color analysis
Color is a significant aspect of the flower as it reveals the presence of valuable components such as carotenoids. Color values play a significant role in determining the qualities and nature of pigments in flower petals. The chroma color of the marigold flower samples was measured at various blooming stages and then its extract was prepared to compare the color index for each stage (Table 7). A highly significant effect of flowering stages on the chroma values of marigold extracts was observed in our study. CIELAB values showed the highest mean chroma index in full bloom stage marigold extract and petals C* 93.70 and 70.84, respectively. L* was the highest (68.17) in the initial stage sample extract whereas b* was the highest (86.37) in the full bloom marigold extract. While the lowest chroma index was recorded in the petals of marigolds during late stages/end season. These results are supported by literature that investigated diverse species of Tagetes and reported higher chroma values (C* 79) of orange cultivars as compared to light yellow to off-white petals (C* 42). The CIE b* value reflects the yellow direction of color and is observed higher in extracts than in powder (Manivannan et al., 2021). This fact is supported by the evidence that the marigold coloring component in flower petals is in the bound form (oleoresin). The extract was prepared and purified from oleoresin to free lutein resulting in a higher chroma color index (Jalali Jivan and Abbasi, 2019). The opposite trend was observed for the hue compared to the chroma color index when the results for both petals and extracts were compared. Hue is the angular measurement ranging between 0° and 90° representing the red-to-yellow color index. The presented results showed that hue degrees were higher for flower samples compared to extracts. In contrast to the chroma index, the maximum hue value (88.08) was recorded for the marigold flower petals. These chroma color values indicate the saturation and intensity of the coloring pigment in the samples. The flowers of Tagetes erecta L. are orange to yellow in color; therefore, its coloring component saturation may be higher at the initial and full bloom flowering stages than in the late season. At the full bloom stage, when the flower blooms, its petals increase in number and size, and the content of carotenoid compounds increases (Youssef et al., 2020).

Table 7. Mean chroma color index at different blooming stages of marigold flowers and its extracts.
The presented results were also supported by previous literature reporting that the extraction method and solvent polarity (interaction with free lutein from oleoresin) resulted in a carotenoid-rich extract that showed a higher chroma index (Kurniawan et al., 2019). This indicates that at the bloom stage flower color intensity increases which reflects the concentration of coloring compounds, and carotenoid content, resulting in higher antioxidant potential (Manivannan et al., 2021). The coloring characteristic of the marigold flower is imparted by these coloring agents that are majorly saturated in its petals Conclusively, dark-colored Tagetes species and their extracts are rich repositories of carotenoid coloring compounds (like lutein) that have the potential to be utilized as natural colorant (E 161b) in food and also have a significant therapeutic effect in pharmaceutics (Nwachukwu et al., 2016).
3.7 Product sensory attributes
Organoleptic evaluation of the supplemented drink confirmed that marigold extract can improve the sensory profile. The results of sensory attributes of the supplemented drink showed a significant effect of supplementation of the marigold extract on its sensory characteristics. It was observed that T3 has a maximum color score (8.65) followed by T2 (8.35), whereas the lowest score was recorded 7.56 for T0. Overall sensory results for T0 and T1 were similar and observed closely due to the levels of supplementation in T1.
Taste and aroma are important parameters for the sensory evaluation of products. The results for aroma and taste varied between 7.50–8.35 and 7.95–8.05, respectively. The highest scores for aroma and taste were recorded for T3 (8.35) and T1 (8.05), followed by T2 (8.22) and T0 (7.95), while the lowest scores were recorded for T0 (7.50) and T3 (7.42), respectively. The mouth feel and overall acceptability ranged between 7.81–7.65 and 8.12–7.63, respectively. The overall acceptability was recorded highest for T2 (8.12), followed by T1 (7.74) > T3 (7.63) (Table 8). Taste and aroma are crucial parameters in the sensory evaluation and storage study of drinks. The results showed that supplementation imparts a pleasant aroma and color to drink which was recorded highest for T3 followed by T2. Evidence reported that the aroma of the product was improved with the supplementation of marigold because of its aromatic flavoring compounds (pipertone, piperitone, α-terpineol, terpinolene, etc.) (Moghaddam et al., 2021). The results for flavor improvement were also supported by Chitrakar et al. (2019) who reported that essential oil components such as isothiocyanates may impart flavor to supplemented food products made with edible flower extracts. The obtained results are also supported by the literature that supplementation with marigolds has good coloring potential that significantly improves the product’s sensory attributes and overall acceptability compared to the control. The sensory profile for color is in line with the previous studies that reported that supplementation with marigold lutein significantly improved the sensory characteristics of the product, including aroma, taste, color, and overall acceptability (Kim et al., 2023; Xavier et al., 2018).
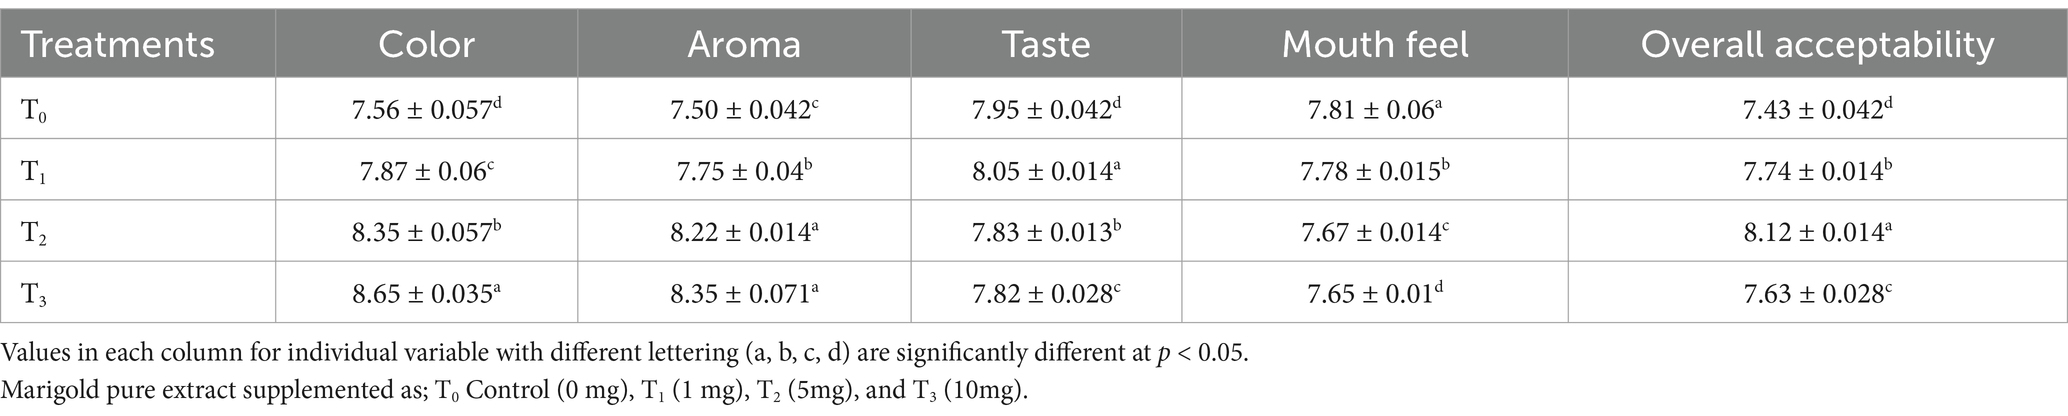
Table 8. Effect of different levels of supplementation on sensory characteristics of the supplemented drink.
The storage study of the supplemented drink was also performed for about 1 month (Figure 2). The results showed that the color of T0 (control) was observed lowest (6.96) compared to other treatments at the end of the storage period. The highest color value was observed for T3 (8.09) followed by T2 on the 27th day of storage. At the end of the storage, T2 scored the highest (7.79) followed by T3 (7.63) for aroma, whereas T0 scored the least (7.39). The highest score for taste was observed for T0 (7.73) followed by T1 (7.38) and T2 (7.22) even on the 27th day of storage. The color of T3 was stable but the sensory score for taste and mouthfeel of T3 samples decreased to 6.69 and 6.76, respectively at the end of the storage period. The overall acceptability of the supplemented drink (T3) was also scored lowest (6.49) while the highest (7.19) was the case for T2 (on the 27th day) with the progression of the storage period. In contrast to T3 other treatments’ taste and overall acceptability were not significantly affected by storage time and conditions, this may be a result of higher supplementation levels that make juice a little more viscous and darker colored as marigold extract was purified to concentrate bioactive lutein. Also, carotenoids separated in food sources into the mouth while ingestion do not have much impact on food characteristics however release rate may be affected by the increased concentration or content of carotenoids in supplemented foods (Geng et al., 2023). Results are also supported by previous research reported that carotenoids are susceptible to degradation during storage by certain factors mainly oxygen, light, and heat (increased in temperature) (Weigel et al., 2018). The higher the content the greater the reactivity of bioactive compounds. The overall sensory characteristics of functional food products are affected by storage conditions and duration.

Figure 2. Effect of storage period on sensory characteristics of the drink stored for 4 weeks.
Marigold has been widely investigated as an additive and supplement to food products to replace artificial additives and to add product nutritional value (Corbo et al., 2014). Literature reported that marigold supplementation in various food products not only improved the sensory characteristics (especially color) of the developed products but is also expected to deliver various health benefits that may result from its bioactive components (Becerra et al., 2020). In conclusion, organoleptic evaluation of the product showed that treatment with 5 mg had similar and/or greater acceptance than the control treatment. The recommended dietary allowance for lutein may be accomplished by supplementation into the most popular foods in all age groups. Therefore, developing a functional drink with marigold supplementation is a feasible strategy. Literature reports that marigold-supplemented products play an important role as nutrient carriers, accomplish lutein daily intake, and improve its bioavailability and accessibility which may result in delaying various age-related disorders (Bhat et al., 2022).
3.8 Correlation and principal component analysis of extract with phytochemicals and antioxidant assays
Correlation analysis was performed, and a highly significant and positive correlation was observed among all parameters. The relationship between the extract yield, TCC, TFC, and TPC, and antioxidant activities of the plant was investigated. Some studies have reported that antioxidant activities have a non-significant association with phytochemical compounds in plants, whereas other studies have presented a positive and highly significant correlation between bioactive compounds and antioxidant assays.
Yield showed a highly significant and positive correlation with all parameters under consideration (TPC, TFC, TCC, and all antioxidant assays) (Table 9). Total phenolic contents are also positively and significantly associated with all other attributes (TFC, TCC, DPPH, and ABTS). TPC was highly correlated with TFC (0.915), whereas it was the least correlated with FRAP (0.778). A highly significant correlation with all antioxidant assays (DPPH, ABTS, and FRAP) was recorded with total phenolics and carotenoids. DPPH showed a significant and positive association with both ABTS (0.963) and FRAP (0.936) while the ABTS was strongly associated with the FRAP (0.896).
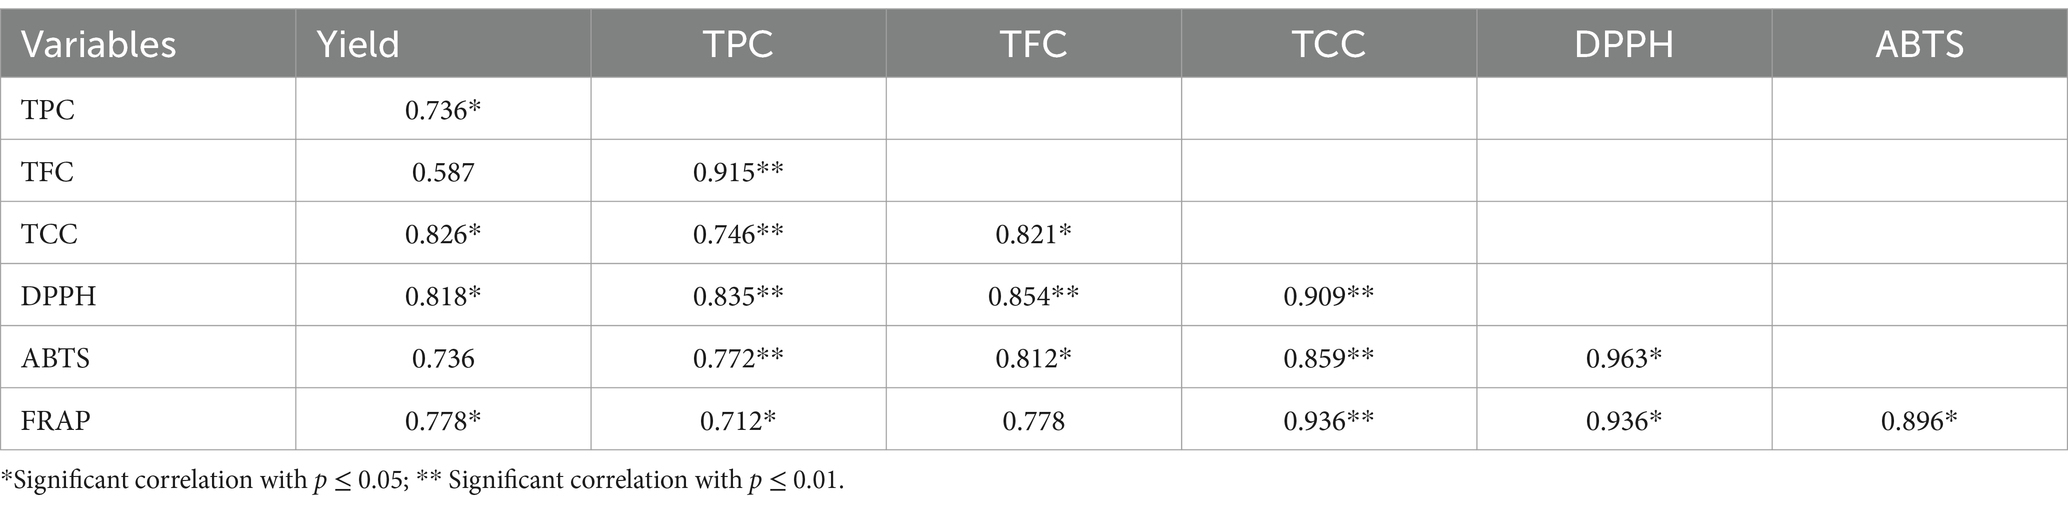
Table 9. Linear correlation between yield, total phenolic content, total flavonoid content, total carotenoids and antioxidant assays.
The PCA outcomes showed that the first principal component (PC-I which only has Eigenvalue >1) accounted for 84.76% of overall variation, while PC-II and PC-III have Eigenvalues <1 and contributed approximately 7 and 4.78% in overall variance, respectively. It was observed that the first three PCs cumulatively described approximately 96.54% of the total variability. The partial weight of each parameter for each of the PCs was determined, and the findings revealed that the carotenoid pigmentation and radical scavenging activity assessed using DPPH, ABTS, and FRAP accounted for approximately 61.15% of the overall variation in PC1, with DPPH (16.24%) contributing the most, followed by TCC (15.14%) together with ABTS (14.89%), and FRAP contributed the least (14.88%).
In PC-I total flavonoid content (13.52%), total phenolics (13.19%), and extract yield (12.13%) imparted the least variability. Variation assessed by flavonoids, phenolic content, and extract yield contributed approximately 87.67% in PC-II, with an individual proportion of 36.14%, 26.15, and 25.38%, respectively. Moreover, in PC-II, variables like TCC and all antioxidants’ assays cumulatively accounted for less than 15% of the overall variance, contrasting opposite findings were recorded for these factors in PC-I. Individually extract yield accounted for 45.05% of the total variation, while extract yield together with TPC accounted for approximately 70.43% variance in PC-III.
A PCA biplot (union of vectors for parameters and mapping of solvent × flowering) was developed and the vector stretch for individual parameters was drafted from the origin in order to unveil the association among the variables by the cosine of the angles among various vector stretches. The PCA biplot revealed that the strong association among variables acquired the position in the same quadrant as presented in Figure 3. DPPH with ABTS and TCC with FRAP, showed positive and strong correlations with each other as represented by the angular proximity of the vectors, whereas yield showed a positive and moderate association with all described factors in the 1st quadrant (+, −). Similarly, in the 2nd (+, +) quadrant, angular proximity is quite evident among TFC and TPC which corresponds to a positive and strong association between both variables. Moreover, the cosine of the angles presents a positive correlation among all parameters under consideration (TFC, TPC, ABTS, DPPH, TCC, FRAP, and extract yield). PCA biplots for specific solvent × flowering stage such as acetone × full bloom which has higher extract yield, carotenoid content, TFC, TPC and antioxidant activity (DPPH, ABTS, and FRAP) were plotted quite adjacent in the 1st quadrant (+, −). Solvent × flowering stages which are rich in TFC and TPC, took the position in the 2nd quadrant (+, +), while solvent × flowering stage which have shown quite low values for these factors were quite far away from each other (factors from solvent × flowering stage) and positioned in the 4th quadrant (−, −).
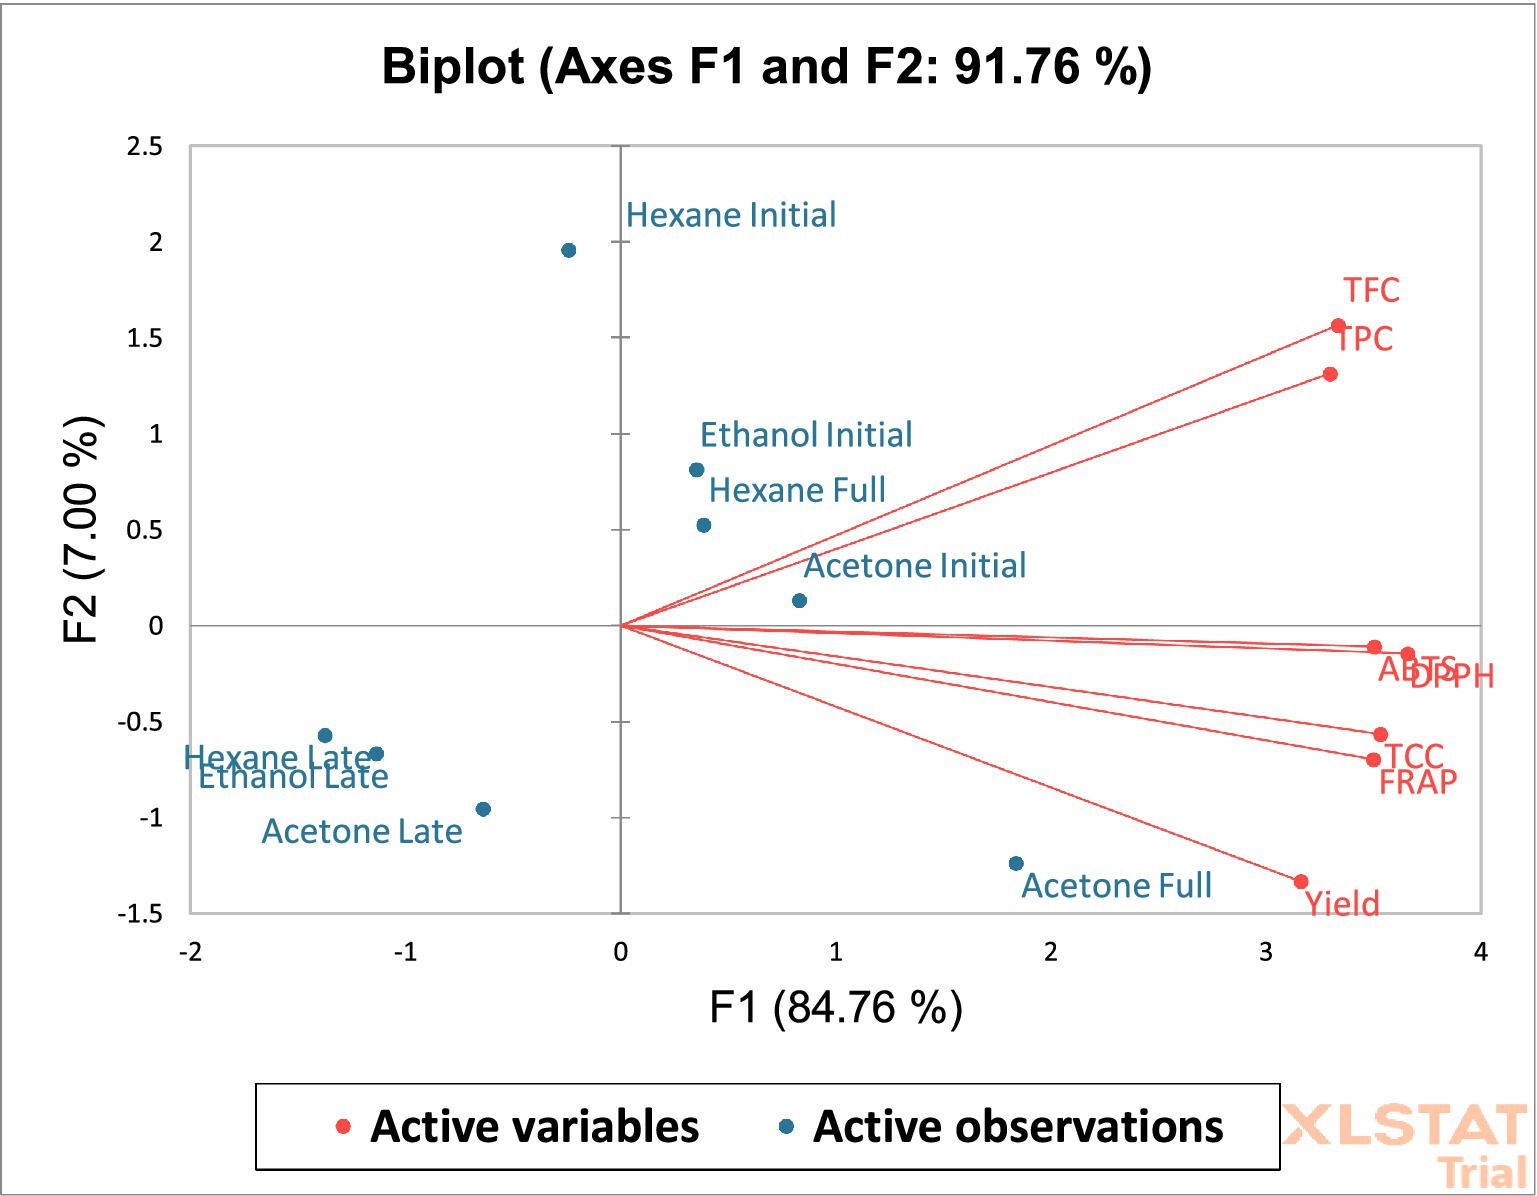
Figure 3. Biplot for PC I and PC II for various variables with different solvents × blooming stages.
A significant correlation between carotenoids, phenolics, flavonoids, and antioxidant assays showed that the phytochemical compounds of marigold extracts could be the principal contributors to antioxidant activities. Previous research has supported the positive and highly significant correlation between the total phenolics, total flavonoids, and antioxidant activities of flower extracts (Youssef et al., 2020). Some other databases also found a positive correlation of total phenolic contents, carotenoid contents, and radical scavenging activities of plant extracts (Akshaya et al., 2017; Kaisoon et al., 2011).
4 Conclusion
The study concluded that ultrasound-treated marigold flower samples not only resulted in better yield but also contained more bioactive compounds including total carotenoids, total phenolic compounds, and flavonoids. Full bloom sample extracts (MAF-1) exhibited higher phenolic contents and antioxidant activities through ultrasound assisted extraction. Further, HPLC quantification also confirmed phenolics and carotenoids bioactive compounds (gallic acid, coumaric acid, quercetin, catechin, lutein, zeaxanthin) in higher concentration in polar organic solvent extracts of marigold full bloom flower samples. Study findings highlight the significant potential of Tagetes extracts and its suitability as food processing additive or fortificant in nutritional supplements or functional products. However, there is gap in existing literature regarding relationship between bioactive polyphenolic compounds, their blooming stages and bioavailability. Future study planned to fully evaluate Tagetes flowers (MFP) for its polyphenolic compounds with focus on exploring these aspects via LCMS-QToF MS/MS and in-vitro bioaccessibility through stimulated digestive model to confirm bioactive compounds recovery and bioaccessibility at various stages of digestion.
Data availability statement
The data that support the findings of this study are available on request from the corresponding author.
Author contributions
AyS: Conceptualization, Methodology, Writing – original draft, Formal analysis, Investigation, Data curation. AK: Project administration, Conceptualization, Writing – review & editing. TM: Conceptualization, Investigation, Methodology, Writing – review & editing. MC: Conceptualization, Funding acquisition, Data curation, Writing – review & editing. AS-M: Data curation, Investigation, Writing – review & editing. SA: Conceptualization, Data curation, Formal analysis, Software, Writing – review & editing. AmS: Writing – review & editing, Resources, Validation, Software. IM: Funding acquisition, Project administration, Writing – review & editing, Visualization, Resource.
Funding
The author(s) declare that financial support was received for the research and/or publication of this article. This research was funded by Researchers Supporting Project Number (RSPD2025R1074) King Saud University, Riyadh, Saudi Arabia and Punjab Higher Education Commission Pakistan (PHEC) IRSF (International Research Support Fellowship) award No. PHEC/HRD/IRSF/2/4-2/2023/4040.
Acknowledgments
The authors extend their appreciation to Researchers Supporting Project Number (RSPD2025R1074) King Saud University, Riyadh, Saudi Arabia for supporting this research.
Conflict of interest
The authors declare that the research was conducted in the absence of any commercial or financial relationships that could be construed as a potential conflict of interest.
Publisher’s note
All claims expressed in this article are solely those of the authors and do not necessarily represent those of their affiliated organizations, or those of the publisher, the editors and the reviewers. Any product that may be evaluated in this article, or claim that may be made by its manufacturer, is not guaranteed or endorsed by the publisher.
Supplementary material
The Supplementary material for this article can be found online at: https://www.frontiersin.org/articles/10.3389/fsufs.2025.1474848/full#supplementary-material
References
Akshaya, H., Namita, K. P. S., Saha, S., Panwar, S., and Bharadwaj, C. (2017). Determination and correlation of carotenoid pigments and their antioxidant activities in marigold (Tagetes sp.) flowers. Indian J. Agric. Sci. 87, 390–396. doi: 10.56093/ijas.v87i3.68755
Ali, A., Wu, H., Ponnampalam, E. N., Cottrell, J. J., Dunshea, F. R., and Suleria, H. A. (2021). Comprehensive profiling of most widely used spices for their phenolic compounds through LC-ESI-QTOF-MS2 and their antioxidant potential. Antioxidants. 10:721. doi: 10.3390/antiox10050721
Arefin, S., Islam, M. T., and Hossain, M. T. (2015). Proximate analysis, phytochemical screening and antioxidant activity of Tagetes erecta flower growing in coastal area of Bangladesh. J. Glob. Biosci. 4, 2060–2066.
Aryal, S., Baniya, M. K., Danekhu, K., Kunwar, P., Gurung, R., and Koirala, N. (2019). Total phenolic content, flavonoid content and antioxidant potential of wild vegetables from Western Nepal. Plan. Theory 8:96. doi: 10.3390/plants8040096
Association of Official Analytical Chemists (2023). Official methods of analysis of AOAC International (22nd ed.). AOAC International. Method 925.10. Available at: https://www.aoac.org/official-methods-of-analysis/
Ayub, M. A., Hussain, A. I., Hanif, M. A., Chatha, S. A. S., Kamal, G. M., Shahid, M., et al. (2017). Variation in phenolic profile, β-carotene and flavonoid contents, biological activities of two Tagetes species from Pakistani flora. Chem. Biodivers. 14:e1600463. doi: 10.1002/cbdv.201600463
Baig, U., Khatri, A., Ali, S., Sanbhal, N., Ishaque, F., and Junejo, N. (2021). Ultrasound-assisted dyeing of cotton fabric with natural dye extracted from marigold flower. J. Textile Inst. 112, 801–808. doi: 10.1080/00405000.2020.1779907
Barut, M., Nadeem, M. A., Akgür, Ö., Tansi, L. S., Aasim, M., Altaf, M. T., et al. (2022). Medicinal and aromatic plants in the omics era: application of plant breeding andbiotechnology for plant secondary metabolite production. Turkish Journal of Agriculture and Forestry. 46, 182–203. doi: 10.55730/1300-011X.2970
Bashir, S., and Gilani, A. H. (2008). Studies on the antioxidant and analgesic activities of Aztec marigold (Tagetes erecta) flowers. Phytother. Res. 22, 1692–1694. doi: 10.1002/ptr.2550
Becerra, M. O., Contreras, L. M., Lo, M. H., Díaz, J. M., and Herrera, G. C. (2020). Lutein as a functional food ingredient: stability and bioavailability. J. Funct. Foods 66:103771. doi: 10.1016/j.jff.2019.103771
Bhat, I., Madhura, R., Badanthadka, M., and Mamatha, B. S. (2022). Cow ghee as an efficient carrier to improve oral bioavailability of lutein. Food Chem. 389:133046. doi: 10.1016/j.foodchem.2022.133046
Bhave, A., Schulzová, V. R., Mrnka, L., and Hajšlová, J. (2020). Influence of harvest date and postharvest treatment on carotenoid and flavonoid composition in French marigold flowers. J. Agric. Food Chem. 68, 7880–7889. doi: 10.1021/acs.jafc.0c02042
Ćetković, G. S., Djilas, S. M., Čanadanović-Brunet, J. M., and Tumbas, V. T. (2004). Antioxidant properties of marigold extracts. Food Res. Int. 37, 643–650. doi: 10.1016/j.foodres.2004.01.010
Chitrakar, B., Zhang, M., and Bhandari, B. (2019). Edible flowers with the common name “marigold”: their therapeutic values and processing. Trends Food Sci. Technol. 89, 76–87. doi: 10.1016/j.tifs.2019.05.008
Chung, R. W., Leanderson, P., Lundberg, A. K., and Jonasson, L. (2017). Lutein exerts anti-inflammatory effects in patients with coronary artery disease. Atherosclerosis 262, 87–93. doi: 10.1016/j.atherosclerosis.2017.05.008
Corbo, M. R., Bevilacqua, A., Petruzzi, L., Casanova, F. P., and Sinigaglia, M. (2014). Functional beverages: the emerging side of functional foods: commercial trends, research, and health implications. Compr. Rev. Food Sci. Food Saf. 13, 1192–1206. doi: 10.1111/1541-4337.12109
Dias, M. G. A., Olmedilla-Alonso, B., Hornero-Méndez, D., Mercadante, A. Z., Osorio, C., Vargas-Murga, L., et al. (2018). Comprehensive database of carotenoid contents in Ibero-American foods. A valuable tool in the context of functional foods and the establishment of recommended intakes of bioactives. J. Agric. Food Chem. 66, 5055–5107. doi: 10.1021/acs.jafc.7b06148
Duan, X., Subbiah, V., Agar, O. T., Barrow, C. J., Ashokkumar, M., Dunshea, F. R., et al. (2024). Optimizing extraction methods by a comprehensive experimental approach and characterizing polyphenol compositions of Ecklonia radiata. Food Chem. 455:139926. doi: 10.1016/j.foodchem.2024.139926
Duan, X., Xie, C., Hill, D. R., Barrow, C. J., Dunshea, F. R., Martin, G. J., et al. (2024). Bioaccessibility, bioavailability, and bioactivities of carotenoids in microalgae: a review. Food Rev. Intl. 40, 230–259. doi: 10.1080/87559129.2023.2165095
EFSA Panel on Food Contact Materials, Enzymes, Flavourings and Processing Aids (CEF) (2010). Flavouring group evaluation 8, revision 1 (FGE. 08Rev1): aliphatic and alicyclic mono-, di-, tri-, and polysulphides with or without additional oxygenated functional groups from chemical groups 20 and 30. EFSA J. 8:1021. doi: 10.2903/j.efsa.2010.1021
Elvira-Torales, L. I., García-Alonso, J., and Periago-Castón, M. J. (2019). Nutritional importance of carotenoids and their effect on liver health: a review. Antioxidants 8:229. doi: 10.3390/antiox8070229
Essien, S. O., Young, B., and Baroutian, S. (2020). Recent advances in subcritical water and supercritical carbon dioxide extraction of bioactive compounds from plant materials. Trends Food Sci. Technol. 97, 156–169. doi: 10.1016/j.tifs.2020.01.014
Gansukh, E., Mya, K. K., Jung, M., Keum, Y.-S., Kim, D. H., and Saini, R. K. (2019). Lutein derived from marigold (Tagetes erecta) petals triggers ROS generation and activates Bax and caspase-3 mediated apoptosis of human cervical carcinoma (HeLa) cells. Food Chem. Toxicol. 127, 11–18. doi: 10.1016/j.fct.2019.02.037
Garcia-Castello, E. M., Rodriguez-Lopez, A. D., Mayor, L., Ballesteros, R., Conidi, C., and Cassano, A. (2015). Optimization of conventional and ultrasound assisted extraction of flavonoids from grapefruit (Citrus paradisi L.) solid wastes. LWT Food Sci. Technol. 64, 1114–1122. doi: 10.1016/j.lwt.2015.07.024
Geng, T., Bao, S., Sun, X., Ma, D., Zhang, H., Ge, Q., et al. (2023). A clarification of concepts related to the digestion and absorption of carotenoids and a new standardized carotenoids bioavailability evaluation system. Food Chem. 400:134060. doi: 10.1016/j.foodchem.2022.134060
Gombač, Z., Črnivec, I. G. O., Skrt, M., Istenič, K., Knafelj, A. K., Pravst, I., et al. (2021). Stabilisation of lutein and lutein esters with polyoxyethylene sorbitan monooleate, medium-chain triglyceride oil and lecithin. Food Secur. 10:500. doi: 10.3390/foods10030500
Gong, Y., Hou, Z., Gao, Y., Xue, Y., Liu, X., and Liu, G. (2012). Optimization of extraction parameters of bioactive components from defatted marigold (Tagetes erecta L.) residue using response surface methodology. Food Bioprod. Process. 90, 9–16. doi: 10.1016/j.fbp.2010.12.004
He, Q., Tang, G., Hu, Y., Liu, H., Tang, H., Zhou, Y., et al. (2024). Green and highly effective extraction of bioactive flavonoids from Fructus aurantii employing deep eutectic solvents-based ultrasonic-assisted extraction protocol. Ultrasonics Sonochemistry. 102:106761. doi: 10.1016/j.ultsonch.2024.106761
Ingkasupart, P., Manochai, B., Song, W. T., and Hong, J. H. (2015). Antioxidant activities and lutein content of 11 marigold cultivars (Tagetes spp.) grown in Thailand. Food Sci. Technol. 35, 380–385. doi: 10.1590/1678-457X.6663
Jalali Jivan, M., and Abbasi, S. (2019). An attempt to cast light into lutein extraction and its alkali optimization. J. Food Meas. Charact. 13, 154–161. doi: 10.1007/s11694-018-9928-8
Jalali-Jivan, M., and Abbasi, S. (2020). Novel approach for lutein extraction: food grade microemulsion containing soy lecithin & sunflower oil. Innovative Food Sci. Emerg. Technol. 66:102505. doi: 10.1016/j.ifset.2020.102505
Jalali-Jivan, M., Abbasi, S., and Fathi-Achachlouei, B. (2021). Lutein extraction by microemulsion technique: evaluation of stability versus thermal processing and environmental stresses. Lwt 149:111839. doi: 10.1016/j.lwt.2021.111839
Jalali-Jivan, M., Abbasi, S., and Scanlon, M. G. (2019). Microemulsion as nanoreactor for lutein extraction: optimization for ultrasound pretreatment. J. Food Biochem. 43:e12929. doi: 10.1111/jfbc.12929
Jia, Y.-P., Sun, L., Yu, H.-S., Liang, L.-P., Li, W., Ding, H., et al. (2017). The pharmacological effects of lutein and zeaxanthin on visual disorders and cognition diseases. Molecules 22:610. doi: 10.3390/molecules22040610
Jivan, M. J., and Abbasi, S. (2019). Nano based lutein extraction from marigold petals: optimization using different surfactants and co-surfactants. Heliyon 5:e01572. doi: 10.1016/j.heliyon.2019.e01572
Kahkeshani, N., Farzaei, F., Fotouhi, M., Alavi, S. S., Bahramsoltani, R., Naseri, R., et al. (2019). Pharmacological effects of gallic acid in health and diseases: a mechanistic review. Iran. J. Basic Med. Sci. 22, 225–237. doi: 10.22038/ijbms.2019.32806.7897
Kaimainen, M., Järvenpää, E., and Huopalahti, R. (2015). Enzyme-assisted oil extraction of lutein from marigold (Tagetes erecta) flowers and stability of lutein during storage. Int. J. Agric. Food Res. 4, 11–19. doi: 10.24102/ijafr.v4i2.569
Kaisoon, O., Siriamornpun, S., Weerapreeyakul, N., and Meeso, N. (2011). Phenolic compounds and antioxidant activities of edible flowers from Thailand. J. Funct. Foods 3, 88–99. doi: 10.1016/j.jff.2011.03.002
Kang, C. H., Rhie, S. J., and Kim, Y. C. (2018). Antioxidant and skin anti-aging effects of marigold methanol extract. Toxicol. Res. 34, 31–39. doi: 10.5487/TR.2018.34.1.031
Kashyap, P. K., Singh, S., Singh, M. K., Gupta, A., Tandon, S., Shanker, K., et al. (2022). An efficient process for the extraction of lutein and chemical characterization of other organic volatiles from marigold (Tagetes erecta L.) flower. Food Chem. 396:133647. doi: 10.1016/j.foodchem.2022.133647
Kim, S.-Y., Hong, S.-Y., Choi, H.-S., Kim, J.-H., Jeong, S.-H., Lee, S.-Y., et al. (2023). Superfine Marigold powder improves the quality of sponge cake: lutein fortification, texture, and sensory properties. Food Secur. 12:508. doi: 10.3390/foods12030508
Kopec, R. E., Cooperstone, J. L., Cichon, M. J., and Schwartz, S. J. (2012). Analysis methods of carotenoids. Analysis of Antioxidant‐Rich Phytochemicals. 105–148. doi: 10.1002/9781118229378
Kurniawan, J. M., Yusuf, M. M., Azmi, S. S., Salim, K. P., Utami Prihastyanti, M. N., Indrawati, R., et al. (2019). Effect of drying treatments on the contents of lutein and zeaxanthin in orange-and yellow-cultivars of marigold flower and its application for lutein ester encapsulation. IOP Conf. Ser. Mater. Sci. Eng. 509:012060. doi: 10.1088/1757-899X/509/1/012060
Li, W., Gao, Y., Zhao, J., and Wang, Q. (2007). Phenolic, flavonoid, and lutein ester content and antioxidant activity of 11 cultivars of Chinese marigold. J. Agric. Food Chem. 55, 8478–8484. doi: 10.1021/jf071696j
Liu, H., Zhang, Y., Li, Q., Zou, Y., Shao, J., and Lan, S. (2011). Quantification of lutein and zeaxanthin in marigold (Tagetes erecta L.) and poultry feed by ultra-performance liquid chromatography and high performance liquid chromatography. J. Liq. Chromatogr. Relat. Technol. 34, 2653–2663. doi: 10.1080/10826076.2011.593220
Low, K. L., Idris, A., and Yusof, N. M. (2020). Novel protocol optimized for microalgae lutein used as food additives. Food Chem. 307:125631. doi: 10.1016/j.foodchem.2019.125631
Ma, M. (2017). Lutein market by form (powder and crystalline, oil suspension, beadlet, emulsion), source (natural, synthetic), application (food, beverages, dietary supplements, animal feed), production process, and region—global forecast to 2022. Markets and markets. Available at: https://www.marketresearch.com/MarketsandMarkets-v3719/Lutein-Form-Powder-Crystalline-Oil-34579052/
Ma, M., Yuan, Y., Yang, S., Wang, Y., and Lv, Z. (2020). Fabrication and characterization of zein/tea saponin composite nanoparticles as delivery vehicles of lutein. Lwt 125:109270. doi: 10.1016/j.lwt.2020.109270
Madaan, T., Choudhary, A. N., Gyenwalee, S., Thomas, S., Mishra, H., Tariq, M., et al. (2017). Lutein, a versatile phyto-nutraceutical: an insight on pharmacology, therapeutic indications, challenges and recent advances in drug delivery. PharmaNutrition 5, 64–75. doi: 10.1016/j.phanu.2017.02.005
Manivannan, A., Narasegowda, S., and Prakash, T. (2021). Comparative study on color coordinates, phenolics, flavonoids, carotenoids, and antioxidant potential of marigold (Tagetes sp.) with diverse colored petals. J. Food Meas. Charact. 15, 4343–4353. doi: 10.1007/s11694-021-01015-4
Manzoor, S., Rashid, R., Panda, B. P., Sharma, V., and Azhar, M. (2022). Green extraction of lutein from marigold flower petals, process optimization and its potential to improve the oxidative stability of sunflower oil. Ultrason. Sonochem. 85:105994. doi: 10.1016/j.ultsonch.2022.105994
Moghaddam, M., Pirbalouti, A. G., Babaei, K., and Farhadi, N. (2021). Chemical compositions of essential oil from the aerial parts of Tagetes patula L. and Tagetes erecta L. cultivated in northeastern Iran. J. Essent. Oil Bear. Plants 24, 990–997. doi: 10.1080/0972060X.2021.2005691
Moliner, C., Barros, L., Dias, M. I., López, V., Langa, E., Ferreira, I. C., et al. (2018). Edible flowers of Tagetes erecta L. as functional ingredients: phenolic composition, antioxidant and protective effects on Caenorhabditis elegans. Nutrients 10:2002. doi: 10.3390/nu10122002
Moomin, A., Russell, W. R., Knott, R. M., Scobbie, L., Mensah, K. B., Adu-Gyamfi, P. K. T., et al. (2023). Season, storage and extraction method impact on the phytochemical profile of Terminalia ivorensis. BMC Plant Biol. 23, 1–18. doi: 10.1186/s12870-023-04144-8
Morón-Ortiz, Á., Mapelli-Brahm, P., and Meléndez-Martínez, A. J. (2024). Sustainable green extraction of carotenoid pigments: innovative technologies and bio-based solvents. Antioxidants 13:239. doi: 10.3390/antiox13020239
Nwachukwu, I. D., Udenigwe, C. C., and Aluko, R. E. (2016). Lutein and zeaxanthin: production technology, bioavailability, mechanisms of action, visual function, and health claim status. Trends Food Sci. Technol. 49, 74–84. doi: 10.1016/j.tifs.2015.12.005
Ordóñez-Santos, L. E., Esparza-Estrada, J., and Vanegas-Mahecha, P. (2021). Ultrasound-assisted extraction of total carotenoids from mandarin epicarp and application as natural colorant in bakery products. Lwt 139:110598. doi: 10.1016/j.lwt.2020.110598
Padmanabha, S., and Vallikannan, B. (2018). Fatty acids modulate the efficacy of lutein in cataract prevention: assessment of oxidative and inflammatory parameters in rats. Biochem. Biophys. Res. Commun. 500, 435–442. doi: 10.1016/j.bbrc.2018.04.098
Rhama, S., and Madhavan, S. (2011). Antibacterial activity of the flavonoid, patulitrin isolated from the flowers of Tagetes erecta L. Int. J. PharmTech Res. 3, 1407–1409. Available at: http://www.sphinxsai.com/Vol.3No.3/pharm/pdf/PT=30(1407-1409)JS11.pdf
Rodrigues, D. B., Mercadante, A. Z., and Mariutti, L. R. B. (2019). Marigold carotenoids: much more than lutein esters. Food Res. Int. 119, 653–664. doi: 10.1016/j.foodres.2018.10.043
Rodríguez Roque, M. J. (2014). In vitro bioaccessibility of health-related compounds from beverages based on fruit juice, milk or soymilk: Influence of food matrix and processing : Universitat de Lleida.
Rodríguez-Roque, M. J., de Ancos, B., Sánchez-Vega, R., Sánchez-Moreno, C., Cano, M. P., Elez-Martínez, P., et al. (2016). Food matrix and processing influence on carotenoid bioaccessibility and lipophilic antioxidant activity of fruit juice-based beverages. Food Funct. 7, 380–389. doi: 10.1039/C5FO01060H
Saha, S. K., Ermis, H., and Murray, P. (2020). Marine microalgae for potential lutein production. Appl. Sci. 10:6457. doi: 10.3390/app10186457
Saini, R. K., and Keum, Y.-S. (2018). Carotenoid extraction methods: A review of recent developments. Food chemistry. 240, 90–103. doi: 10.1016/j.foodchem.2017.07.099
Shi, L., Li, W., Rahman, M. S., Al-Habsi, N., Ashokkumar, M., Dunshea, F. R., et al. (2023). Comparison of phenolic composition in date (Phoenix dactylifera L.) flesh and seeds extracted by an ultrasonic-assisted and conventional method. Int. J. Food Prop. 26, 2939–2962. doi: 10.1080/10942912.2023.2261787
Shi, L., Liu, Z., Viejo, C. G., Ahmadi, F., Dunshea, F. R., and Suleria, H. A. (2024). Comparison of phenolic composition in Australian-grown date fruit (Phoenix dactylifera L.) seeds from different varieties and ripening stages. Food Res. Int. 181:114096. doi: 10.1016/j.foodres.2024.114096
Singh, Y, Gupta, A, and Kannojia, P. (2020). Tagetes erecta (Marigold)-A review on its phytochemical and medicinal properties. Current Medical and Drug Research. 4, 1–6. Available at: https://www.researchgate.net/publication/339628097
Siriamornpun, S., Kaisoon, O., and Meeso, N. (2012). Changes in colour, antioxidant activities and carotenoids (lycopene, β-carotene, lutein) of marigold flower (Tagetes erecta L.) resulting from different drying processes. J. Funct. Foods 4, 757–766. doi: 10.1016/j.jff.2012.05.002
Šivel, M., Kráčmar, S., Fišera, M., Klejdus, B., and Kubáň, V. (2014). Lutein content in marigold flower (Tagetes erecta L.) concentrates used for production of food supplements. Czech J. Food Sci. 32, 521–525. doi: 10.17221/104/2014-CJFS
Sowbhagya, H., Sampathu, S., and Krishnamurthy, N. (2004). Natural colorant from marigold-chemistry and technology. Food Rev. Intl. 20, 33–50. doi: 10.1081/FRI-120028829
Sowbhagya, H. B., Sushma, S., Rastogi, N. K., and Naidu, M. M. (2013). Effect of pretreatments on extraction of pigment from marigold flower. J. Food Sci. Technol. 50, 122–128. doi: 10.1007/s13197-011-0313-4
Subbiah, V., Zhong, B., Nawaz, M. A., Barrow, C. J., Dunshea, F. R., and Suleria, H. A. (2020). Screening of phenolic compounds in Australian grown berries by LC-ESI-QTOF-MS/MS and determination of their antioxidant potential. Antioxidants 10:26. doi: 10.3390/antiox10010026
Suleria, H. A., Barrow, C. J., and Dunshea, F. R. (2020). Screening and characterization of phenolic compounds and their antioxidant capacity in different fruit peels. Food Secur. 9:1206. doi: 10.3390/foods9091206
Surendranath, R., Ganga, M., Jawaharlal, M., and Anitha, K. (2016). Extraction and quantification of marigold lutein using different solvent systems. Culture 19:24.
Tiwari, S., Yawale, P., and Upadhyay, N. (2022). Carotenoids: extraction strategies and potential applications for valorization of under-utilized waste biomass. Food Biosci. 48:101812. doi: 10.1016/j.fbio.2022.101812
Tungmunnithum, D., Drouet, S., Kabra, A., and Hano, C. (2020). Enrichment in antioxidant flavonoids of stamen extracts from Nymphaea lotus L. using ultrasonic-assisted extraction and macroporous resin adsorption. Antioxidants 9:576. doi: 10.3390/antiox9070576
Vural, H., Görgülü, A., and Demirkiran, A. R. (2023). The effect of application of different doses of potassium sulfate (K2SO4) on the yield and quality of marigold (Tagetes erecta L.). Akademik Ziraat Dergisi 12, 21–30. doi: 10.29278/azd.1178737
Wang, M., Tsao, R., Zhang, S., Dong, Z., Yang, R., Gong, J., et al. (2006). Antioxidant activity, mutagenicity/anti-mutagenicity, and clastogenicity/anti-clastogenicity of lutein from marigold flowers. Food Chem. Toxicol. 44, 1522–1529. doi: 10.1016/j.fct.2006.04.005
Weigel, F., Weiss, J., Decker, E. A., and McClements, D. J. (2018). Lutein-enriched emulsion-based delivery systems: influence of emulsifiers and antioxidants on physical and chemical stability. Food Chem. 242, 395–403. doi: 10.1016/j.foodchem.2017.09.060
Wu, D., Wu, J., Cheng, X., Qian, J., Wang, W., Zhang, Y., et al. (2023). A research of marigold flavonoids from marigold residues. Ind. Crop. Prod. 191:115898. doi: 10.1016/j.indcrop.2022.115898
Xavier, A. A. O., Carvajal-Lérida, I., Garrido-Fernández, J., and Pérez-Gálvez, A. (2018). In vitro bioaccessibility of lutein from cupcakes fortified with a water-soluble lutein esters formulation. J. Food Compos. Anal. 68, 60–64. doi: 10.1016/j.jfca.2017.01.015
Xavier, A. A. O., Mercadante, A. Z., Garrido-Fernandez, J., and Perez-Galvez, A. (2014). Fat content affects bioaccessibility and efficiency of enzymatic hydrolysis of lutein esters added to milk and yogurt. Food Res. Int. 65, 171–176. doi: 10.1016/j.foodres.2014.06.016
Yang, J., Li, D., Zhang, Y., Zhang, L., Liao, Z., Aihemaitijiang, S., et al. (2020). Lutein protected the retina from light induced retinal damage by inhibiting increasing oxidative stress and inflammation. J. Funct. Foods 73:104107. doi: 10.1016/j.jff.2020.104107
Youssef, H. A., Ali, S. M., Sanad, M. I., and Dawood, D. H. (2020). Chemical investigation of flavonoid, phenolic acids composition and antioxidant activity of Tagetes erecta flowers. Egypt. J. Chem. 63, 2605–2615. doi: 10.21608/ejchem.2019.19839.2197
Zhu, H., Zhang, J., Li, C., Liu, S., and Wang, L. (2020). Morinda citrifolia L. leaves extracts obtained by traditional and eco-friendly extraction solvents: relation between phenolic compositions and biological properties by multivariate analysis. Ind. Crop. Prod. 153:112586. doi: 10.1016/j.indcrop.2020.112586
Keywords: Tagetes, ultrasonification, polyphenolic compounds, carotenoids, HPLC, functional juice
Citation: Siddiqa A, Khaliq A, Mehmood T, Chughtai MFJ, Sanchez-Migallon AM, Ahsan S, Sabir A and Mohamed Ahmed IA (2025) Phytochemical profiling of Tagetes erecta L. flowers at various blooming stages through optimized extraction of bioactive compounds for the development of functional juice. Front. Sustain. Food Syst. 9:1474848. doi: 10.3389/fsufs.2025.1474848
Edited by:
U.G. Chandrika, University of Sri Jayewardenepura, Sri LankaReviewed by:
Husnain Raza, University of Copenhagen, DenmarkMarina Sajid, Northwest A&F University, China
Er Sheng Gong, Gannan Medical University, China
Ali Rıza Demirkiran, Bingol University, Türkiye
Mohamed Aamer Abubaker, Shaanxi Normal University, China
Negin Hamidi, Warsaw University of Life Sciences, Poland
Copyright © 2025 Siddiqa, Khaliq, Mehmood, Chughtai, Sanchez-Migallon, Ahsan, Sabir and Mohamed Ahmed. This is an open-access article distributed under the terms of the Creative Commons Attribution License (CC BY). The use, distribution or reproduction in other forums is permitted, provided the original author(s) and the copyright owner(s) are credited and that the original publication in this journal is cited, in accordance with accepted academic practice. No use, distribution or reproduction is permitted which does not comply with these terms.
*Correspondence: Ayesha Siddiqa, c2lkZGlxYS5hQHVuaW1sZWIuZWR1LmF1; YXllc2hhc2lkZGlxYS5mdEBnbWFpbC5jb20=; Amanullah Sabir, YW1hYW51bGxhaHNhYmlyQGdtYWlsLmNvbQ==; Isam A. Mohamed Ahmed, aWFsaUBrc3UuZWR1LnNh