 Mark Manyanga1,2,3*
 Françoise Gérard2,3Tarisayi Pedzisa1Damien Jourdain3,4,5,6Amandine Belard3,6,7Benjamine Hanyani-Mlambo1Adrien Coquereau3,8
 François Affholder3,9,10
- 1Agricultural Business Development and Economics Department, University of Zimbabwe, Harare, Zimbabwe
- 2CIRAD-ES – UMR SENS, Montpellier, France
- 3SENS, Univ Montpellier CIRAD, IRD, Université Paul Valéry Montpellier 3, Montpellier, France
- 4CIRAD- UMR G-EAU, University of Pretoria, Pretoria, South Africa
- 5G-EAU, Univ Montpellier, AgroParisTech, CIRAD, INRAE, Institut Agro, IRD, Montpellier, France
- 6Department of Agricultural Economics, Extension, and Rural Development Faculty of Natural & Agricultural Sciences, University of Pretoria, Pretoria, South Africa
- 7CIRAD, UMR G-EAU, Harare, Zimbabwe
- 8CIRAD, UMR Tetis, Montpellier, France
- 9CIRAD, UPR AIDA, Montpellier, France
- 10Faculdade de Agronomia e Engenharia Florestal, Univ Eduardo Mondlane, Maputo, Mozambique
Introduction: Approximately 70% of communal farmers in Zimbabwe live in poverty, struggling to meet basic needs and provide for their families. These farmers face significant challenges in accessing essential services and resources. This situation makes them a critical subject for study, particularly in the context of smallholder farming systems in sub-Saharan Africa. This study aims to enhance the existing body of knowledge by incorporating a participatory approach and statistical analysis to characterize smallholder farmers and examine their economic and food security status.
Methods: We employed principal component analysis (PCA) and hierarchical cluster analysis (HCA) to classify farmers based on various factors such as cultivated land, livestock ownership, family labor availability, off-farm activities, and remittance receipt. Data was collected from 248 randomly selected households across three purposively chosen wards in the Murehwa district, Zimbabwe.
Results: The analysis identified four distinct farm clusters: Cluster 1: Highly resource-constrained households, Cluster 2: Moderately resource-endowed households without off-farm income, Cluster 3: Moderately resource-endowed households with access to off-farm income, Cluster 4: Highly resource-endowed households All clusters primarily cultivated maize, their main food source, but showed significant variations in their economic and food security status. The clusters also differed in their levels of resource access, with notable distinctions in the availability of family labor and off-farm income.
Discussion: These findings highlight the need for targeted interventions that provide essential inputs, such as affordable seeds and legumes, to promote crop diversification. Additionally, the study advocates for promoting alternative income sources, such as small livestock and beekeeping, which can enhance food and economic security by reducing the reliance on crop production alone, particularly in the face of uncertain agricultural conditions. These strategies are crucial for improving the livelihoods and resilience of smallholder farmers in Zimbabwe and similar contexts in sub-Saharan Africa.
1 Introduction
The adoption of the Comprehensive Africa Agriculture Development Program (CAADP) during the African Union Summit in Malabo, Equatorial Guinea, in 2014 led to increased investments in agriculture, with the goal of achieving increasing the contribution of the sector to socio-economic transformation and eliminate hunger. The Malabo declaration came at a time when population growth increased food demand in Africa, threatening food security due to low agricultural sector performance in developing countries (Silva et al., 2023). The proposition was that, this increased investment would lead to increased production and improved livelihoods (Jayne et al., 2018). However, in 2024, a decade later, significant gaps persist in food security and economic performance especially among smallholder farmers in sub-Saharan Africa (SSA). The key strategies for CAADP targeted expanding the area under sustainable land management, improving food availability, reducing hunger, and improving agricultural research, technology dissemination and adoption. In sub-Saharan Africa, Zimbabwe is one of the most climate change-prone countries where the risks of extreme weather events affect the population, especially the poorest people, among them smallholder farmers, who are unable to cope when disasters occur. These extreme weather events include droughts, floods, cyclones and tropical storms that may contribute to maintaining poverty for most farmers who rely on rainfed agriculture.
Furthermore, the recent outbreak of COVID-19 and rising food prices, mainly due to disruptions in the food supply chain caused by the ongoing Russia-Ukraine War, also worsened the socio-economic situation in the country. All these challenges came at a time when the average maize yield in the country among smallholder farmers hardly reached 800 kg per hectare, against a potential of 1.4 ton/ha, which is the lowest performance in the region where the average ranges from 1 to 2 to ton/ha (Ritchie et al., 2023; ZIMVAC, 2023). This worrying trend is leading to low national aggregate production, import dependence, food insecurity, and widespread poverty in rural areas (Mottet et al., 2020). The major causes of this trend are climate change and variability, low soil fertility, and poor access to markets (Abegunde and Obi, 2022; Nyamasoka-magonziwa et al., 2021). In response to these challenges, government and non-governmental organizations have made significant investments in promoting agricultural intensification practices and technologies.
Smallholder farmers have not widely accepted the promoted new and improved practices (Mango et al., 2017; Pangapanga-Phiri et al., 2024; Thierfelder et al., 2024). Development and policy actors tend to assume homogeneity in the farming population, particularly with respect to the socioeconomic environment and resource endowments (Ngoma et al., 2021; Thierfelder et al., 2018; Tufa et al., 2023). We selected the Murehwa district as a study case because it is a typical area for smallholder farmers in a subhumid climate, where aridity is not necessarily the most constraining factor, and we anticipate relatively high production potential. To date, studies that have attempted to characterize smallholder farming systems in maize-based farming systems in Sub-Saharan Africa have used different methodologies (Chikowo et al., 2014; Hassall et al., 2023). These studies employed the multivariate approach to develop farm typology in Southern Africa, but they did not integrate the two approaches, an area addressed in this study. To the best of our knowledge, this is the first paper in the context of smallholder farming systems in Zimbabwe that integrated a participatory approach and statistical analysis. This study, employing the sustainable framework approach, seeks to address two research questions: (i) What are the socioeconomic constraints affecting food and economic security across different communal farm types in the Murehwa district? (ii) Is intensification and diversification a way forward for improving smallholder farmers’ economic and food security? This study provides insights for guiding the promotion and upscaling of interventions across heterogeneous smallholders using the Zimbabwe case study.
Rolling out interventions requires consideration of variability in farm and farmer characteristics since smallholder farming systems are diverse (Alvarez et al., 2018; Hammond et al., 2020; Silva et al., 2023). Agroecological factors, socioeconomic conditions, household-specific characteristics, resource endowments, and farm management practices all contribute to the high diversity of farmer conditions (Kumar et al., 2019). Thus, a detailed, pluri-disciplinary analysis at the household level is required to develop farm typologies (Whitfield et al., 2015). A farm typology is a useful approach for addressing diversity among farmers in different circumstances. Previous studies distinguished between functional and structural typology to provide a new viewpoint on the various typologies (Alvarez et al., 2014a; Alvarez et al., 2018). While functional typology examines farmers’ decision-making in their biophysical and social environments, structural typology focuses on the organization of production factors.
For this study, we mixed functional and structural typology. Furthermore, we combined the statistical and participatory approach following Tapsoba and Gérard (2025) and Alvarez et al. (2014b). We applied two multivariate statistical techniques [principal component analysis (PCA) and cluster analysis (CA)] to develop farm typologies among the 248 surveyed farm households in Zimbabwe. These two statistical techniques have proven to be the most useful tools for developing farm typologies (Alvarez et al., 2018; Alvarez et al., 2014a; Hammond et al., 2020; Mutyasira, 2020). Section 2 of the study outlines the conceptual framework, subsequently detailing the methods employed, the study area, the sampling procedure, and the analytical approach. The penultimate section presents and discusses the descriptive and statistical analysis results, while the last section presents the conclusions and policy recommendations.
2 Conceptual framework
2.1 Sustainable rural livelihoods: a conceptual framework for analysis
Scoones (1998) discussed the sustainable livelihoods framework (Figure 1), which guided this study. This framework categorizes assets into various resource categories, including natural resources, human resources, social resources, financial resources, and entrepreneurial resources. Natural resources encompass land and water; social resources are associations and social networks from which people derive support for their livelihoods; human resources are the quantity and quality of labor available for the household; and entrepreneurial resources include the ability to identify opportunities to develop new products and services. Finally, financial resources include both the cash required for the purchase of the inputs needed for production and the equipment required. We employ livelihood strategies to achieve desired livelihood outcomes, including increased income, food security, enhanced household resilience, and poverty reduction. The criterion of sustainability is highly context dependent, and in the context of smallholders, the economic dimension is of utmost priority (Lairez et al., 2020). Therefore, it is imperative that vulnerable/weaker members of society have access to improved social services, acquire assets, and are food secure. The sustainable livelihood framework links food security with the resources available to different farmers, taking into consideration local realities. The framework highlights two livelihood strategies that rural households employ to achieve sustainable livelihoods: agricultural intensification and livelihood diversification. Given the riskiness of smallholder agriculture, diversification enables the mitigation of risk and uncertainty in farming systems. This approach is applicable to smallholder farmers in Zimbabwe, who typically own less than 2 hectares of land and primarily rely on family labor to produce for subsistence and/or market surplus (Ellis and Allison, 2004).
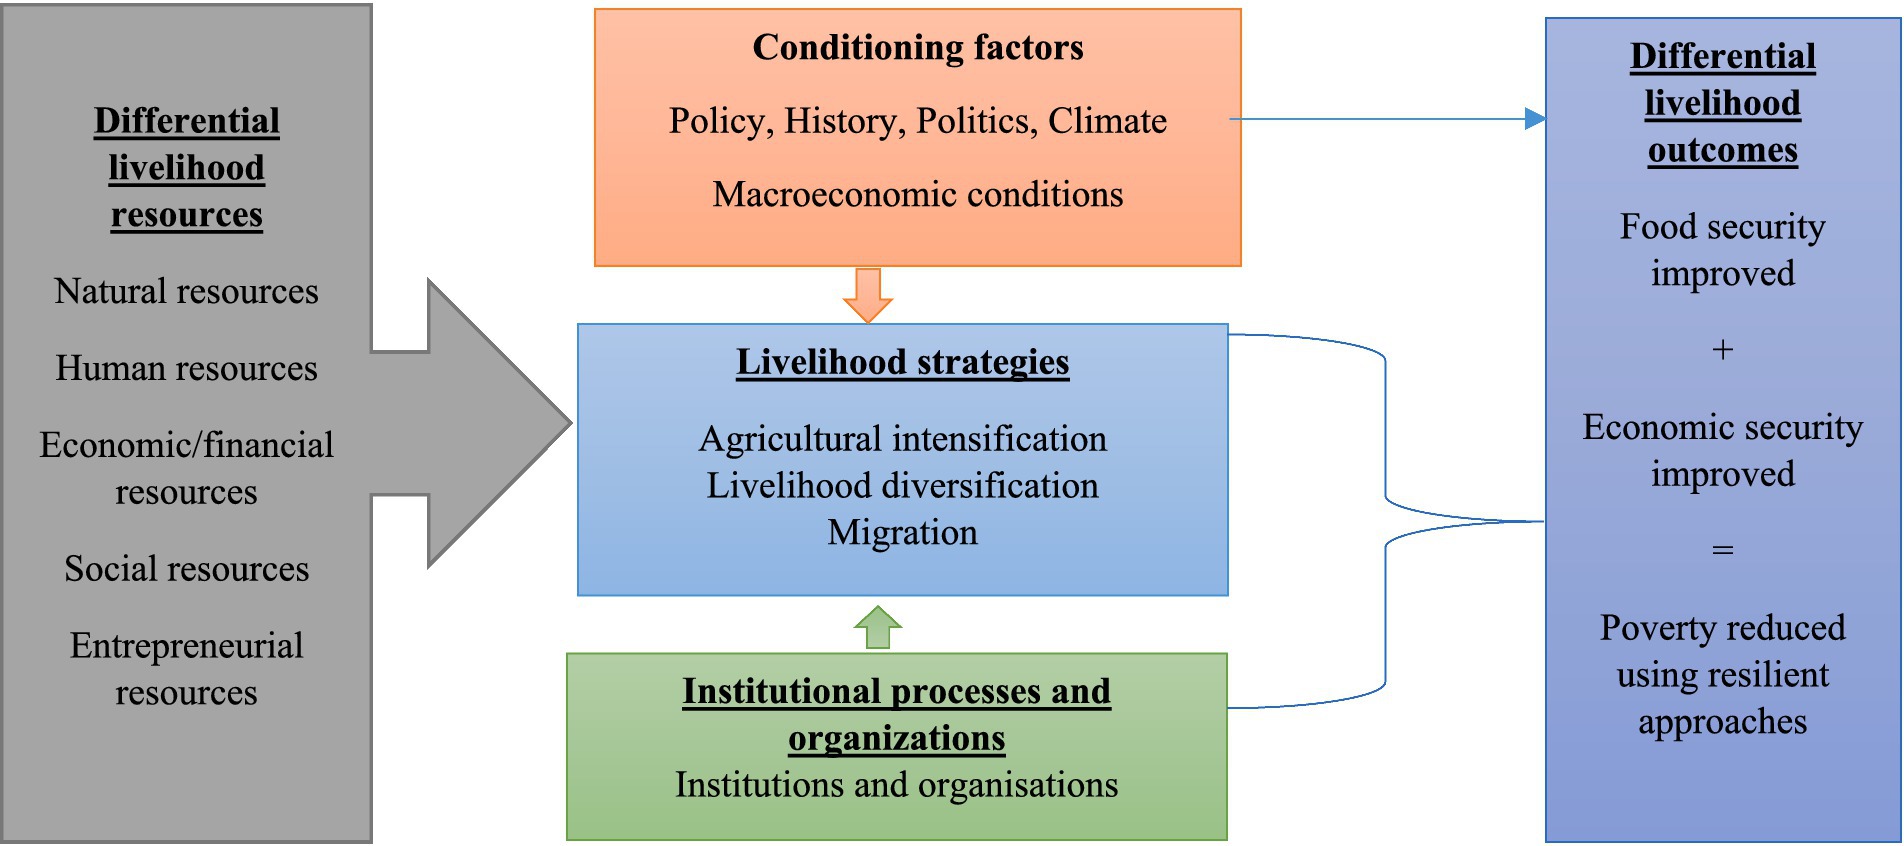
Figure 1. Sustainable livelihoods framework adapted from Scoones (1998).
3 Methodology
3.1 Study area
Murehwa district (17043’S, 31039′E, 1,300 m above sea level), located in Zimbabwe’s Mashonaland East Province, served as the study’s location (Figure 2). Maize is the principal staple food in the district and occupies more than half of the area under crop production, and the major livestock kept by farmers include cattle and goats (ZIMVAC, 2020). In this study, we focused on communal farmers1 who possess user rights to land allocated to them by traditional leadership or the government. Although these farmers have the right to farm and reside on land, they do not own it outright. The Murehwa district is in agroecological zones IIA and IIB, which receive an average rainfall of 750 to 1,000 mm per year (Mujeyi et al., 2022; Mutsamba et al., 2020). AEZ II is suitable for intensive farming and is based on maize, tobacco, cotton, and livestock production. Although the district is characterized by inherent granitic sandy soil with low fertility, it is suitable for crop production (Mutsamba et al., 2020). Agriculture is the main economic driver (54.8%) in the district, followed by the service industry (45%) and others (0.2%), e.g., vending.
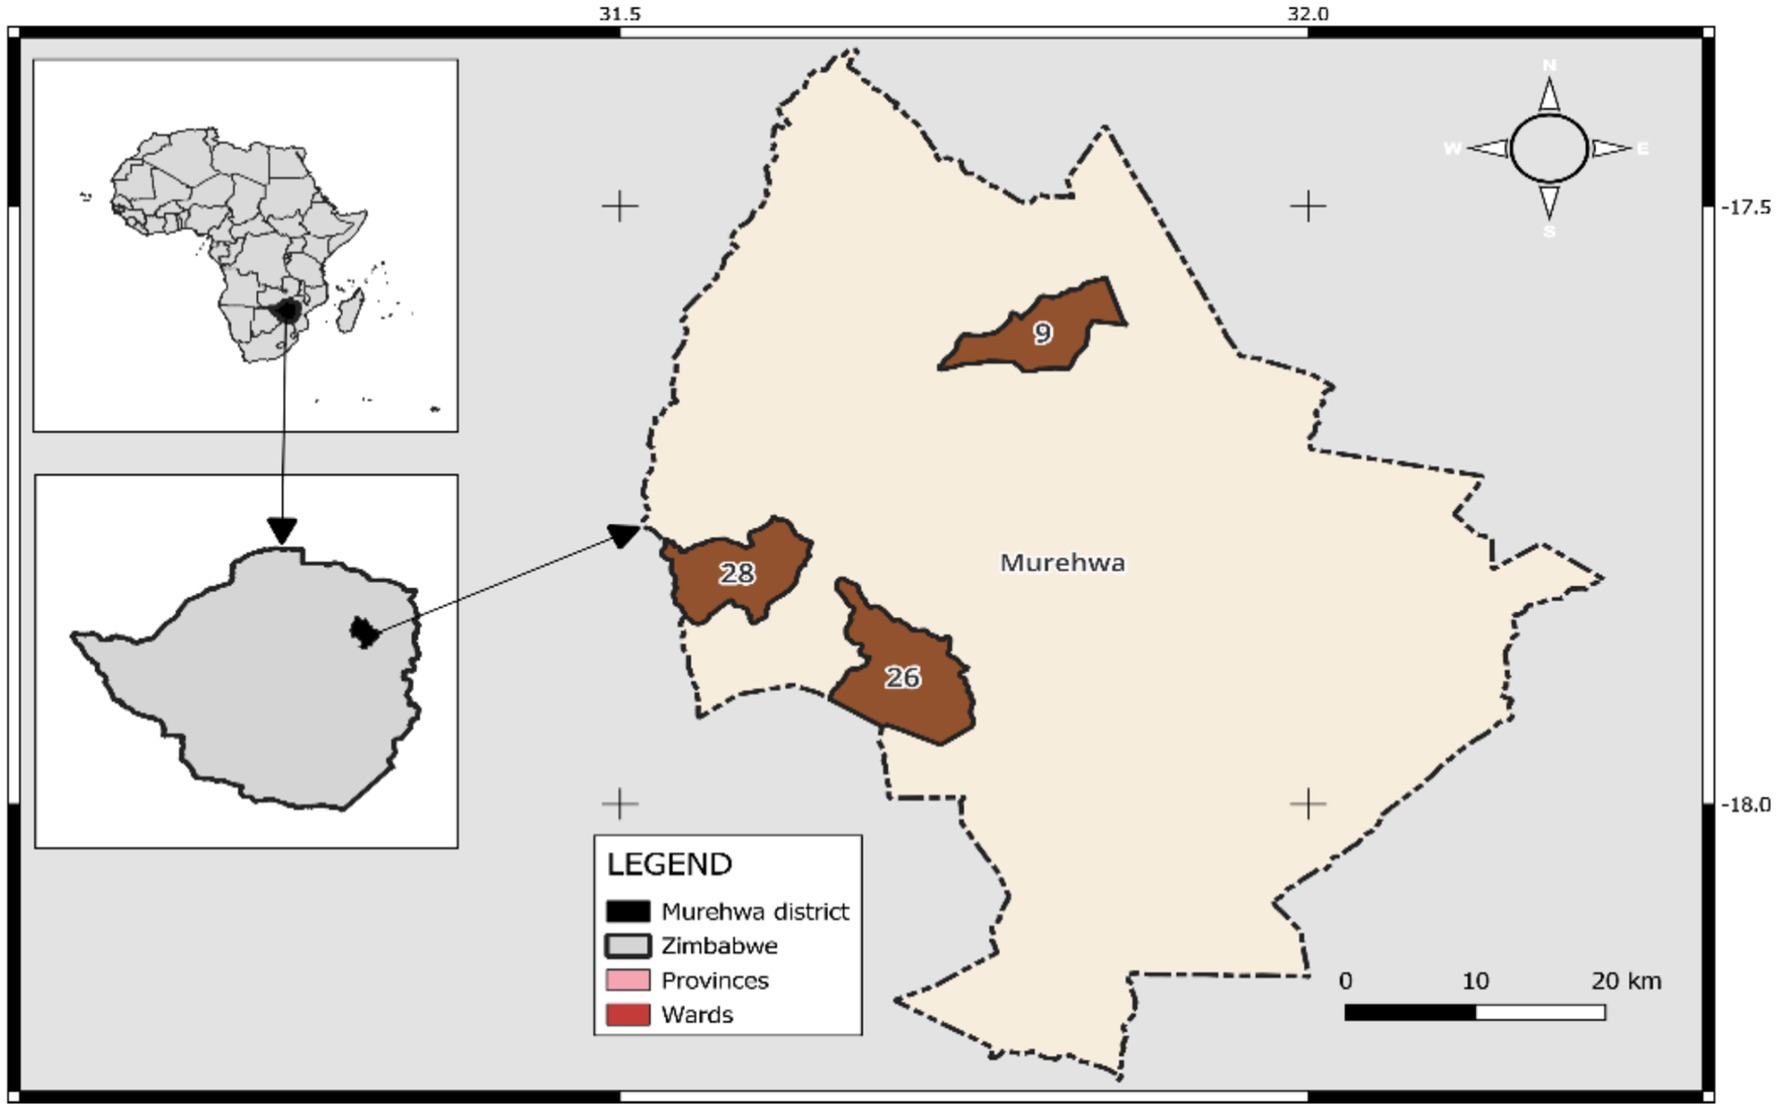
Figure 2. Location of the sampled households.
3.2 Sampling
A multistage sampling approach was used. In the first stage, we selected three wards from the total of 28 wards.2 First, we purposively selected ward 28, where resilience building through agroecological intensification practices in Zimbabwe (RAIZ) project promoted ecological farming practices. Due to the infrastructure challenges in the district such as poorly maintained roads and deteriorated bridges, we selected wards 9 and 26 based on two criteria: accessibility and the presence of development projects in the last 10 years. We defined accessibility as the ease of reaching the village using motorized transport, measured by the time taken from the ward/village center to the nearest tarred road. Ward 9 is easily accessible, whereas ward 26 is not easily accessible. Likewise, ward 9 had several development projects in the past 10 years, while ward 26 had no projects at all. In the second stage, two villages were selected from each ward, one that was accessible and the other that was not easily accessible, for a total of 6 villages. In the third stage, three villages were randomly picked from a village list, and 30 households were selected using a random walk. Our enumerators picked the 5th homestead as they walked in a village from a specified starting point with the guidance of a village head and agricultural extension workers. A replacement was made with the next homestead in cases where there was no adult person to respond to the interview questions. Overall, 248 households were interviewed (Table 1): 32% from ward 28, 33% from ward 26, and 35% from ward 9. Although our sample size was 248 households, the mixture of purposive sampling and systematic random sampling ensured we capture the variability of smallholder farmers in the study district.
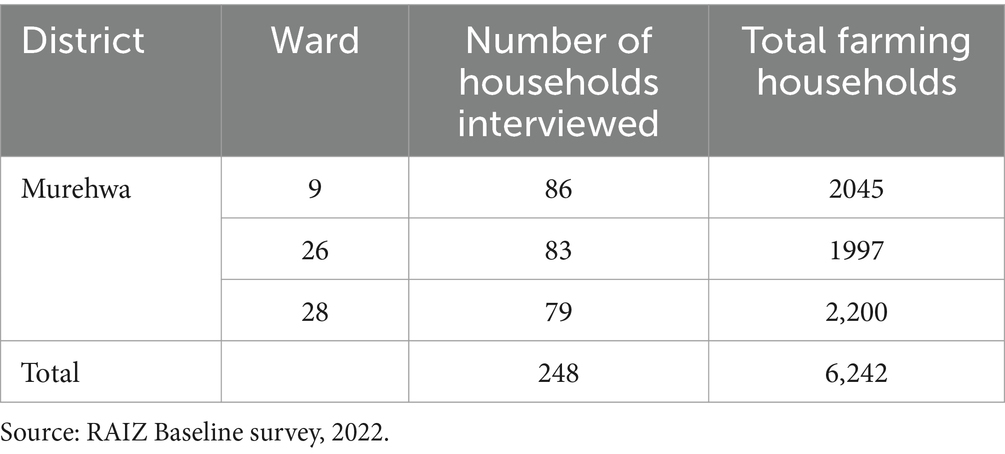
Table 1. Sample details by ward.
3.3 Data collection methods
The data were collected using a structured questionnaire between July and August 2022 and the qualitative survey to validate the results was carried out in October 2023. After the enumerator training, we contacted a one-day pre-test to check the consistency of the questions and ensure that the enumerators were comfortable translating all the questions from English to the local language. To discuss the farm typology results, six (6) focus group discussions (FGDs) with community members and six (6) key informant interviews (KIIs) with key stakeholders were held across six villages in three wards. The FGDs were split by gender to ensure active participation from all the farmers. These FGDs and KIIs constituted the participatory approach.
3.4 Multivariate analysis methodology
To identify farm clusters or socioeconomic classes, we used a two-stage multivariate analysis approach in this study that included PCA and CA. To quantify important latent constructs, we first reduced variables into a new set of components using PCA. Therefore, in order to maintain stable and non-overlapping clusters, it is crucial to reduce the number of variables in cluster analysis (Greene, 2003). The varimax approach reduced the number of highly correlated variables by rotating the chosen scale variables used to generate components into each component kept for cluster analysis (Wooldridge, 2012). Using Ward’s hierarchical approach, we conducted a cluster analysis using all of the components that were kept from PCA. To ascertain the importance of variations in cluster means and to confirm the legitimacy of the clustering process, the Kruskal-Wallis rank test was utilized (Alvarez et al., 2014b). Both structural variables, which characterize the structure of the family, and functional variables, which describe the functioning of the home, were included in the multivariate analysis (Table 2).
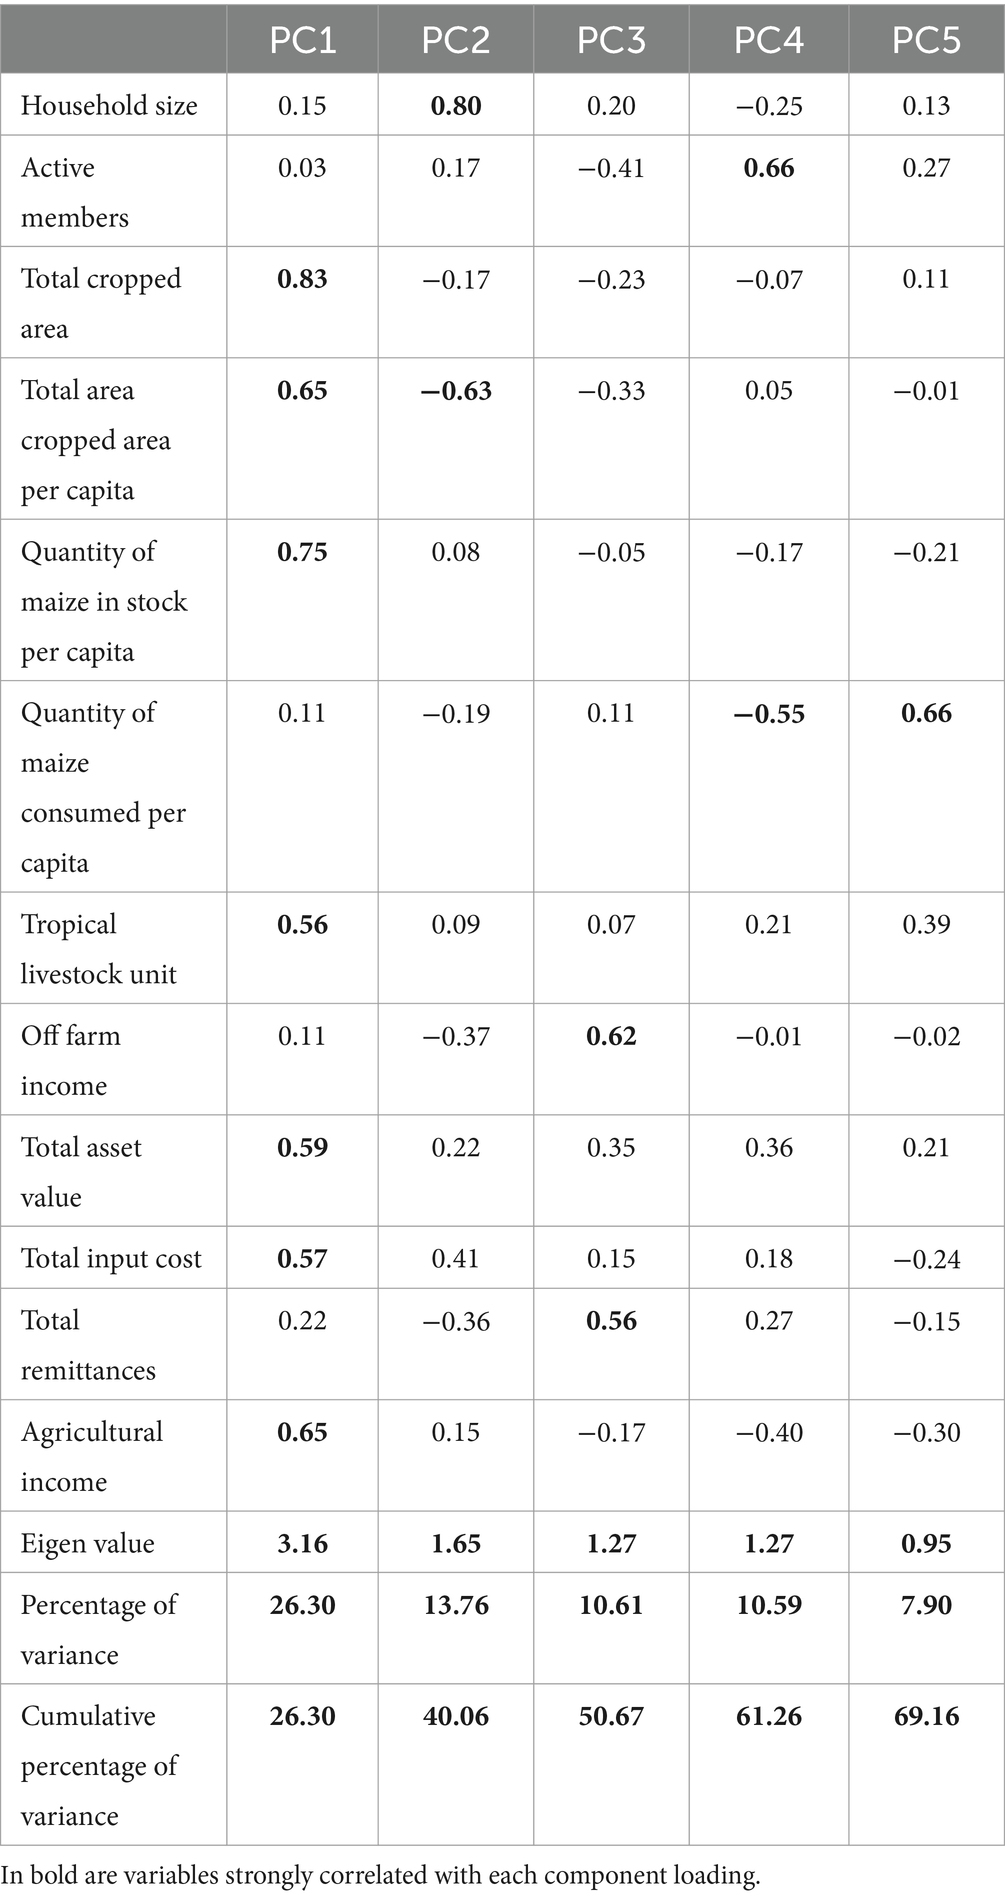
Table 2. Principal component loadings.
We determined how many principle components (PCs) to retain from the PCA based on the eigenvalue being larger than 1 (one) and the cumulative variance being greater than 60% (Spurrier, 2003). PCA was relevant to the construction of meaningful indices, as indicated by the Kaiser-Meyer-Olkin measure of sampling adequacy (KMO), which was higher than the suggested minimum of 0.50 (Alvarez et al., 2014b). Using the Bartlett’s test of sphericity, we examined whether the variables included in PCA were uncorrelated. The findings (p-value = 0.05) suggest that PCA was suitable for the data. After that, we used the Ward’s minimum-variance approach for hierarchical clustering on the principal component scores (PCA) results to find cluster 34. By comparing clusters using a sum of squares averaged across all variables, the Ward’s technique reduces within-cluster variation 14,34. Using the dendrogram form, we were able to determine the number of clusters that corresponded to our socioeconomic classes (Figure 3). The hierarchical clustering algorithm’s results indicated a four-cluster cut-off point because the dendrogram 40’s fourth and fifth bars diverge somewhat. In terms of cultivated land, animal ownership, family labor availability, and involvement in off-farm activities, the four groups that were found differed.
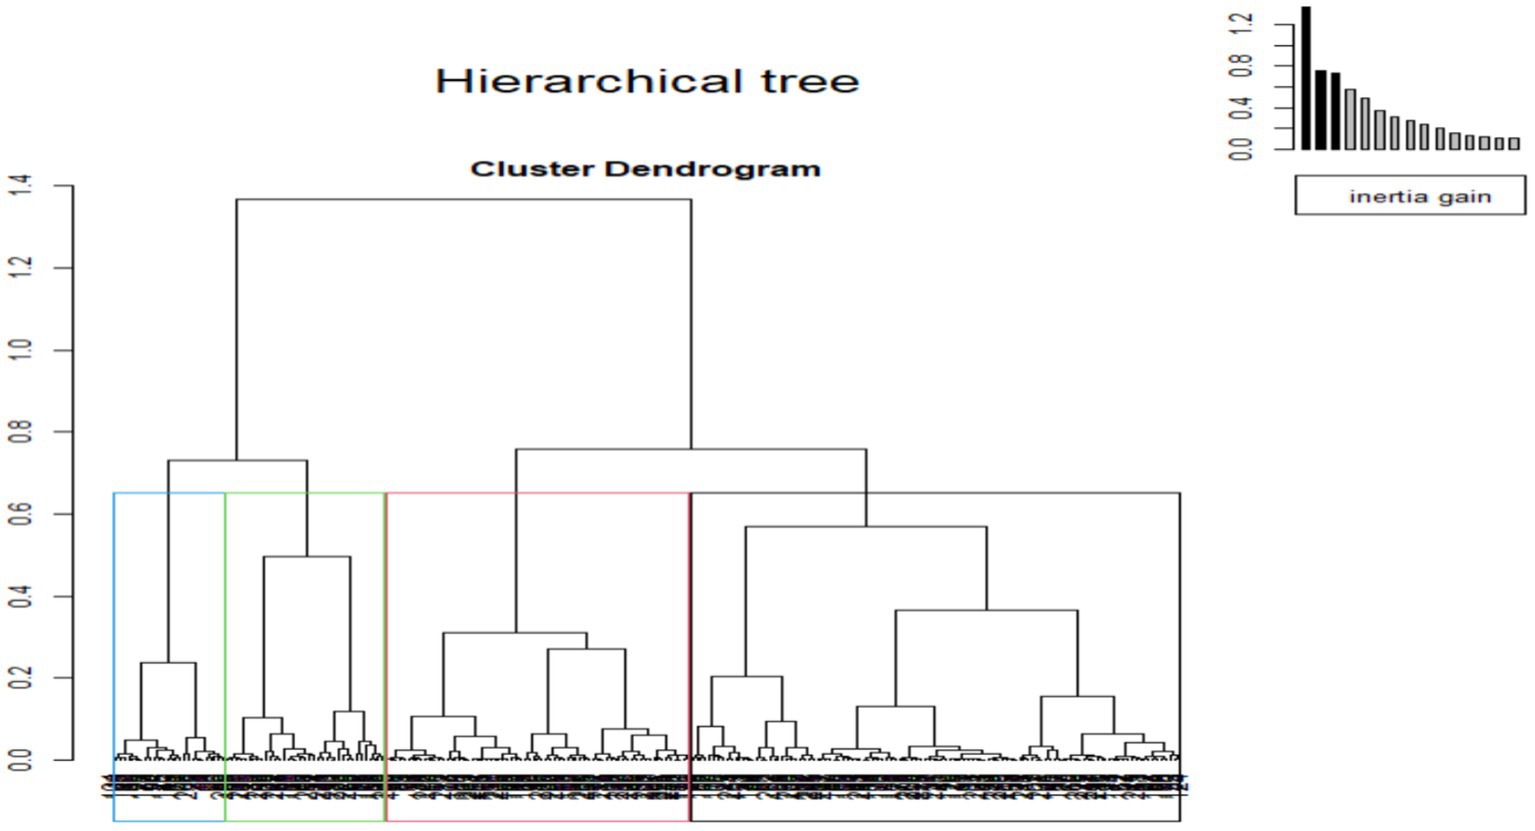
Figure 3. Dendrogram (left) and associated bar plot (right) displaying a range of cluster solutions resulting from Ward’s method of PCA.
3.5 Measurement of key variables
3.5.1 Food security measurement
Different indicators, including the household dietary diversity score (HDDS), food consumption score (FCS), and household hunger scale (HHS), measure food security (Ballard et al., 2011; Harou, 2018; Hoddinott and Yohannes, 1825; Manyanga et al., 2022). We concentrated on HHS in this study, as it serves as a household-level indicator that focuses on the food quantity aspect of food access (Coates et al., 2006). HHS measures whether the household has enough food to avoid hunger (Ballard et al., 2011; Ngoma et al., 2023). In addition, we co-constructed a threshold with farmers, based on the quantity of cereal required per capita per year and the household food self-assessment. We set the no-hunger threshold during Focus Group Discussions (FDGs) at 160 kg of maize per person per year, taking into account diversified diets and the fact that children and the elderly consume less than those who work in the fields. It permits the attainment of 2000 kcal of energy. We calculated the HHS by asking the household three questions to assess food availability over the past 30 days. The total HHS ranged from 0 to 6, signifying the degree of food insecurity, with 0 indicating little hunger and 6 indicating severe hunger. To ensure the reliability of data using this 30-day recall question, we also included a food-sufficient self-assessment question.
3.5.2 Economic security measurement
The participatory approach measured economic security by having the FGD participants discuss the annual cost per capita to meet necessities. We conducted this to validate and enhance the statistical analysis based on the sustainable livelihoods’ framework. The necessities included food, school fees, and enough money to carry out farming activities the following season without relying on aid or borrowing from family, friends, or any other sources. Households with yearly income greater than the threshold are considered economically secure, whereas those with income less than the threshold are considered economically insecure. We set the minimum monetary income for dignity at $250 per person per year, if self-consumption meets most food needs.
4 Results
4.1 Descriptive statistics
Table 3 presents the descriptive statistics of the variables included in the principal component analysis and hierarchical cluster analysis. For the whole sample, each household cultivated 0.92 hectares of land, with an average of 4 family members. Out of the total cultivated land, maize occupied 0.57 hectares, highlighting its significance as a staple crop in the country. Male-headed households (77%) with a mean age of 55 and 6 years of formal education dominated the sample. The tropical livestock unit measured an average of 9 animals, with each household owning only one cattle. This relatively small number of cattle could partly result from the outbreak of theileriosis in the past 5 years, which is known as January disease (Herald, 2023). Regarding income, on average, the household earned 39.5 USD annually from off-farm activities, 177.6 USD from remittances, and 489.7 USD from agricultural production (Table 3). This underscores the importance of remittances as a source of off-farm income. The average total value of productive and non-productive assets was USD 540. Assets included productive agricultural equipment, which reduces labor constraints. Approximately 62% practiced horticulture on an area of 0.09 hectares of land, often devoted to self-consumption, allowing some diversity in food consumption. Subsequently, the farmers had a stock of only 136 kilograms of maize per capita, and they consumed 35 kilograms per capita of the total harvested quantity. The farmers reported these quantities in August, approximately 3 months after harvest in a normal year (Table 3).
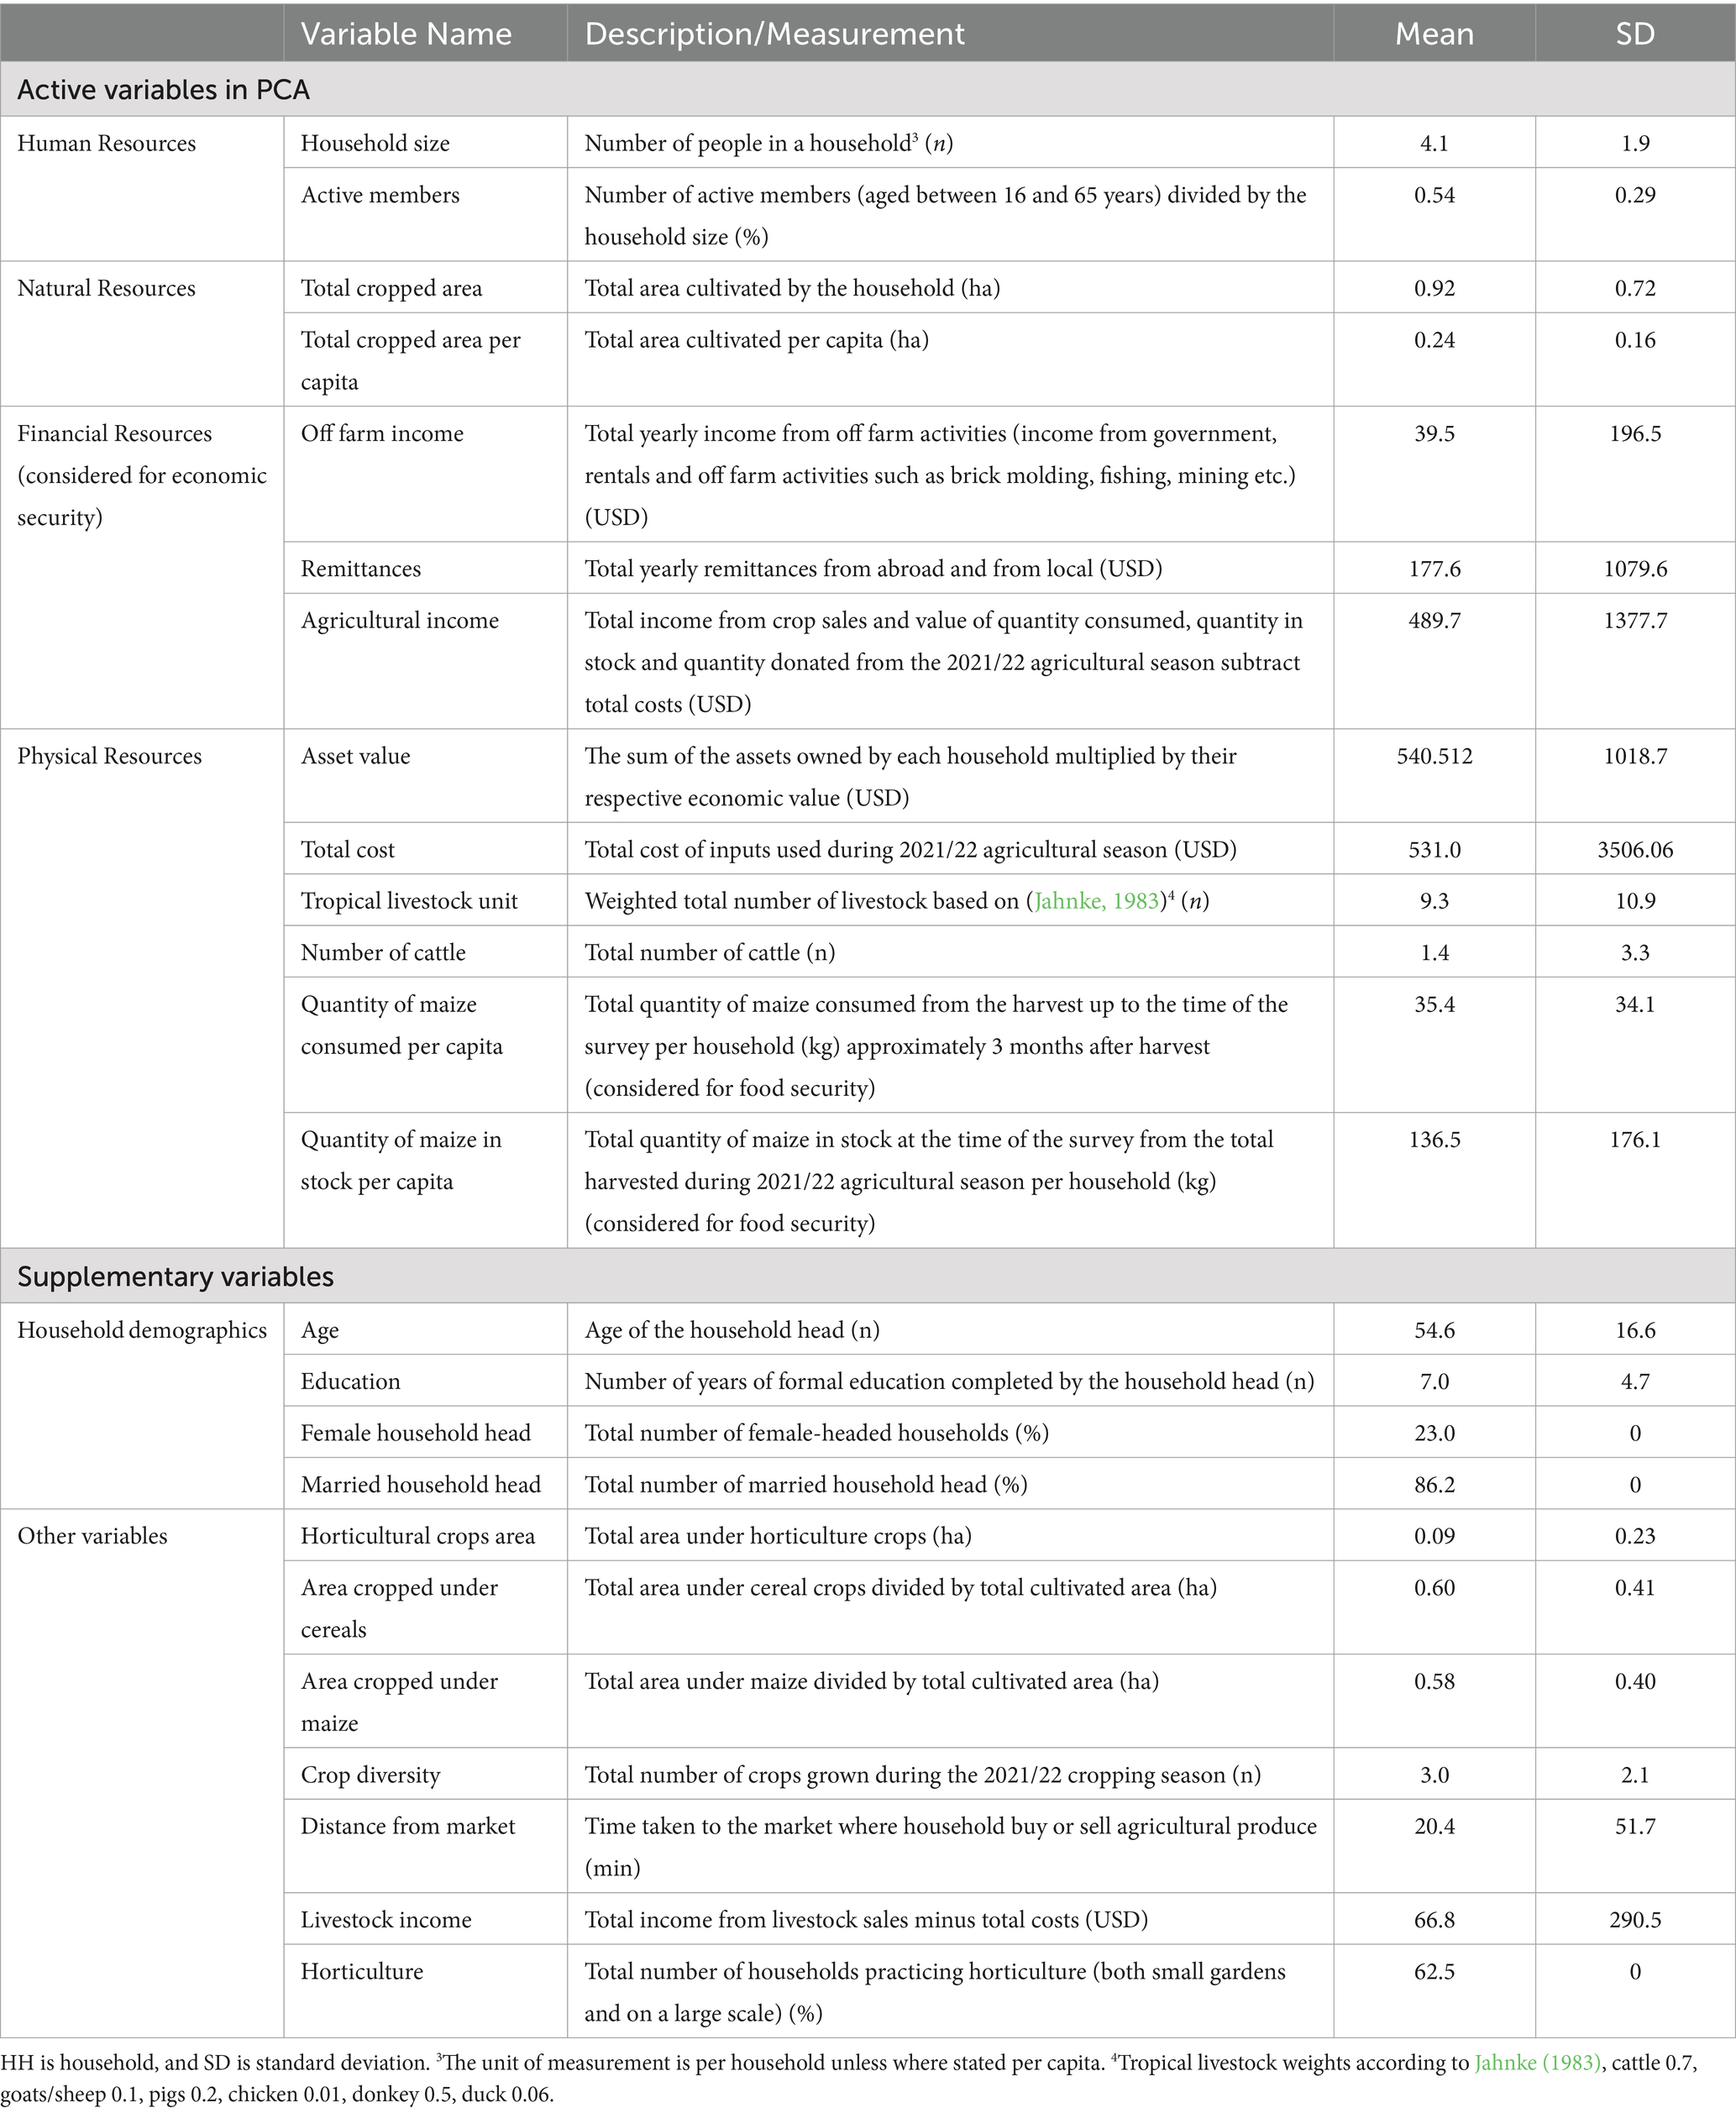
Table 3. Variable descriptions, measurements and summary statistics.
4.2 Emerging farmer classification profiles from statistical analysis
We identified four farm clusters, with variations among members in terms of cultivated land, livestock ownership, family labor availability, engagement in off-farm activities, and remittance receipts (Table 4). Only 10% of the farmers guaranteed their economic security, while the remaining three-quarters faced severe challenges in terms of economic and sometimes even food security. A lack of access to resources (equipment and inputs) was the main factor explaining farmer situations and calls for well-designed policies. The subsequent section provides a comprehensive narrative of these farmer classification profiles.
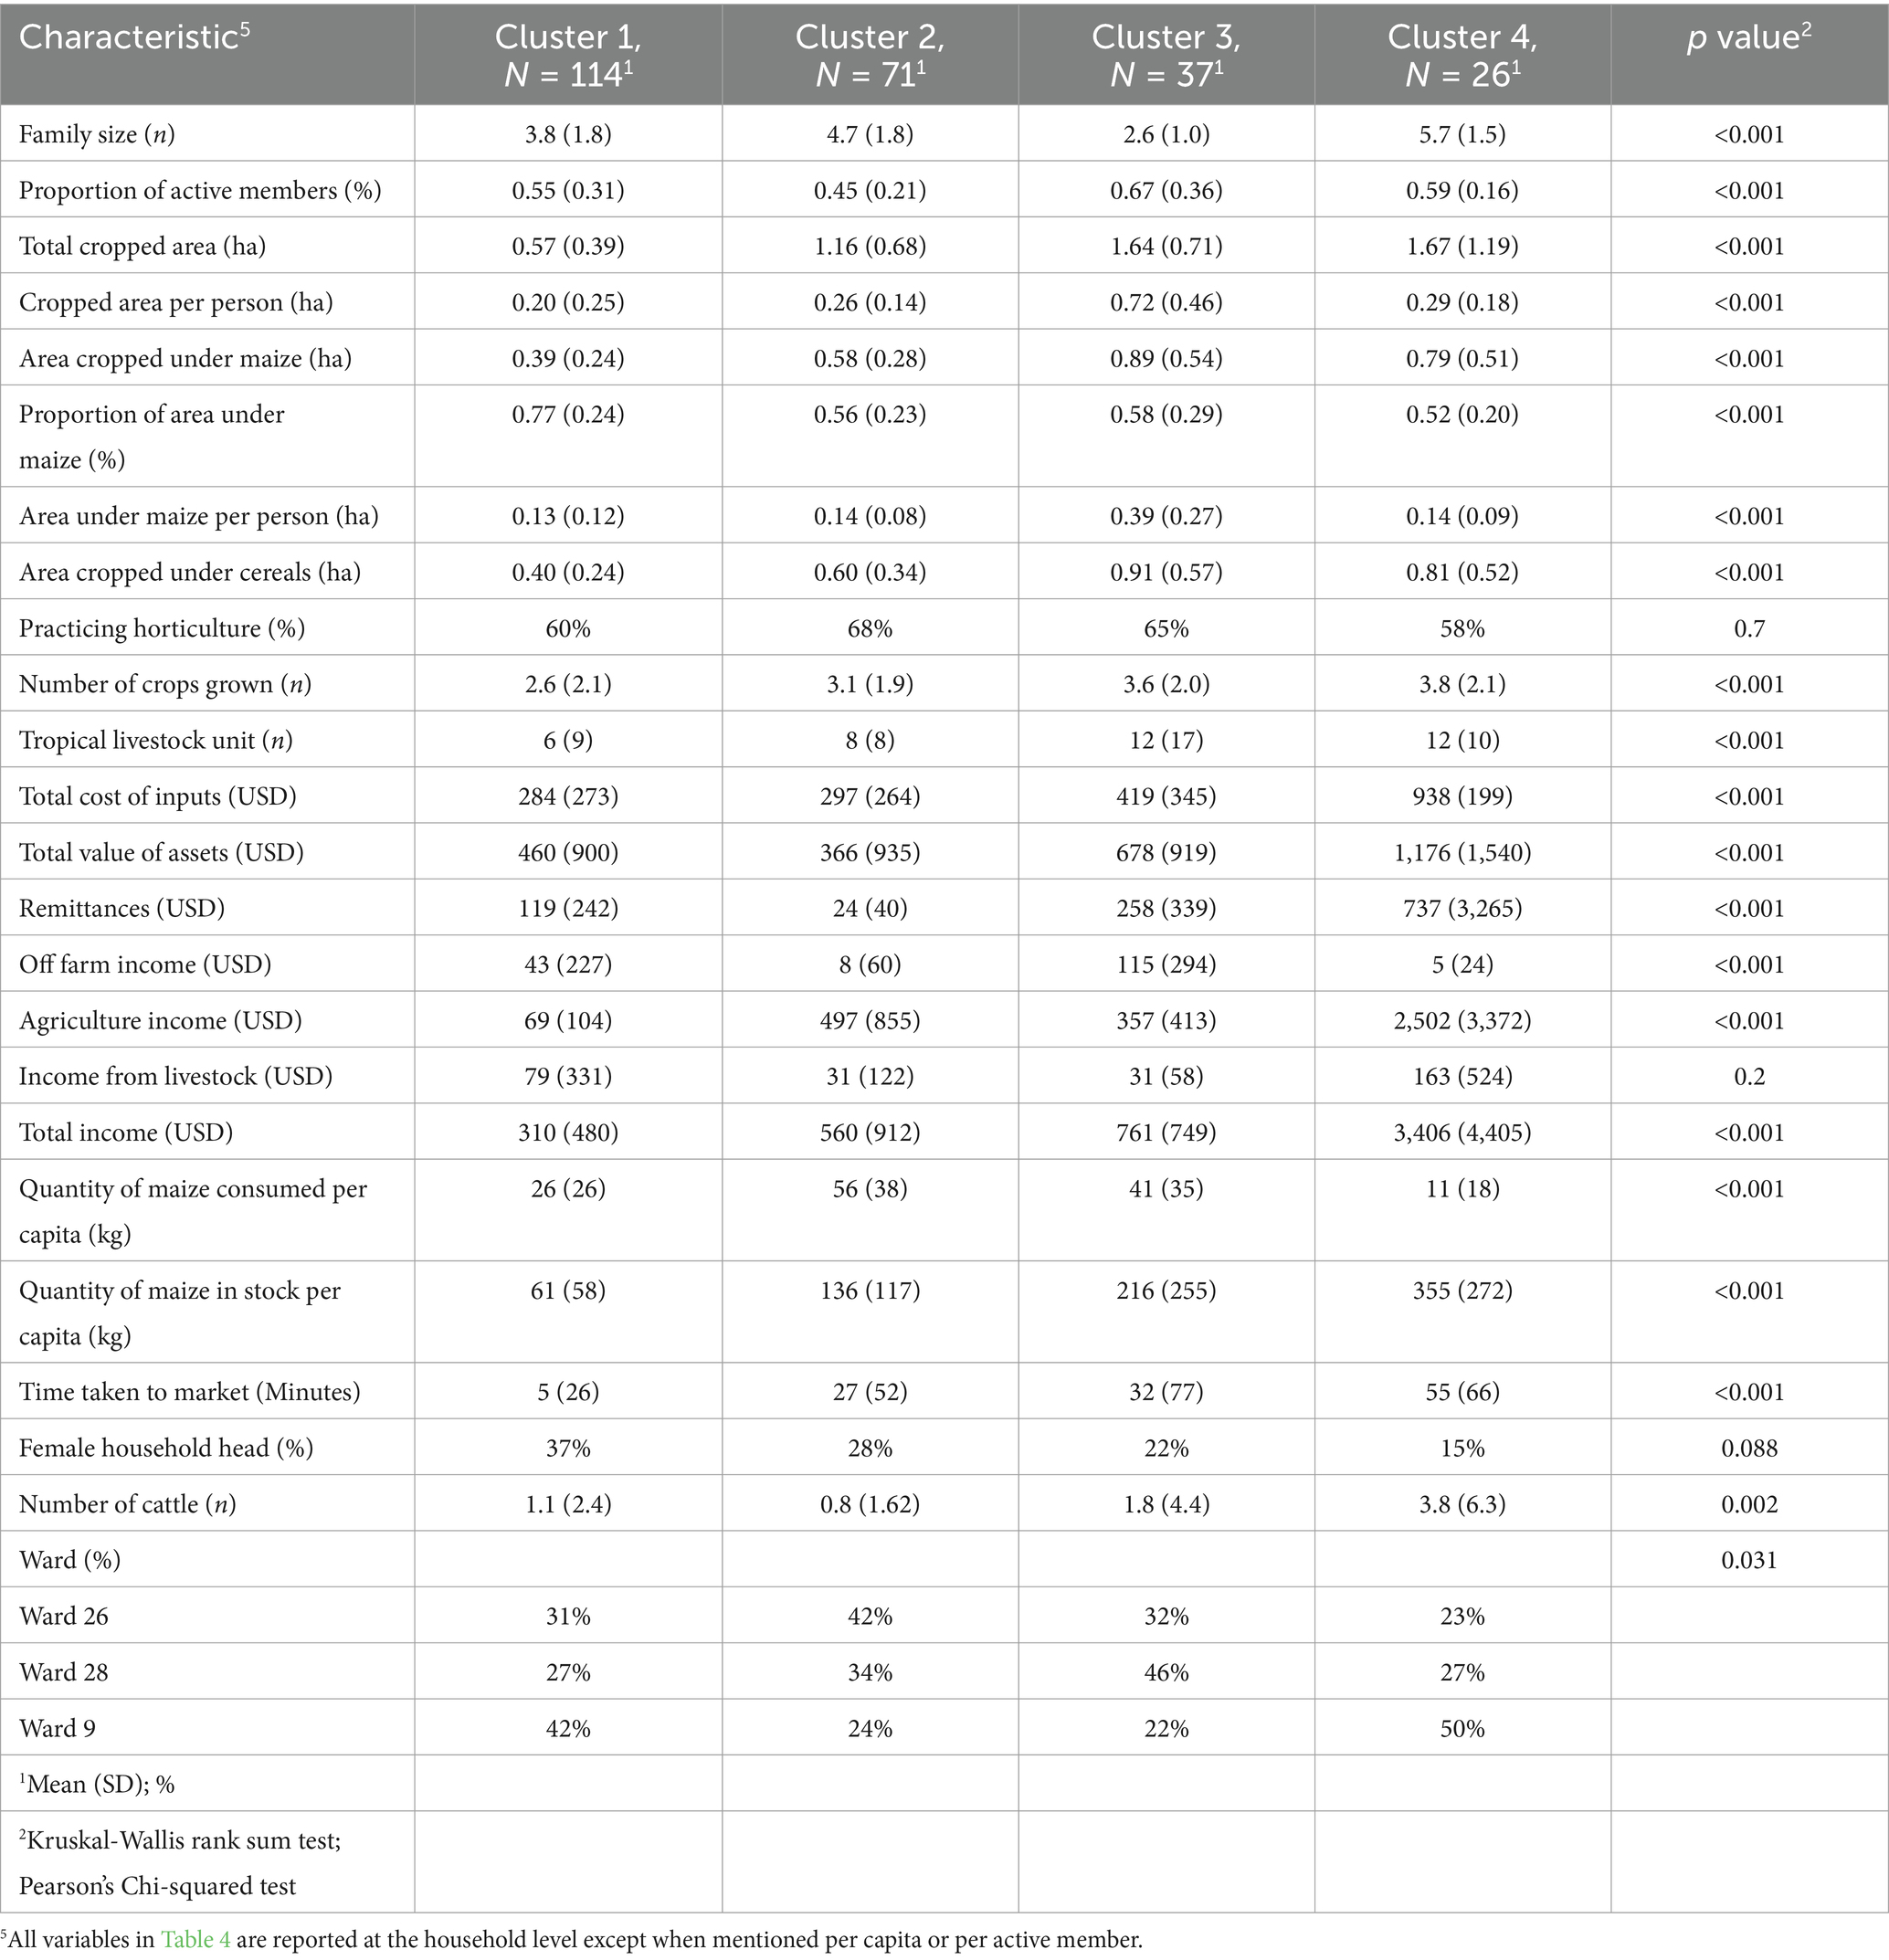
Table 4. Emerging farmer classification profiles.
4.2.1 Highly resource-strapped households
Cluster 1, known as “Resource-Strapped Households” (RSH), consisted of 46% of households with an average of four members, of which 55% were active family members (i.e aged between 16 and 65 years) (Table 4). This RSH group faces extensive economic challenges and is the most financially vulnerable among the sampled farming households, averaging a yearly income of less than USD 100 per person. The relatively small area cultivated, which allocates approximately 77% of the land to maize cultivation, constrains their agricultural practices. A shortage of animal draught power, a shortage of labor, cash constraints, and drought conditions in the study area are some of the main challenges faced by the RSH, as they own very little livestock with only one cattle. This can be some of the reasons why they left more than half of their land fallow, as highlighted during the FDGs, and cultivated the smallest area (0.57 ha) compared to the other clusters. Considering the average yield and the number of family members, the area required for maize cultivation to feed the family in cluster 1 was 0.78 ha, while the farmers were only dedicating 0.39 ha to the crop. Thus, farmers in this cluster have little capacity to feed their families. The challenge lies in diversifying, as their production primarily focuses on consumption, leaving no room for other crops.
The average maize yield for the whole cluster was 769 kg/ha relative to the total sample average of 1,021 kg/ha. Thus, household food condition self-assessments confirmed the food insecurity status of the group, as three-quarters declared that they faced food shortages. Among those facing food shortages, 10% were facing severe hunger, as shown by the calculated household hunger scale (HHS). The cluster demonstrates a food deficit of 73 kg/person/year due to the average annual availability of 87 kg of maize per capita, which is significantly less than the required 160 kg/person/year. These findings concur with our preceding argument that these farmers are food insecure. Consequently, the value of productive assets indicates that this cluster has the least amount of assets, making it the least resource-endowed group, which makes sense given that resources are a sign of wealth (Mutyasira, 2020; Shonhe and Mtapuri, 2020). All the above background supports the preceding argument that the cluster consists of the poorest farmers who find it difficult to survive due to their economic situation. The group is economically insecure, as shown by the income per capita, which falls short of the minimum monetary requirement per person per year. Thus, a relatively large group of cluster members (45%) do not engage in any off-farm income activities, and their economic situation is further exacerbated by remittances. The share of female-headed households is greater in this cluster than in other clusters. These findings concur with those of Mutyasira (2020), who argued that female-headed households do not have control over many resources such as their male counterparts and that a third of the cluster consists of female-headed households. Furthermore, men dominate some off-farm income activities in rural areas because they perceive them as male jobs Mutyasira (2020).
4.2.2 Economically insecure households without off-farm activities
Cluster 2 comprised households moderately endowed with resources but lacking off-farm endeavors. It accounted for 29% of the sampled farming households, each consisting of an average household size of five members. The average yearly income was approximately USD 120 per person (23% higher than that of resource-strapped farmers). The farmers in Cluster 2 cultivated a larger area than did those in the HRS. The farmers in this cluster were diversifying with groundnuts, sugar beans, and horticultural crops, which are very important for food and nutrition security. Only 14% of the farmers in this cluster were cultivating tobacco, primarily due to its high capital investment requirements and the cluster’s relatively low productive asset value. The average maize yield in this cluster was 1.2 tons/ha. As a result, 20% of farmers in this group reported experiencing occasional food shortages, resulting in moderate hunger, from one harvest season to the next. On average, the total quantity of maize in stock plus already consumed maize is relatively greater than the required 160 kg/person/year to avoid hunger. While the group possessed a larger number of tropical livestock units compared to cluster 1, nearly all of them lacked the necessary draught power for land preparation. Thus, these farmers have more other livestock. FGD participants highlighted that more than half (50%) of households in the district lost their cattle due to January disease in the 2020/21 season. Additionally, the group can mobilize resources, resulting in a relatively higher agricultural income (USD 497) than that of Cluster 1. Access to agricultural income compensated for the lack of nonfarm income, such as off-farm income and remittances, in this cluster. Despite not guaranteeing their economic security, the farmers in cluster 2 had a relatively greater total income than those in cluster 1.
4.2.3 Moderately vulnerable households with off-farm activities
The cluster comprised 15% of the sampled farming households. The farmers in this cluster had the smallest family size of 3 members and an income of USD 302 per capita. The cluster is characterized by 1.64 hectares of land under cultivation, and 58% (0.89 ha) of that cultivated area is under maize cultivation. Despite having the smallest families, the group was able to cultivate larger land areas due to their access to draught power from their own livestock and their capacity to hire from other farmers. FGD participants agreed that approximately 33% of the land was under cultivation in the 2020/21 season, with almost two-thirds of the land remaining fallow. Furthermore, these farmers were diversifying their cropping system, as shown by the larger areas under tobacco and horticultural crops. They demonstrate their financial stability and willingness to take risks, as evidenced by their relatively high investments in agricultural inputs, despite the high cost of these inputs. These farmers possessed a greater number of livestock, with an average of two cattle dedicated to tilling. Members of the cluster had an average maize yield of 894 kg/ha. As such, the cluster has ensured food security, as shown by the self-assessment of food conditions. Farmers in this cluster had enough food, as shown by the total quantity of maize in stock and the quantity of maize consumed, which is greater than the 160 kg/year/person required to avoid hunger. Adding agricultural income and nonfarm income shows that the group has ensured economic security when the total income per capita is greater than the threshold of USD 250. The presence of off-farm income in this cluster ensured economic security.
4.2.4 Better resource-endowed households
The cluster consisted of 10% of the well-resourced and endowed farm households, with an average income of USD 617 per capita. Each household boasts the largest cultivated land of 1.67 ha, with an average household size of 6 members. Nearly half of the cultivated area was under maize cultivation, while 42% of the farmers grew tobacco, and only 25% grew groundnuts. The cluster members employed crop and livestock diversification as a strategy to minimize risk. Members of this cluster had the greatest number of livestock compared to the other three clusters, as shown by the tropical livestock unit. FGD participants indicated that wealthier farmers invest in livestock since it is a form of wealth and store of value, especially with the instability in the exchange rate and the lack of trust in the banking system due to past economic experiences discouraging saving money in banks. Furthermore, the farmers had an average of 4 cattle, indicating that they might have access to animal manure and much-needed animal draught power. The calculated household hunger scale and household self-assessment of food conditions confirmed the self-sufficient food of these farmers, whose average maize yield was 1.9 tonnes/ha. Furthermore, the cluster possessed and consumed a total of 355 kg of maize per capita from the total harvest, surpassing the required 160 kg per capita to prevent hunger. Cluster 4 has guaranteed economic security, as shown by the income per capita, which is greater than the set threshold of USD 250 per person/year.
4.3 Heterogeneity among farmers in similar circumstances
Looking at intra cluster variability (see Appendix A), farmers cultivating groundnuts in cluster 1 exhibited higher agricultural income compared to those not engaged in groundnut cultivation. Additionally, growing groundnuts was associated with larger agricultural areas and higher livestock numbers compared those without groundnuts. Conversely, there is minimal difference between farmers who are engaged in horticulture and those who are not in terms of total cultivated area, household size, tropical livestock units, and agricultural income. In fact, this horticultural area, also known as the garden, primarily serves to enhance the availability of food for the family’s needs. Therefore, its impact is not on income, but rather on food security. In cluster 2, horticultural farmers cultivated larger areas compared to their counterparts. Farmers cultivating tobacco experienced higher agricultural income compared to those who did not engage in tobacco cultivation. An analysis of farmers in cluster 3 revealed that those cultivating groundnuts exhibited higher incomes, increased livestock, and larger cultivated areas compared to their counterparts not engaged in groundnut farming. Cluster 4 exhibits minimal diversity, primarily due to farmers who do not diversify their crop production, supplementing their agricultural income with off-farm income.
5 Discussion
5.1 Strategies for improving household food and economic security
We compared clusters 1, 2 and 3 with cluster 4. The aim was to identify strategies that farmers in situations of economic insecurity can use to achieve economic security. We highlighted that the four important sources of income for farmers in Murehwa District are agriculture, livestock, remittances and off-farm income activities. Figure 4 shows the share of income sources by cluster.
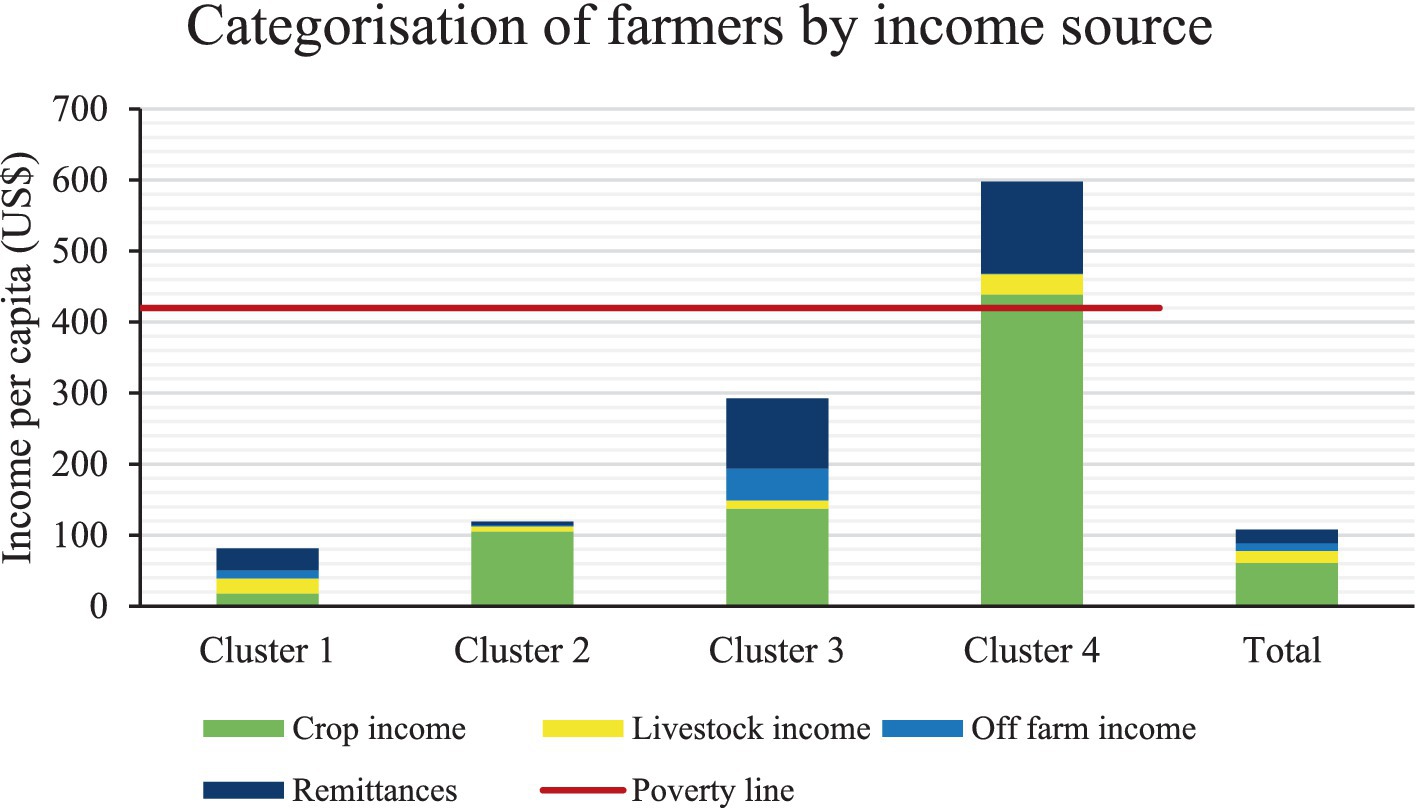
Figure 4. Share of income sources by cluster.
According to ZIMSTATS (2022), 20 USD is required for food, and 15 USD for other necessities is required by a person/month, translating to 420 USD/person/year. Only farmers in cluster 4 obtained income above the poverty datum USD. Compared to the threshold constructed with farmers, clusters 3 and 4 surpassed the minimum monetary requirement for dignity (250 USD/person/year). Agricultural income is a very important source of income and a means of fighting poverty and underdevelopment in communal areas (Mutami, 2015). Thus, the strategies discussed in the next subsections seek to answer the following question: how can household food and economic security improve, especially for the poorest?
5.1.1 Intensifying maize production
Indeed, maize yields determine the area available for diversification and the ability of the farming system to feed the family (Table 5). Looking at the average maize yields per cluster, the zero-hunger criterion required approximately half the area for cluster 4 compared to cluster 1 (0.47 versus 0.78). Therefore, since Cluster 1 farmers have already left half of their arable land fallow, they should either expand the area under maize or intensify their farming practices. Farmers face resource constraints and require assistance with farming inputs to facilitate intensification. The survey found that maize yields were different across clusters. Two elements determined yields: (i) the technical itinerary, i.e., farmers’ practices and inputs, such as fertilizer, and (ii) the risk, i.e., yield variation due to climate, pests, and other random events that significantly affect yields.
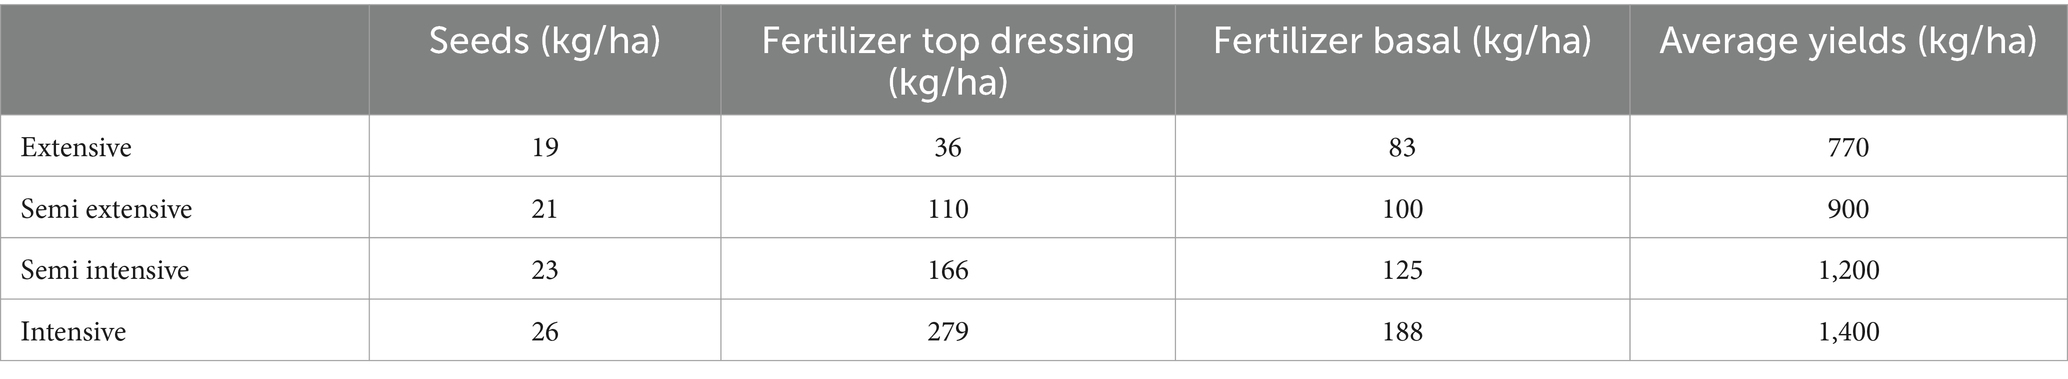
Table 5. Crop management systems employed by farmers.
We determined the crop management systems (Table 5) by comparing the input application rates declared by the surveyed farmers with the recommended rates from the Ministry of Lands, Agriculture, Fisheries, Water, and Rural Development (MLAFRD). The Ministry of Lands Agriculture, Fisheries, Water, and Rural Development (MLAFRD) recommends applying 200 kg/ha of basal fertilizer, 300 kg/ha of top-dressing fertilizer, and 25 kg/ha of seed per hectare for maize, with the expectation of yielding approximately 3 tonnes of maize, ceteris paribus (Source: Windmill Pvt. Ltd., Production requirements for 1 hectare of maize). We determined crop management systems based on the input levels used during the 2021/22 cropping season, classifying farmers who applied less than 100 kg/ha of each fertilizer as having extensive farming techniques. We categorize farmers applying fertilizers between 100 kg/ha and 124 kg/ha as semi-extensive farming. Farmers applying fertilizers between 124 kg/ha and 187 kg/ha fall into the semi-intensive category, while those applying more than 188 kg/ha fall into the intensive farming category. The household survey data and discussions with agronomists’ guide and inform these thresholds. According to the survey data, there is evidence that intensive techniques result in higher yields. Our results underlined that Cluster 4 households have higher agricultural income than other clusters, mainly because they have better yields and more than 60% employ intensive and semi-intensive techniques in their maize plots. On the other hand, clusters 1, 2, and 3 mainly used extensive or semi extensive techniques, and the yield varied since it depended on a set of uncontrolled factors (risk). As suggested by Amadu et al. (2020) technical itineraries adopted are heterogeneous depending on resource endowments.
5.1.2 Diversified cropping systems
Crop diversification is a way of increasing income (Table 6). Thus, tobacco had the highest gross margin (3,927 USD/ha), followed by Bambara nuts (1,008 USD/ha) and groundnuts (718 USD/ha). Despite high gross margins and low use of purchased inputs (Bambara nuts and groundnuts), diversification into these crops is not an easier option for farmers. These crops are planted on small plots because seed is a constraint, as farmers mainly use saved seed, which limits the scope for increasing income by expanding the area under legumes (Makuvaro et al., 2017; Nkomo et al., 2020). Only 40% of the poorest households were diversifying with legume crops, as evidenced by the survey data. For most farmers to diversify into groundnuts and Bambara nuts, there is a need to ease the challenges of accessing seed markets. Concurrently, community seed banks and seed festivals enhance seed selection and multiplication for leguminous crop seeds. Pangapanga-Phiri et al. (2024), endorse this, emphasizing the significance of fortifying farmer groups to streamline farmers’ access to leguminous crop seeds. Farmer groups act as a means of sharing knowledge and information.
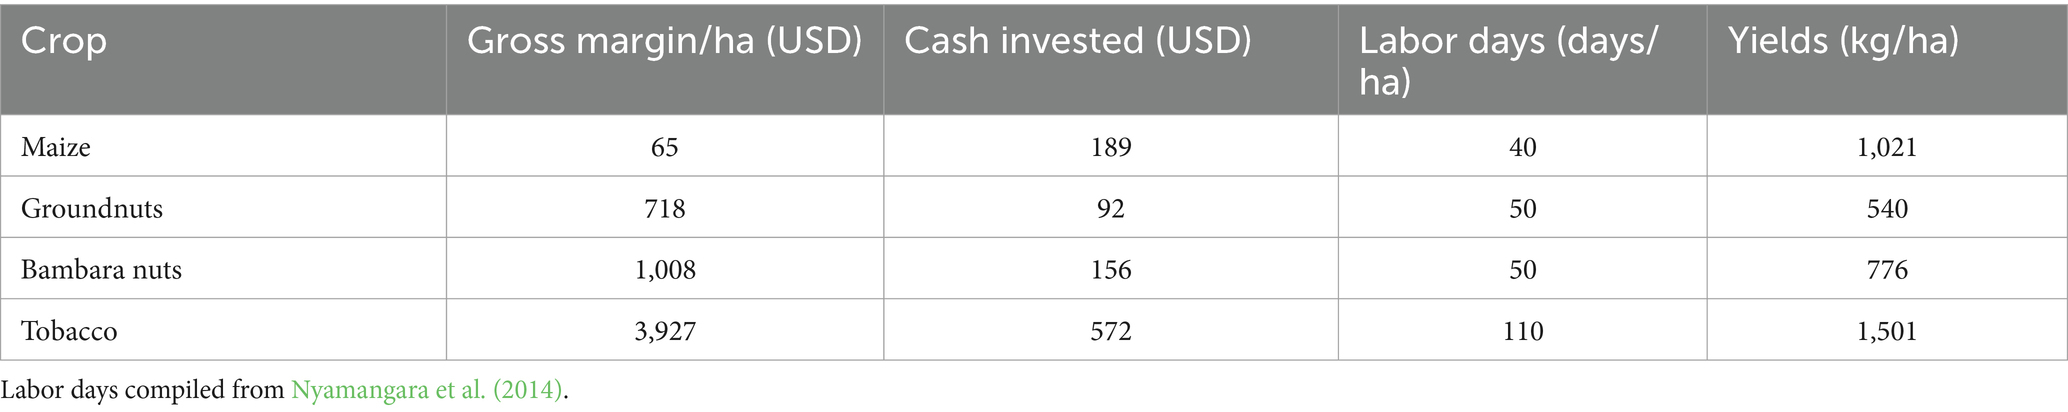
Table 6. Gross margin analysis.
Despite having the highest gross margin, tobacco faces numerous challenges and constraints. These include the high investment costs required for seedbed preparation, input costs (fertilizers, chemicals, fuel for curing tobacco), high labor requirements (seedbed preparation, seedlings, transplanting, harvesting, curing, and grading), high levels of technical skills and knowledge required, and the high cost of infrastructure (curing barns). Farmers in Cluster 1 already face financial constraints, as their average income is only 310 USD, while cultivating a hectare of tobacco requires a minimum cash investment of 572 USD. During FGDs, it was revealed that addressing the above mentioned liquidity constraints can incentivize farmers to engage in tobacco production.
5.1.3 Increasing livestock activities
In the focus group discussions, participants highly recommended that they need to focus on restocking livestock such as cattle and goats. Cattle provide draught power, and a minimum of two cattle are required for tillage purposes. Attaining this level of cattle ownership can significantly ease the process of land preparation, allowing timely planting and cultivation of larger plots. In cluster 4, half of the households owned at least 2 cattle, and this percentage decreased to only 20% of the farmers in the other clusters. Conversely, goats contribute protein to the household diet and can generate income through their sale. Some of the challenges hindering cattle ownership among smallholder farmers are disease outbreaks, a lack of feed resources, and poor grazing land management (Melesse et al., 2023; Murendo et al., 2019). Thus, households can maximize their shift from crop-based to mixed crop-livestock-based production, especially for small livestock. Additionally, the FGD participants included poultry and rabbits, which do not require high investment, as alternatives to large animals. Poultry and rabbits require less capital, have faster breeding cycles, and serve as a source of meat and eggs for the family, with the option to sell the excess for income. To support livestock farming, pasture management through fodder cropping can also increase incomes for farmers.
5.1.4 Relying on nonfarm income
Across the clusters, there is diversity regarding off-farm income activities and remittance receipt. Gérard et al. (2011) argued that households with secure access to off-farm income are less reluctant to handle risks in agricultural activities because their needs are met by nonfarm income. While diversification and off-farm income exist, Cluster 1 farmers face challenges in terms of labor needs and access to cash. The farmers in wards far from the city center highlighted that income from off-farm activities is difficult for them to obtain. Another main contributor to nonfarm income is remittances. This is when some members of the households are working outside the farm and send money back home (Murapiro et al., 2023). Remittances offer benefits such as income for purchasing inputs and hiring farm labor. In addition, farmers can make better use of off-farm income to process and sell value-added products from their harvests. For instance, turning groundnuts into peanut butter or vegetables into pickles can increase profit margins, especially for women-headed households. Households can then effectively use their off-farm income to improve their livelihoods and achieve greater food security.
6 Conclusion and recommendations
This study aims to identify strategies for enhancing resource access, a crucial factor in boosting agricultural productivity in alignment with sustainable development goals 1 (zero hunger) and 2 (no poverty). We applied principal component analysis and cluster analysis to determine household economic and food security status. On average, each household cultivated 0.92 hectares of land, with an average of four family members. Maize, the staple crop, makes up more than half of the cultivated land. Concurrently, we identified four farm clusters, with variations among members in terms of cultivated land, livestock ownership, family labor availability, engagement in off-farm activities, and remittance receipts. January disease caused a dramatic decline in livestock numbers across clusters, significantly affecting the economic and food security situation of farmers. Their system relied heavily on animals, which simultaneously provided (i) draft power to cultivate more land, (ii) manure and fertility transfer, (iii) additional income and food from animal products, and (iv) precautionary savings. These findings highlight the need for targeted interventions to improve food and income security considering the specific needs and constraints of various farmer typologies, including the provision of differentiated support services like access to targeted credit schemes and provision of essential inputs, particularly legumes which is essential for diversification. Policymakers should consider supporting farmers with irrigation equipment and small irrigation plots in areas with water availability and promoting alternative income sources like small livestock and beekeeping to reduce dependence on risky crop production.
6.1 Study limitations
The findings of this study are not directly applicable to all contexts within Sub-Saharan Africa because context matters and farming households are highly diversified. However, the methodology that integrates statistical and participatory approaches to jointly establish food and economic security thresholds, as well as to engage with various stakeholders on achieving these goals, proved to be effective and applicable across all regions.
Data availability statement
The raw data supporting the conclusions of this article will be made available by the authors, without undue reservation.
Ethics statement
Written informed consent was obtained from the individual(s) for the publication of any potentially identifiable images or data included in this article.
Author contributions
MM: Conceptualization, Methodology, Formal analysis, Writing – original draft, Writing – review & editing. FG: Conceptualization, Methodology, Formal analysis, Writing – original draft, Writing – review & editing. TP: Validation, Writing – review & editing. DJ: Validation, Writing – review & editing, Supervision, Resources, Project administration, Funding acquisition. AB: Validation, Writing – review & editing. AC: Validation, Writing – review & editing. BHM: Validation, Writing – review & editing. FA: Validation, Writing – review & editing, Supervision, Resources, Project administration, Funding acquisition.
Funding
The author(s) declare that financial support was received for the research, authorship, and/or publication of this article. This publication was made possible through support provided by the European Union through the Promoting Agroecological Intensification for Resilience Building in Zimbabwe Project (RAIZ) (EU Contract 424–933) and the IRD-ARTS scholarship.
Conflict of interest
The authors declare that the research was conducted in the absence of any commercial or financial relationships that could be construed as a potential conflict of interest.
Publisher’s note
All claims expressed in this article are solely those of the authors and do not necessarily represent those of their affiliated organizations, or those of the publisher, the editors and the reviewers. Any product that may be evaluated in this article, or claim that may be made by its manufacturer, is not guaranteed or endorsed by the publisher.
Footnotes
1. ^Since independence in 1980, the subdivision of land has given rise to communal farmers, old resettlement farmers and A1 farmers (Moyo, 2011).
2. ^A ward is a sub-division of a district which acts as a level of local government administration.
References
Abegunde, V. O., and Obi, A. (2022). The role and perspective of climate smart agriculture in Africa: a scientific review. Sustain. For. 14:2317. doi: 10.3390/su14042317
Alvarez, S., Paas, W., Descheemaeker, K., Tittonell, P., and Groot, J. (2014a). Typology construction, a way of dealing with farm diversity. Research Program on CGIAR Integrated Systems Humid Tropics Plant Science, pp. 1–37.
Alvarez, S., Paas, W., Descheemaeker, K., Tittonell, P., and Jeroen, G. (2014b). Typology construction, a way of dealing with farm diversity: General guidelines for Humidtropics.
Alvarez, S., Timler, C. J., Michalscheck, M., Paas, W., Descheemaeker, K., Tittonell, P., et al. (2018). Capturing farm diversity with hypothesis-based typologies: an innovative methodological framework for farming system typology development. PLoS One 13, e0194757–e0194724. doi: 10.1371/journal.pone.0194757
Amadu, F. O., McNamara, P. E., and Miller, D. C. (2020). Understanding the adoption of climate-smart agriculture: a farm-level typology with empirical evidence from southern Malawi. World Dev. 126:104692. doi: 10.1016/j.worlddev.2019.104692
Ballard, T., Coates, J., Swindale, A., and Deitchler, M., (2011). Household Hunger Scale: Indicator Definition and Measurement Guide (No. FHI 360). Food and Nutrition Technical Assistance II Project, Washington, DC.
Chikowo, R., Zingore, S., Snapp, S., and Johnston, A. (2014). Farm typologies, soil fertility variability and nutrient management in smallholder farming in sub-Saharan Africa. Nutr. Cycl. Agroecosyst. 100, 1–18. doi: 10.1007/s10705-014-9632-y
Coates, J., Frongillo, E. A., Rogers, B. L., Webb, P., Wilde, P. E., and Houser, R. (2006). Commonalities in the experience of household food insecurity across cultures: what are measures missing? J. Nutr. 136, 1438S–1448S. doi: 10.1093/jn/136.5.1438S
Ellis, F., and Allison, E. (2004). Access to natural resources sub-Programme livelihoods diversification and Enterprise development sub-programme livelihood diversification and natural resource access livelihood support Programme (LSP) an inter-departmental programme for improving support.
Gérard, F., Alpha, A., Beaujeu, R., Levard, L., Maitre d’Hotek, E., Rouille d’Orfeuil, H., et al. (2011). Managing Food Price Volatility for Food Security and Development. GREMA Report, Paris available online at https://www.inter-reseaux.org/IMG/pdf/Managing_Food_Price_Volatility_for_Food_Security_and_Development_Grema.pdf
Hammond, J., Rosenblum, N., Breseman, D., Gorman, L., Manners, R., Van Wijk, M. T., et al. (2020). Towards actionable farm typologies: scaling adoption of agricultural inputs in Rwanda. Agric. Syst. 183:102857. doi: 10.1016/j.agsy.2020.102857
Harou, A. P. (2018). Unraveling the effect of targeted input subsidies on dietary diversity in household consumption and child nutrition: the case of Malawi. World Dev. 106, 124–135. doi: 10.1016/j.worlddev.2018.01.011
Hassall, K. L., Baudron, F., MacLaren, C., Cairns, J. E., Ndhlela, T., McGrath, S. P., et al. (2023). Construction of a generalised farm typology to aid selection, targeting and scaling of onfarm research. Comput. Electron. Agric. 212:108074. doi: 10.1016/j.compag.2023.108074
Hoddinott, J., and Yohannes, Y. (1825). Dietary diversity as a household food security Indicator, p. 50.
Jahnke, H. E. (1983). Livestock production systems and livestock development in tropical Africa. Agric. Syst. 12, 188–190. doi: 10.1016/0308-521X(83)90080-X
Jayne, T. S., Mason, N. M., Burke, W. J., and Ariga, J. (2018). Review: taking stock of Africa’s second-generation agricultural input subsidy programs. Food Policy 75, 1–14. doi: 10.1016/j.foodpol.2018.01.003
Kumar, S., Craufurd, P., Haileslassie, A., Ramilan, T., Rathore, A., and Whitbread, A. (2019). Farm typology analysis and technology assessment: an application in an arid region of South Asia. Land Use Policy 88:104149. doi: 10.1016/j.landusepol.2019.104149
Lairez, J., Lopez-Ridaura, S., Jourdain, D., Falconnier, G. N., Lienhard, P., Striffler, B., et al. (2020). Context matters: agronomic field monitoring and participatory research to identify criteria of farming system sustainability in South-East Asia. Agric. Syst. 182:102830. doi: 10.1016/j.agsy.2020.102830
Makuvaro, V., Walker, S., Munodawafa, A., Chagonda, I., Masere, P., Murewi, C., et al. (2017). Constraints to crop production and adaptation strategies of smallholder farmers in semi-arid central and Western Zimbabwe. Afr. Crop. Sci. J. 25:221. doi: 10.4314/acsj.v25i2.7
Mango, N., Siziba, S., and Makate, C. (2017). The impact of adoption of conservation agriculture on smallholder farmers’ food security in semi-arid zones of southern Africa. Agric. Food Secur. 6:32. doi: 10.1186/s40066-017-0109-5
Manyanga, M., Murendo, C., Pedzisa, T., Mutyasira, V., and Ndou, R. (2022). Resilience capacities and implications for food security in Zimbabwe. Afr. J. Agric. Resour. Econ. 17, 298–312. doi: 10.53936/afjare.2022.17(4).20
Melesse, M. B., Tirra, A. N., Homann-Kee Tui, S., Van Rooyen, A. F., and Hauser, M. (2023). Production decisions and food security outcomes of smallholder’s livestock market participation: empirical evidence from Zimbabwe. Front. Sustain. Food Syst. 7:509. doi: 10.3389/fsufs.2023.1222509
Mottet, A., Bicksler, A., Lucantoni, D., De Rosa, F., Scherf, B., Scopel, E., et al. (2020). Assessing transitions to sustainable agricultural and food systems: a tool for agroecology performance evaluation (TAPE). Front. Sustain. Food Syst. 4:579154. doi: 10.3389/fsufs.2020.579154
Moyo, S., (2011). Three decades of agrarian reform in Zimbabwe. J. Peasant Stud. 38, 493–531. doi: 10.1080/03066150.2011.583642
Mujeyi, A., Mudhara, M., and Mutenje, M. J. (2022). Adoption patterns of climate-smart agriculture in integrated crop-livestock smallholder farming systems of Zimbabwe. Clim. Dev. 14, 399–408. doi: 10.1080/17565529.2021.1930507
Murapiro, A., Alistar, T., Zhu, N., and Ping Mapisa, L. (2023). The impact of remittances as a source of economic growth in Ldcs: case of Zimbabwe since Independence. Int. J. Arts Humanit. Soc. Sci. 6:1.
Murendo, C., Gwara, S., Mazvimavi, K., and Arensen, J. S. (2019). Linking crop and livestock diversification to household nutrition: evidence from Guruve and Mt Darwin districts, Zimbabwe. World Dev. Perspect. 14:100104. doi: 10.1016/j.wdp.2019.02.015
Mutami, C. (2015). Smallholder agriculture production in Zimbabwe: a survey. Cons. J. Sustain. Dev. 13, 1–27.
Mutsamba, E. F., Nyagumbo, I., and Mupangwa, W. (2020). Forage and maize yields in mixed crop-livestock farming systems: enhancing forage and maize yields in mixed crop-livestock systems under conservation agriculture in sub-humid Zimbabwe. NJAS Wagening. J. Life Sci. 92, 1–10. doi: 10.1016/j.njas.2019.100317
Mutyasira, V. (2020). Prospects of sustainable intensification of smallholder farming systems: a farmer typology approach. Afr. J. Sci. Technol. Innov. Dev. 12, 727–734. doi: 10.1080/20421338.2019.1711319
Ngoma, H., Angelsen, A., Jayne, T., and Chapoto, A. (2021). Understanding adoption and impacts of conservation agriculture in eastern and southern Africa: a review. Front. Agron. 3:1690. doi: 10.3389/fagro.2021.671690
Ngoma, H., Simutowe, E., Manyanga, M., and Thierfelder, C. (2023). Sustainable intensification and household dietary diversity in maize-based farming systems of Zambia and Zimbabwe. Outlook Agric. 52, 34–46. doi: 10.1177/00307270221150660
Nkomo, G. V., Sedibe, M., and Mofokeng, M. (2020). Farmers’ production constraints, perceptions and preferences of cowpeas in Buhera district, Zimbabwe. Afr. J. Food Agric. Nutr. Dev. 20, 16832–16857. doi: 10.18697/ajfand.94.19795
Nyamangara, J., Nyengerai, K., Masvaya, E. N., Tirivavi, R., Mashingaidze, N., Mupangwa, W., et al. (2014). Effect of conservation agriculture on maize yield in the semi-arid areas of Zimbabwe. Exp. Agric. 50, 159–177. doi: 10.1017/S0014479713000562
Nyamasoka-magonziwa, B., Vanek, S. J., Carolan, M., Ojiem, J. O., and Fonte, S. J. (2021). Organic nutrient source allocation and use in smallholder farming communities: What are we missing? Front. Sustain. Food Syst. 5, 1–18. doi: 10.3389/fsufs.2021.692981
Pangapanga-Phiri, I., Ngoma, H., and Thierfelder, C. (2024). Renewable agriculture and food systems understanding sustained adoption of conservation agriculture among smallholder farmers: insights from a sentinel site in Malawi. Renew. Agric. Food Syst. 39:61. doi: 10.1017/S1742170524000061
Shonhe, T., and Mtapuri, O. (2020). Zimbabwe’s emerging farmer classification model: a ‘new’ countryside. Rev. Afr. Polit. Econ. 47, 363–381. doi: 10.1080/03056244.2020.1768838
Silva, J., Baudron, F., Ngoma, H., Nyagumbo, I., Simutowe, E., Kalala, K., et al. (2023). Narrowing maize yield gaps across smallholder farming systems in Zambia: what interventions, where, and for whom? Agron. Sustain. Dev. 43:872. doi: 10.1007/s13593-023-00872-1
Spurrier, J. D. (2003). On the null distribution of the Kruskal–Wallis statistic. J. Nonparametr. Stat. 15, 685–691. doi: 10.1080/10485250310001634719
Tapsoba, A., and Gérard, F., (2025). Contribution of large-scale irrigation systems to food security and economic security: Evidence from the Bagré irrigation scheme in Burkina Faso. Agric. Syst. 224, 104252. doi: 10.1016/j.agsy.2024.104252
Thierfelder, C., Baudron, F., Setimela, P., Nyagumbo, I., Mupangwa, W., Mhlanga, B., et al. (2018). Complementary practices supporting conservation agriculture in southern Africa. A review. Agron. Sustain. Dev. 38:16. doi: 10.1007/s13593-018-0492-8
Thierfelder, C., Mhlanga, B., Ngoma, H., Marenya, P., Matin, A., Tufa, A., et al. (2024). Unanswered questions and unquestioned answers: the challenges of crop residue retention and weed control in conservation agriculture systems of southern Africa. Renew. Agric. Food Syst. 39:e7. doi: 10.1017/S1742170523000510
Tufa, A. H., Kanyamuka, J. S., Alene, A., Ngoma, H., Marenya, P. P., Thierfelder, C., et al. (2023). Analysis of adoption of conservation agriculture practices in southern Africa: mixed-methods approach. Front. Sustain. Food Syst. 7:1151876. doi: 10.3389/fsufs.2023.1151876
Whitfield, S., Dixon, J. L., Mulenga, B. P., and Ngoma, H. (2015). Conceptualising farming systems for agricultural development research: cases from eastern and southern Africa. Agric. Syst. 133, 54–62. doi: 10.1016/j.agsy.2014.09.005
ZIMVAC (2020). Zimbabwe vulnerability assessment committee 2020 rural livelihoods assessment report 1–216.
ZIMVAC. (2023). Zimbabwe vulnerability assessment committee (ZIMVAC) 2019 rural livelihoods assessment report. Available at: https://fnc.org.zw/wp-content/uploads/2019/07/ZimVAC-2019-Rural-Livelihoods-Assessment-report.pdf (Accessed February 27, 2024).
Appendix A
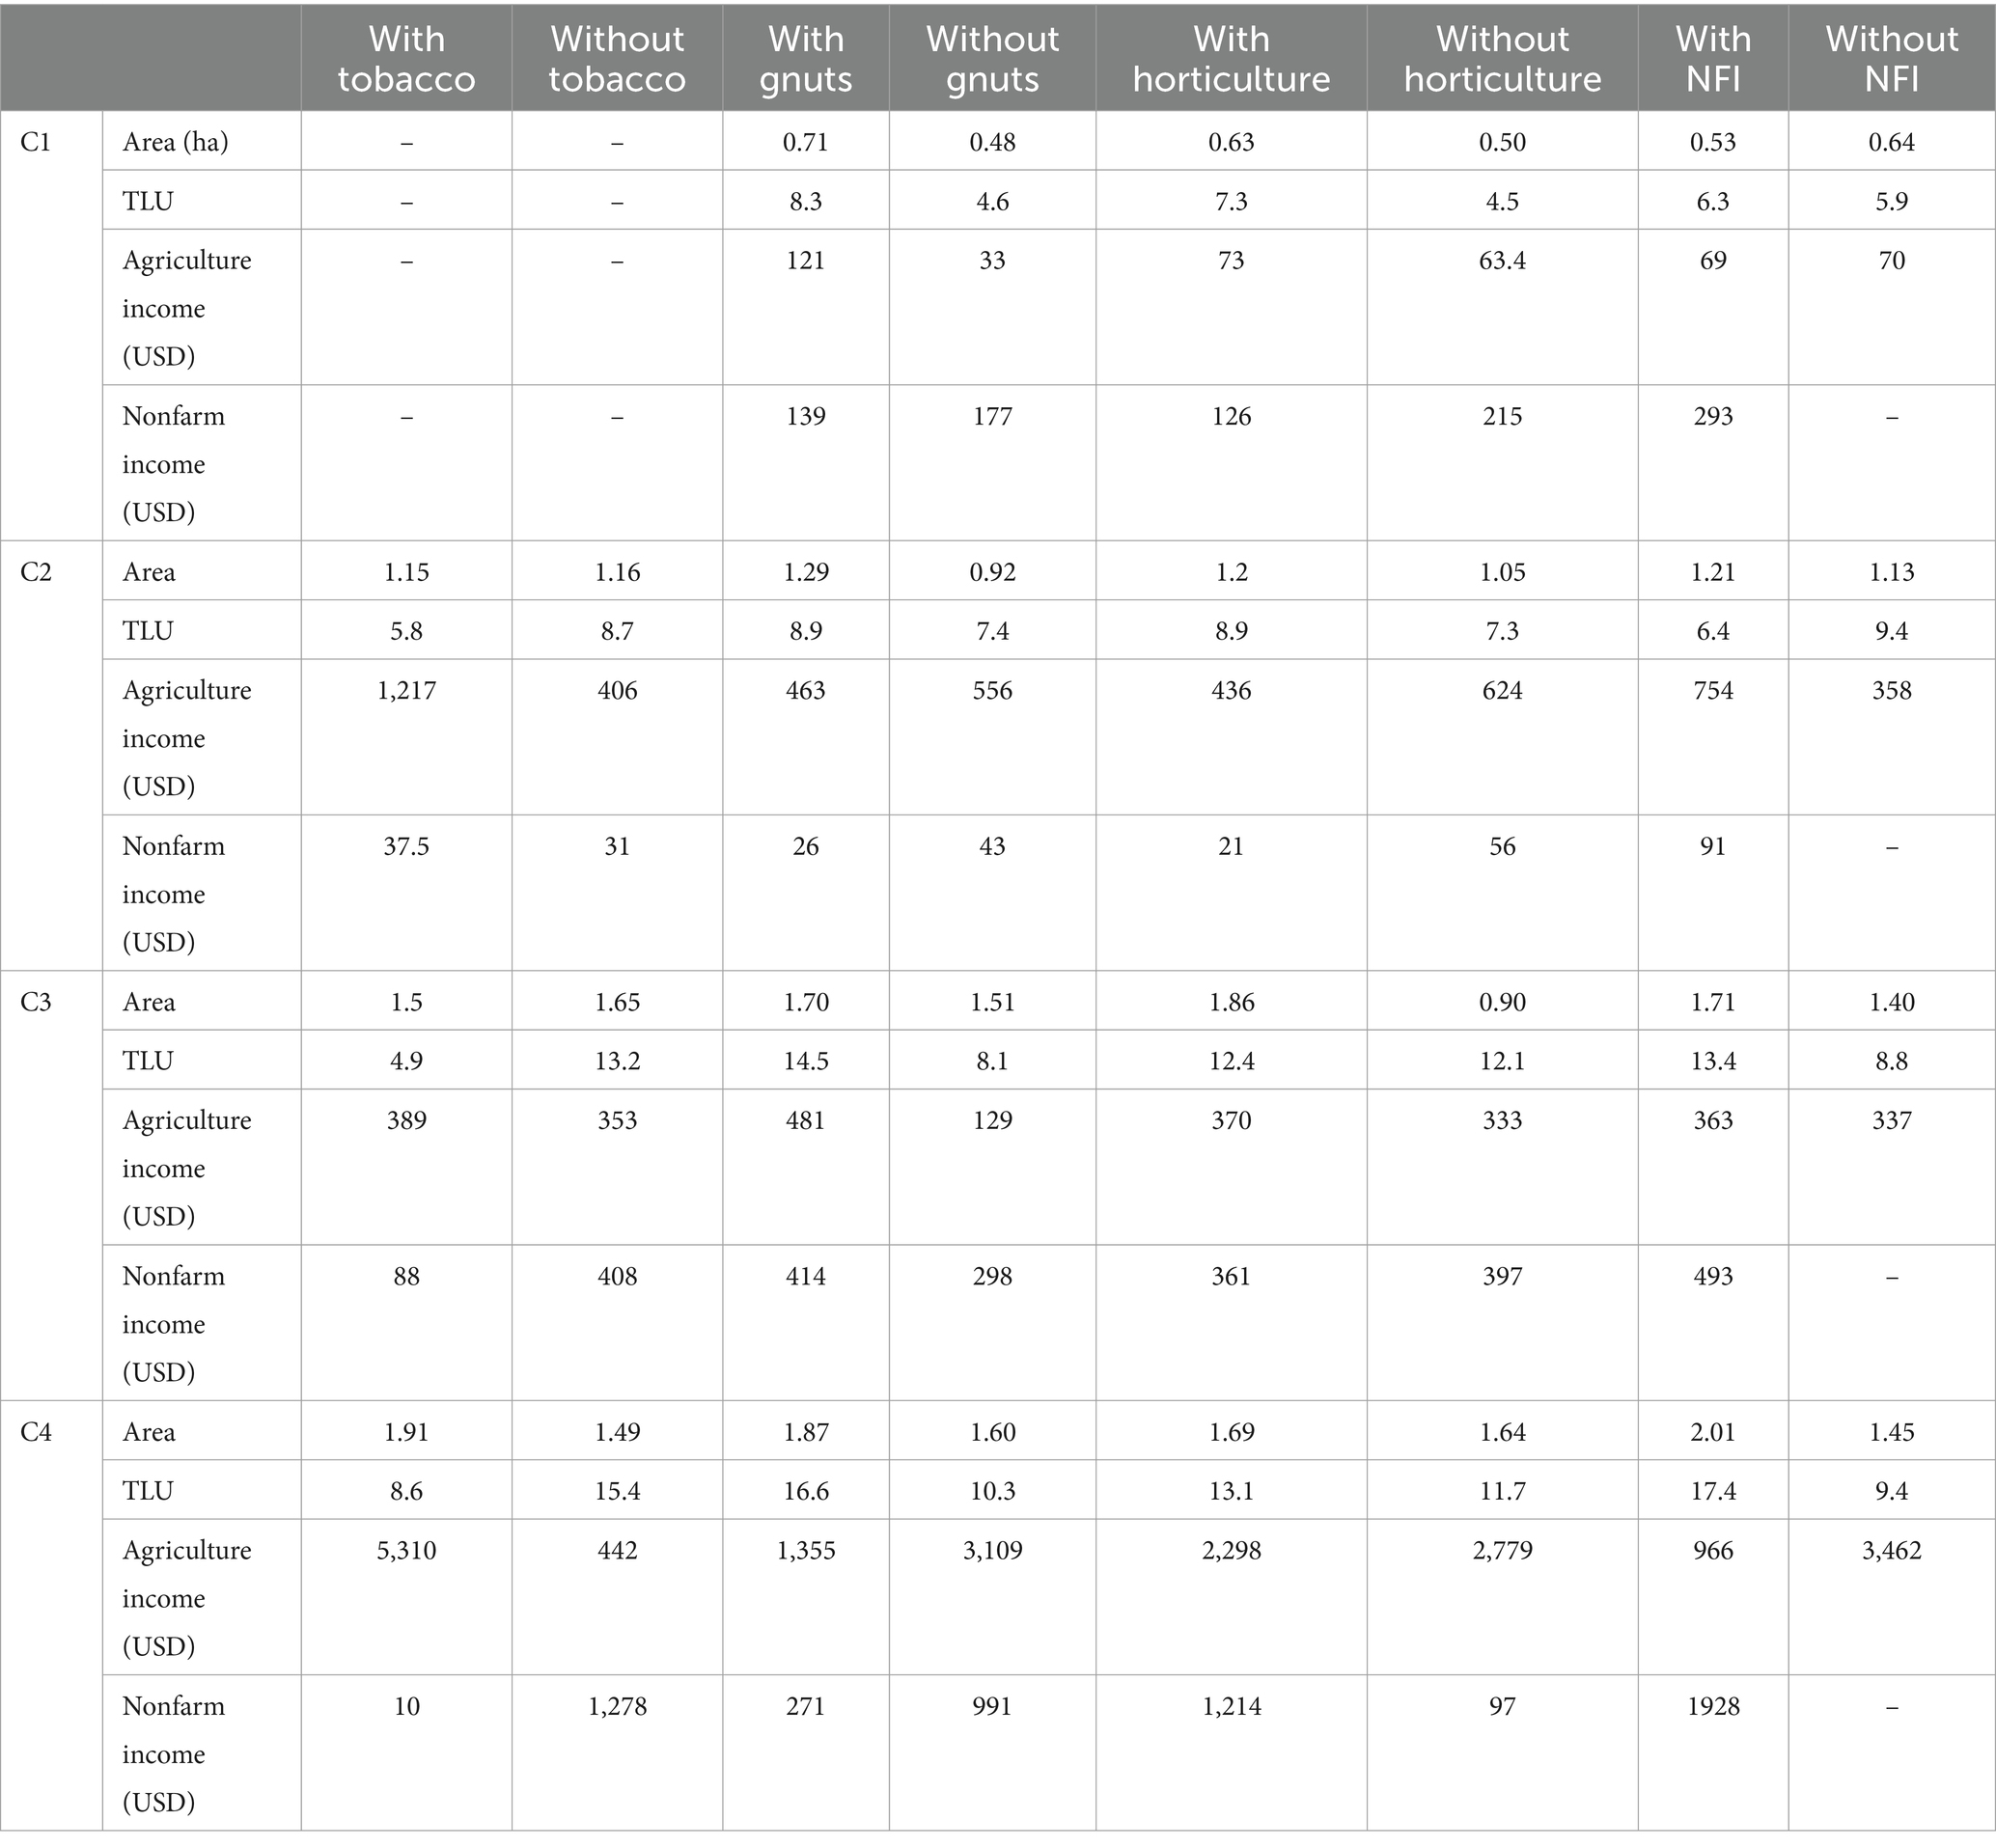
Table A1. Heterogeneity among farmers in similar circumstances.
Keywords: diversification, farm typology, hierarchical cluster analysis, households, principal component analysis, Zimbabwe
Citation: Manyanga M, Gérard F, Pedzisa T, Jourdain D, Belard A, Hanyani-Mlambo B, Coquereau A and Affholder F (2025) Prospects for improving the food and economic security of smallholder maize-based farming systems: a farmer typology approach in Zimbabwe. Front. Sustain. Food Syst. 9:1437865. doi: 10.3389/fsufs.2025.1437865
Edited by:
Godfrey Hampwaye, Southern African Institute for Policy and Research, ZambiaReviewed by:
Nilhari Neupane, International Water Management Institute, NepalAditya Sinha, Bihar Agricultural University, India
Copyright © 2025 Manyanga, Gérard, Pedzisa, Jourdain, Belard, Hanyani-Mlambo, Coquereau and Affholder. This is an open-access article distributed under the terms of the Creative Commons Attribution License (CC BY). The use, distribution or reproduction in other forums is permitted, provided the original author(s) and the copyright owner(s) are credited and that the original publication in this journal is cited, in accordance with accepted academic practice. No use, distribution or reproduction is permitted which does not comply with these terms.
*Correspondence: Mark Manyanga, bWFya21hbnlhbmdhQGdtYWlsLmNvbQ==