 Yue Wang1
 Linchen Zhang2*
- 1School of Business, East China University of Science and Technology, Shanghai, China
- 2School of Economics, Shandong University of Technology, Zibo, China
Introduction: The vulnerability of transnational supply of agricultural products has become one of key factors affecting food security at the global scale.
Methods: This study applies the social network analysis method for systematic exploration of the evolution of the international agricultural trade dependence network (TDN) from the perspective of vulnerability. First, agricultural industries that are highly vulnerable in international trade are identified. Then, a network visualization model is constructed for systematic analysis of the evolution of topological structure of the global TDN of highly vulnerable agricultural products. Finally, a temporal exponential random graph model (TERGM) and its separated formation model and dissolution (persistence) model (STERGM) are established for quantitative assessment of the impact of abrupt changes in the economic and trade environment on the TDN of highly vulnerable agricultural products in the period 2018–2020.
Results and discussion: The research results show that the highly vulnerable industries in the international agricultural trade are distributed in a wide range, concentrating mainly in meat, animal and vegetable oils, fish and other aquatic products, fruits and nuts, and cereal products, and most of the products in each category is mainly supplied by only a handful of countries. The TDN of highly vulnerable agricultural products exhibits a “polycentric” development trend, that is, shifting from the network structure with a single dominant central node (USA) toward the one with multiple central nodes (USA, Malaysia, Indonesia, Brazil, the Netherlands, etc.). During the period 2018–2020, when bilateral trade frictions intensified and the COVID-19 pandemic raged, the abrupt changes in the economic and trade environment led to significant enhancement in the dependence relations in the international trade of highly vulnerable agricultural products. Such abrupt changes not only induce the trade transfer effect and promote the formation of new trade dependence relations among countries, but also increase the probability of maintaining the existing trade dependence relations. These results can provide practical guidance for preventing and mitigating transnational supply crisis and building a more secure global food guarantee system.
1 Introduction
International trade plays an important role in ensuring world food security and eradicating hunger (Dithmer and Abdulai, 2017; Geyik et al., 2021). Statistics show that the volume of global agricultural trade has increased by more than double in the past three decades, with nearly 5.2 billion people living in food-importing countries and 23% of agricultural products circulation relying on international trade (Dupas et al., 2019). The trade links of agricultural products among countries are becoming increasingly dense, forming an intricate trade dependence network (TDN). This TDN is conducive to correcting the worldwide geographical imbalance in the demand and supply of agricultural products; however, it also amplifies the impact of supply risk caused by unstable factors in the economic and trade environment (Friis and Nielsen, 2019; WTO, 2021a). Under the influence of bilateral trade frictions, COVID-19 pandemic, drought, and other drastic incidents such as the Russia–Ukraine conflict, the transnational supply risk of agricultural products has spread continuously in the global TDN. A regional supply crisis can easily grow rapidly into a worldwide food crisis, leading to serious consequences such as unable to buy enough food, sharp rise of food price, and so on (Puma, 2019). Therefore, it is necessary to accurately grasp the vulnerability characteristics of the global agricultural TDN and carry out in-depth analysis of the impact of abrupt changes in the economic and trade environment on the TDN, and this is the key to balancing the relationship between international trade and world food security.
In fact, there has been a high level of concentration in global agricultural production and trade, which gives rise to vulnerability of international agricultural trade links (Blesh et al., 2019; Campi et al., 2021). Owing to the differences in the distribution of agricultural resources and investment in agricultural production, as well as the comprehensive impact of the green revolution and other political and economic factors, the differences among countries in the agricultural production trajectory and trading position still persist (Pardey et al., 2016; Choudhury and Headey, 2017). Considering grain products as an example, most countries in the world have awfully inadequate grain production capacity, in particular, Africa. These countries rely on the international food market to make up for the domestic food shortage. On the other hand, a small number of countries, such as the United States, Ukraine, and Argentina can produce huge amount of grains far exceeding their domestic need, thus they play the role of major suppliers in the international food market. As agricultural production is becoming increasingly energy and capital intensive, the international agricultural capital forces of developed economies penetrate progressively deeper into the global industrial chain of agricultural production, which further exacerbates the competition distortion in the international agricultural trade (Davis et al., 2016; Santangelo, 2018). Some studies have pointed out that many developing economies are increasingly dependent on the supply of agricultural products in the international market, and the number of their trading partner countries has been dropping continuously (Kummu et al., 2020). Notably, the concentration of global agricultural products supply has greatly aggravated the imbalance of the global trading system of agricultural products, which is especially unfavorable for developing economies with insufficient food production capacity and relatively weak trading position. Concentration of supply renders the food-importing countries more dependent on a small number of food-exporting countries, which can lead to food sovereignty crisis and bring the risk of being controlled by other countries.
Abrupt changes in the international economic and trade environment can disrupt the order of agricultural products trade and increase the volatility and risk of the international agricultural products market, which can make it difficult to maintain the agricultural trade links among countries (Puma et al., 2015; Morton, 2020). In recent years, the frequency of external shocks to the agricultural trade network has been increasing, mainly due to the increase of trade frictions, regional conflicts, extreme weather, epidemic, and other incidents. Given the rapid growth in the scale of global agricultural trade and the trend of market centralization, international agricultural trade has become more vulnerable to the impact of abrupt changes in the economic and trade environment, leading to global food supply crisis and sharp rise of food price (Cottrell et al., 2019). Anderson (2022) pointed out that the current global economic and trade environment is more unstable than that in the previous decades, which is reflected by the soaring uncertainty index of global economic policy. Under the influence of various export restriction policies of many countries, the global average annual trade volume in the 10 years prior to 2017 was less than US $200 billion; however, this figure tripled in the period 2018–2020. In fact, the average import tariff of agricultural products is higher than that of industrial products, and non-tariff export and import barriers are also more common in agricultural trade, thus international agricultural trade is more susceptible to the changes of economic policy (WTO, 2021b). Since 2018, bilateral trade disputes such as the Sino–US trade war, the trade conflicts between the United States and Europe, the trade frictions between Japan and South Korea, and Brexit have occurred one after the other, leading to significant increase in the risk in the transnational supply of agricultural products. In 2020, the COVID-19 pandemic caused clogging of cross-border trade, aggravation of trade protectionism, price hiking of agricultural products, and other problems, bringing the global agricultural supply chain to the brink of collapse. In 2022, the outbreak of the Russia–Ukraine conflict caused a sharp reduction in the grain output and trade scale in the two involved countries, making the developing economies highly dependent on grain imports during the risk of food shortages, which further exacerbated the world food insecurity. To sum up, bilateral trade frictions, COVID-19 pandemic, and other abrupt changes in the economic and trade environment have caused a heavy blow to the international agricultural trade system, and the spread of transnational supply risks is hindering the realization of the vision of “zero hunger.”
Accordingly, this study focuses on the vulnerability characteristics of international agricultural trade networks. Utilizing social network analysis, it develops indicators for measuring trade network vulnerability, aiming to identify the most vulnerable product sectors within the international agricultural trade network. Furthermore, this research employs the Temporal Exponential Random Graph Model (TERGM) along with its separable formation and dissolution (or persistence) models (STERGM) to systematically assess the impact of trade frictions (2018–2019) and the COVID-19 pandemic (2020) on the trade dependence network of highly vulnerable agricultural products, as well as the effects of related endogenous and exogenous factors during these periods of economic disruption. This research expands the application of social network analysis in the study of international trade issues, facilitating a comprehensive understanding of the problems of supply concentration and trade dependency in different types of agricultural markets. It also reveals the significant impacts that abrupt changes in the international economic and trade environment have on agricultural trade networks, addressing a gap in the existing literature regarding the vulnerability characteristics of international agricultural TDNs. This study contributes to enriching global food system sustainability strategies and provides theoretical and practical support for the formulation of strategies to mitigate cross-border supply risks for participating countries in international trade. It is particularly valuable for developing countries with high dependence on import trade that are positioned on the periphery of trade networks, offering insightful trade policy implications.
2 Literature
Research on trade networks based on social network analysis has increasingly become a focal point in the field of economics, with a growing number of scholars examining the social network characteristics present in international trade. This methodology demonstrates significant advantages in depicting the complex, multidimensional structures of trade networks among nations (Zhou et al., 2016). Serrano and Boguná (2003) were pioneers in applying social network analysis to international trade issues, constructing a global trade network system that revealed various network features of international trade, such as scale-free and small-world properties. Following their work, numerous researchers, including Garlaschelli and Loffredo (2004), Squartini et al. (2011), and Fagiolo et al. (2009), have developed global trade network models to analyze the evolutionary characteristics of national trade network topologies across different time periods and product types. Their studies highlight that the formation and evolution of global trade networks result from multiple interdependent trade relationships. Countries can actively or passively select specific trade partners, thereby forming tightly-knit sub-network systems within the broader structure of global trade. These structural characteristics not only reflect cooperation patterns among nations but also profoundly influence the modalities and effectiveness of trade collaborations (Chaney, 2014).
Current research on agricultural product trade networks predominantly employs a global or regional perspective to explore the structural characteristics and evolutionary dynamics of these networks. Studies have focused on the network positions of different countries within international agricultural trade, the density of connections between nations, and the modularity of communities. These studies underscore the important roles played by social, economic, and geographical factors in shaping trade network structures. Gephart and Pace (2015) applied social network analysis to study the structural evolution of seafood trade networks, revealing that Thailand and China have been increasing their influence in the global seafood trade network, while the density of trade links within the region has been steadily deepening. Torreggiani et al. (2018) used community detection algorithms to analyze the global high-calorie food trade network, finding that its complex, multi-layered structure is defined by tightly connected, heterogeneous trade relationships, with social, economic, and geographical factors influencing whether countries belong to the same community. Silvestrini et al. (2023) found that global caloric trade relations and exchange intensity have steadily increased, with the densest networks concentrated among upper-middle and high-income countries, leading to significantly higher per capita daily calorie supplies, while low-and lower-middle-income countries are on the periphery, facing relatively insufficient calorie supplies. Additionally, Dupas et al. (2019) highlighted the significant contributions of three subnetwork systems—core, transient, and intermediary networks—to the overall evolution of the food trade network structure.
The evolution of the global agricultural product trade network structure is neither chaotic nor random; instead, it is systematically shaped by a complex interplay of endogenous and exogenous factors, including political, economic, cultural, and trade choices. Consequently, examining the mechanisms that drive the dynamic evolution of trade network connections from a network perspective is crucial. This analysis aids in elucidating the general patterns governing the evolution of complex agricultural trade networks, thereby enabling more accurate predictions regarding potential internal and external shocks (Helbing, 2013; Mangnus and Vellema, 2019). Social network analysis is instrumental in clarifying the system’s complex characteristics, enhancing our understanding of the contagious and destructive dynamics associated with food crises or trade risks within such systems (Dueñas et al., 2021). Research has demonstrated that the tight interdependencies among countries within the international food trade network present both advantages and risks, with low-income nations being particularly vulnerable to import shortages when facing external shocks (Distefano et al., 2018). Although a diversified network structure can mitigate these impacts, the concentration of trade flows in a limited number of countries can lead to increased network vulnerability (Sartori and Schiavo, 2015). The intricate interdependencies among nations amplify the transmission effects of food crises, analogous to regional input–output and financial networks. In trade networks, the propagation and escalation of supply risks are significantly influenced by the complexity of connections among country nodes, which complicates the assessment of external shocks (Burkholz et al., 2018; Burkholz and Schweitzer, 2019). Core exporting countries exert significant influence within the global trade network, and disruptions to their exports can trigger supply crises in nations with complex trade linkages to them (Braun et al., 2023). The network structure determines the risk-bearing capacity of national nodes in response to external shocks, such as changes in the trade environment, with higher centrality and community modularity enhancing the resilience and stability of trade relations (Dolfing et al., 2019; Liu et al., 2023). Differences in the integration efficiency and resilience of trade networks for various agricultural product categories result in varying capacities to withstand risks from adverse events such as the COVID-19 pandemic, geopolitical tensions, and climate change (Hedlund et al., 2022; Alhussam et al., 2023; Li et al., 2024).
Recent advancements in social network analysis methods provide a more comprehensive and intuitive representation of complex trade relationships among countries. However, these methods do not effectively assess the formation mechanisms and influencing factors of international trade networks, leading to certain limitations in their practical application to trade issues. As a result of the interdisciplinary integration of statistical theory and sociological research, the Exponential Random Graph Model (ERGM) has emerged as a valuable tool for investigating social and economic network problems, extending its application into the realm of international trade research. In contrast to traditional social network analysis, which relies on indicator-based metrics and visualization techniques, the ERGM facilitates statistical inference of the relationships between individual nodes within the trade network through specific numerical representations. This model overcomes the constraints posed by network data that do not conform to the “independence assumption,” allowing for a flexible exploration of both endogenous and exogenous mechanisms driving the evolution of network topologies. Thus, it addresses the limitations of conventional descriptive statistical analyses of social network structures (Goodreau et al., 2008; Handcock et al., 2008). The ERGM has seen extensive application in analyzing the formation and evolution of trade and investment networks among countries and economic entities (Smith et al., 2019; Gutiérrez-Moya et al., 2020).
The Exponential Random Graph Model (ERGM) is limited by its ability to process only static cross-sectional data, rendering it ineffective in assessing the dynamic evolution of network structures. To overcome this limitation, Hanneke et al. (2010) proposed the Temporal Exponential Random Graph Model (TERGM), which retains the strengths of ERGM while incorporating a temporal dimension that allows for the analysis of changes in network relationships over time. In dynamic network relationship analysis, the evolution of network topology can be decomposed into the formation of new relationships and the dissolution or persistence of existing ones. Since the mechanisms driving these two types of structural changes differ, some scholars have extended the TERGM model to introduce the Separable Temporal Exponential Random Graph Model (STERGM). This model generates separate equations for formation and dissolution (or persistence) to estimate two sets of influencing parameters, significantly enhancing the interpretability and flexibility of the model’s parameter estimates (Krivitsky and Handcock, 2014; Graif et al., 2017; Leifeld et al., 2018). The application of these models allows for a more detailed analysis of dynamic network topology, providing critical theoretical tools for investigating the long-term evolution of international trade networks and their response mechanisms to external shocks (Fritz et al., 2020). Some scholars use this method to quantitatively analyze the endogenous and exogenous driving mechanisms of the dynamic evolution of trade networks, revealing the structural characteristics of trade networks and the impact of external factors, such as policy uncertainty, on the complex relationships within international trade networks (Lebacher et al., 2021; Zhu and Huang, 2023).
A comprehensive review of the literature reveals that existing research primarily focuses on the macro-topological characteristics of agricultural product trade networks, exploring the formation mechanisms and evolutionary trends of global or regional trade networks and specific product trade networks. A few scholars have paid attention to the vulnerability characteristics of international agricultural product trade networks, using network statistical modeling to analyze the transmissibility and riskiness of trade shocks. Unfortunately, current studies have limited understanding of the vulnerability of international agricultural product network relationships and the propagation of network influence. On one hand, they fail to consider the transnational supply vulnerability of different agricultural product industries and the intensity of trade dependence between countries, lacking an analysis of the evolution of TDNs structures for products with a high degree of transnational supply vulnerability. On the other hand, existing research has not delved into the impact of sudden changes in the external economic and trade environment on agricultural product TDN, with a lack of related quantitative studies.
This study aims to fill the abovementioned research gap. The main contributions of this study are as follows: First, several indicators of agricultural trade vulnerability are constructed based on complex network analysis to effectively measure the supply risks caused by changes in core trade participants, market concentration trend, and trade substitution, making it easy to identify the industries of most vulnerable products in the global agricultural trade network. Second, the global TDN of highly vulnerable agricultural products is constructed based on the measurement by using the national trade dependence indicators, and the formation and evolution of the network topology are elucidated comprehensively, which fills the gap in the knowledge about the structure of TDNs of highly vulnerable agricultural products left by the existing studies. Third, the endogenous and exogenous factors affecting the evolution of the network topology are incorporated into a unified empirical research framework by using a temporal exponential random graph model (TERGM) and its separated formation model and dissolution (or persistence) model (STERGMs). Furthermore, the impact of the relevant endogenous and exogenous factors on the global TDN of highly vulnerable agricultural products during the selected period of abrupt changes in the economic and trade environment (2018–2020) is systematically assessed.
3 Methodology
3.1 Vulnerability measurement on global-product trade level
Early indicators related to international trade vulnerability predominantly relied on market concentration metrics, such as Trade Dependence (Brown, 1940), Trade Intensity Index (Frankel, 1997), Hirschman–Herfindahl Index (HM Index) (Baldwin, 2009), and Revealed Comparative Trade Advantage Index (Iapadre and Tironi, 2009). These metrics suggest that the higher the concentration of a country’s import sources, the greater the likelihood of negative impacts. However, traditional market concentration metrics, based on bilateral trade calculations, do not account for the networked structure of international trade relations. Fundamentally, trade relations between countries depend not only on one trading party but also on the indirect effects of the external overall trade supply environment within the trade network structure. This includes risks brought about by network characteristics such as core participants, clustering trends, and international trade substitutability.
In light of this, this study adopts the measurement approach of Korniyenko et al. (2017), integrating social network analysis into the vulnerability research of international trade networks. This method effectively measures the supply risks caused by sudden changes in core trade participants for different types of agricultural product trades. Consequently, it helps identify the most vulnerable industry types within the international agricultural product trade network. First, the centrality index of the country’s export agricultural products is calculated. The calculation formula is given in Equation 1:
where is the exporting country, j is the importing country, denotes the third party country, is the specific agricultural product, represents the trade volume of product exported from country to country in year , is the trade volume of product exported from the third party country to country in year , is the total number of the countries of origin of product imported by country in year , and denotes the total number of importing countries of product .
Then, the centrality variation index of agricultural product , i.e., the standard deviation of the centrality index of the agricultural products exported by all countries is calculated. The calculation formula is given in Equation 2:
where is the average values of all countries. The identification of highly vulnerable agricultural products is based on the degree of the centrality variation index . A higher index value indicates that the source countries for the trade of these products are concentrated among a limited number of core suppliers, which consequently elevates the potential risks associated with the trade network for those products. This study employs the polarization selection standard proposed by Korniyenko et al. (2017), that is, the product samples with a value above 75% quantile are designated as highly vulnerable products in the trade network.
3.2 Construction of agricultural product TDN based on social network analysis
3.2.1 Value determination of national trade dependence indicators
After identifying the highly vulnerable agricultural products, we proceeded to measure the dependence intensity among countries in the trade of highly vulnerable agricultural products. The trade dependence intensity between two countries in the trade network is not merely determined by the direct trade links between them, it is also affected significantly by the alternative trade between these two countries, that is, the “third party effect.” For example, China’s import of soybeans from Brazil accounted for 53% of the country’s total soybean import in 2017. This figure climbed to 75% in 2018 as a result of continuous escalation of Sino–US trade friction, which indicates that the dependence degree of soybean trade between China and Brazil can be indirectly affected by the third-party effect (in this case, USA is the third party). In view of the third-party effect, the methods proposed by Casciaro and Piskorski (2005) and Xia (2011) were used in this study to construct national trade dependence indicator, considering market centralization and trade substitution in the trade network. The calculation formula is given in Equation 3:
where is the degree of dependence between country i and country j in the trade of highly vulnerable agricultural products, that is, the import dependence index of country j with respect to country i; indicates the share of import trade, that is, the proportion of the highly vulnerable agricultural products exported from country i to country j in the total quantity of highly vulnerable agricultural products imported by country j; denotes the import concentration degree of highly vulnerable agricultural products of country j; and is the import concentration degree of highly vulnerable agricultural products of country i.The calculation method of and is derived from the calculation method of Hufendar–Heshman (HHI) index. The calculation formula is expressed is given in Equations 4, 5:
where is the total number of countries of origin from where country j imports highly vulnerable agricultural products, and n is the total number of destination countries to which country i exports highly vulnerable agricultural products. Clearly, is proportional to and , and is inversely proportional to .
3.2.2 Construction of TDN of highly vulnerable agricultural products
Based on the abovementioned method of determining the value of national trade dependence index , in this study, the method of setting trade threshold was used to identify the significant dependence relations in the trade network, and then a directed binary network system of dependence relations was constructed in the trade of highly vulnerable agricultural products for identifying and comparing the complex network topology evolution of trade dependence relations among countries. The agricultural TDN system is given in Equation 6:
where is the structure of TDN of highly vulnerable agricultural products at time ; denotes the network node set, that is, the collection of countries participating in the trade of highly vulnerable agricultural products; is the network edge set, that is, the trade dependency relation extending from country i to country j. If the dependence relation is established, then ; otherwise, ; is the characteristic attribute of the network node, that is, the regional development attribute related to agricultural trade; and denotes the weight attribute of the network edges, that is, the trade dependence degree of the country.
In order to exhibit the evolution of the network topology of the trade dependence relations of highly vulnerable agricultural products, herein, backbone extractions on the nodes and relationship edges of the network system were performed by the method of setting threshold value. First, the method proposed by De Benedictis et al. (2014) was used to screen the network nodes, with 112 countries engaged in the trade of highly vulnerable agricultural products.1 Then, the method proposed by Pan (2018) was used to extract important trade dependence relations by setting percentage threshold. Notably, there is no widely-accepted standard for setting the threshold value, different scholars set different threshold values based on the numbers of nodes and edges in the network. For example, Kali and Reyes (2010) set the threshold value to 1–2%, and Pan (2018) set the value to 2%. Considering that each country has a small number of key agricultural trading partners, in this study, the threshold value was set to 2%. The number of network edges over the years eventually obtained was about 220, which is enough to capture the important trading partners of highly vulnerable agricultural products (countries occupying the positions no. 1–4 in the ranking of trading partners in the trade network).
3.3 Construction of TERGM model and its separated model based on dynamic network analysis
As the network statistical indicators devised based on social network analysis are mainly used for static analysis of network characteristics, they cannot reveal the dynamic impact of abrupt changes in economic and trade environment on TDNs of highly vulnerable agricultural products. In view of this limitation, this study makes use of the network dynamic model to examine the evolution mechanism of trade dependence relations. The validity of traditional econometric regression model assumes that the observation objects are independent of each other. Notably, the countries in the global TDN are interdependent and their relations are influenced by the “third party effect”; therefore, it is impossible to obtain robust and unbiased estimation results by using the traditional econometric regression model (Smith et al., 2019). This problem can be solved effectively by using TERGM. TERGM allows simultaneous processing of endogenous structure of the network, the relationship between actors and the external characteristics of the network, and supports comprehensive evaluation of the endogenous and exogenous factors that affect the generation of network relations (Krivitsky and Handcock, 2014; Leifeld et al., 2018). The TERGM model devised in this study is given in Equation 7:
where is the existence status of trade dependence relation in the trade of highly vulnerable agricultural products (its value is 1 if dependence relation exists, and 0 if dependence does not exist); and are the TDNs of highly vulnerable agricultural products at time and time respectively, and their network structures are set to and respectively; is the normalization constant used to ensure proper probability distribution; is the configuration statistic unit in the network structure, in which all network edges and nodes are considered to be interdependent and play a regulatory role in the overall network structure layout; is the parameter corresponding to the variable to be estimated in ; is a temporal co-network variable of abrupt change in economic and trade environment; is an endogenous structural variable related to the generation of a series of network relations; is the exogenous structure attribute of a series of network nodes, usually the national characteristic variable in the traditional trade gravity model. See 2.4 Variables Description for a complete description of variables.
In the dynamic network relation analysis, the evolution of network topology can be divided into two levels: one is the formation of new relations in the network structure, and the other is the dissolution or persistence of old relations in the network structure. These two types of changes in the network topology exhibit different action mechanisms, thus there are also some differences in the analysis of their influencing factors (Graif et al., 2017). In view of this difference, the practice of Krivitsky and Handcock (2014) was adopted herein to split the TERGM model into a formation model and a dissolution (or persistence) model (also known as separated TERGM or STERGM model), and these two models were used to estimate two sets of influencing parameters. With the estimated influencing parameters, the impact of the exogenous shock generated could be described by abrupt changes in the economic and trade environment on the formation of new relations and the dissolution (or persistence) of existing network relations in the TDN. TERGM is composed of the formation model and the dissolution (or persistence) model of network relations. Although these two models complement each other with the change of temporal trend, they are conditionally independent in any given year, which effectively ensures the flexibility, clarity, and interpretability of the model parameter estimation. The separation processing of TERGM model is given in Equation 8:
where is the existence status of the formation of new relations in the TDN; is the formation network of trade dependence relations from time to time , and its network structure is set to . is the existence status of the dissolution (or persistence) of old relations in the TDN; denotes the dissolution (or persistence) network of trade dependence relations from time to time , and its network structure is set to . Noteworthy, and can be actually captured, while and can be regarded as the combined state of and , thus the intermediate state of network topology evolution can be determined. and are set in the following way: , . Therefore, the formation model and dissolution (or persistence) model of network relations is given in Equations 9, 10:
In this study, the maximum likelihood estimation (MLE) method was used to estimate the TERGM model as well as its formation model and dissolution (or persistence) model. The network topology contains numerous nodes and edges with complex relations; therefore, it is not suitable to perform MLE estimation directly. To solve this problem, the most effective solution is to use the pseudo maximum likelihood estimation (MPLE) method and the Markov chain Monte Carlo maximum likelihood estimation (MCMC MLE) method for rough estimation. Comparatively, the MPLE method based on self-help sampling has advantages in computing efficiency and fitting accuracy in large sample size estimation (Leifeld et al., 2018). Therefore, this study uses the MPLE method to estimate the TERGM model and its separated models, and uses the MCMC MLE method for robustness test.
3.4 Variables description
3.4.1 Temporal impact variable of abrupt changes in economic and trade environment ()
Since 2018, “anti globalization” has been gaining momentum. Various incidents such as the Sino–US trade war, the trade conflict between USA and Europe, the trade frictions between Japan and South Korea, and Brexit have occurred one after the other, which exhibited a strongly negative impact on the bilateral trade among countries and the global agricultural supply chain (Anderson, 2022). During this period, abrupt changes of economic policy, regional conflicts, extreme weather events, and other problems occurred frequently, further exacerbating the global food supply crisis (Brenton et al., 2022; Arita et al., 2022). In 2020, the COVID-19 pandemic caused many problems such as clogging of cross-border trade, aggravation of trade protectionism, and worldwide economic recession that greatly reduced the stability of the global agricultural trade network (Arita et al., 2022; Brenton et al., 2022). During the period 2018–2020, bilateral trade frictions, COVID-19 pandemic, and other abrupt changes in the economic and trade environment could be together regarded as an ideal exogenous shock. Compared with the period 2018–2020, the changes in the global trade environment in 2017 and previous years were relatively mild and slow, thus the data of year 2017 could be used as a control. Based on this fact, in this study, years 2018, 2019, and 2020 were selected as three time nodes to construct a co-network variable, and this variable was then used to quantitatively evaluate the impact of exogenous shock on the evolution of the global TDN of highly vulnerable agricultural products at each time node.
3.4.2 Network endogenous structure variable ()
The endogenous structure variable of the network reflects the self-organization process during the formation of the TDN. It is irrelevant to the political, economic, and other national characteristics of both parties of the trade; rather, it is related to the specific internal model that drives the formation and evolution of the network relations. Following the practice of Song et al. (2020) in selecting the set of endogenous structure variables, in this study, the following variables were selected: the number of edges (), reciprocity (), preferential dependence (), transfer connectivity (), and transfer closure (). Table 1 presents the description of the parameters used in the TERGM model.
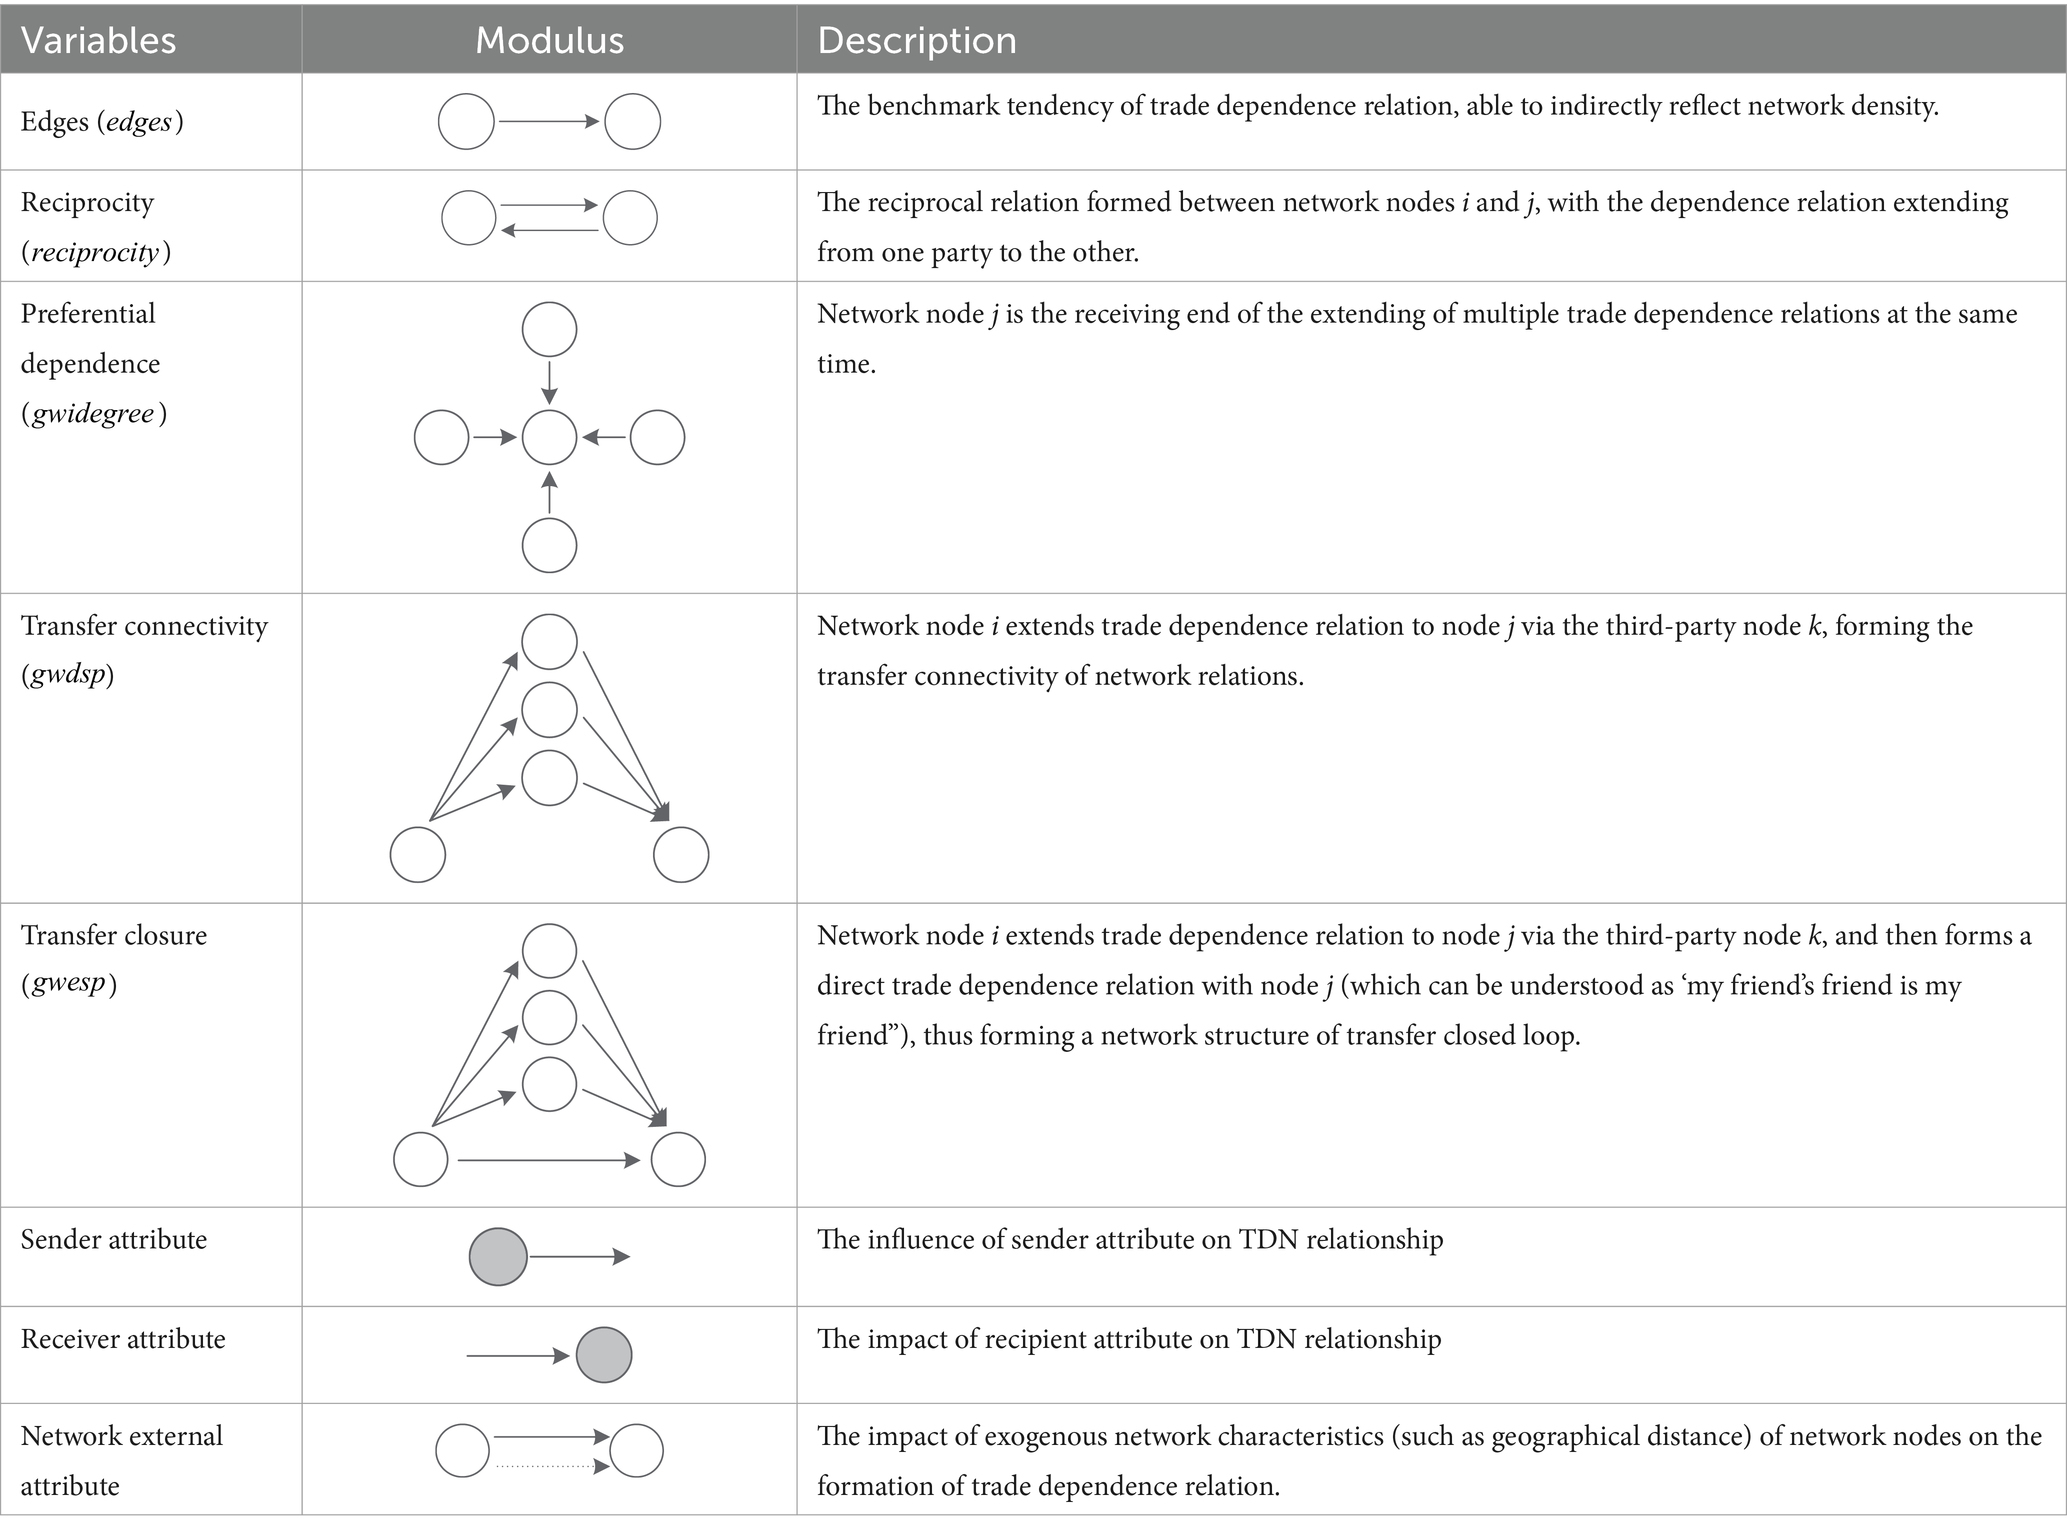
Table 1. Description of variables of TERGM model.
The number of edges () represents the number of relation edges in the TDN, which indirectly reflects the density of the trade network. It is equivalent to the intercept term in the traditional linear regression model. Reciprocity () indicates the degree of interdependence among network nodes, that is, the probability of both country i and country j extending trade dependence relation to each other. Reciprocity is not only the basic principle in the action norms advocated by the World Trade Organization, but also a win–win model to achieve international division of labor and resource complementation. Preferential dependence () represents the convergence characteristics of TDN relations, that is, a network node (country) accepts trade dependence relations from multiple nodes at the same time. In the international TDN, a small number of “trade star” “countries, such as the USA and several other countries with high development level in agriculture, are involved. They occupy dominant positions in the market because of their high competitiveness in agriculture (Hunter, 2007). Transfer connectivity () and transfer closure () represent the intermediary linkage form of the network node group. Transfer connectivity refers to the indirect transfer of trade dependence relation between country i and country j through the relay of one or more third-party countries. However, transfer closure refers to the formation of direct trade dependence relation between country i and country j under the influence of third-party countries. In international trade, there exists information asymmetry between the countries in a TDN due to regional differences in politics, culture, language, and geography, which incurs information search and matching costs. In order to reduce the transnational supply risk caused by the uncertainties of the international market, the participating countries tend to establish new trade dependence relations through the information sharing of the third-party trading partners. With the deepening of globalization in trade, the TDN can acquire the characteristics of “small world’, which can promote the network structure to evolve toward a closure state.
3.4.3 Network exogenous structure variables ()
The exogenous structure variables mainly include the setting of control variables in the traditional trade gravity model, primarily involving the actor attributes and the external characteristics of the network. They are directly related to the formation and evolution of the structure of TDN. The actor attributes are the national characteristic variables of the sender and receiver of the trade dependence relation. In this study, three variables, namely, per capita GDP (), population (), and degree of trade openness () were selected to measure both the exporting country and the importing countries, separately. The external characteristics of network are the fixed exogenous situational factors in the layout of trade dependence relations, which are directly related to the fixed costs incurred in trade relations, such as the geographical distance between two countries ().
3.5 Data and definitions
Herein, real agricultural trade data were used to evaluate the impact effects of the three exogenous temporal shock variables on trade in 2018, 2019, and 2020. Considering the operational efficiency of the TERGM model, three groups of trade dependence observation networks that dynamically change with time were constructed, as follows: Group 1 covers the years 2015, 2016, 2017, and 2018; Group 2 covers years 2016, 2017, 2018, and 2019; and Group 3 covers years 2017, 2018, 2019, and 2020. Through the estimation of the abovementioned three groups of models, the impact effects of abrupt changes in the economic and trade environment on the TDN of highly vulnerable agricultural products at the historical time nodes relative to the average change in the previous 3 years can be accurately assessed.
The agricultural trade dataset used in this study was obtained from CEPII-BACI,2 a global trade database. CEPII-BACI contains a huge amount of global trade data of the agricultural products under the 6-digit HS Codes. The trade data set in CEPII-BACI is characterized by unified measurement metrics, complete country coverage, and timely data update, which aid in creating a favorable condition for comparative analysis among different countries and industries. The research objective of this study is the trade of all types of agricultural products, encompassing 698 agricultural products under the 6-digit HS codes specified in chapters 1–24 of the Harmonized Commodity and Coding System (HS6) supplied by 227 countries and regions. There are about 15.63 million pieces of original sample data in CEPII-BACI. Among other relevant variables, the data bits of per capita GDP, total population, degree of trade openness, and geographical distance were obtained from the World Bank database3 and Payne World Table.4
4 Characteristics of TDN and visualization-based analysis
4.1 Distribution of industries of highly vulnerable agricultural products
In this study, accounting was performed on the collected agricultural trade data for the period 2016–2020 to identify industries of highly vulnerable agricultural products in the international agricultural trade network, using the variation index of export centrality at the level of global trade as the criteria. The results show that 260 of the 698 agricultural products under the 6-digit HS codes are highly vulnerable,5 covering multiple agricultural product industries under the 23 2-digit HS codes other than cocoa and cocoa-related products (HS-18) and miscellaneous edible preparations (HS-21). In the 5 years from 2016 to 2020, the average annual trade volume of highly vulnerable agricultural products in the world was about 227 billion US dollars, accounting for around 14.3% of the total trade volume of agricultural products. In order to facilitate visual observation of the weight of the agricultural products of each industry in the global trade, 260 highly vulnerable agricultural products were placed under the 6-digit HS codes into 110 categories under the 4-digit HS codes for graphic analysis.6
Figure 1 shows the average distributions of the total trade volume and export centrality variation index of the highly vulnerable agricultural products under the global 4-digit HS codes in the 5 years from 2016 to 2020. Regarding total trade volume, the industries with high trade volume in the global trade of highly vulnerable agricultural products are mainly distributed in the categories of meat (HS-02), animal, and vegetable oils (HS-15); fish and other aquatic products (HS-03); fruits and nuts (HS-08); and cereal products (HS-10). The industries of these five categories account for nearly 70% of the world’s total trade volume of highly vulnerable products. Regarding export centrality variation index, some industry categories have extremely high export centrality variation degree of agricultural products. They are widely distributed in some categories under the 2-digit HS codes. For example, food production residues (2303), starch products (1108), hops cones (1210), etc. exhibit high degrees of supply concentration and high unit price, indicating that these markets are monopolized by sellers to some extent.

Figure 1. The distributions of the highly vulnerable agricultural products for the period 2016–2020.
4.2 Descriptive statistical analysis of network characteristics
Based on the identified industries of highly vulnerable agricultural products and the constructed complex trade network model, descriptive statistical analysis was further carried out on the characteristics of TDN. Table 2 presents the values of descriptive statistical indicators of the global TDN of highly vulnerable agricultural products in 2005, 2010, 2015, and 2020.
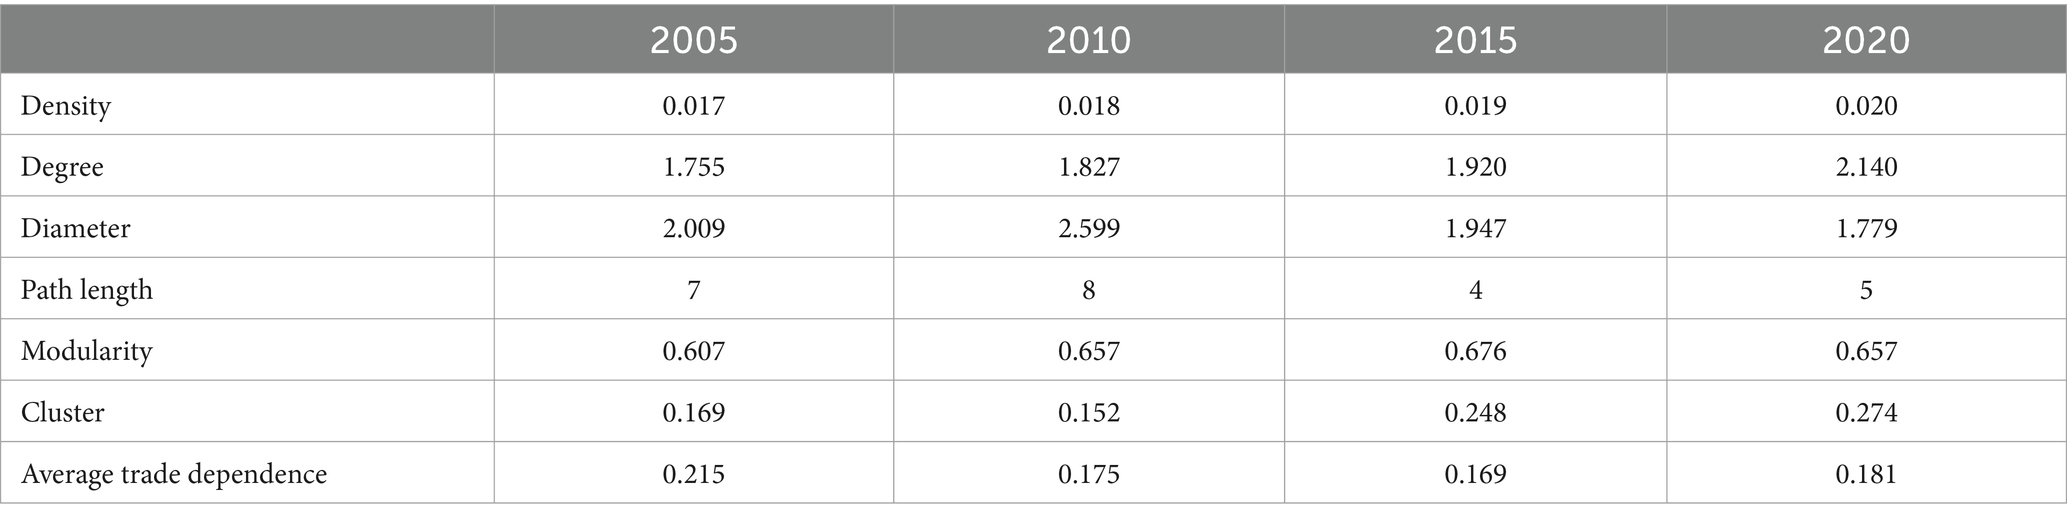
Table 2. Descriptive statistics of highly vulnerable agricultural trade dependence network.
Overall, the topological structure of the global TDN of highly vulnerable agricultural products exhibits a certain degree of stability amid constant variation. The average network density in 2005, 2010, 2015, and 2020 is 0.019, and it exhibits a trend of increasing year by year, which indicates that countries have become progressively more interdependent in the global trade of highly vulnerable agricultural products. The average degree of TDN is about 1.755–2.140, which indicates that the average number of dependence edges of each network node is about 2. The average path length of the TDN is 2.08, while the average network diameter fluctuates around 6. It indicates that each network node can achieve the extension of trade dependence relation through about two hops, and the longest path distance is about 6, which is consistent with Milgram’s “six-degree segmentation” hypothesis, i.e., the “small world phenomenon” inference. The modularity and clustering coefficients of the TDN exhibit a certain increasing trend, which indicates that the nodes in the TDN of agricultural products are increasingly clustering around the central nodes of the network, and that multiple communities have been formed around regional centers. Furthermore, the average trade dependence indexes of the four periods were calculated herein. The results are 0.215, 0.175, 0.169, and 0.181, respectively. Clearly, the average trade dependence index showed a downward trend from 2005 to 2015, which indicates that the number of new market dependence links and the number of central nodes among trading countries increased, and the elevated degrees of substitutability and diversification in trade transactions weakened the trade dependence among economies to a certain extent. In 2020, the global trade dependence index of highly vulnerable agricultural products increased dramatically, which can be attributed to the clogging of cross-border trade and the rise of trade protectionism caused by abrupt changes in the economic and trade environment such as intensified bilateral trade frictions, the COVID-19 pandemic, and so on.
4.3 Visualization-based analysis of network topology evolution
In order to obtain a clear picture of how the network topology of the global TDN of highly vulnerable agricultural products has been evolving, visualization-based analysis on the TDN of highly vulnerable agricultural products for years 2005, 2010, 2015, and 2020 was carried out herein.7 The results are shown in Figure 2. Noteworthy, the nodes represent the sample countries, and shadow size of each node reflects the centrality of that node, that is, the larger the number of trade dependence edges of a country, the larger the node shadow of that country. Countries with close trade dependence relation are close to each other in the graph, and vice versa. The connecting lines represent the trade dependence edges. The thickness of an edge is proportional to the value of the dependence index. The thicker the edge, the higher the degree of trade dependence.
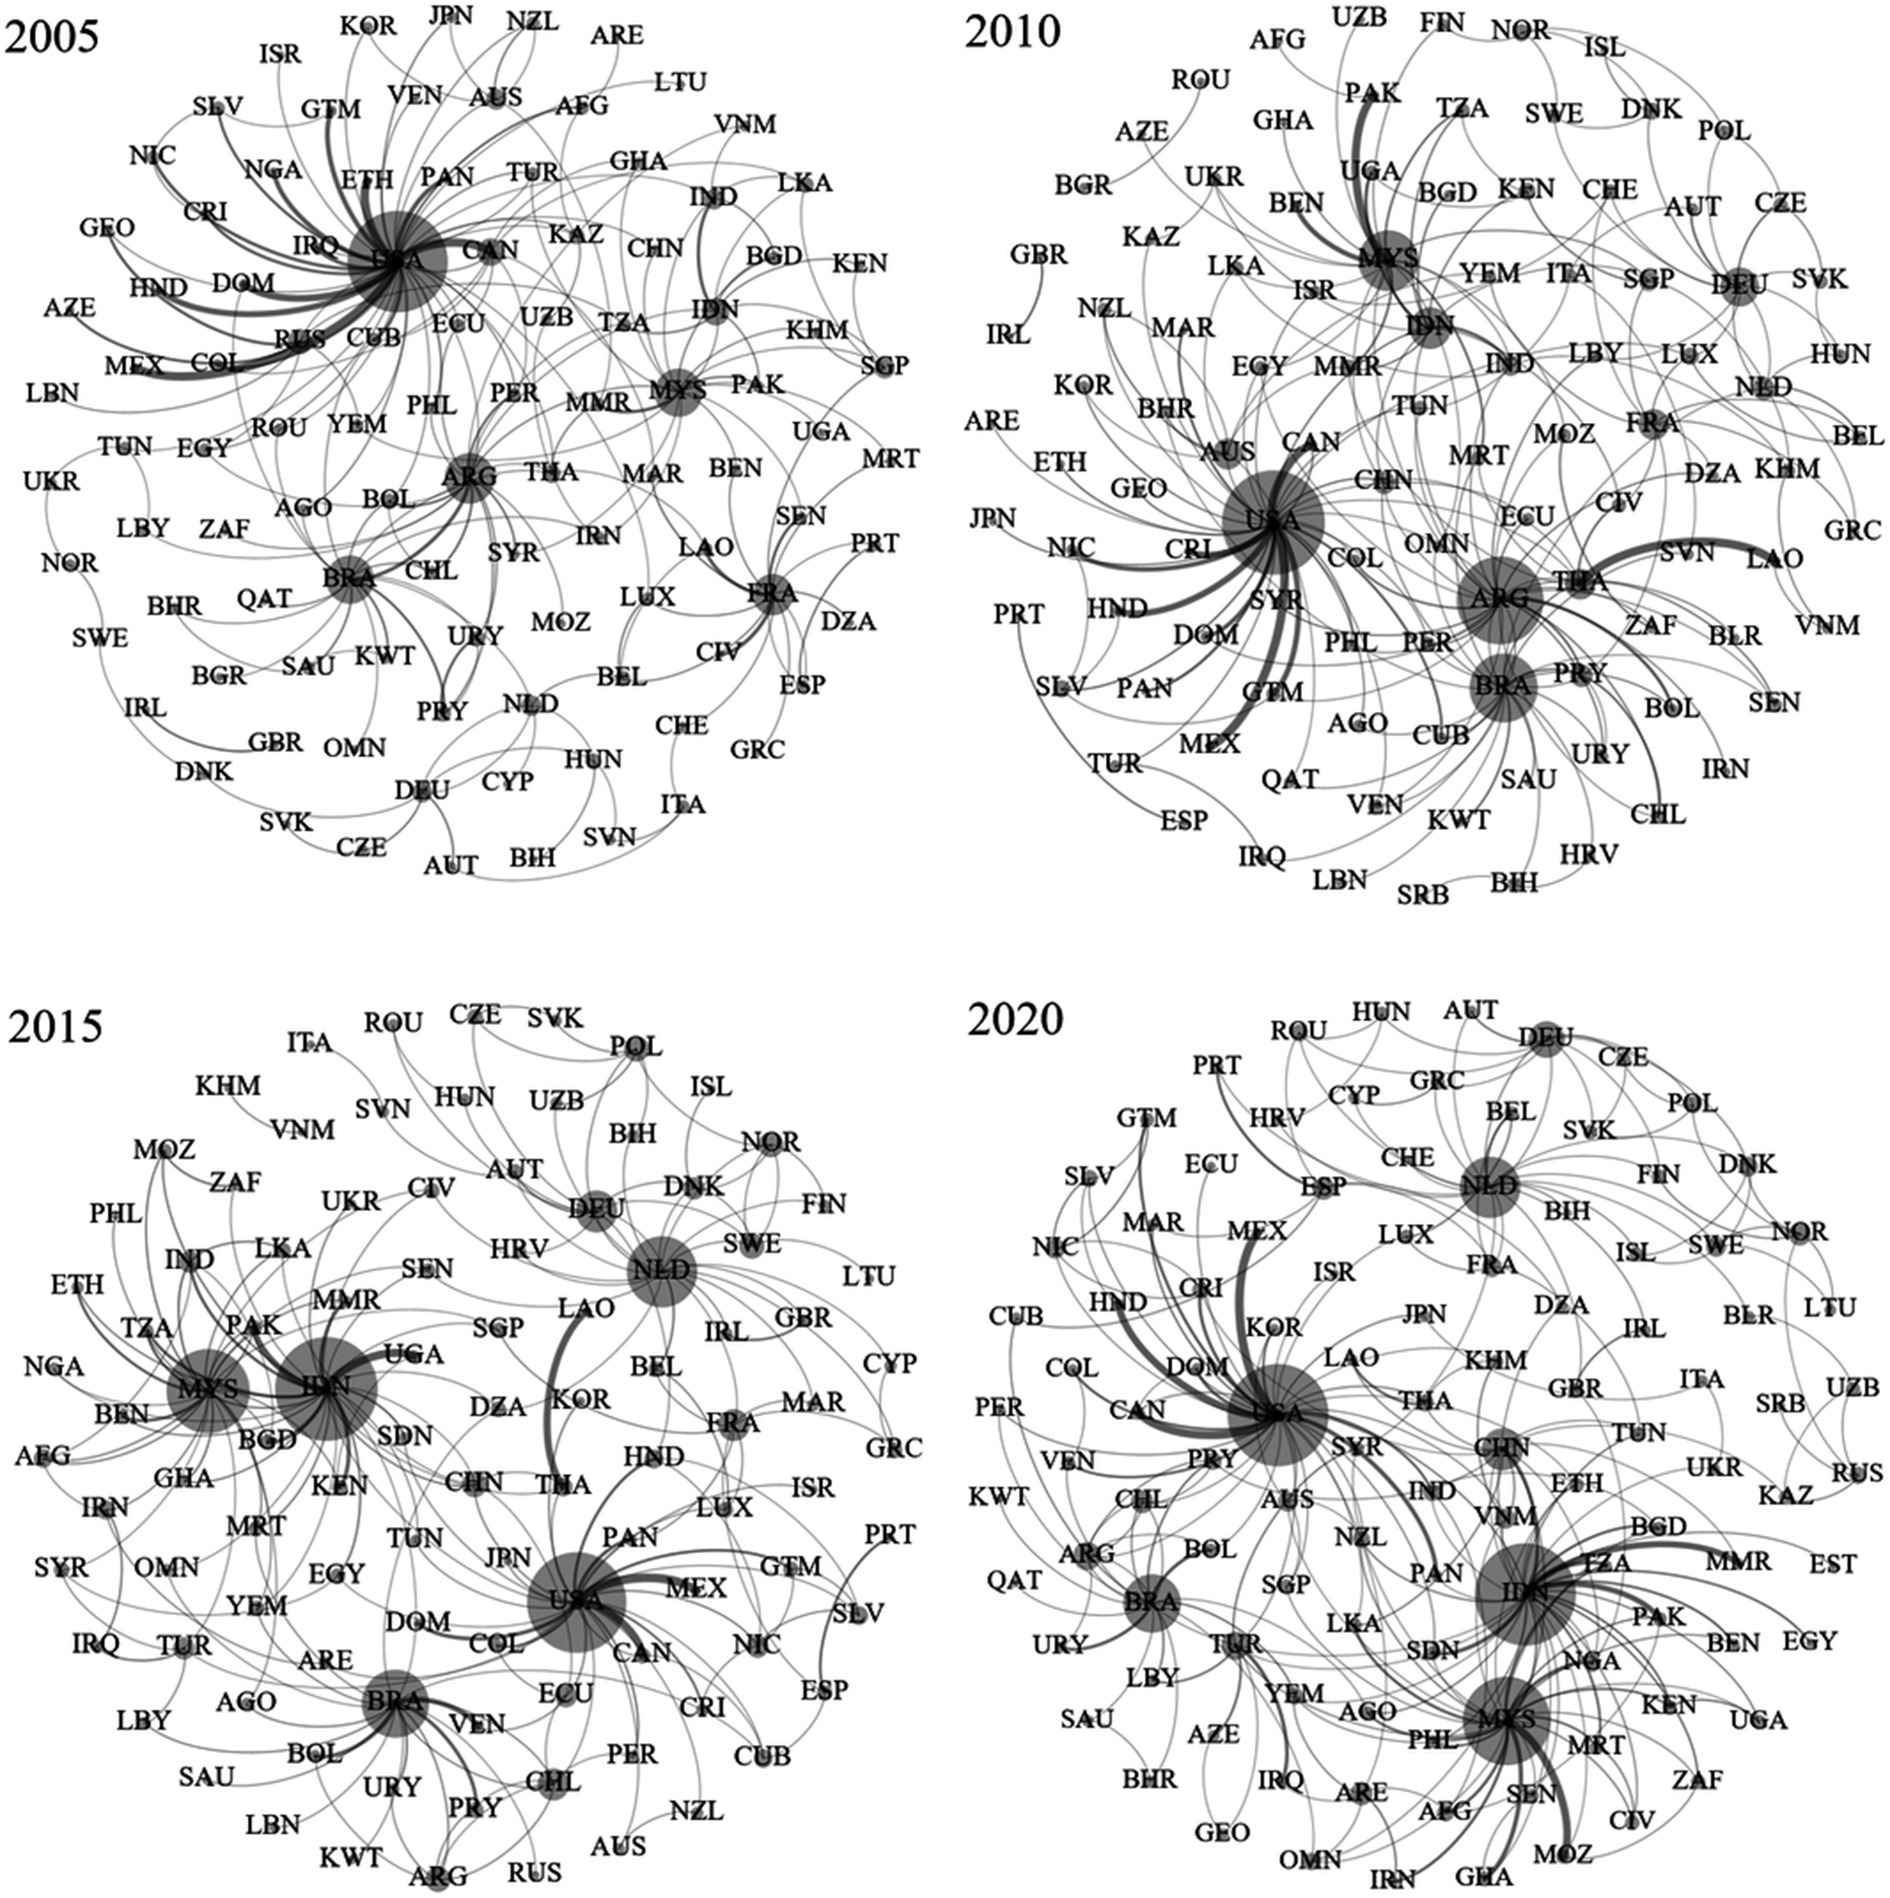
Figure 2. The TDN of highly vulnerable agricultural products for years 2005, 2010, 2015, and 2020. Appendix Table A2 defines the ISO codes.
It can be seen intuitively that the structure of the global TDN of highly vulnerable agricultural products exhibits a “polycentric” development trend, that is, shifting from the network structure with a single dominant central node (USA) toward the one with multiple central nodes (USA, Malaysia, Indonesia, Brazil, the Netherlands, etc.). It means that the TDN of highly vulnerable agricultural products is no longer driven by a single core or a small number of cores. Instead, more countries jointly perform the function of “multi-core” driving in the trade dependence relations, thus weakening the dominant positions of a few developed economies in the market. Since 2005, the previous trade center nodes and trade dependence relations in the TDN of highly vulnerable agricultural products have been largely preserved (except for a few central nodes such as Argentina), and several community modules have taken shape. With the rapid pace of agricultural globalization, the weights of the participating countries in the global trade network of highly vulnerable agricultural products have changed to varying degrees, more trade center nodes have emerged, and new links of trade dependence relations among countries have been established constantly. In 2020, the trade dependence among countries became even more stronger compared with that in 2005, 2010, and 2015 even though the central nodes in the TDN tended to be stable.
At the country level, although the centrality of the USA in the TDN of highly vulnerable agricultural products has declined to a certain extent, it still occupies the central position in the trade network. At present, the USA ranks no. 1 in the global trade of highly vulnerable agricultural products in terms of both the number of product types and export volume, which is consistent with its position as a world agricultural power. Nearly 30% of the top 100 countries with the largest import volume of agricultural products in the world depend on the export from the United States, in particular, Mexico, Canada, and so on. Among the developing economies, Indonesia and Malaysia have increased their influence significantly in the global TDN of highly vulnerable agricultural products. There is high degree of similarity between the two countries in the exported agricultural products, in particular, in the advantageous industries such as plant oils (mainly palm oil) and their pyrolysis products, animal feed, animal-derived products, fish, and so on. When the exports of agricultural products from Europe, the USA, and other regions were hindered by the COVD-19 pandemic in 2020, Indonesia and Malaysia seized the opportunity in the international market to achieve a significant increase in the export volume of highly vulnerable agricultural products. In 15 years prior to 2021, China’s position in the global TDN was improved to a certain extent. In 2020, China became the sixth largest central country in the global trade of highly vulnerable agricultural products. Noteworthy, although China’s export of highly vulnerable agricultural products is rich in product types and high in trade volume, there is a significant gap between the centrality degree of China and those of the United States, Indonesia, etc., which indicates that China does not occupy a strong central position in the global TDN. This is attributed to the fact that China’s export of highly vulnerable agricultural products is distributed in many countries, and the exported products mainly serve the purpose of filling the supply–demand gap when there is a shortage of supply in the international market, thus the influence of China’s export exhibits relatively weak influence on the international agricultural product market.
5 Model estimation results
5.1 Estimation results of TERGM model
TERGM fitting estimation was carried out on the TDN of highly vulnerable agricultural products. The regression results are presented in Table 3. Clearly, the coefficient values of the temporal shock co-network variables , , and are significantly positive. Compared with the average state of the three years prior to each temporal shock point, the abrupt changes in the economic and trade environment during the period 2018–2020 have significantly enhanced the existence status of the TDN relations in the trade of highly vulnerable agricultural products, and the impact strengthened year by year. The supply concentration in the trade of highly vulnerable agricultural products is high, thus incidents such as bilateral trade friction and COVID-19 pandemic can easily cause many problems in the international agricultural market, such as supply exceeding demand, price hiking, and dramatic decline of trade volume. In order to mitigate the supply risks such as supply shortage in cross-border trade, most of the importing countries choose to seek supply of key products from alternative countries at the cost of reducing economic efficiency. In other words, these countries make use of the trade transfer effect of the exporting countries to improve supply security of highly vulnerable agricultural products, which can strengthen the multi-connectivity of the global TDN of highly vulnerable agricultural products. For example, when Sino–US trade friction occurred, China’s import of agricultural products from the USA declined sharply. To make up for the supply shortage, China turned to Brazil, Canada, New Zealand, and other countries for alternative supply sources, thus forming new trade dependence relations with these countries.
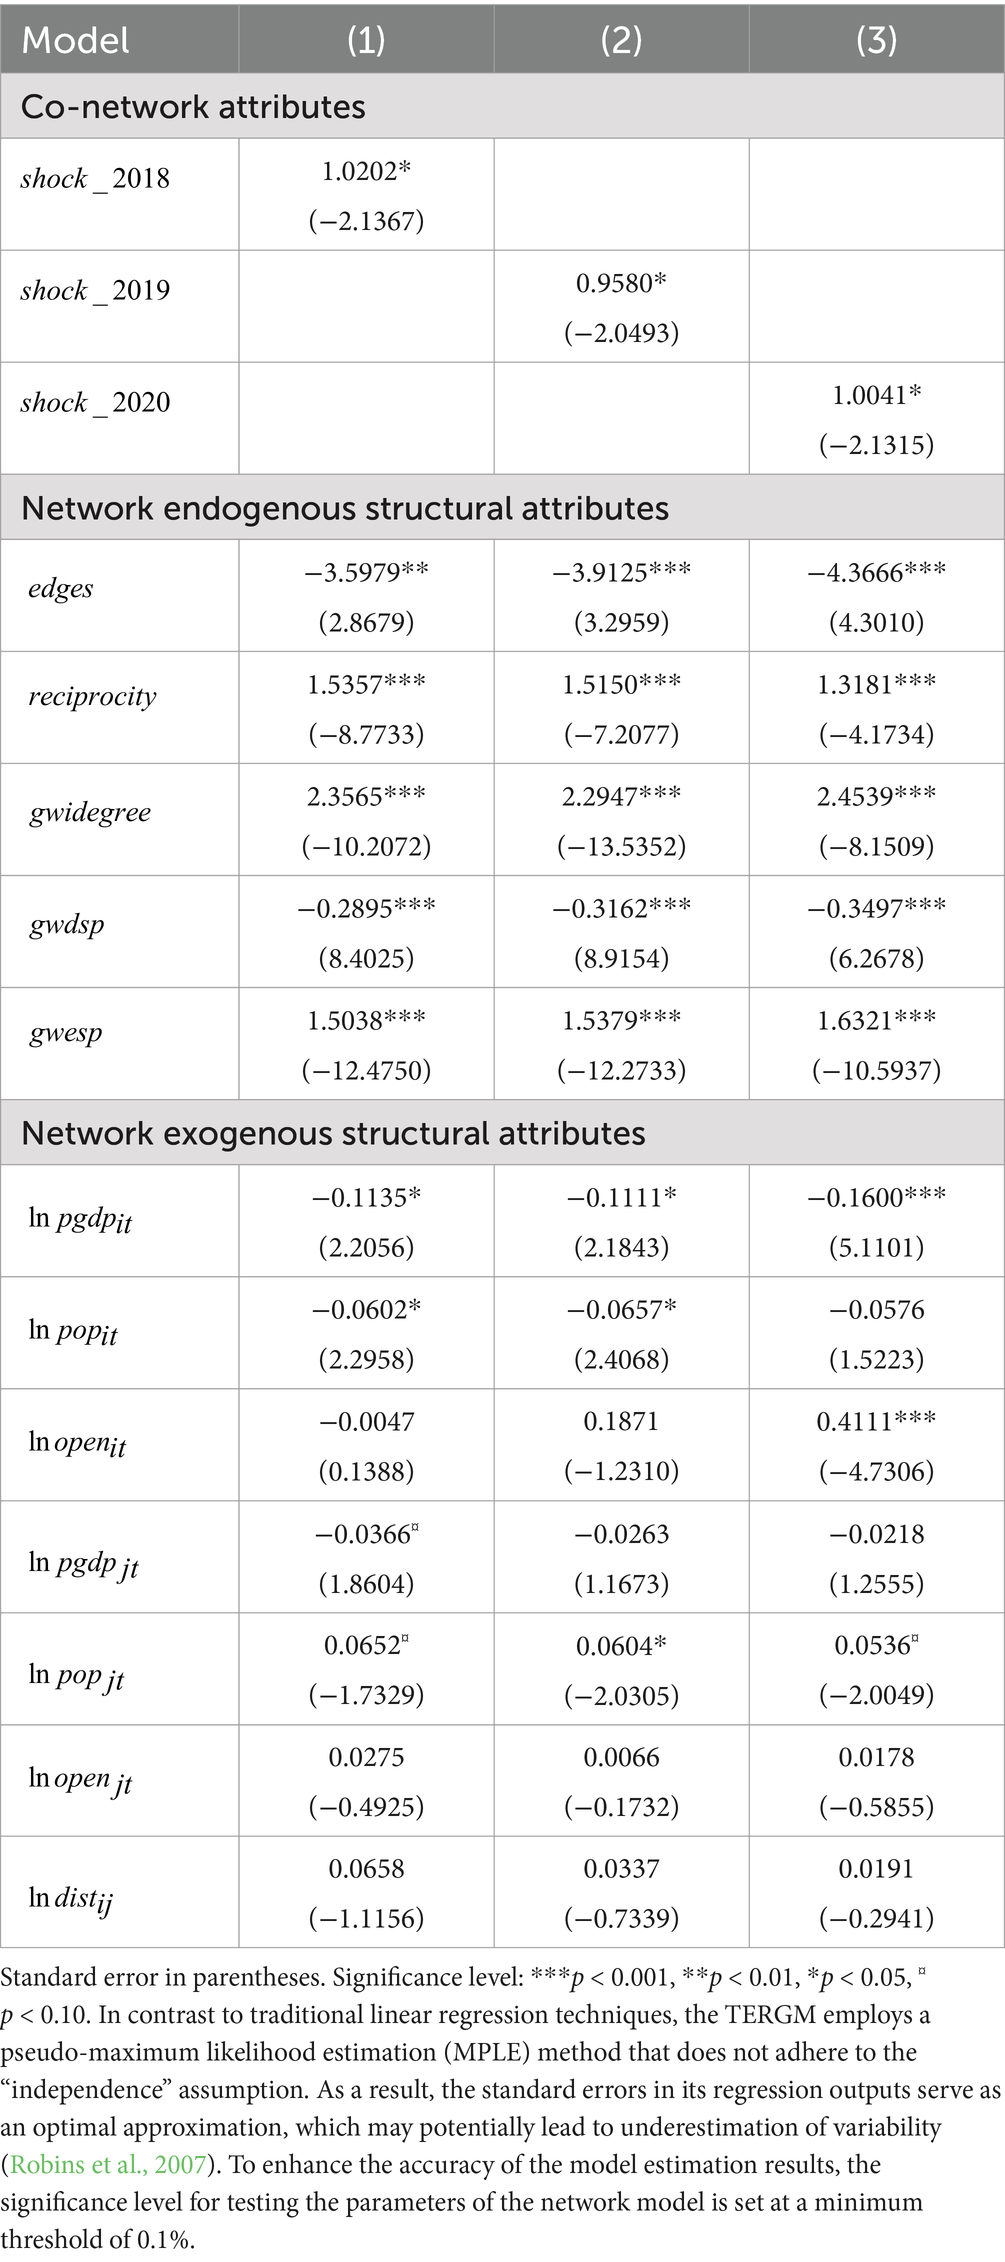
Table 3. Estimation results of TERGM model.
Among the endogenous attributes of the network nodes, , and all exhibit significantly positive coefficients, which indicates that reciprocity, preferential dependence, and transfer closure have positive impact on the formation of the TDN of highly vulnerable agricultural products. In particular, the impact coefficient of is quite high. It indicates that the “polycentricity” of network nodes plays an important role in the evolution of topological structure of the TDN of highly vulnerable agricultural products, that is, to strengthen the connections in the TDN by creating “central attraction” within regions. The coefficient of is significantly negative, indicating that the TDN of highly vulnerable agricultural products exhibits salient characteristics of multi-connectivity. However, this type of connectivity path tends to form closed loops, which can hinder the evolution of the TDN. Regarding the exogenous attributes of network nodes, the global TDN of highly vulnerable agricultural products exhibits significant actor relationship effect. The sender attributes and are significantly negative, and shows negative characteristics, which indicates that a relatively high level of economic development and a large population can reduce the probability of an exporting country extending trade dependence relation, while a relatively high degree of trade openness can significantly increase the probability of extending trade dependence relation. Among the recipient attribute, shows negative characteristics, while shows positive characteristics, which indicates that for an importing country, relatively low level of economic development and a relatively large consumption scale will enhance the tendency of forming trade dependence relations. The coefficient of network external attribute is not significant, which indicates that in the post-globalization era of trade convenience, the impact of geographical distance on the trade dependence relations has become weaker than before.
5.2 Estimation results of STERGM model: formation model and dissolution (or persistence) model
Based on the benchmark model estimation, fitting estimation was further carried out on the separated models of TERGM; i.e., the formation model and the dissolution (or persistence) model, with the aim of determining the impact of endogenous and exogenous factors on the new and old network relations in the TDN of highly vulnerable agricultural products. The estimation results are presented in Table 4. The coefficient values of , , and are significantly positive in the formation model and the dissolution (or continuation) model, which indicates that the abrupt changes in the economic and trade environment can significantly increase the probability of forming new dependence relations in the agricultural product trade network as well as increase the probability of maintaining the old relations. Although the abrupt changes in the economic and trade environment increase the costs of cross-border transactions thus inhibiting trade, it can stimulate the trade transfer effect and promote the formation of new bilateral trade links and trade dependence relations among countries. Moreover, given the high supply concentration degree of highly vulnerable agricultural products, the abrupt changes in the economic and trade environment cannot substantially weaken the dominant positions of the central node countries and the comparative advantage of their products in a short time, thus most of the existing trade dependence relations in the trade of highly vulnerable agricultural products are retained. The abovementioned results reflect that the weights of the economies in the trade network of highly vulnerable agricultural products changes under the influence of abrupt changes in the global economic and trade environment. For example, when the capacities of developed economies such as Europe and the United States to supply agricultural products declined during the outbreak of the COVID-19 pandemic, developing countries such as China and Indonesia showed a good opportunity to boost their exports of agricultural products. Although this does not bring fundamental changes to centrality of the existing trade centers and dependence relations in the trade network, it can help to generate new trade center nodes and promote the formation of new trade dependence relations.
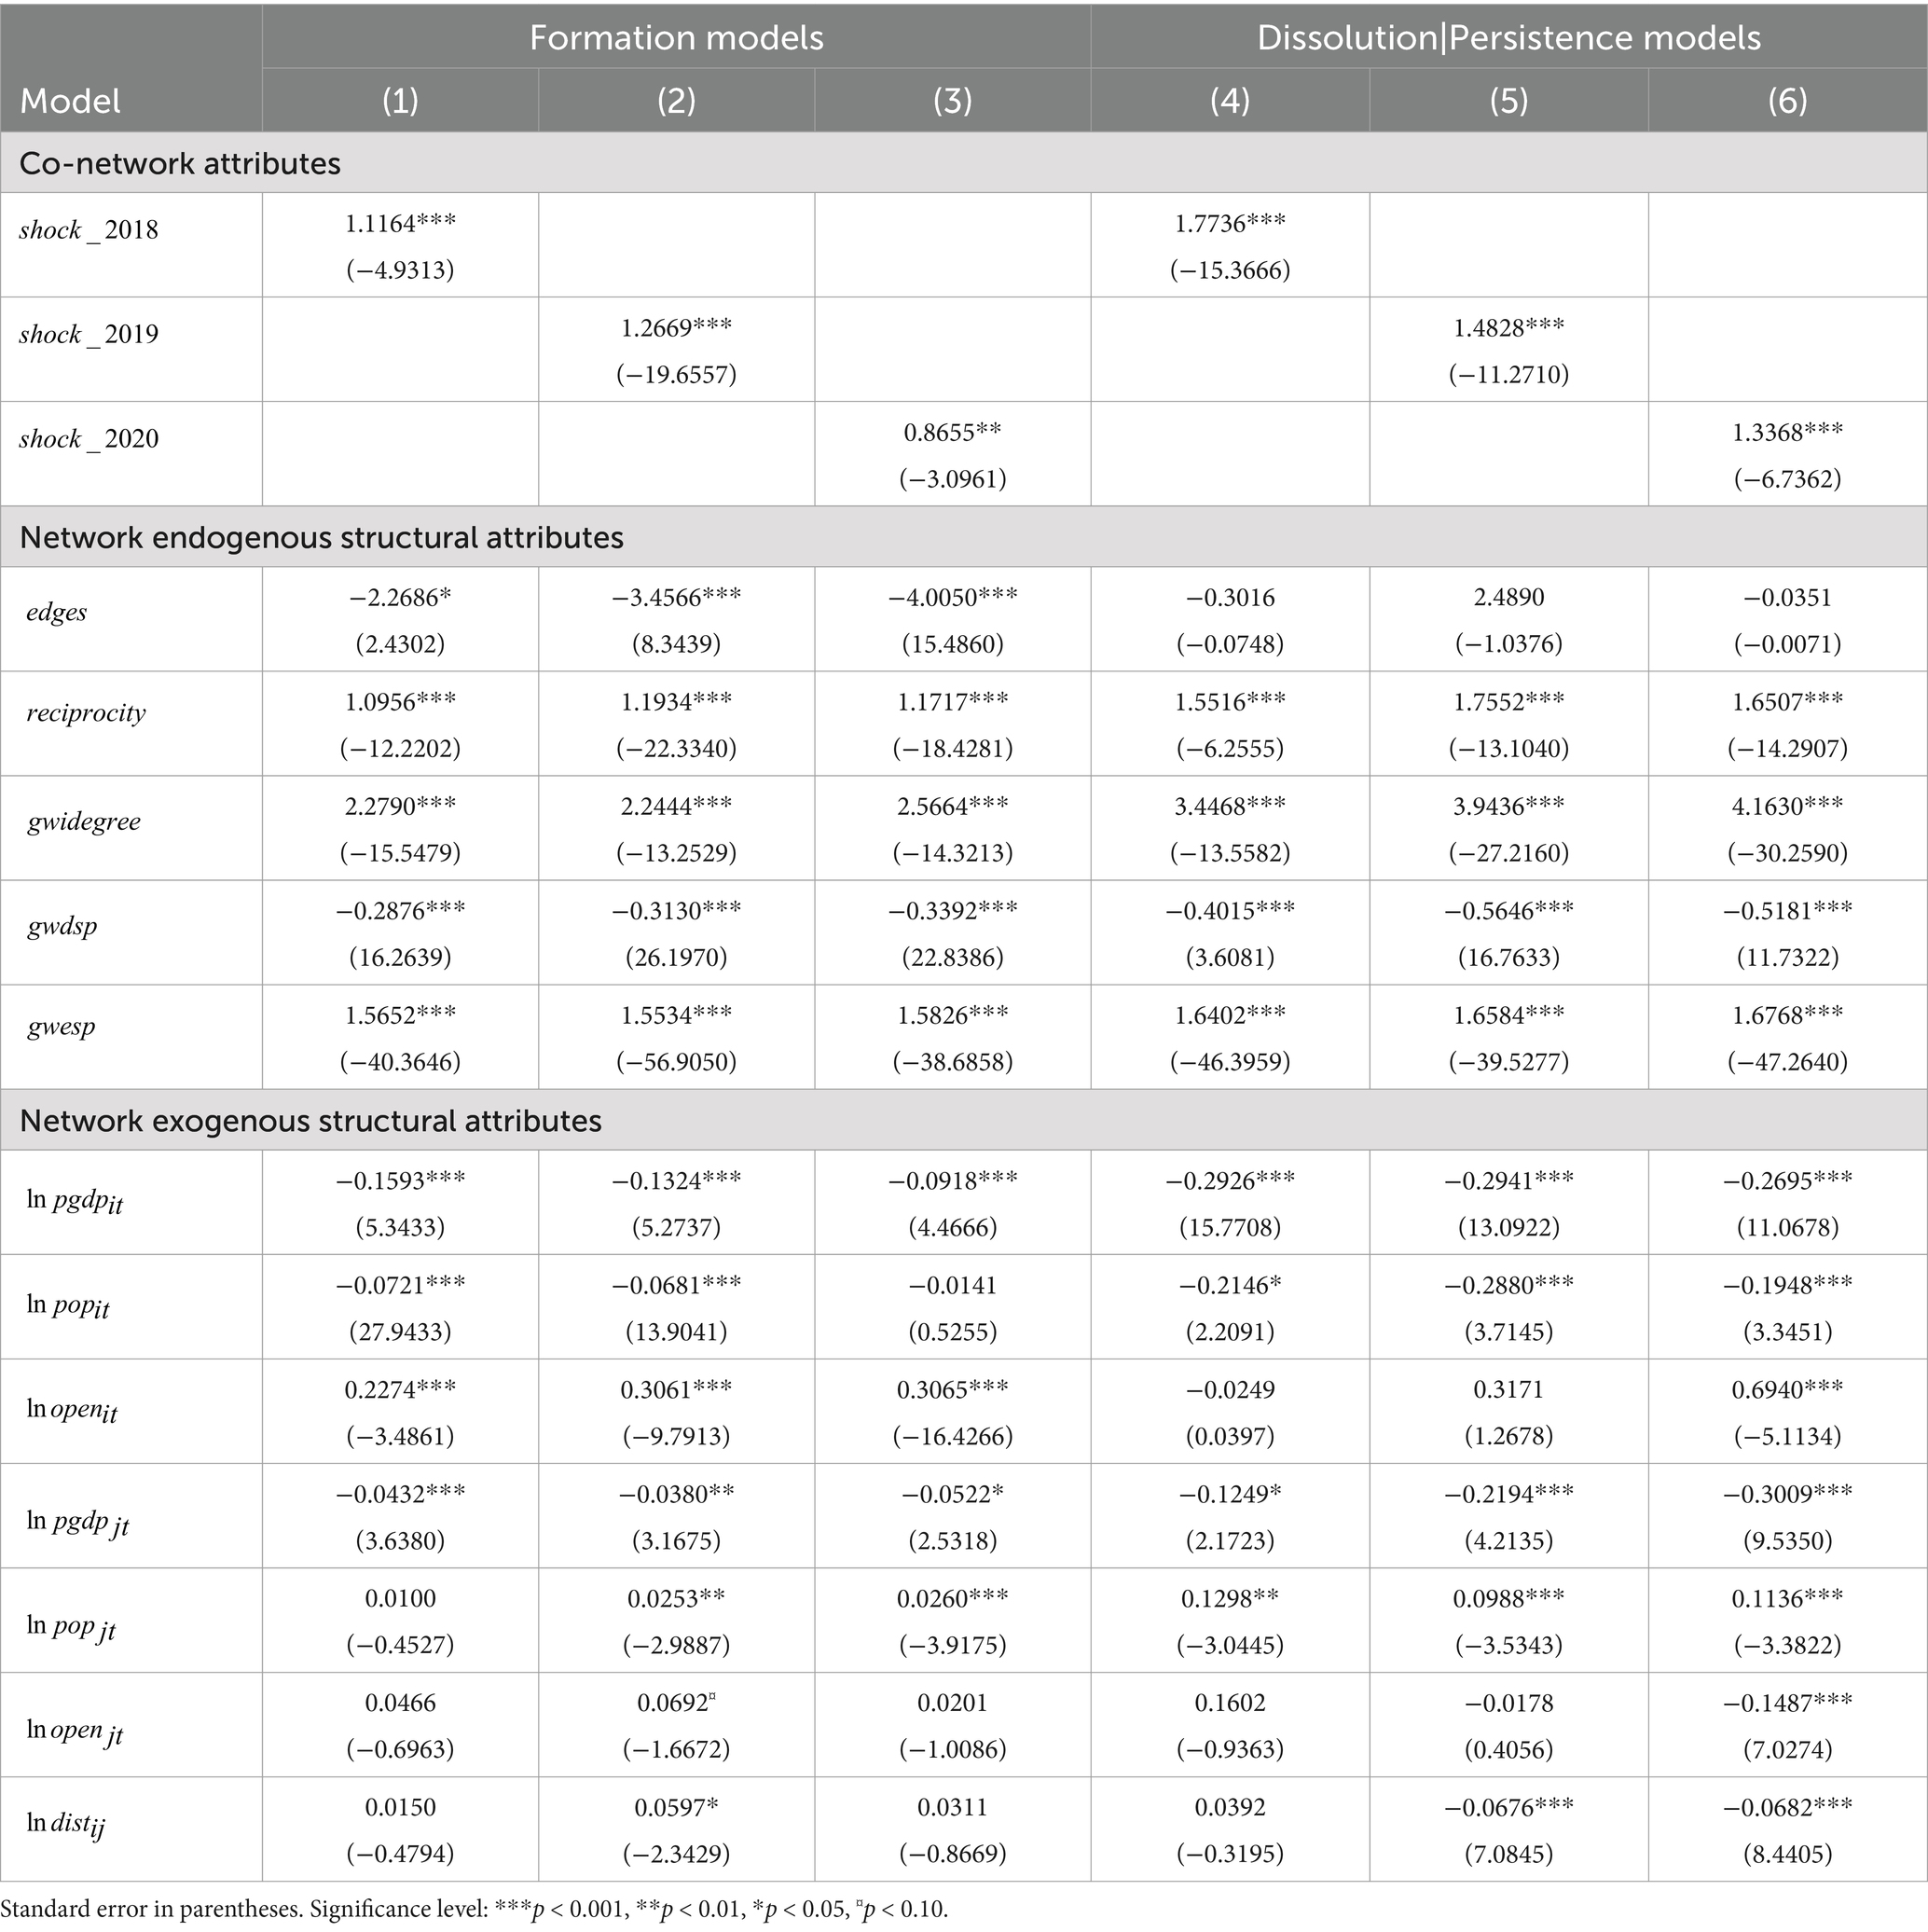
Table 4. Estimation results of STERGM model.
The regression results of the endogenous structure attributes of the network indicate that the coefficients of , , and are all significantly positive in the formation model and the dissolution (or persistence) model, while the coefficient of is significantly negative. It shows that reciprocity, preferential dependence, and transfer closure are conducive to the formation of new relations and the maintenance of old relations in the TDN of highly vulnerable agricultural products, while transfer connectivity reduces the probability of forming new dependence relations and increases the probability of dissolving the old dependence relations in the trade network. Overall, the endogenous self-organization process of network relations tends to promote the establishment and maintenance of the trade dependence relations among countries in the trade of highly vulnerable agricultural products. It indicates that agricultural globalization has strengthened the links among countries in agricultural trade, and promoted the formation of a trade paradigm of close cooperation and interdependence among countries by enhancing the comparative advantages of many countries and encouraging division of labor among countries. As to the exogenous attributes and external characteristics of other network nodes, the influence levels and significance levels of the variable coefficients are good, which is consistent with the estimated results of the TERGM model mentioned above.
5.3 Further robustness checks
In order to further verify the robustness of the estimation results of the TERGM model and its separated formation model and dissolution (or persistence) model, and avoid the problem of inaccurate estimation of confidence interval due to insufficient sample size, the MCMC MLE method was used herein for simulation estimation. The estimation results of the model are presented in Table 5, which summarizes only the regression results of the temporal shock point variables. The coefficient values and significance directions are basically consistent with the regression results presented in Tables 3, 4, which indicates that the estimated results of the TERGM model and its separated formation model and dissolution (or persistence) model are robust.
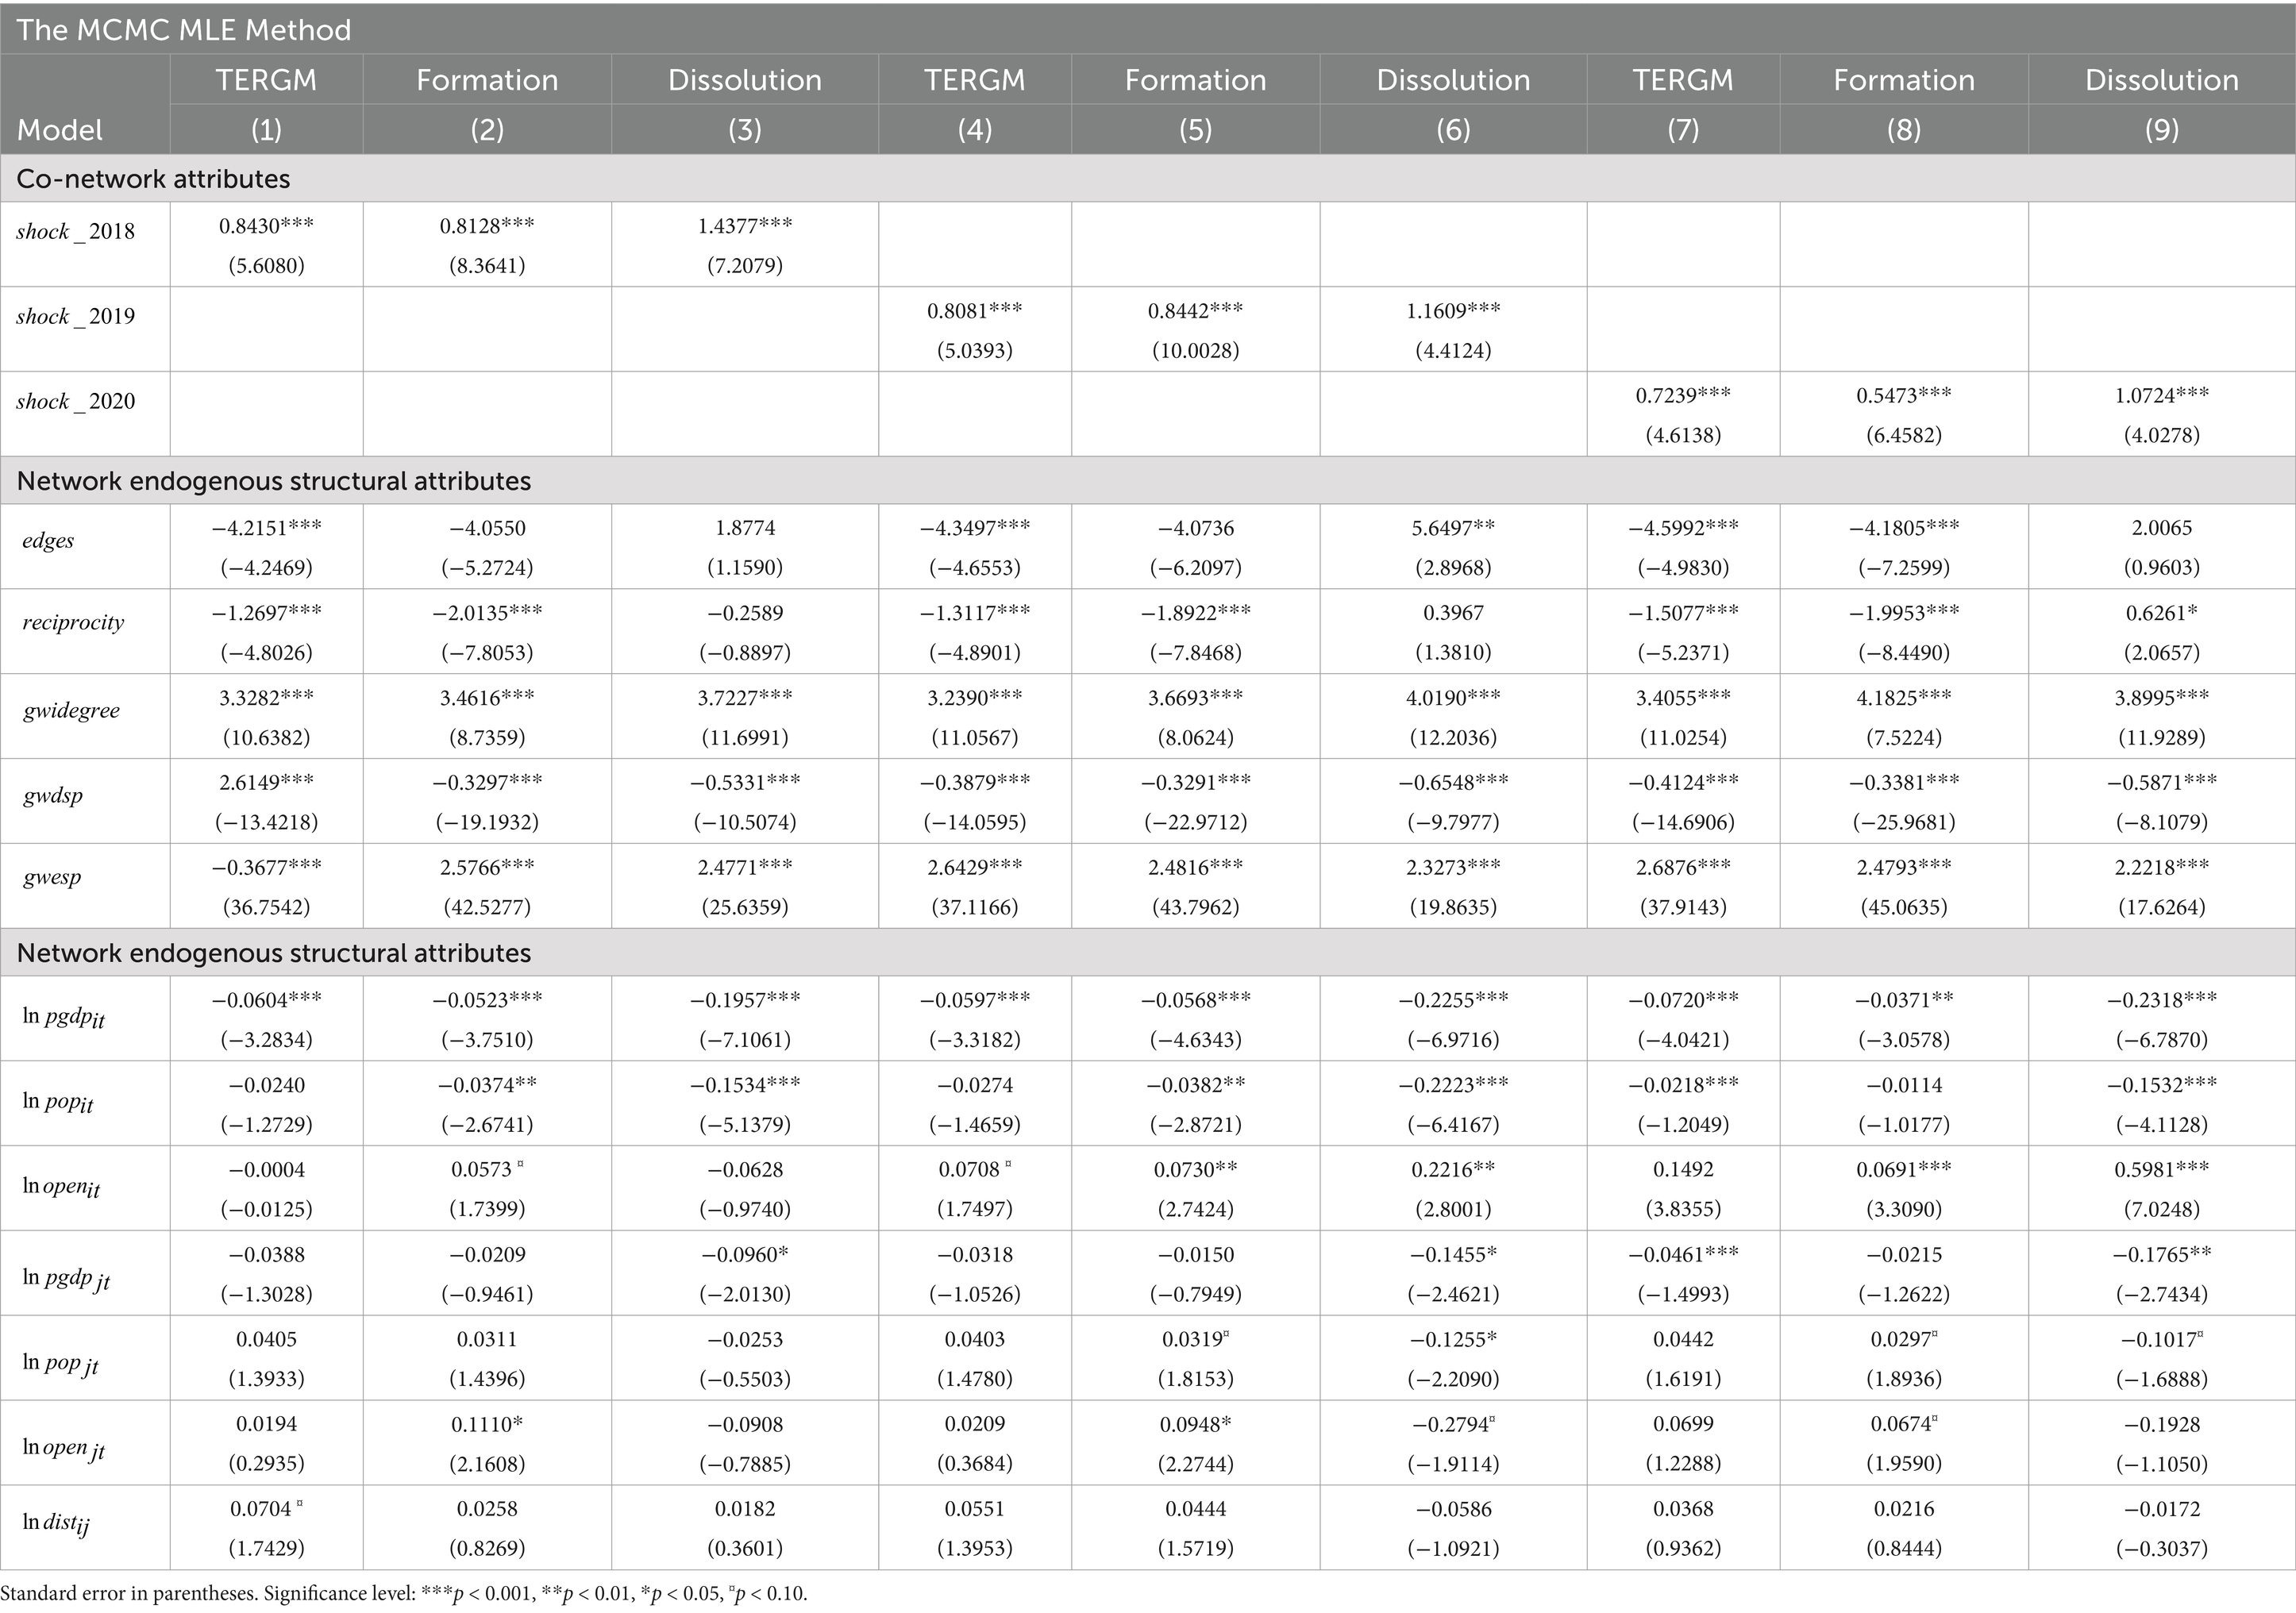
Table 5. Estimation results of robustness test.
6 Conclusion and policy implications
Considering the advantages of the social network analysis method in analyzing international trade problems, this method was applied in the research of global agricultural trade to explore the evolution of the global agricultural TDN from the perspective of vulnerability. First, agricultural industries that are highly vulnerable in international trade were identified. Then, a network visualization model is constructed for systematic analysis of the evolution of the topological structure of the global TDN of highly vulnerable agricultural products. Finally, a TERGM and its separated formation model and dissolution (persistence) model are established for quantitative assessment of the impact of the abrupt changes in the economic and trade environment on the TDN of highly vulnerable agricultural products in the period 2018–2020. The research results show that: First, the industries of highly vulnerable agricultural products in the global agricultural trade are distributed in a wide range, concentrating mainly in meat, animal, and vegetable oils; fish and other aquatic products; fruits and nuts; and cereal products, and the supply concentration degrees of these industries are high. Second, the trade links among economies in the global TDN of highly vulnerable agricultural products are becoming increasingly close, and the trend of trade integration is strengthening. From 2005 to 2015, the average degree of trade dependence among economies showed a downward trend, but increased during the COVID-19 pandemic in 2020. Third, the TDN of highly vulnerable agricultural products exhibits a “polycentric” development trend, that is, shifting from the network structure with a single dominant central node (the USA) toward the one with multiple central nodes (the USA, Malaysia, Indonesia, Brazil, the Netherlands, etc.). However, the United States still occupies the central position in the TDN, some developing countries such as Indonesia and Malaysia have significantly improved their positions. Fourth, during the period 2018–2020, when bilateral trade frictions intensified and the COVID-19 pandemic raged, the abrupt changes in the economic and trade environment led to significant enhancement in the dependence relations in the international trade of highly vulnerable agricultural products. Abrupt changes in the economic and trade environment not only induce the trade transfer effect and promote the formation of new trade dependent relations among countries, but also increase the probability of maintaining the existing trade dependence relations. Moreover, the endogenous self-organization process of network relations tends to promote the establishment and maintenance of the trade dependence relations among countries in the trade of highly vulnerable agricultural products. It indicates that agricultural globalization has strengthened the links among countries in agricultural trade, and promoted the formation of a trade paradigm of close cooperation and interdependence among countries by enhancing the comparative advantages of many countries and encouraging division of labor among countries.
International trade has always been regarded as an important vehicle to “eradicate hunger”; however, the risk brought by the vulnerability of trade networks cannot be ignored. The findings of this study can help us to dynamically track the vulnerable industries in the global agricultural trade and the trade dependence relations among countries, accurately identify the impact of abrupt changes in the economic and trade environment on the global TDN of agricultural products, and understand the factors driving the evolution of the global TDN of highly vulnerable agricultural products, thus providing theoretical and practical support for formulating relevant policies.
For developing countries with a high dependency on import trade, formulating flexible and executable trade policies is essential. These nations should revise their structural foreign trade policies to strike a balance between trade efficiency and long-term supply security. By implementing measures such as tariff adjustments and fiscal support, these countries can incentivize trade diversification, thus expanding import sources across various dimensions, including product types, source markets, and transportation channels. It is crucial to consider political stability, economic sustainability, and the needs of domestic industrial development when implementing these policies.
Specifically, in managing imported agricultural products, classifications should be based on trade concentration, product significance, and vulnerability characteristics. For economically vital imports, “efficiency-driven” policies can be adopted to broaden sourcing options; conversely, for critical imports that affect social stability and food security, a “safety-first” principle should be followed, prioritizing supply security even at the cost of some efficiency. Furthermore, developing countries should carefully select diverse trade partners, particularly those with stable political and economic relations and evident geographical advantages. By signing regional agreements and implementing trade facilitation policies, they can enhance trade connectivity with multiple import source countries.
To ensure food security, international organizations such as the Food and Agriculture Organization (FAO), various human rights organizations, the World Food Programme (WFP), and the World Trade Organization (WTO) should adopt a cooperative international rule paradigm that is relatively flexible. This paradigm will encourage discussions on new governance rules regarding agricultural production resource lists, emergency mechanisms, public safety reserves, and trade control reviews, thereby fostering international consensus on development and addressing the self-interested and fragmented nature of global food security governance. Additionally, based on regional political consensus, an inclusive and cooperative multilateral governance system for food security should be established. This system should work to gradually reduce international agricultural trade barriers, weaken agricultural capital monopolies, and dismantle information and technology blockades by improving the business environment, enhancing regulatory coordination, promoting policy dialogue, providing financial and technical support, and engaging in multi-track diplomacy.
Despite these efforts, challenges remain in ensuring policy consistency across countries, adapting to the specific needs of different nations, and achieving effective global resource distribution and technology transfer. Therefore, reforms in global food security governance must be comprehensive, dynamic, and adaptable to effectively respond to various challenges and ensure lasting global food security.
The limitation of this study is that the analysis of the evolution of the global TDN of agricultural products from the perspective of vulnerability was carried out mainly based on bilateral trade data, without considering the conditions of each country such as agricultural production potential, technology gap, consumption preference, and competition and cooperation relations with other countries. Undeniably, a lot more systematic explorations are further demanded to analyze the important influencing factors such as national agricultural production trajectory, specialization model, trade network adaptability, etc., in order to further improve the depth and practical significance of the research, which will be pursued in the future.
Data availability statement
The original contributions presented in the study are included in the article/Supplementary material, further inquiries can be directed to the corresponding author/s.
Author contributions
YW: Conceptualization, Data curation, Investigation, Methodology, Software, Writing – original draft, Writing – review & editing, Project administration, Resources. LZ: Conceptualization, Data curation, Formal analysis, Methodology, Project administration, Writing – original draft, Writing – review & editing, Funding acquisition, Supervision.
Funding
The author(s) declare that financial support was received for the research, authorship, and/or publication of this article. This work was supported by the Natural Science Foundation of Shandong Province (Grant No. ZR2023QG021), The National Social Science Fund of China (Grant No. 22CJY005), Colleges and universities in Shandong Province Youth Innovation Technology Support Plan (Grant No. 2023RW035).
Conflict of interest
The authors declare that the research was conducted in the absence of any commercial or financial relationships that could be construed as a potential conflict of interest.
Publisher’s note
All claims expressed in this article are solely those of the authors and do not necessarily represent those of their affiliated organizations, or those of the publisher, the editors and the reviewers. Any product that may be evaluated in this article, or claim that may be made by its manufacturer, is not guaranteed or endorsed by the publisher.
Supplementary material
The Supplementary material for this article can be found online at: https://www.frontiersin.org/articles/10.3389/fsufs.2025.1431945/full#supplementary-material
Footnotes
1. ^All countries selected in this study are presented in the visualization analysis graph.
2. ^See: https://www.cepii.fr.
3. ^See: https://data.worldbank.org.
4. ^See: https://www.rug.nl/ggdc/productivity/pwt.
5. ^We obtain the aggregation of agricultural industries of high vulnerability over the 5 years from 2016 to 2020, ensuring that the identified coverage of highly vulnerable agricultural products is comprehensive. It means that if the export centrality variation index of target industry is in the high range of 75% index value in any year from 2016 to 2020, indicating that there is a currently high-risk potential in the cross-border trade of the industry. Appendix Table A1 presents the coverage of highly vulnerable agricultural products in trade.
6. ^All HS codes and descriptions can be referred to the United Nations Statistics Division (UNSD). see: https://unstats.un.org/unsd/classifications/Econ/download/In%20Text/HSCodeandDescription.xlsx.
7. ^We used the Gephi software to draw the network structure diagram, and used the force-guided layout algorithm of Force Atlas and Fruchterman Reingold to describe the TDN structure. This algorithm can effectively dissolve the limitation of geographical distance, so that the national nodes with trade dependence relation attract each other; otherwise, they repel each other. Moreover, the use of this algorithm also effectively reduces the intersection of trade dependence edges in the trade network, and finally achieves the balance of the overall network layout.
References
Alhussam, M. I., Ren, J., Yao, H., and Abu Risha, O. (2023). Food trade network and food security: from the perspective of belt and road initiative. Agriculture 13:1571. doi: 10.3390/agriculture13081571
Anderson, K. (2022). Agriculture in a more uncertain global trade environment. Agric. Econ. 53, 563–579. doi: 10.1111/agec.12726
Arita, S., Grant, J., Sydow, S., and Beckman, J. (2022). Has global agricultural trade been resilient under coronavirus (COVID-19)? Findings from an econometric assessment of 2020. Food Policy 107:102204. doi: 10.1016/j.foodpol.2021.102204
Baldwin, R E. The spoke trap: Hub and spoke bilateralism in East Asia [R]. NCCR Trade Working Paper, (2009)
Blesh, J., Hoey, L., Jones, A. D., Friedmann, H., and Perfecto, I. (2019). Development pathways toward “zero hunger”. World Dev. 118, 1–14. doi: 10.1016/j.worlddev.2019.02.004
Braun, E., Braun, E., Gyimesi, A., Iloskics, Z., and Sebestyén, T. (2023). Exposure to trade disruptions in case of the Russia–Ukraine conflict: a product network approach. World Econ. 46, 2950–2982. doi: 10.1111/twec.13417
Brenton, P., Chemutai, V., and Pangestu, M. (2022). Trade and food security in a climate change-impacted world. Agric. Econ. 53, 580–591. doi: 10.1111/agec.12727
Brown, W. A. (1940). The international gold standard reinterpreted, 1914-1934[M]. New York: National Bureau of Economic Research.
Burkholz, R., Herrmann, H. J., and Schweitzer, F. (2018). Explicit size distributions of failure cascades redefine systemic risk on finite networks. Sci. Rep. 8:6878. doi: 10.1038/s41598-018-25211-3
Burkholz, R., and Schweitzer, F. (2019). International crop trade networks: the impact of shocks and cascades. Environ. Res. Lett. 14:114013. doi: 10.1088/1748-9326/ab4864
Campi, M., Dueñas, M., and Fagiolo, G. (2021). Specialization in food production affects global food security and food systems sustainability. World Dev. 141, 105411–105419. doi: 10.1016/j.worlddev.2021.105411
Casciaro, T., and Piskorski, M. J. (2005). Power imbalance, mutual dependence, and constraint absorption: a closer look at resource dependence theory. Adm. Sci. Q. 50, 167–199. doi: 10.2189/asqu.2005.50.2.167
Chaney, T. (2014). The network structure of international trade. Am. Econ. Rev. 104, 3600–3634. doi: 10.1257/aer.104.11.3600
Choudhury, S., and Headey, D. (2017). What drives diversification of national food supplies? A cross-country analysis. Glob. Food Sec. 15, 85–93. doi: 10.1016/j.gfs.2017.05.005
Cottrell, R. S., Nash, K. L., Halpern, B. S., Remenyi, T. A., Corney, S. P., Fleming, A., et al. (2019). Food production shocks across land and sea. Nat Sustain. 2, 130–137. doi: 10.1038/s41893-018-0210-1
Davis, K. F., Gephart, J. A., Emery, K. A., Leach, A. M., Galloway, J. N., and D’Odorico, P. (2016). Meeting future food demand with current agricultural resources. Glob. Environ. Chang. 39, 125–132. doi: 10.1016/j.gloenvcha.2016.05.004
De Benedictis, L., Nenci, S., Santoni, G., Tajoli, L., and Vicarelli, C. (2014). Network analysis of world trade using the BACI-CEPII dataset. Glob. Econ. J. 14, 287–343. doi: 10.1515/gej-2014-0032
Distefano, T., Laio, F., Ridolfi, L., and Schiavo, S. (2018). Shock transmission in the international food trade network. PLoS One 13, 1–15. doi: 10.1371/journal.pone.0200639
Dithmer, J., and Abdulai, A. (2017). Does trade openness contribute to food security? A dynamic panel analysis. Food Policy 69, 218–230. doi: 10.1016/j.foodpol.2017.04.008
Dolfing, A. G., Leuven, J. R. F. W., and Dermody, B. J. (2019). The effects of network topology, climate variability and shocks on the evolution and resilience of a food trade network. PLoS One 14, 1–18. doi: 10.1371/journal.pone.0213378
Dueñas, M., Campi, M., and Olmos, L. E. (2021). Changes in mobility and socioeconomic conditions during the COVID-19 outbreak. Human. Soc. Sci. Commun. 8, 1–10. doi: 10.1057/s41599-021-00775-0
Dupas, M. C., Halloy, J., and Chatzimpiros, P. (2019). Time dynamics and invariant subnetwork structures in the world cereals trade network. PLoS One 14, 1–21. doi: 10.1371/journal.pone.0216318
Fagiolo, G., Reyes, J., and Schiavo, S. (2009). World-trade web: topological properties, dynamics, and evolution. Phys. Rev. E 79, 1–19. doi: 10.1103/PhysRevE.79.036115
Frankel, J. A. (1997). Regional trading blocs in the world economic system[M]. Washington DC: Peterson Institute for International Economics.
Friis, C., and Nielsen, J. (2019). Telecoupling. Exploring land-use change in a globalised world[M]. Switzerland: Springer Nature Switzerland AG Press.
Fritz, C., Lebacher, M., and Kauermann, G. (2020). Tempus volat, hora fugit: a survey of tie-oriented dynamic network models in discrete and continuous time. Statistica Neerlandica 74, 275–299. doi: 10.1111/stan.12198
Garlaschelli, D., and Loffredo, M. I. (2004). Fitness-dependent topological properties of the world trade web. Phys. Rev. Lett. 93, 10445–10458. doi: 10.1103/PhysRevLett.93.188701
Gephart, J. A., and Pace, M. L. (2015). Structure and evolution of the global seafood trade network. Environ. Res. Lett. 10, 1–12. doi: 10.1088/1748-9326/10/12/125014
Geyik, O., Hadjikakou, M., Karapinar, B., and Bryan, B. A. (2021). Does global food trade close the dietary nutrient gap for the world's poorest nations? Glob. Food Sec. 28:100490. doi: 10.1016/j.gfs.2021.100490
Goodreau, S. M., Handcock, M. S., Hunter, D. R., Butts, C. T., and Morris, M. (2008). A Statnet Tutorial. J. Stat. Softw. 24, 1–27. doi: 10.18637/jss.v024.i09
Graif, C., Alina, L., and Alyssa, M. Y. (2017). Neighborhood isolation in Chicago: violent crime effects on structural isolation and homophily in inter-neighborhood commuting networks. Soc. Networks 51, 40–59. doi: 10.1016/j.socnet.2017.01.007
Gutiérrez-Moya, E., Lozano, S., and Adenso-Díaz, B. (2020). Analysing the structure of the global wheat trade network: an ERGM approach. Agronomy 10:1967. doi: 10.3390/agronomy10121967
Handcock, M. S., Hunter, D. R., Butts, C. T., Goodreau, S. M., and Morris, M. (2008). Statnet: software tools for the representation, visualization, analysis and simulation of NetworkData. J. Statal Softw. 24, 1548–7660. doi: 10.18637/jss.v024.i01
Hanneke, S., Fu, W., and Xing, E. P. (2010). Discrete temporal models of social networks. Electron. J. Statistics 4, 585–605. doi: 10.1214/09-EJS548
Hedlund, J., Carisen, H., Croft, S., West, C., Bodin, Ö., Stokeld, E., et al. (2022). Impacts of climate change on global food trade networks. Environ. Res. Lett. 17:124040. doi: 10.1088/1748-9326/aca68b
Helbing, D. (2013). Globally networked risks and how to respond. Nature 497, 51–59. doi: 10.1038/nature12047
Hunter, D. R. (2007). Curved exponential family models for social networks. Soc. Networks 29, 216–230. doi: 10.1016/j.socnet.2006.08.005
Iapadre, L, and Tironi, F. Measuring trade regionalisation: The case of Asia[R]. UNU-CRIS Working Paper, (2009)
Kali, R., and Reyes, J. (2010). Financial contagion on the international trade network. Econ. Inq. 48, 1072–1101. doi: 10.1111/j.1465-7295.2009.00249.x
Korniyenko, M. Y., Pinat, M., and Dew, B. (2017). Assessing the fragility of global trade: The impact of localized supply shocks using network analysis[R]. Int. Monetary Fund Working Paper 2017:1. doi: 10.5089/9781475578515.001
Krivitsky, P. N., and Handcock, M. S. (2014). A separable model for dynamic networks. J. R. Statistic. Soc. 76, 29–46. doi: 10.1111/rssb.12014
Kummu, M., Kinnunen, P., Lehikoinen, E., Porkka, M., Queiroz, C., Röös, E., et al. (2020). Interplay of trade and food system resilience: gains on supply diversity over time at the cost of trade independency. Glob. Food Sec. 24, 100360–100310. doi: 10.1016/j.gfs.2020.100360
Lebacher, M., Thurner, P. W., and Kauermann, G. (2021). A dynamic separable network model with actor heterogeneity: an application to global weapons transfers. J. Royal Statistic. Soc. Series A 184, 201–226. doi: 10.1111/rssa.12620
Leifeld, P., Cranmer, S. J., and Desmarais, B. A. (2018). Temporal exponential random graph models with btergm: estimation and bootstrap confidence intervals. J. Stat. Softw. 83, 1–36. doi: 10.18637/jss.v083.i06
Li, X., Wang, H., Kharrazi, A., Fath, B. D., Liu, G., Liu, G., et al. (2024). A network analysis of external shocks on the dynamics and resilience of the global staple food trade. Food Secur. 16, 845–865. doi: 10.1007/s12571-024-01462-z
Liu, L., Wang, W., Yan, X., Shen, M., and Chen, H. (2023). The cascade influence of grain trade shocks on countries in the context of the Russia-Ukraine conflict. Human. Soc. Sci. Commun. 10, 1–28. doi: 10.1057/s41599-023-01944-z
Mangnus, E., and Vellema, S. (2019). Persistence and practice of trading networks a case study of the cereal trade in Mali. J. Rural. Stud. 69, 137–144. doi: 10.1016/j.jrurstud.2019.05.002
Morton, J. (2020). On the susceptibility and vulnerability of agricultural value chains to COVID-19. World Dev. 136, 105132. doi: 10.1016/j.worlddev.2020.105132
Pan, Z. (2018). Varieties of intergovernmental organization memberships and structural effects in the world trade network. Advances in Complex Systems 21, 1850001–1850030. doi: 10.1142/S0219525918500017
Pardey, P. G., Chan-Kang, C., Dehmer, S. P., and Beddow, J. M. (2016). Agricultural R&D is on the move. Nature 537, 301–303. doi: 10.1038/537301a
Puma, M. J. (2019). Resilience of the global food system. Nat. Sustain. 2, 260–261. doi: 10.1038/s41893-019-0274-6
Puma, M. J., Bose, S., Chon, S. Y., and Cook, B. I. (2015). Assessing the evolving fragility of the global food system. Environ. Res. Lett. 10:024007. doi: 10.1088/1748-9326/10/2/024007
Robins, G., Pattison, P., Kalish, Y., and Lusher, D. (2007). An introduction to exponential random graph (p*) models for social networks. Soc. Networks 29, 173–191. doi: 10.1016/j.socnet.2006.08.002
Santangelo, G. D. (2018). The impact of FDI in land in agriculture in developing countries on host country food security. J. World Bus. 53, 75–84. doi: 10.1016/j.jwb.2017.07.006
Sartori, M., and Schiavo, S. (2015). Connected we stand: a network perspective on trade and global food security. Food Policy 57, 114–127. doi: 10.1016/j.foodpol.2015.10.004
Serrano, M. A., and Boguná, M. (2003). Topology of the world trade web. Phys. Rev. E 68:015101. doi: 10.1103/PhysRevE.68.015101
Silvestrini, M. M., Smith, N. W., and Sarti, F. M. (2023). Evolution of global food trade network and its effects on population nutritional status. Curr. Res. Food Sci. 6, 100517–100519. doi: 10.1016/j.crfs.2023.100517
Smith, M., Gorgoni, S., and Cronin, B. (2019). International production and trade in a high-tech industry: a multilevel network analysis. Soc. Networks 59, 50–60. doi: 10.1016/j.socnet.2019.05.003
Song, H., Cho, J., and Benefield, G. A. (2020). The dynamics of message selection in online political discussion forums: self-segregation or diverse exposure? Commun. Res. 47, 125–152. doi: 10.1177/0093650218790144
Squartini, T., Fagiolo, G., and Garlaschelli, D. (2011). Randomizing world trade. II. A weighted network analysis. Phys. Rev. E 84, 046–118. doi: 10.1103/PhysRevE.84.046118
Torreggiani, S., Mangioni, G., Puma, M. J., and Fagiolo, G. (2018). Identifying the community structure of the international food-trade multi-network. Environ. Res. Lett. 13, 1–14. doi: 10.1088/1748-9326/aabf23
WTO (2021a). Trade monitoring report[R]. Geneva, Switzerland: World Trade Organization. Available at: https://tmdb.wto.org/en/reports/continued-but-slow-rollback-of-covid-19-related-trade-restrictions-en
Xia, J. (2011). Mutual dependence, partner substitutability and repeated partnership: the survival of cross-border alliances. Strateg. Manag. J. 32, 229–253. doi: 10.1002/smj.873
Zhou, M., Wu, G., and Xu, H. (2016). Structure and formation of top networks in international trade, 2001–2010. Soc. Networks 44, 9–21. doi: 10.1016/j.socnet.2015.07.006
Keywords: supply vulnerability, bilateral trade friction, COVID-19 pandemic, trade dependence network, temporal exponential random graph model
Citation: Wang Y and Zhang L (2025) Analysis on evolution of international agricultural trade dependence network from perspective of vulnerability. Front. Sustain. Food Syst. 9:1431945. doi: 10.3389/fsufs.2025.1431945
Edited by:
Ruishi Si, Xi’an University of Architecture and Technology, ChinaReviewed by:
Shruti Mohapatra, Sri Sri University, IndiaQian Li, Beijing Technology and Business University, China
Copyright © 2025 Wang and Zhang. This is an open-access article distributed under the terms of the Creative Commons Attribution License (CC BY). The use, distribution or reproduction in other forums is permitted, provided the original author(s) and the copyright owner(s) are credited and that the original publication in this journal is cited, in accordance with accepted academic practice. No use, distribution or reproduction is permitted which does not comply with these terms.
*Correspondence: Linchen Zhang, MjczMDc4MDQ1QHFxLmNvbQ==