 Xueyi Wang
 Manguo Geng
 Xianglong Tang*
- School of Architecture and Urban Planning, Lanzhou Jiaotong University, Lanzhou, China
Introduction: The continuous migration of rural populations to urban areas poses a significant threat to food production and sustainable development in underdeveloped regions. Consequently, planning farmers’ livelihoods and optimizing their living environments are crucial for addressing rural challenges. Rurality represents the fundamental attributes of the countryside, serving as an accurate measure of the stages and characteristics of rural development and providing valuable support for policy formulation.
Methods: In this study, 87 counties (districts) in Gansu Province were selected as samples to construct and evaluate a rurality evaluation index system. The Geographical Detector Model and Pearson’s correlation analysis were applied to examine the relationship between the rurality index and key factors of the human settlement environment and identify pathways for rural development.
Results: The findings demonstrated that the rurality index effectively reflects the spatiotemporal patterns of rural development, demonstrating a steady increase from west to east across Gansu Province. Various human settlement factors influence the spatial distribution of the rurality index, with humanities factors emerging as the primary drivers. Based on their dominant factors, the counties in Gansu Province were categorized into three groups for policy formulation: external economy-driven rural areas, endogenous resource-driven rural areas, and location-constrained rural areas.
Discussion: However, it was also recognized that the rurality index alone does not comprehensively capture the current state of rural agricultural development. To propose effective, regional, and integrated rural development policies for underdeveloped areas, it is essential to combine agricultural development policies with an analysis of the existing rural living environment.
1 Introduction
The ever-evolving state of globalization, industrialization, and urbanization has stimulated a gradual decline in rural populations worldwide, with substantial rural resources and labor forces concentrated in cities and towns (Connor et al., 2023). The Bruges Resolution pointed out that the migration of the population to the big cities will bring the inevitable abandonment and decay of small towns. This issue is particularly pronounced in rural areas across many countries, where stagnant or declining population growth, resident emigration, and economic challenges are prevalent. In China, the rural population is clearly defined as individuals with rural household registration who are primarily engaged in agricultural production, as a particular population registered by the Bureau of Statistics according to household registration. The distinct separation between urban and rural structures has created a sharp divide between urban and rural populations, resulting in inequitable allocation of educational resources and public facilities. Rural areas face significant challenges, including population decline, economic stagnation, and the destruction of cultural heritage. These pressing issues have profoundly impacted food production, rural employment, and the pursuit of sustainable development (Biddle and Azano, 2016; Liu and Li, 2017). Scholars have discussed the mechanism of rural shrinkage at different scales and believe that the level of social and economic development, physical geography, policy, and system are the main factors causing rural shrinkage. Therefore, solving the problem of rural livelihood and optimizing the rural living environment is one of the important ways to solve the problem of population loss, and thus ensure food production and sustainable development.
Previous studies have demonstrated that the rurality index serves as a robust tool for supporting the formulation and implementation of rural development policies (Teilmann, 2012). Regional rural policies directly affect critical aspects of farmers’ livelihoods, including rural industrial structure, land use changes, and infrastructure development. Many countries have introduced unique measures tailored to the distinct characteristics of rural areas, such as financial support through specialized agricultural policies, which have brought significant changes to rural regions in a short period. However, the sheer number of villages compared to cities makes it challenging to implement policies that accurately address specific rural characteristics (Cloke, 1977). Even within the same region, the circumstances of rural areas can vary significantly. Consequently, generalized policies often result in low efficiency, resource waste, and uneven rural development (Ali, 2007). Unfortunately, many existing rural policies rely on a “one-size-fits-all” approach, failing to account for the dynamic evolution of rural residential environments. To enhance the effectiveness of rural policies, it is essential to gain a comprehensive understanding of rural areas. Research on rural regional systems and their spatial differentiation rules provides valuable insights (Frouws, 1998; Zapf, 2001; Madu, 2010). A rural regional system is a spatial framework characterized by inter-regional relationships and interactions among human, economic, resource, and environmental factors. Evaluating rural characteristics based on a single element is insufficient, as the complexity of these interconnections requires a more holistic approach. Paul Cloke proposed a new rurality measurement method in the 1970s, which included multiple indicators such as population, distance, and scale, and it became a landmark achievement in rural quantitative research (Cloke, 1977). Since then, scholars conducted comprehensive research on rurality from different perspectives and gradually realized that the rurality index can identify the level, stage, and characteristics of rural development, and reveal the differences within the rural regional system (Smith and Parvin, 1973; Nelson and Nguyen, 2023). Rurality has emerged as a key focus of research, serving as a crucial indicator for assessing the development status of rural areas and supporting policy formulation (Frouws, 1998; Madu, 2010).
The research in recent years has increasingly discussed the conceptual connotation, indicator weights, and measurement methods of rurality (Nelson et al., 2021). Studies in Geography, urban planning, and regional planning principally focus on the descriptive definition of rurality, or the direction based on the observable and quantitative description, to utilize the measurement results of rurality for policy preparation and implementation (Liu et al., 2025). Aiming to comprehensively reflect the increasingly complex rural problems, rurality evaluation indicators have shifted from a single population characteristic to a multi-index system. More emphasis is placed on indicators of economic development level (Nutley, 1980), infrastructure and public service facilities (Beynon et al., 2016; Gajić et al., 2018), natural environment (Romano et al., 2016), and agricultural professional practitioners (Hedlund, 2016). Quantitative research methods have great positive effects on rural policy-making, such as principal component analysis (Li et al., 2015), weighted and unweighted linear sums and averages (Nutley, 1980), ArcGIS, remote sensing technique (Roberts, 2022) and regression analyses (Hoggart, 1988), all these methods make rurality measurement a continuous and dynamic process. Studies on multi-index comprehensive measurement of rurality in Spain (Prieto-Lara and Ocana-Riola, 2010), Nigeria (Madu, 2010), China (Zhang, 1998; Long et al., 2009) and Turkey (Yetiskul et al., 2021), use geographic information systems (black-box statistical techniques) to explore the common characteristics of regional rural areas and propose targeted rural policies and implementation measures, especially in aspects such as shortage of medical facilities and equity in educational resources (Doogan et al., 2018; Valjarević et al., 2018). The research obtains high-resolution spatial information through remote sensing technology to identify the differences between villages within the unit administrative region and across administrative regions, which provides an important basis for formulating fine-scale rural policies and measures (Valjarević et al., 2021).
The pertinent literature to date on rural areas reflects the inclination of research scale and research objects in developed regions (Harrington and O’Donoghue, 1998; Shubin, 2006; Marsden and Sonnino, 2008; Yetiskul et al., 2021), overlooking rural areas in underdeveloped regions, which may encounter severer issues (Ocaña-Riola and Sánchez-Cantalejo, 2005). China’s rapidly developing coastal areas in recent years have further intensified the urban–rural gap and regional differences. While the eastern region has demonstrated outstanding rural advancement, the western region lags seriously behind (Long, 2013). The government’s efforts to promote the development of the Western region through policies, counterpart support, and industrial transfer have remained largely ineffective (Liu, 2006). Western China is still losing its rural population rapidly, with hollowing out, desertion, and aging escalating in rural areas (Liu, 2018). In China, the research focus on rurality involves land use (Feng et al., 2018), accessibility (Lyu and Cao, 2020), industrialization (Han et al., 2017) and rural revitalization (Wu et al., 2022). Scholars classify the villages through coupling and correlation analysis, achieving long-term rural development through different policies and paths (Li et al., 2017). The relationship between rurality and land development also become a hot topic, studies find that the extensive development of rural construction land is not conducive to the sustainable development of rural areas (Brown et al., 2005; Chen et al., 2014).
This study taking 87 counties (districts) in Gansu province as the research object, constructs a rurality evaluation index system to quantitatively explain rural development in these underdeveloped areas. Through the correlation between the rurality index and the human settlement environment index, we identify rural development types, providing a reference for solving rural livelihood problems, optimizing rural development policies, and realizing rural sustainable development.
2 Methods
2.1 Study area
Gansu province, situated in the arid zone of northwest China, is geographically located between92°13′E and108°46′E in longitude and between 30°5,632°31’N and 42°57’N in latitude. Gansu province covers an area of approximately 455,900 km2, with a long and narrow geographical shape stretching from the northwest to the southeast. It spans 1,659 km from east to west and 530 km from north to south (Figure 1). The province’s altitude ranges from 556 to 5,825 meters, with most areas, except for Longnan City and certain valleys, situated above 1,000 meters. The study area experiences diverse climate types, including subtropical monsoon, temperate monsoon, temperate continental, and plateau alpine climates. The annual average temperature ranges from 0 to 15°C, while annual precipitation varies from 36.6 to 734.9 mm. Gansu is uniquely positioned at the intersection of three major geographical regions: the Loess Plateau, the Qinghai-Tibet Plateau, and the Inner Mongolia Plateau. It is the only province encompassing three natural zones: the arid zone, the Qinghai-Tibet alpine zone, and the eastern monsoon zone. This unique location results in diverse and complex geological features, including alpine regions, deserts, Yardang formations, Danxia landforms, Gobi deserts, and oases. Gansu province has 14 cities (or autonomous prefectures) and 87 counties (or districts), divided into Hexi and Hedong regions by the Yellow River passing through. Based on the geographical location, the province is divided into five regions: Longzhong region (Lanzhou, Tianshui, Dingxi, Baiyin, and Linxia); Hexi region (Jiuquan, Jiayuguan, Zhangye, Jinchang, and Wuwei); Longdong region (Pingliang and Qingyang); Longdongnan region (Tianshui and Longnan); Gannan region (Fang et al., 2020).
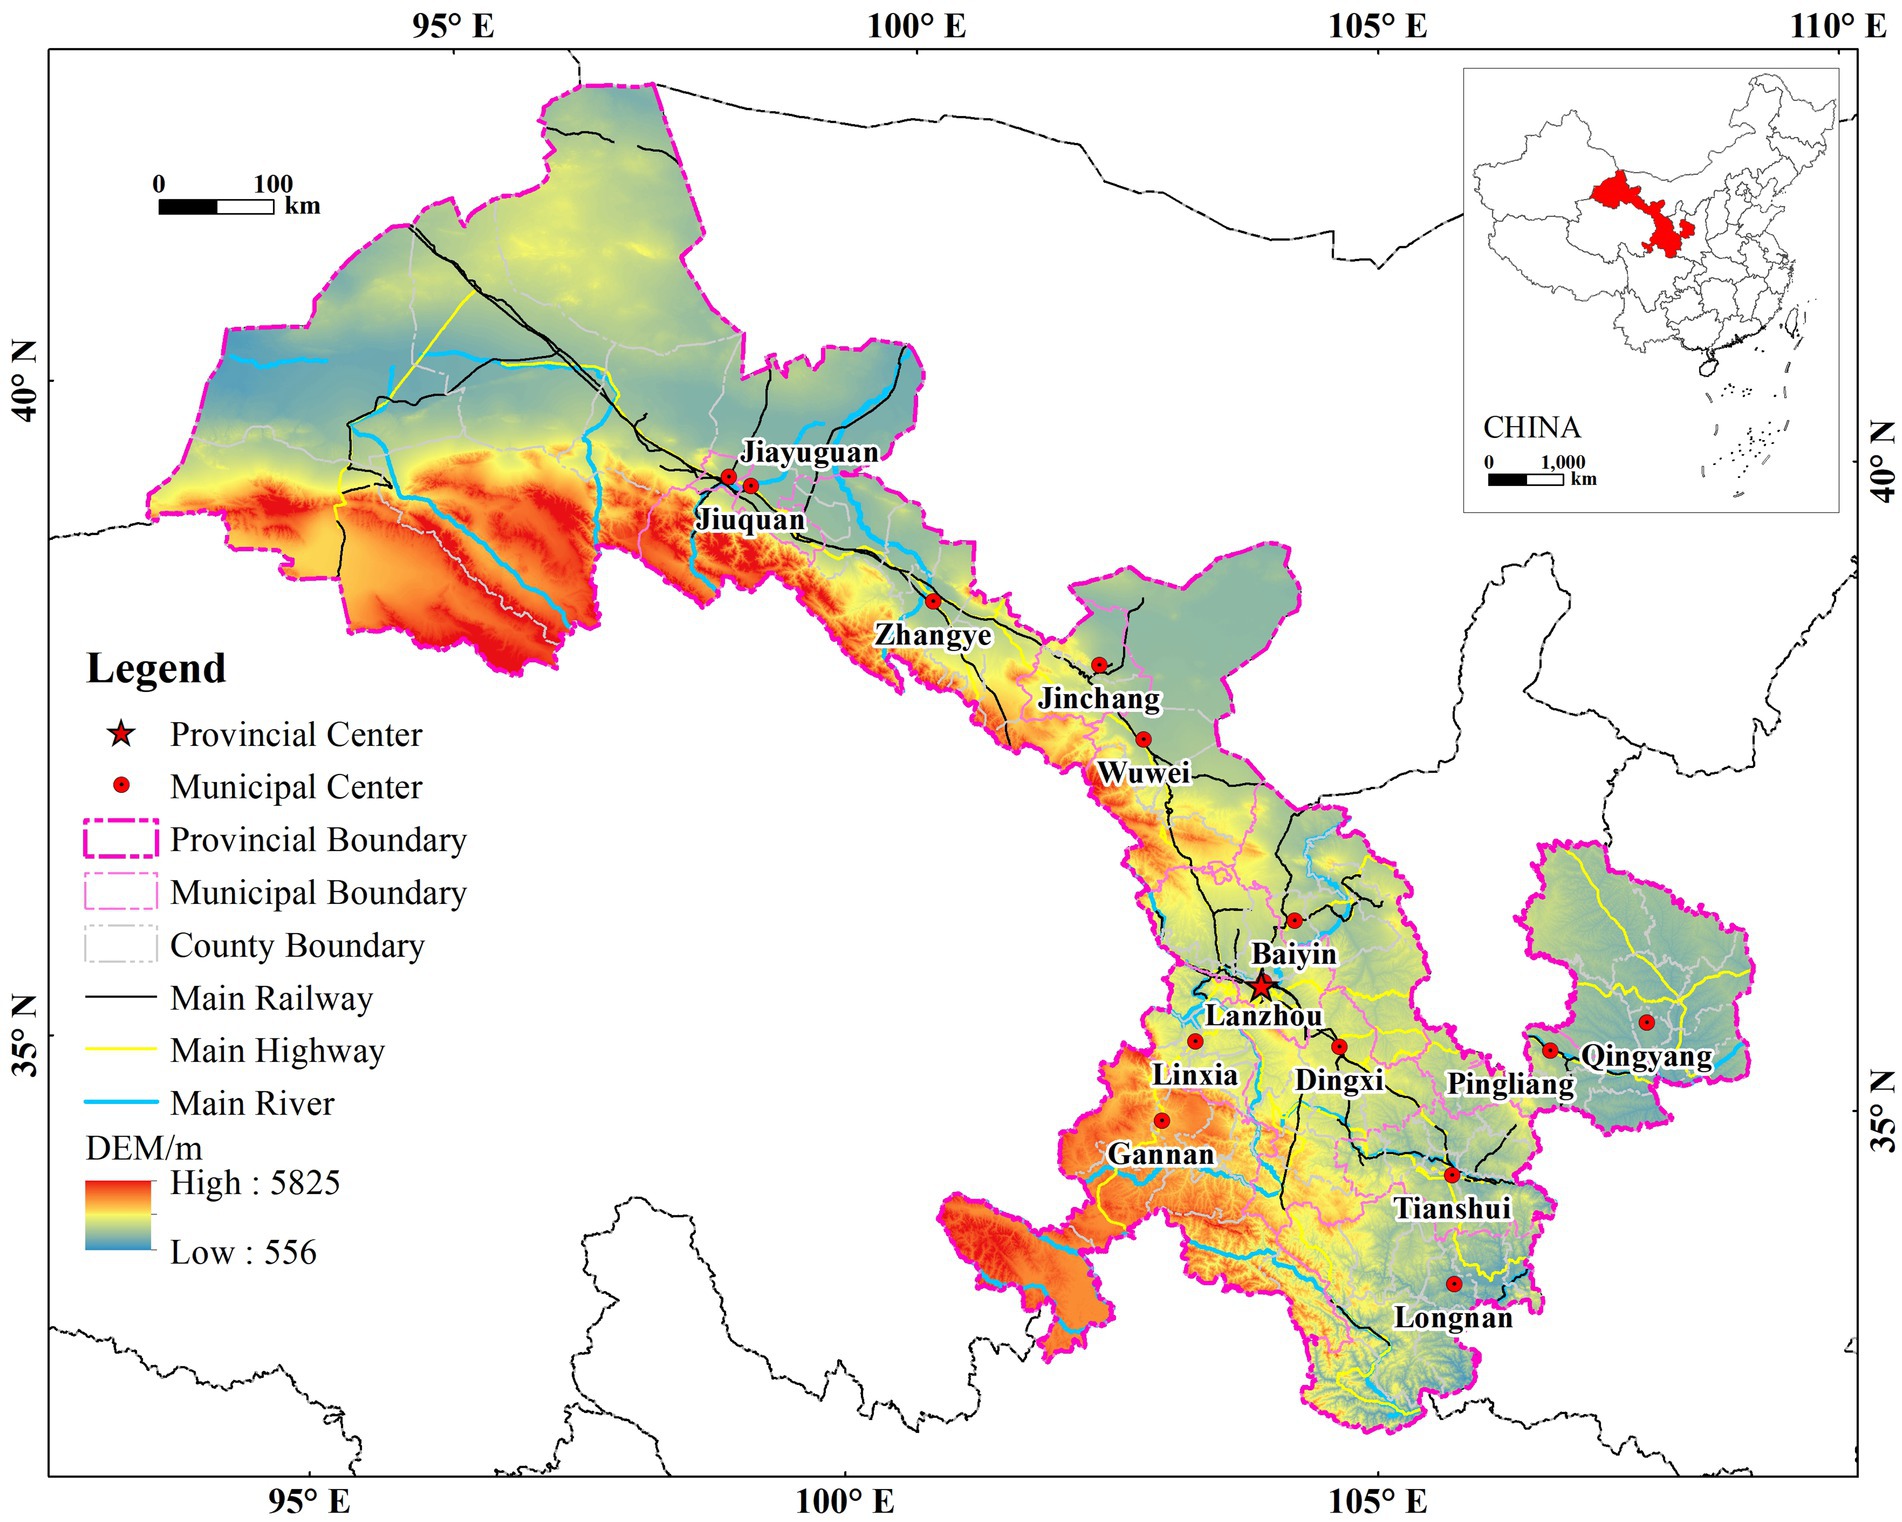
Figure 1. Location and administrative division boundaries of Gansu province.
Gansu province, with most economic indicators well below those in other Chinese provinces, is a characteristic underdeveloped region in western China. Between 2010 and 2020, the disposable income per capita in rural areas of Gansu increased from 3,747 yuan to 10,344 yuan, and the living standards of rural residents improved significantly. However, Gansu province’s GDP accounts for only 0.89% of the country’s total in 2020 while the population accounts for 1.77% of the country’s population. The GDP of Gansu ranks 28th among all 31 provinces, autonomous regions, and municipalities in the country. The permanent population of Gansu province in 2020 is 25.01 million people, of which 47.77% are rural population. As of 2020, the population of Gansu province has decreased by 555.40 thousand people comparing with the data of 25.57 million people in the sixth national census in 2010, the urban population has increased by 3,830,800 and the rural population has decreased by 4,386,200. Judging from the national data, Gansu province is losing its population outward due to regional development differences and urbanization. However, the land used for rural residential areas increased from 3226.52 km2 in 2010 to 3426.64 km2 in 2020. Rural human activity and space evolved into an extensive development situation of “depopulation but land expansion.” In undeveloped areas, the livelihoods of farmers and the development of agriculture are threatened by problems such as lack of human resources and capital investment, unreasonable land use trends, and depressed markets (Long et al., 2010). Significant disparities in Gansu province resulting from diversified geography and differentiated village development scenarios make it more difficult to formulate policies in this underdevelopment area (Mitchell and Doyle, 1996). Therefore, we choose Gansu province as the research region, expecting to provide suggestions for rural development in Gansu province and other undeveloped regions.
2.2 Data sources
The research objects of this study were 86 counties (districts) of Gansu province, excluding Anning District of Lanzhou which lacked socioeconomic data. The statistical data were connected with geographic data through “space connection” in ArcGIS 10.5, and a basic database was constructed.
1. Administrative boundary of 2020 (provincial, municipal, and county-level) vector data—based on the approved maps downloaded from the Ministry of Natural Resources’ standard map service website1 [base map number: GS (2023) No. 2767 standard map base map, and the base map had not been modified].
2. Land use data for 2010 and 2020 is from the Resource and Environmental Science and Data Center of the Chinese Academy of Sciences2 with a spatial resolution of 30 m. The raster land use data were converted to vector format, and the area of rural residential sites was calculated using ArcGIS.
3. Digital elevation model (DEM) data, with a spatial resolution of 30 meters, were sourced from the Resource and Environmental Science and Data Center of the Chinese Academy of Sciences (see Footnote 2). The terrain relief of rural residential sites was evaluated using ArcGIS.
4. Coordinates data for assessing the distance to the nearest provincial capital, highway, and railway were obtained from the Baidu Web Service API.3 The distance between each settlement and the nearest facilities was calculated using the “Near Analysis” tool in ArcGIS.
5. Gansu province’s county-level population and socioeconomic and public service facilities data in 2010 and 2020 were acquired from the Gansu Province Statistical Yearbook (2011, 2021) and the China County Statistical Yearbook (2011, 2021).4 The details of indicators used in the rurality index are shown in the next chapter.
6. Precipitation data in 2120, 2020 obtained from the National Meteorological Science Data Center.5
2.3 Research technology route
The research is primarily divided into three parts. Figure 2 shows the technical route. In the first part, we selected the research data based on the existing literature and research area attributes. ArcGIS black box statistical techniques were used to process data and construct a basic database. In the second part, we constructed an evaluation index system and model for rurality in Gansu province. The model selected 15 factors from the population data, and each indicator was standardized to eradicate the influence of the dimensions of different data (Shoultz et al., 2007). Based on the positive and negative analysis of the indicators above, each indicator is standardized to eliminate the influence of the dimensions of different data in the calculation. Besides, in order to reduce the influence of subjective factors, we used the entropy weight method to calculate the weight of each indicator. In the third part, we analyzed the spatial distribution attributes and influencing factors of the rurality index. Using ArcGIS, we visually expressed the rurality index in 2010 and 2020. In addition, Moran’s I and Getis-Ord Gi* were used to analyze the spatial distribution attributes of rurality (Li et al., 2015). Finally, the causes of rural spatial distribution in Gansu province were analyzed using the geographical detector model and Pearson correlation analysis (Nelson et al., 2021). Furthermore, the villages in Gansu province were divided by the factors of human settlements and rurality index to provide scientific recommendations for formulating regional rural policies.
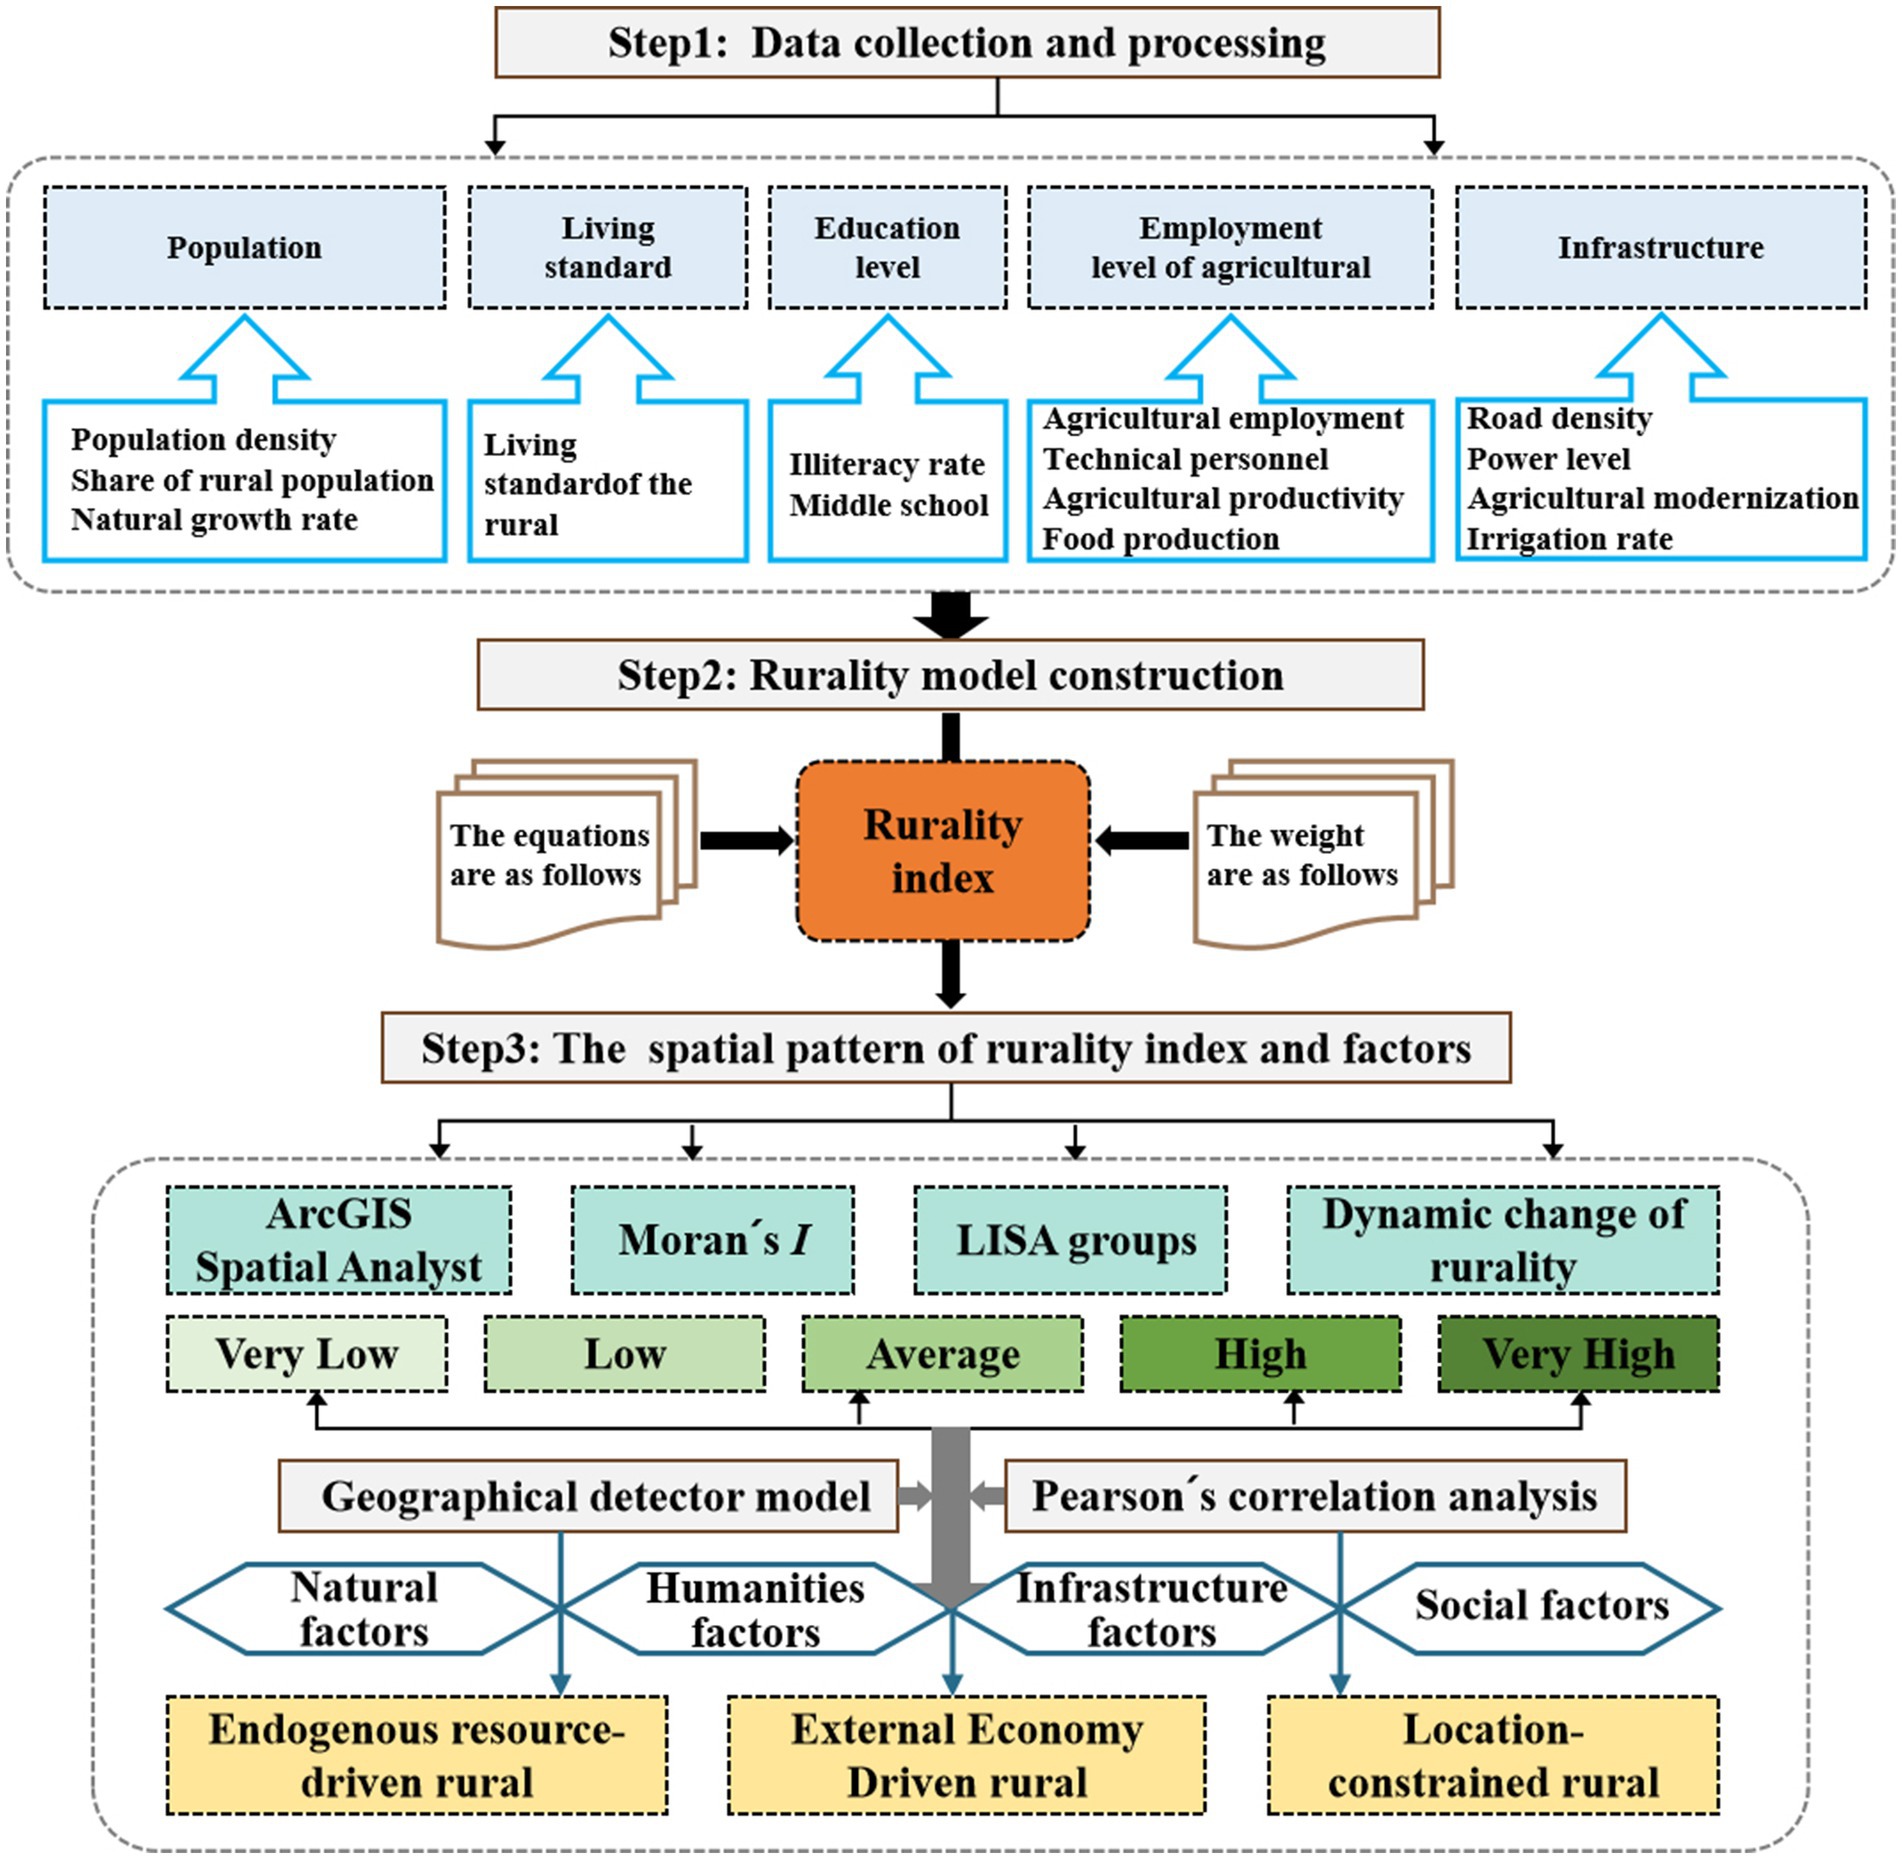
Figure 2. Research technology framework.
2.4 Research methods
2.4.1 Rurality and rurality index
The concept, function, and regional system of rural areas have altered with the advent of social economy, urbanization, and technology. Thus, quantifying the difference in rural development and then formulating effective and appropriate policies for rural development has become a hot topic in recent times. By definition, the term “rural” signifies distinguishing the concept of urbanization, which, in turn, is relatively vague, as it primarily denotes the region dominated by an agricultural population, relatively low population density, and far from the urban center and farmland scenery (Halfacree, 1993). Lately, “rurality” has been gradually used to reflect people’s understanding and concept of rural regional attributes, local cultural symbols, and natural landscapes (Zografos, 2007). Indeed, many rural areas are being variably restructured by adjusting various national policies, developing social economy, and advancing Internet technology (Teilmann, 2012). The existing literature has concentrated more on rural population density, education and health resources, employment and unemployment rates, and the level of rural economic development, and measured rurality through various methods of categorization and definition. Given the rural development characteristics of rural in western China, we constructed a system of indicators for evaluating rurality to measure the degree of rural development in less developed regions.
The rurality index calculation can be described as follows Equation 1:
In the formula: RImi is the rurality index of county i in year m; Wj is the weight of indicator j in year m; X’ij is the standardized value of indicator j in county i; n is the number of indicators j.
2.4.2 Index system of rurality
Rurality is a portrayal of fundamental attributes of the countryside, and the measurement of the rurality index is the outcome of a blend of factors, which is the result of the collective effect of multiple factors in the rural territorial system. Based on the existing literature, we considered the study area attributes, data continuity and availability, and selected variables like residents’ living standards, education, employment, agricultural development level, and infrastructure that reflected the current state of rural growth per rural population attributes to assess rurality (Table 1).
1. Demographic attributes, the key factor in measuring rural areas, are closely associated with land, social culture, and economic development (Lakshmanan, 1982). The performance of population attributes includes three indicators: population density, rural population proportion, and natural growth rate (Li et al., 2014).
2. The living standard of rural residents is primarily assessed by their per-capita disposable income. The higher the income level, the closer the living standard is to the urban level, thereby exhibiting a reverse contribution to rurality.
3. The higher education level of rural residents suggests their parity with urban areas, which negatively correlates with rurality (Zhang, 1998). Thus, the illiteracy rate indicator was selected as a comparison in this study, which is assumed to positively correlate with rurality.
4. Rural employment and agricultural development level involve five indicators such as agricultural employment, professional and technical personnel, agricultural labor productivity, agricultural land productivity, and per-capita food production. Agricultural employment and per-capita food production are crucial indicators to assess the rural labor population and land food production efficiency. Thus, the higher the value, the higher the rurality index value. Professional and technical personnel are a type of technical personnel, such as professional farmers, agricultural machinery personnel, and flower workers, implying that their production methods do not solely depend on agriculture. Thus, the higher the value, the lower the rurality. Moreover, higher values of agricultural labor productivity and agricultural land productivity indicate that workers are more skilled or their level of production technology is higher. Thus, the closer they are to modern production methods, the lower the rurality value (Long et al., 2009).
5. Infrastructure selection comprised road density, power level, agricultural modernization level, irrigation rate, and four other indicators. The higher the value of road density, power level, and agricultural modernization level, the higher the level of rural growth and modernization, and the lower the rurality value. In addition, a higher irrigation rate suggests that the cultivated land can produce supplementary food and the rural attributes are more significant, rendering the rurality index higher (Li et al., 2017).
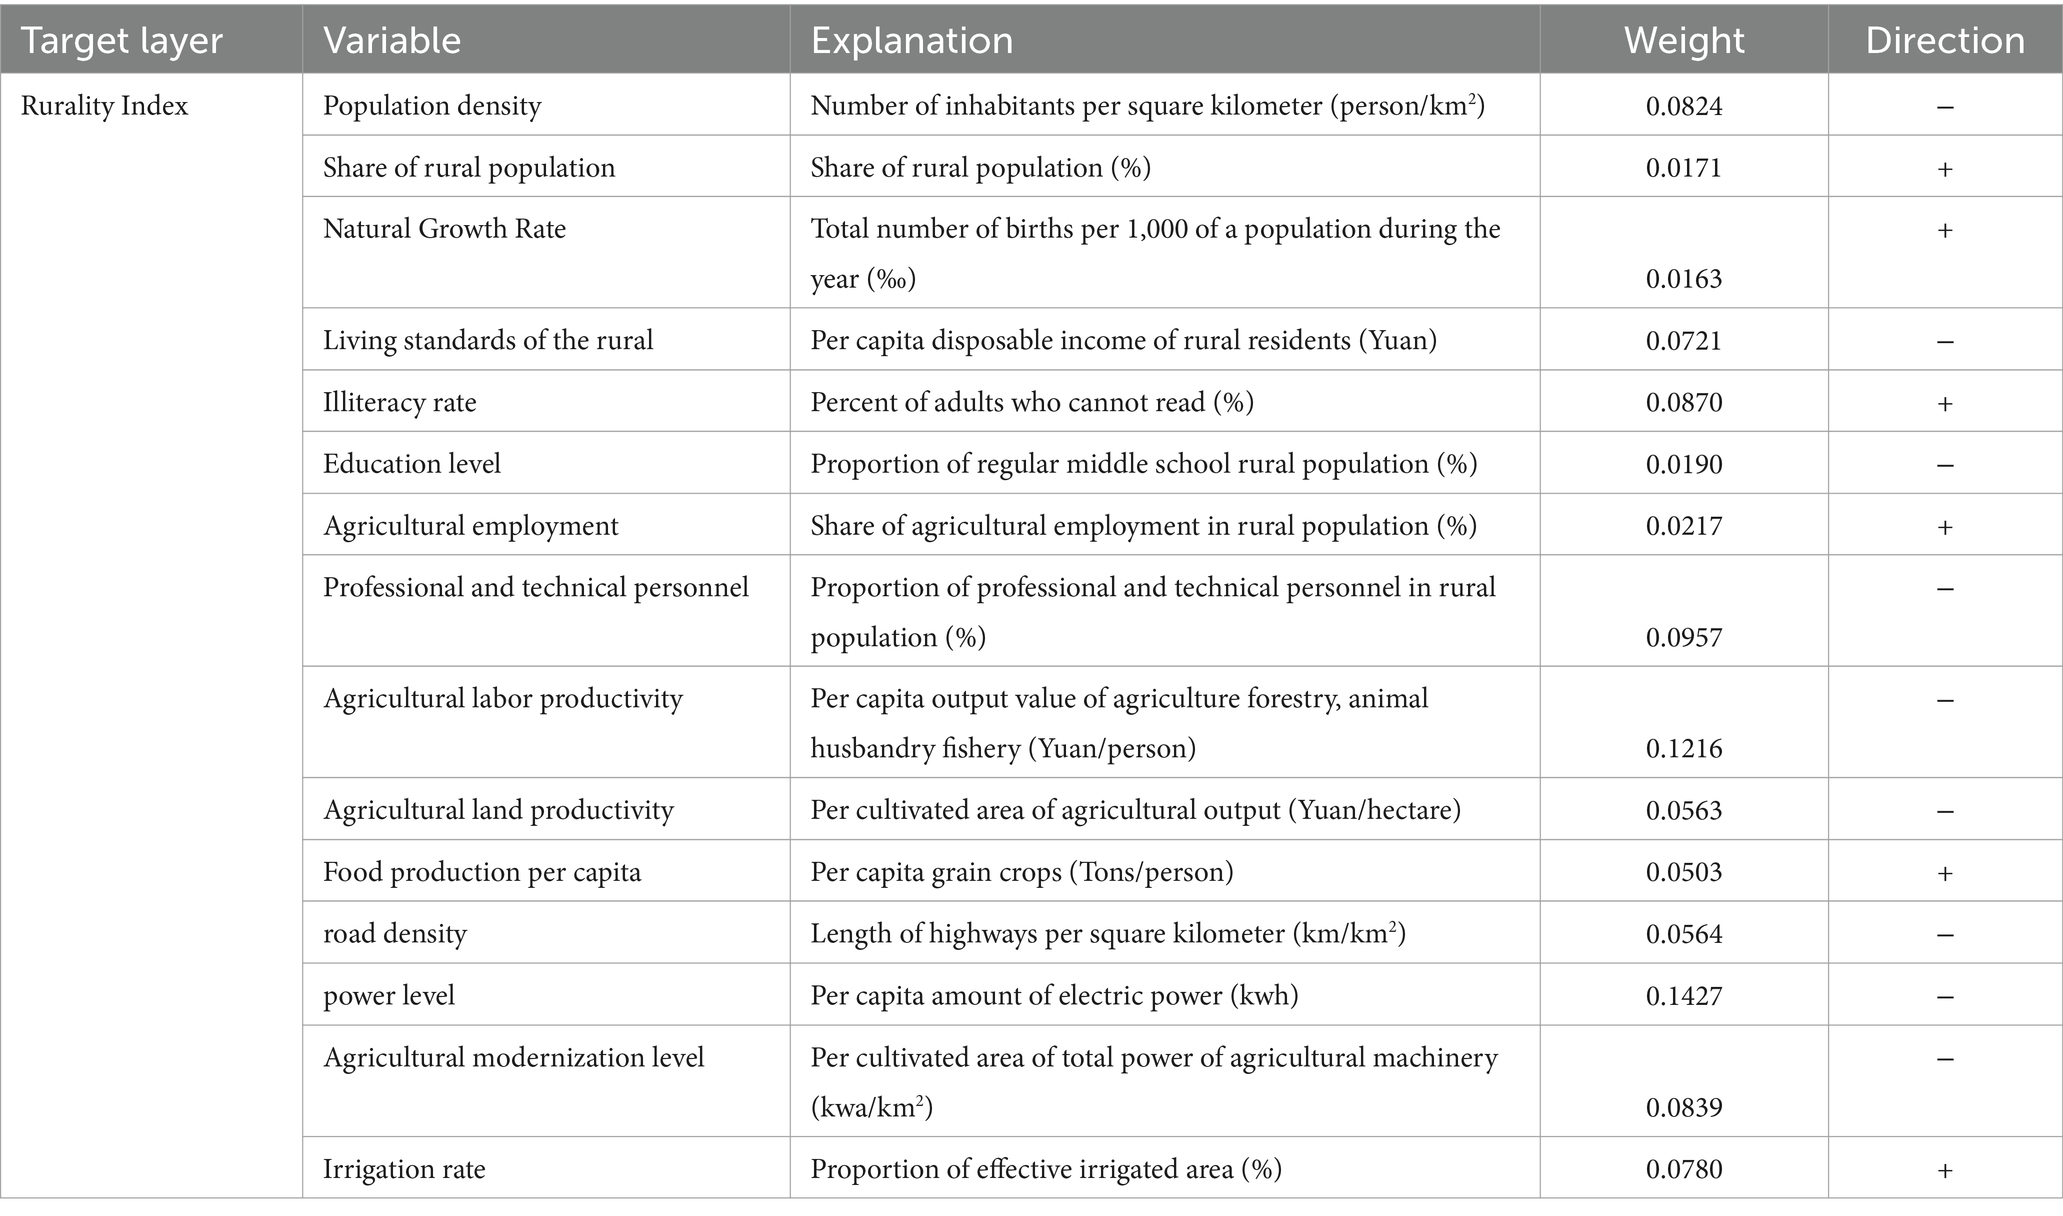
Table 1. Evaluation index system for rurality in Gansu province and weights of indexes.
2.4.3 The exploratory spatial data analysis (ESDA)
The global Moran’s I is used to identify the spatial agglomeration of rurality in counties, and Getis-Ord Gi* is used to identify the correlation between high-value and low-value rurality agglomeration areas.
➀ The calculation of Moran’s I can be described as follows Equation 2:
In the formula: n is the number of study areas; Wij is the spatial distance weight matrix; I ranges from [−1, 1]. When I is close to 1, it means that there is spatial autocorrelation, that is, rural space is clustered; when I is close to −1, indicates that the space tends to be dispersed; when I is 0, it indicates that the space is randomly distributed.
➁ The formula for Getis - Ord Gi* is shown as follows Equation 3:
In the formula: n and Wij have the same meaning as Formula 2. If Gi* is positively significant, it means that the rurality around i belongs to a high-value agglomeration area (Positive values of Gi* indicate spatial dependence for high values in the study area), that is, “High-high” or “low-low” aggregation type; when Gi* is negatively significant, it means that the rurality around i belongs to a low-value agglomeration area (negative values of Gi* denotes spatial dependence among low values.), that is, “high-low” “or “low-high” type of aggregation.
2.4.4 Geographical detector model
Geographic detectors are used to detect the influencing factors of spatial differentiation of geographical elements and the intensity of interaction between factors. It can be used to analyze the q value of the influencing factors that affect the spatial differentiation of rurality. Geographic detectors can be expressed as follows Equation 4:
In the formula, L is the number of types of each influencing factor; n and nh are the number of counties in Gansu province and the number of counties in type h respectively; σ2 and σh2 are the variance of the dependent variable in the whole domain and the variance of type h respectively; the q value’s range from [0, 1], the closer the q value is to 1, the more important q is to spatial differentiation, and a q value of 0 means that the factor has no impact on spatial differentiation.
2.4.5 Pearson’s correlation analysis
Pearson’s correlation analysis is widely used to test whether there is a linear correlation between two variables and to calculate the magnitude and positive or negative of the correlation values. After comparing with calculations of other correlation models, Pearson’s correlation analysis shows a relatively stable performance in this study, which can accurately reflect the influence of human settlement environment factors on RI. Taking the rurality index as the dependent variable, and the typical human settlement environment factors as the independent variables, the relationship between them is analyzed through the Pearson correlation coefficient. Conduct tests to analyze the impact of each factor on rurality. Three confidence levels (0.1, 0.05, and 0.01) were set and three-tailed test was performed. Pearson’s correlation analysis can be expressed as follows Equations 5 and 6:
In the formula: Xi is the independent variable, R(RI, Xi) is the correlation coefficient between rurality and Xi. R1(RI, Xi) is the correlation coefficient between rurality and Xi. R2(RI, Xi) is the correlation coefficient between rurality and the logarithm of Xi.
3 Results
3.1 Spatial differentiation of rurality in Gansu province
3.1.1 Spatial pattern of the rurality index
We calculated the rurality index of each county in Gansu province from 2010 to 2020. The higher the index value, the higher the degree of rurality. Accordingly, the rurality index ranks into five levels: very low, low, medium, high, and very high (Figure 3). In 2010, the rural index of Gansu province was 0.32–0.82 [mean, 0.75; standard deviation (SD) 0.07]. The overall rurality index was relatively high. A total of 46 counties (districts) had rurality values above the mean, accounting for 50.49% of the total number of counties surveyed. In 2020, the rurality index of Gansu province was 0.38–0.80 (mean, 0.68; SD 0.06). A total of 36 counties (districts) had rurality values above the mean, accounting for 41.86% of the total number of counties surveyed. In 2020, the rurality index declined markedly, with the mean value falling by 0.07, having a small degree of dispersion between the rurality index and the mean value.
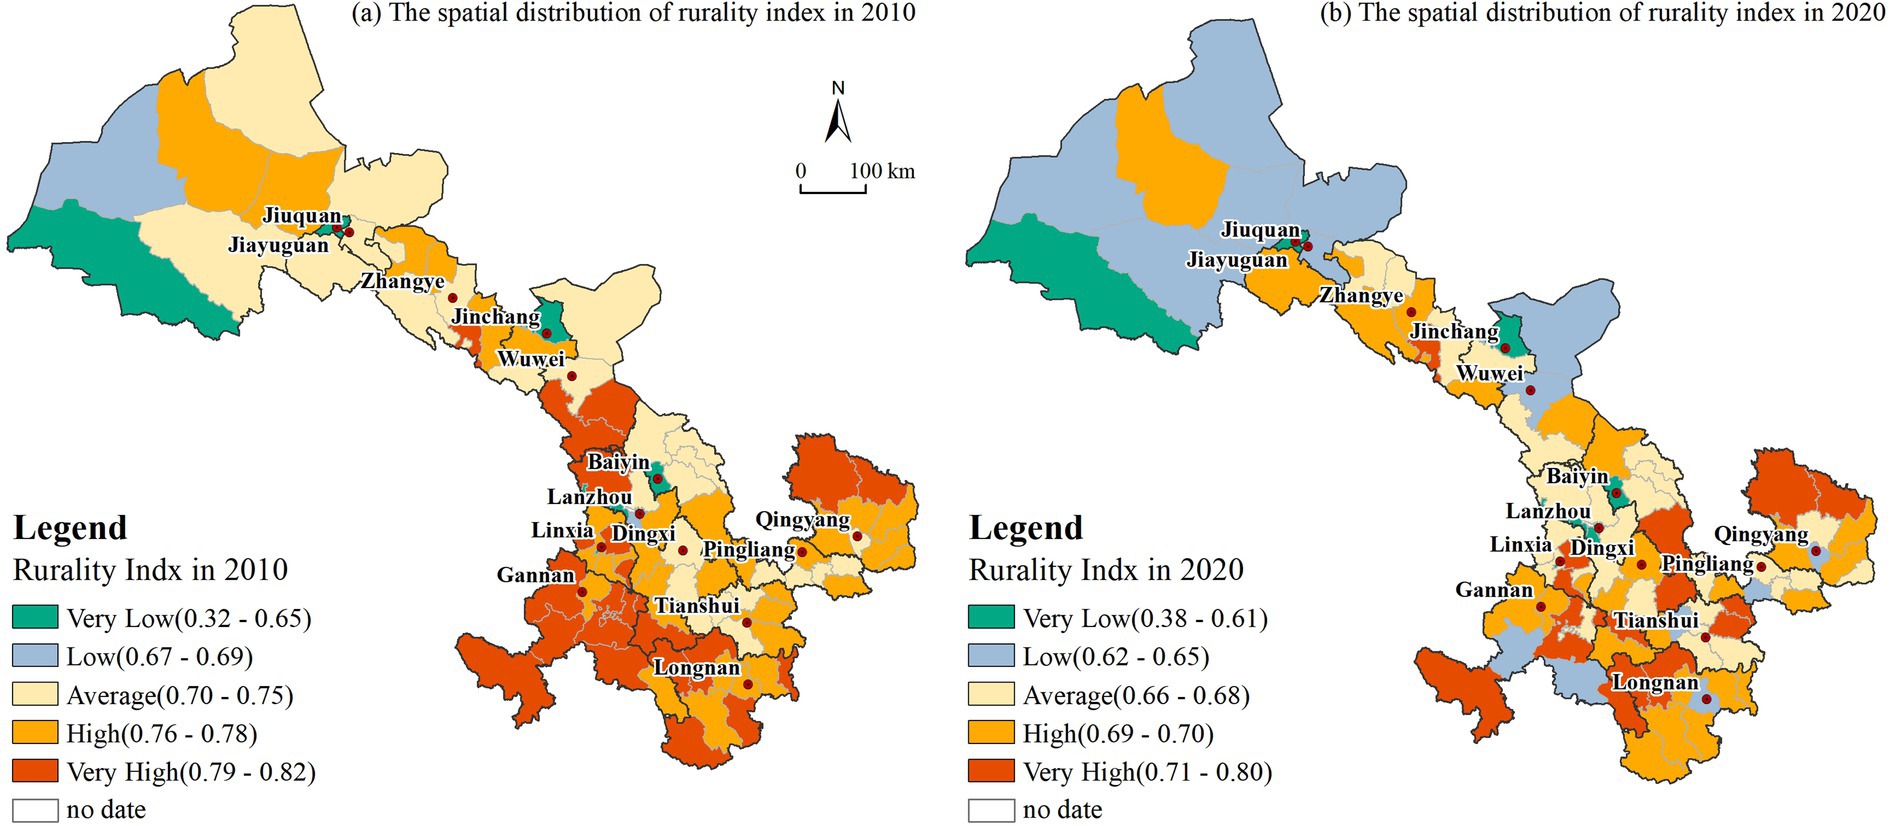
Figure 3. Spatial pattern of rurality index in 2010 and 2020.
The spatial distribution of rurality in Gansu province showed substantial differences in 2010, and the rurality index exhibited a spatial pattern that slowly increased from the west to the east (Figure 3A). A total of 21 areas showed extremely high rurality, which is primarily located in eastern Hexi, northeastern Longnan, southern southeastern Longnan, and Gannan. Of these, the rurality index of Longnan and Gannan was >0.75. On the contrary, counties (districts) with extremely low rurality had their rurality index <0.65. These included Aksai County in Jiuquan, districts in Lanzhou, Baiyin District, and Linxia City, which is primarily the seat of the municipal government. In addition, counties with medium and high rurality indexes were mostly distributed in Hexi and northern Longzhong; the rurality index of each county varied markedly (0.70–0.78). The highest rurality index was 0.82 in Tanchang County, while the lowest rurality index was 0.32 in Aksai County in Jiuquan.
In addition, the overall spatial pattern of the rurality index in Gansu province in 2020 was similar to that in 2010; however, the overall rurality index declined during the same period (Figure 3B). Besides, the number of counties with a very high rurality index reduced to 15 from 2010; these were mainly located in Maqu County, Zhuoni County, and Zhouqu County in Gannan Region, Hezheng County and Dongxiang Autonomous County in Linxia Prefecture, Dangchang County and Li County in Southeast Longnan Region, Longdong Region Huan County, and Huachi County. Of these, 76% of counties in Longnan and Gannan region had rurality higher than the average value of 0.68. Conversely, areas with extremely low rurality were mostly located in west and north Hexi, Lanzhou, and Baiyin, and there were a few counties with a low rurality index in Longdong, Longnan, and Gannan. Reportedly, urbanization has decreased the rural population in the Longzhong region centered on Lanzhou, and the extent of rurality in the region exhibited a noteworthy downward trend (Li et al., 2023). Meanwhile, counties with medium and high rurality indexes were located in Longdong, Longnan, and Gannan regions. Of these, rurality in the central region of Hexi was markedly higher than that in the neighboring counties, and the rurality index altered little compared with 2010.
Based on the spatial distribution characteristics of the rurality index, the rural growth of Gansu province presented a diversified development status. Of these, the extremely low rurality counties in Gansu province are mostly the seat of municipal governments and have a relatively high level of urbanization. In addition, counties with “extremely high” rural indexes were mostly located in Gannan, southern Longdongnan, and northern Longdong. Meanwhile, counties with “low,” “medium,” and “high” rurality indexes were distributed within the region, largely located in Hexi and Longzhong regions. Overall, the rural areas of Gansu province underwent certain developments in 10 years, but large differences prevailed between rural areas despite being influenced by the same policy. Furthermore, Dongxiang Autonomous County and Zhangjiachuan Hui Autonomous County presented the highest rurality index of 0.80, suggesting a more prominent imbalance of rural development in the minority-concentrated counties.
3.1.2 Spatial correlation of rurality
Using the Spatial Analyst Tool based on ArcGIS, global autocorrelation and local spatial heterogeneity analysis was performed on the rurality index in Gansu province to elucidate the spatial correlation and difference in the rurality index. Figure 4 shows the LISA grouping diagram of the rurality index in 2010 and 2020.
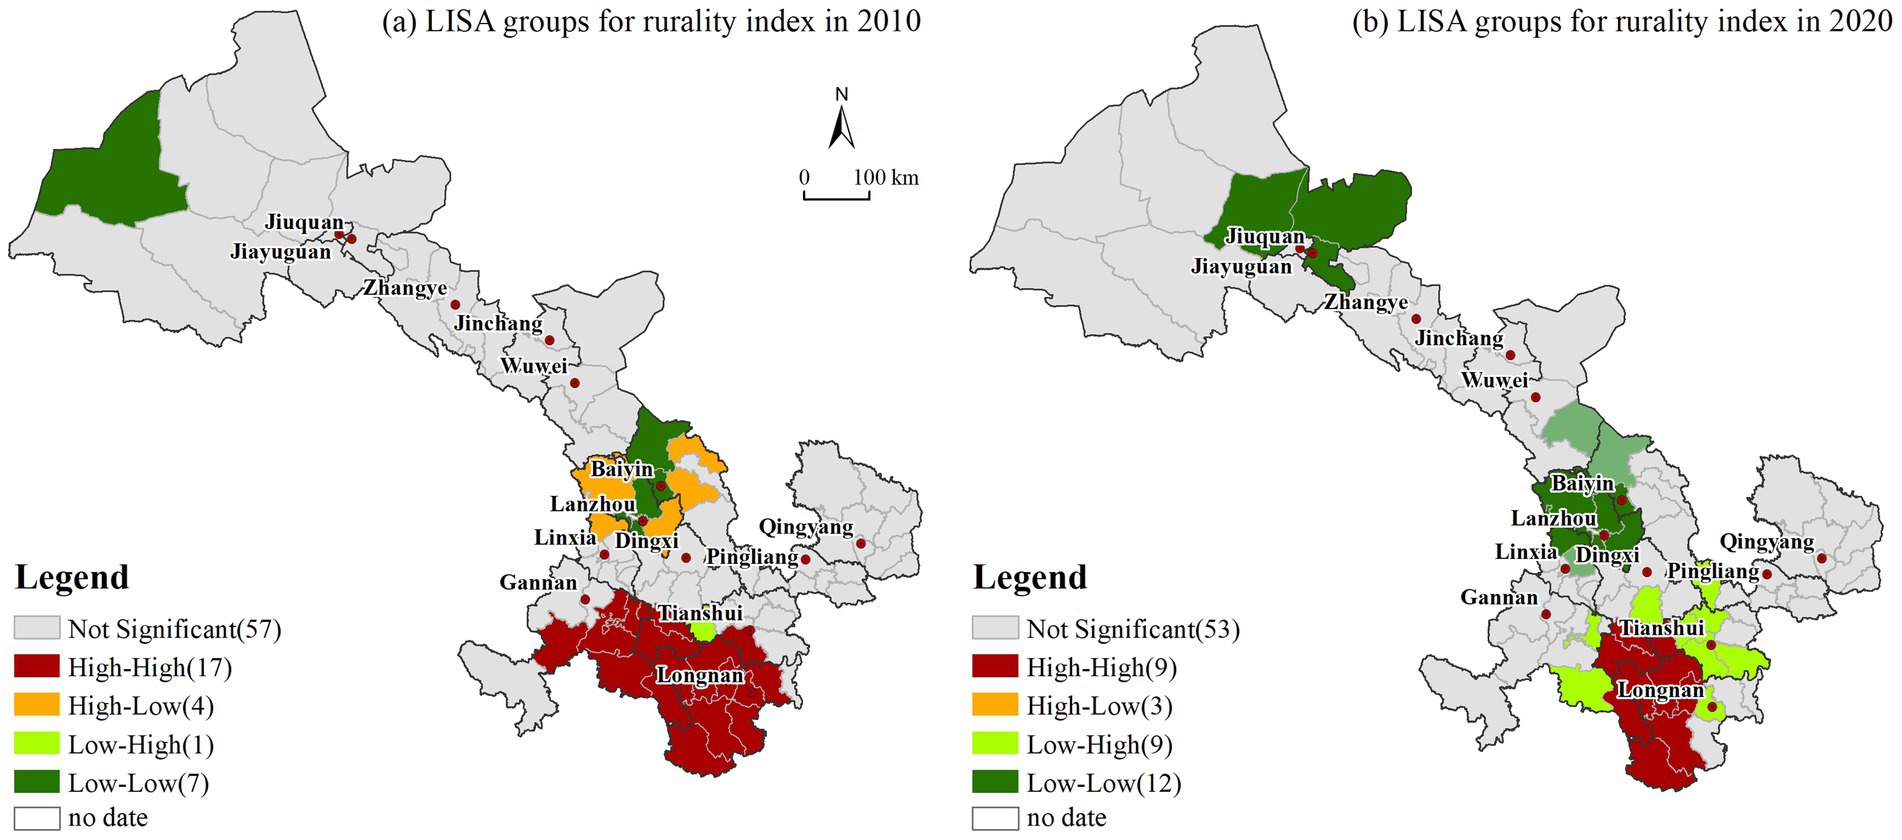
Figure 4. LISA groups for rurality index in 2010 and 2020.
Figure 4A shows that in 2010, Gansu province had High-High counties (counties with a high rurality index were surrounded by those with a high rurality index; n = 17), Low-Low counties (counties with a low rurality index were surrounded by those with a low rurality index; n = 7), High-Low counties (counties with a high rurality index were surrounded by those with a low rurality index; n = 4), Low-High counties (counties with a low rurality index were surrounded by those with a high rurality index; n = 1), and Not Significant counties (the significance level did not pass the 0.05 test; n = 57). While High-High counties were mainly located in the southern part of Longdongnan, Gannan, and southern Longzhong, Low-Low counties were largely located in the Longzhong area centered on Lanzhou and parts of Hexi. In addition, the number of High-Low counties and Low-High counties were relatively small, mostly located around High-High counties and Low-Low counties. We noted a large number of Not Significant counties, primarily located in most areas of Hexi, Longdong, and northern Longzhong (Figure 4A).
Since 2010, rising urbanization, advancing industrialization, and transforming agricultural modernization have remarkably altered the population, land use, industry, and economic structure of rural areas. In 2020, the number of High-High counties, Low-Low counties, High-Low counties, Low-High counties, and Not Significant counties were 9, 12, 3, 9, and 53, respectively (Figure 4B). Compared with 2010, the LISA cluster distribution was relatively stable in time and space, and the surge in spatial agglomeration attributes was limited. Based on Figure 4, three significant changes existed in the rurality index of counties in Gansu province: (i), the rurality index of High-High cluster counties in Gannan and southern Longdongnan reduced considerably; (ii), the rurality index of Low-Low counties centered on Lanzhou increased markedly; (iii), areas with low rurality index values slowly formed around Jiuquan and Jiayuguan.
3.1.3 Dynamic change of rurality
Differentiated policies exerted a crucial impact on the diversified growth of rural areas, and the evolution of rural growth served as an essential reflection of the policy effects. Using the correlation analysis of the rurality index of Gansu province during 2010–2020, we plotted the rurality index in 2010 on the horizontal axis and the rurality index in 2020 on the vertical axis. The scatter plot tended to be linearly distributed, and the point clouds mostly concentrated within 0.60–0.85. A high correlation was observed between the two (regression coefficient = 0.8535, close to 1, R2 = 0.7284, p < 0.01), suggesting little change in the rural spatial distribution pattern of counties in Gansu province during 2010–2020 (Figure 5). This phenomenon demonstrated that without implementing a differentiated growth strategy, the unified rural policy from Gansu Provincial government was limited to endorse the synchronized growth of regional and rural areas during this decade.
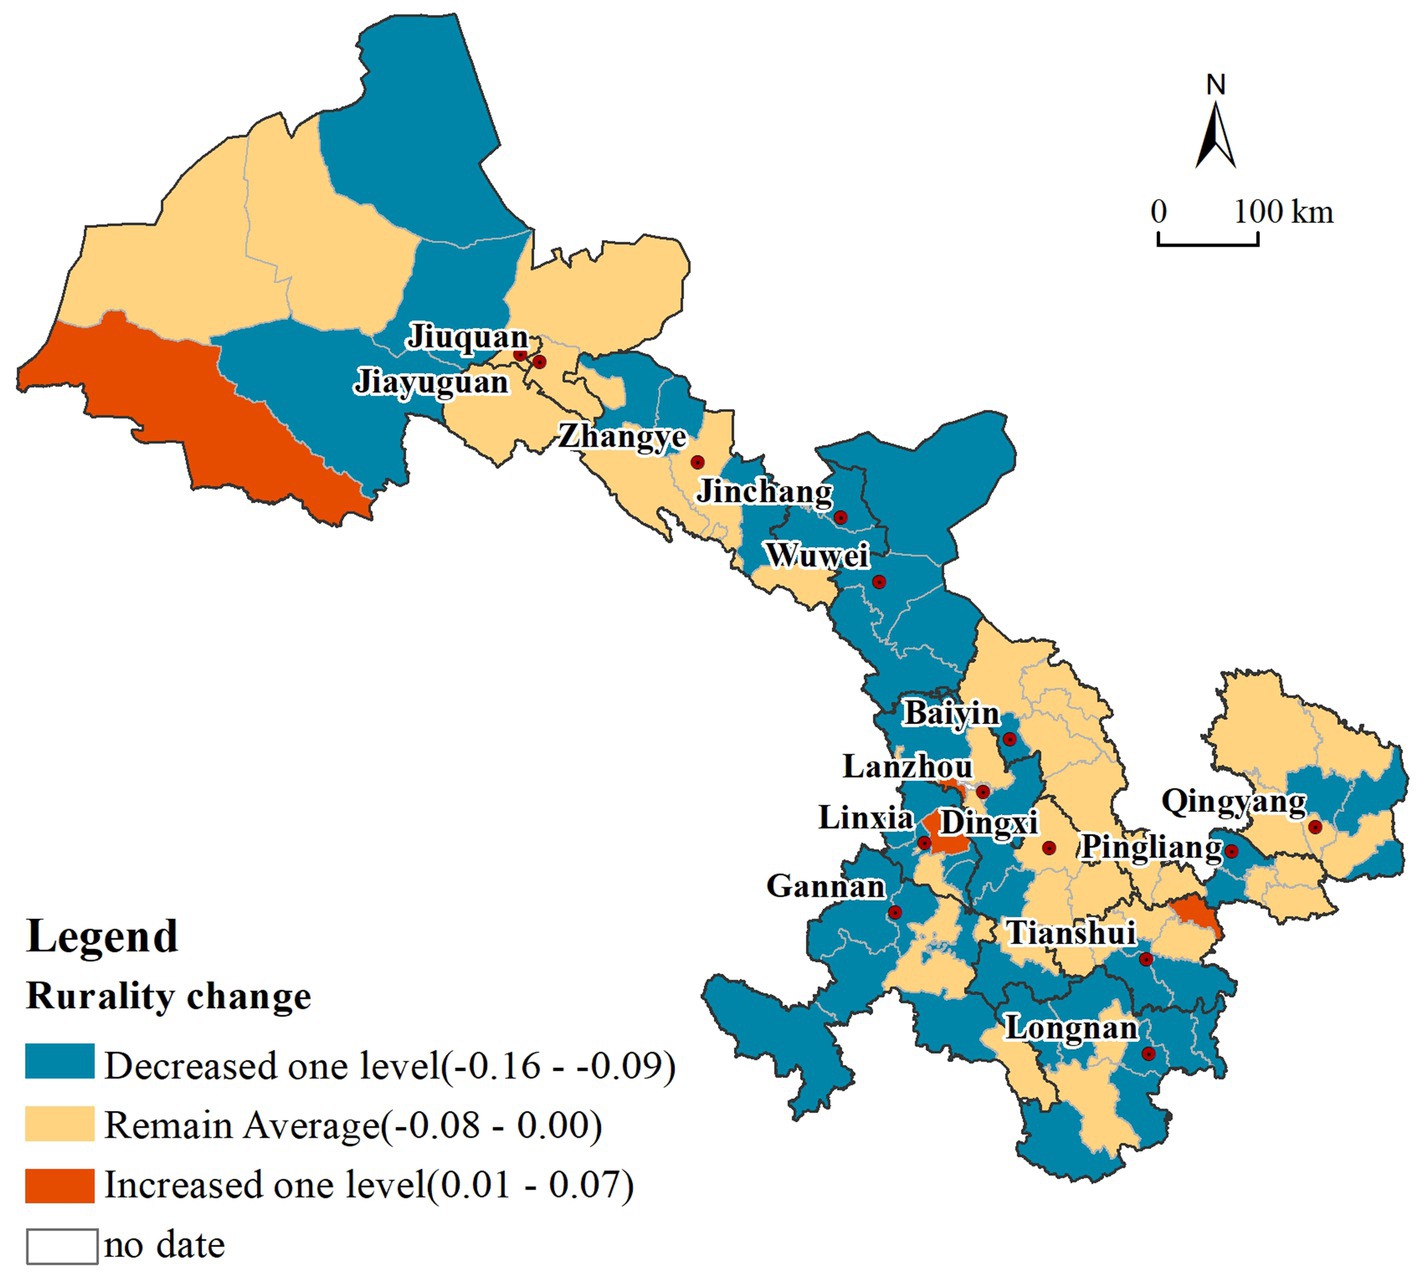
Figure 5. The correlation of rurality index in 2010 and 2020.
Figure 6 shows that the rurality index of most counties in Gansu province declined because of government policies, while it increased for only a few counties. Notably, counties with increased rurality index were primarily Aksai Kazakh Autonomous County, Dongxiang Autonomous County, and Zhangjiachuan Hui Autonomous County in Jiuquan, as well as Xigu District in Lanzhou. The main attributes of these regions were ethnic minority-gathering areas, relatively backward or even stationary economic progress, and relatively less agricultural modernization (Chen et al., 2014). Meanwhile, counties whose rurality index declined by more than one level were largely noted in western Longzhong, Gannan, most of Longdongnan, and the eastern and western edge areas of Hexi, creating a bow-shaped distribution pattern along the Qilian Mountains. Of note, the rurality index of the abovementioned areas displayed a large base. With the progress of nonagricultural economies, such as industrial and mining growth and tourism industry (Mitchell and Doyle, 1996), as well as factors like rural population decline due to migration, the rurality index in these areas reduced considerably (Zhang et al., 2022). However, the rurality index changed marginally in the central Hexi, eastern Longzhong, northern Longdongnan, and Longdong regions, all of which are primarily agricultural counties and mountainous counties on the Loess Plateau, with relatively slow socioeconomic development and limited agricultural modernization (Lyu and Cao, 2020). Owing to the improved mechanization and irrigation levels, the Hexi region exhibited superior agricultural production environments. Consequently, it is the key grain-growing area in Gansu province, with a relatively small change in the rurality index (Li et al., 2010).
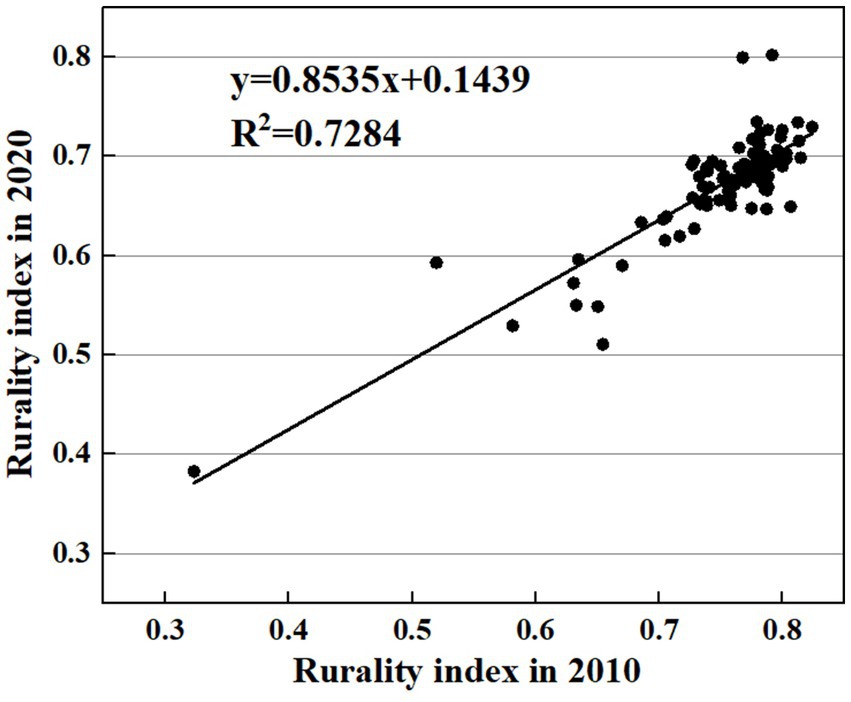
Figure 6. The changing pattern of rurality index between 2010 and 2020.
3.2 Correlation between rurality and human settlement indicators
A rural area is an intricate, extensive regional system with specific functions that stem from the interplay between the natural environment and socioeconomic factors of human settlements (Long and Tu, 2017). Rural human settlements denote a large area outside the urban area that is under the significant influence of the rural internal system, external system, and supporting environments. Notably, the internal system can be categorized into natural factors and humanities factors (Long et al., 2010). With the socioeconomic transition and redesigning of the rural territorial system, rurality under the influence of human settlements varies markedly across time and space (Zografos, 2007). With the socioeconomic transition and redesigning of the rural territorial system, rurality under the influence of human settlements varies markedly across time and space (Zografos, 2007).For example, endogenous resource-driven villages depend on their own promising natural and human resources to promote industrial growth, economy-driven villages depend on the strong attraction of external cities to promote related service industries. The governments of location-constrained villages should escalate the construction of infrastructure and public service facilities to guarantee rural growth.
The spatial differentiation attributes of the rurality index in Gansu province counties during 2010–2020 reflected the evolution trend of rural growth under the government policies. The factors of rural human settlement environment ascertain the pattern of rural growth, largely including internal driving factors predominated by natural factors and humanities factors, external factors, and supporting settings for rural growth predominated by social factors. Accordingly, we used the geographical detector model and Pearson’s correlation analysis to measure the impact of rural settlement factors on the spatial differentiation of the rurality index.
3.2.1 Geographical detector analysis
Table 2 shows that the rurality index of Gansu province in 2010 was influenced by rural residential environment factors in the following order: humanities factors (q = 0.448) > social factors (q = 0.351) > living condition factors (q = 0.232) > natural factors (q = 0.160) > infrastructure factors (q = 0.104). The order of influence of the five variables in 2020 was: humanities factors (q = 0.528) > social factors (q = 0.277) > living condition factors (q = 0.228) > infrastructure factors (q = 0.159) > natural factors (q = 0.126). Both humanities factors and social factors predominantly influenced the spatial differentiation of the rurality index, and the influence of this factor further surged during 2010–2020. However, the influence of natural factors was relatively small, which further decreased over time (2010 q = 0.160 > 2020 q = 0.126). During 2010–2020, infrastructure factors increasingly contributed to the spatial differentiation of the rurality index in Gansu province. The last decade has witnessed a change in the influence of natural and infrastructure factors on the spatial differentiation of the rurality index. Of note, the progress of science and technology has gradually decreased people’s dependence on nature. Meanwhile, progressive improvements in infrastructure, rural travel conditions, living conditions, and production capacity have slowly increased people’s dependence on nature (Ocaña-Riola and Sánchez-Cantalejo, 2005).
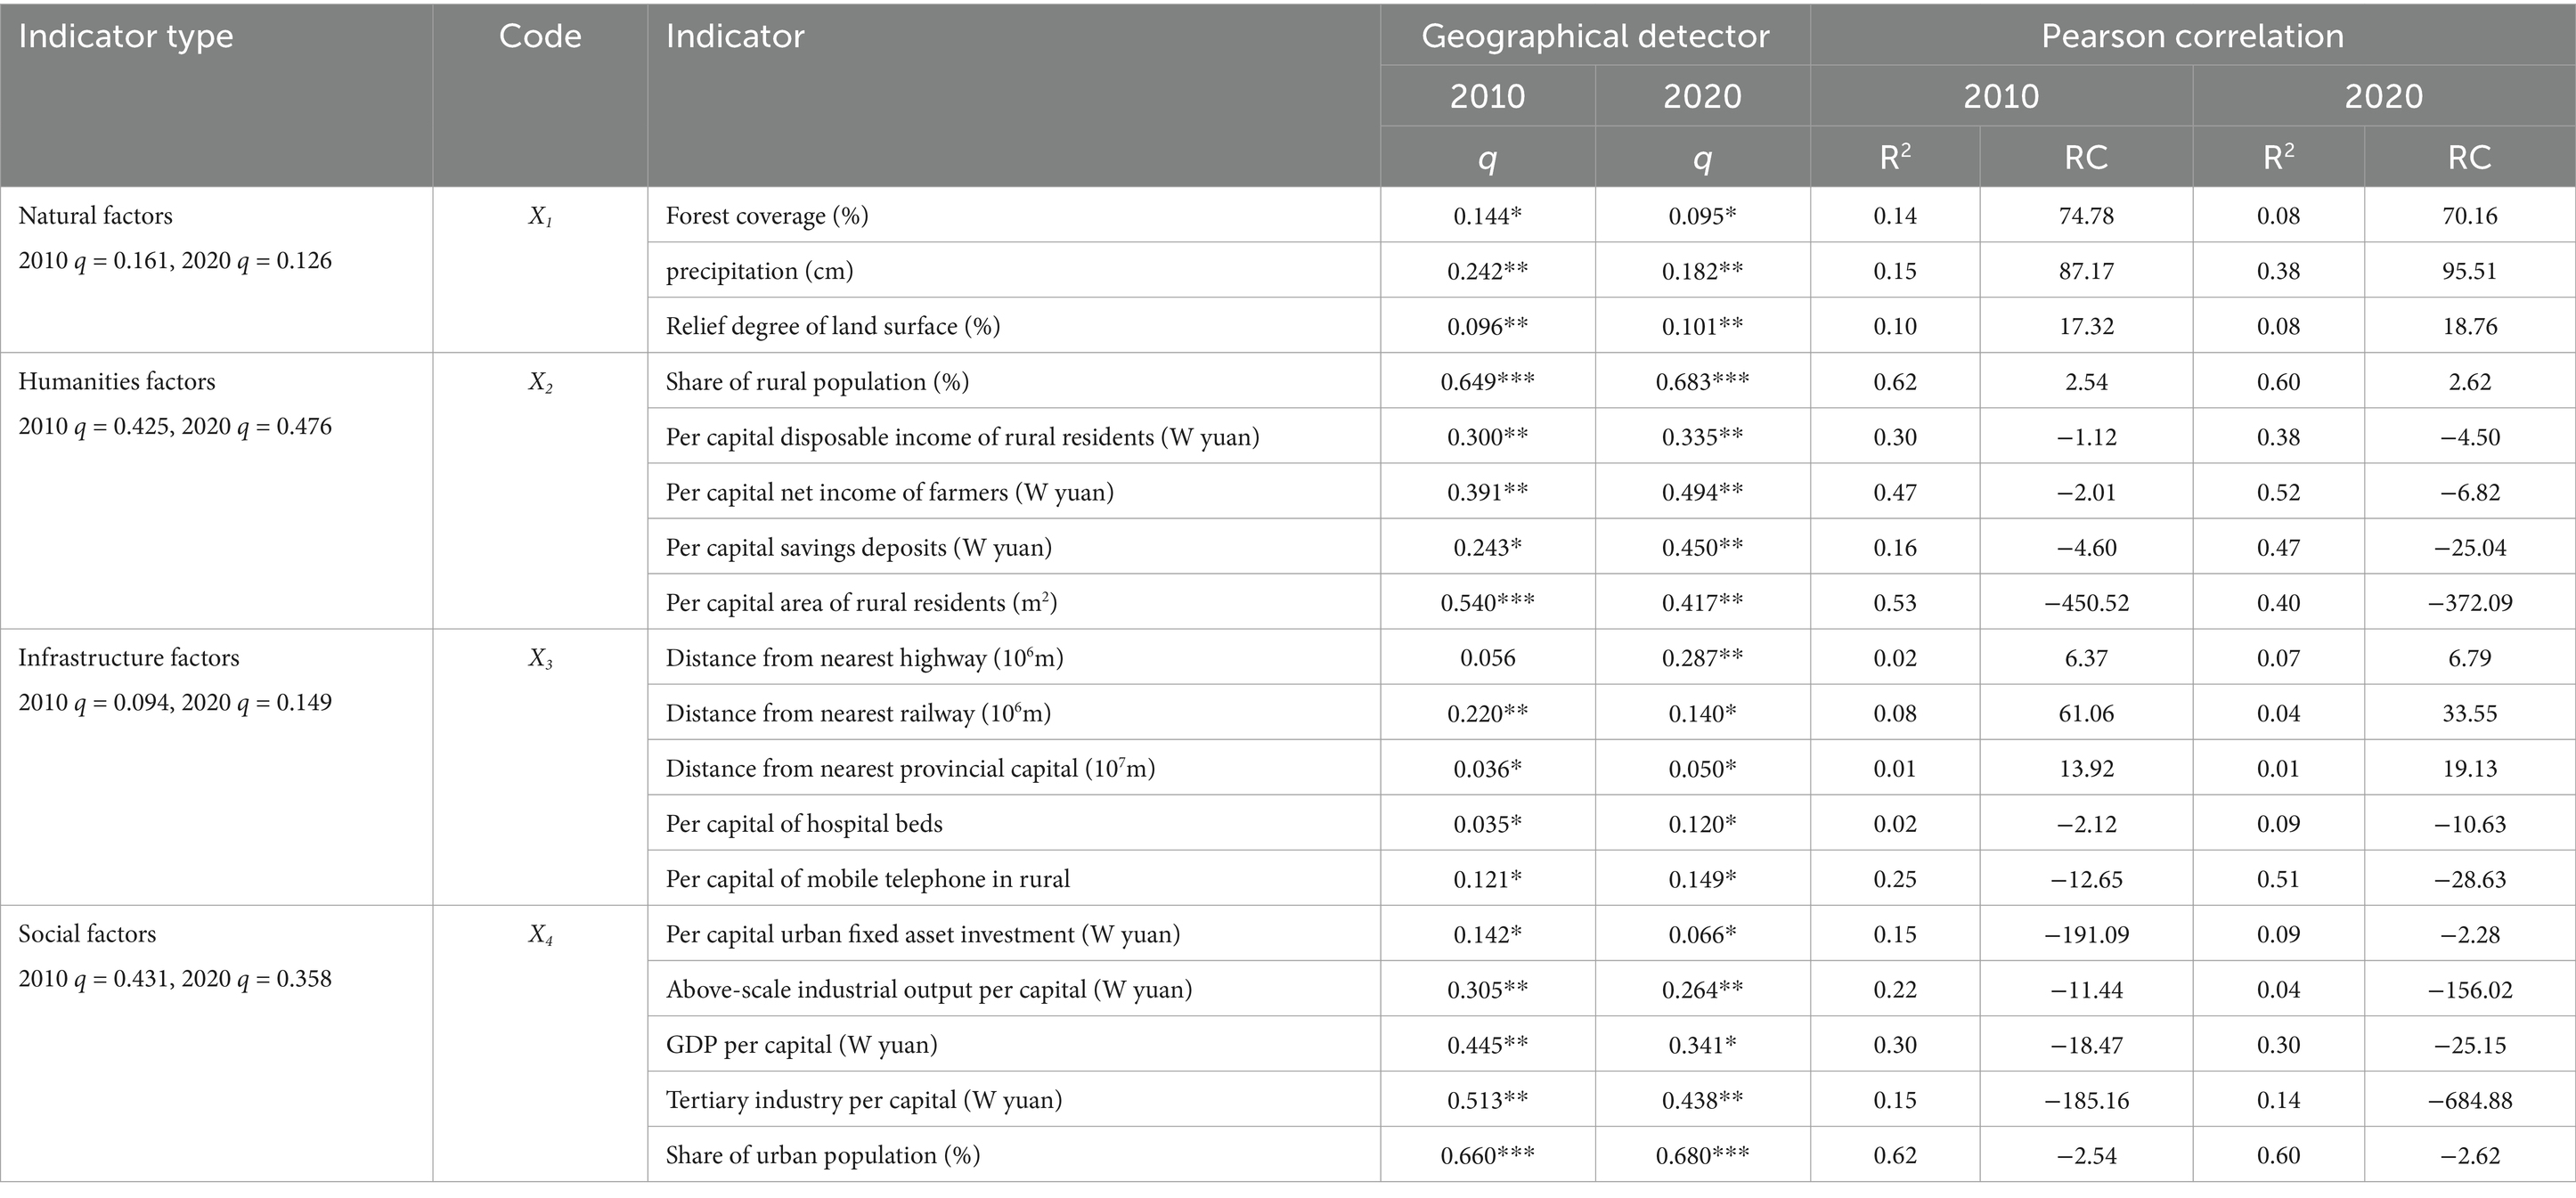
Table 2. The correlation between rurality index and typical human settlements indicators.
3.2.2 Pearson correlation analysis
The rurality index is significantly negatively correlated to the urban population, per capita disposable income, net income and per capita savings capacity of farmers, which reflects the human settlement factors; the per capita homestead area, medical and health conditions and communication conditions, which reflects the living conditions; and the urban per capita fixed assets, per capita industrial output value above designated size, per capita GDP and per capita tertiary industry output value, which reflects the social economy.
Among natural factors, forest coverage and precipitation exerted a higher impact on the rurality index (Table 2). Nevertheless, counties (districts) with higher rurality had higher terrain relief and were farther away from provincial capital cities, major highways, and railways. This finding suggests that counties with a relatively high rurality index are at the edge of geographical scope and economic influence (Figure 3; Doogan et al., 2018). The rural population index in humanities factors decreased considerably; however, its correlation with the rurality index remained high (2010 R2 = 0.6226 > 2020 R2 = 0.6017). The per-capita rural homestead area increased markedly, but its impact on rurality decreased (2010 R2 = 0.5788 > 2020 R2 = 0.4049). The further declining rural population increased the area of rural idle construction land, resulting in a more serious rural extensive development model. While fundamental medical settings have improved considerably, the correlation between them and the rurality index also increased further (2010 R2 = 0.0249 < 2020 R2 = 0.0924), suggesting that improved rural medical and health settings exerted a positive impact on reasonably decreasing the county rurality index (Minore et al., 2008). Of note, the impact of communication level on rurality has increased markedly with the advent of China Mobile communication facilities, 5G Internet, and digital villages (2010 R2 = 0.2459 < 2020 R2 = 0.5142; Li et al., 2023). Although the per-capita industrial output value above the designated size is increasing, its correlation with rurality has declined markedly (2010 R2 = 0.2211 > 2020 R2 = 0.0357). In addition, the per-capita industrial output value above the designated size in Gansu province is relatively low, with the main focus on mining areas. Slow industrial development renders it inadequate to attract the rural population (Han et al., 2017). Furthermore, the output value of the tertiary industry increased remarkably, but the correlation between it and the rurality index hardly changed (2010 R2 = 0.1495 < 2020 R2 = 0.1439). Arguably, socioeconomic development can promote the healthy transition of the rural economy and markedly improve people’s living standards. However, a strong negative correlation was noted between per-capita GDP and rurality (2010 R2 = 0.2979 < 2020 R2 = 0.2960).
3.3 Division rurality of Gansu province based on human settlement factors
Humanities factors, social factors, natural factors, and infrastructure factors mainly influence the spatial distribution heterogeneity of the rurality index in Gansu province. Taking 14 cities (prefectures) in Gansu province as the evaluation unit, we conducted multilevel detection through the geographical detector model to quantitatively assess the difference in the influence of four types of human settlement factors on rurality in different cities (Table 3). Of note, the difference in the rurality index during 2020–2010 of each county was the dependent variable, while the difference in each human settlement factor was the independent variable. A factor with q > 0.4 was selected as the dominant factor of the urban–rural gap and the factor with the largest q value was selected as the dominant factor if the q value of each factor was <0.4. Finally, based on the rurality index and dominant factors, we classified the rural areas in Gansu province into three types: external economy-driven rural areas, endogenous resource-driven rural areas, and location-constrained rural areas (Figure 7).
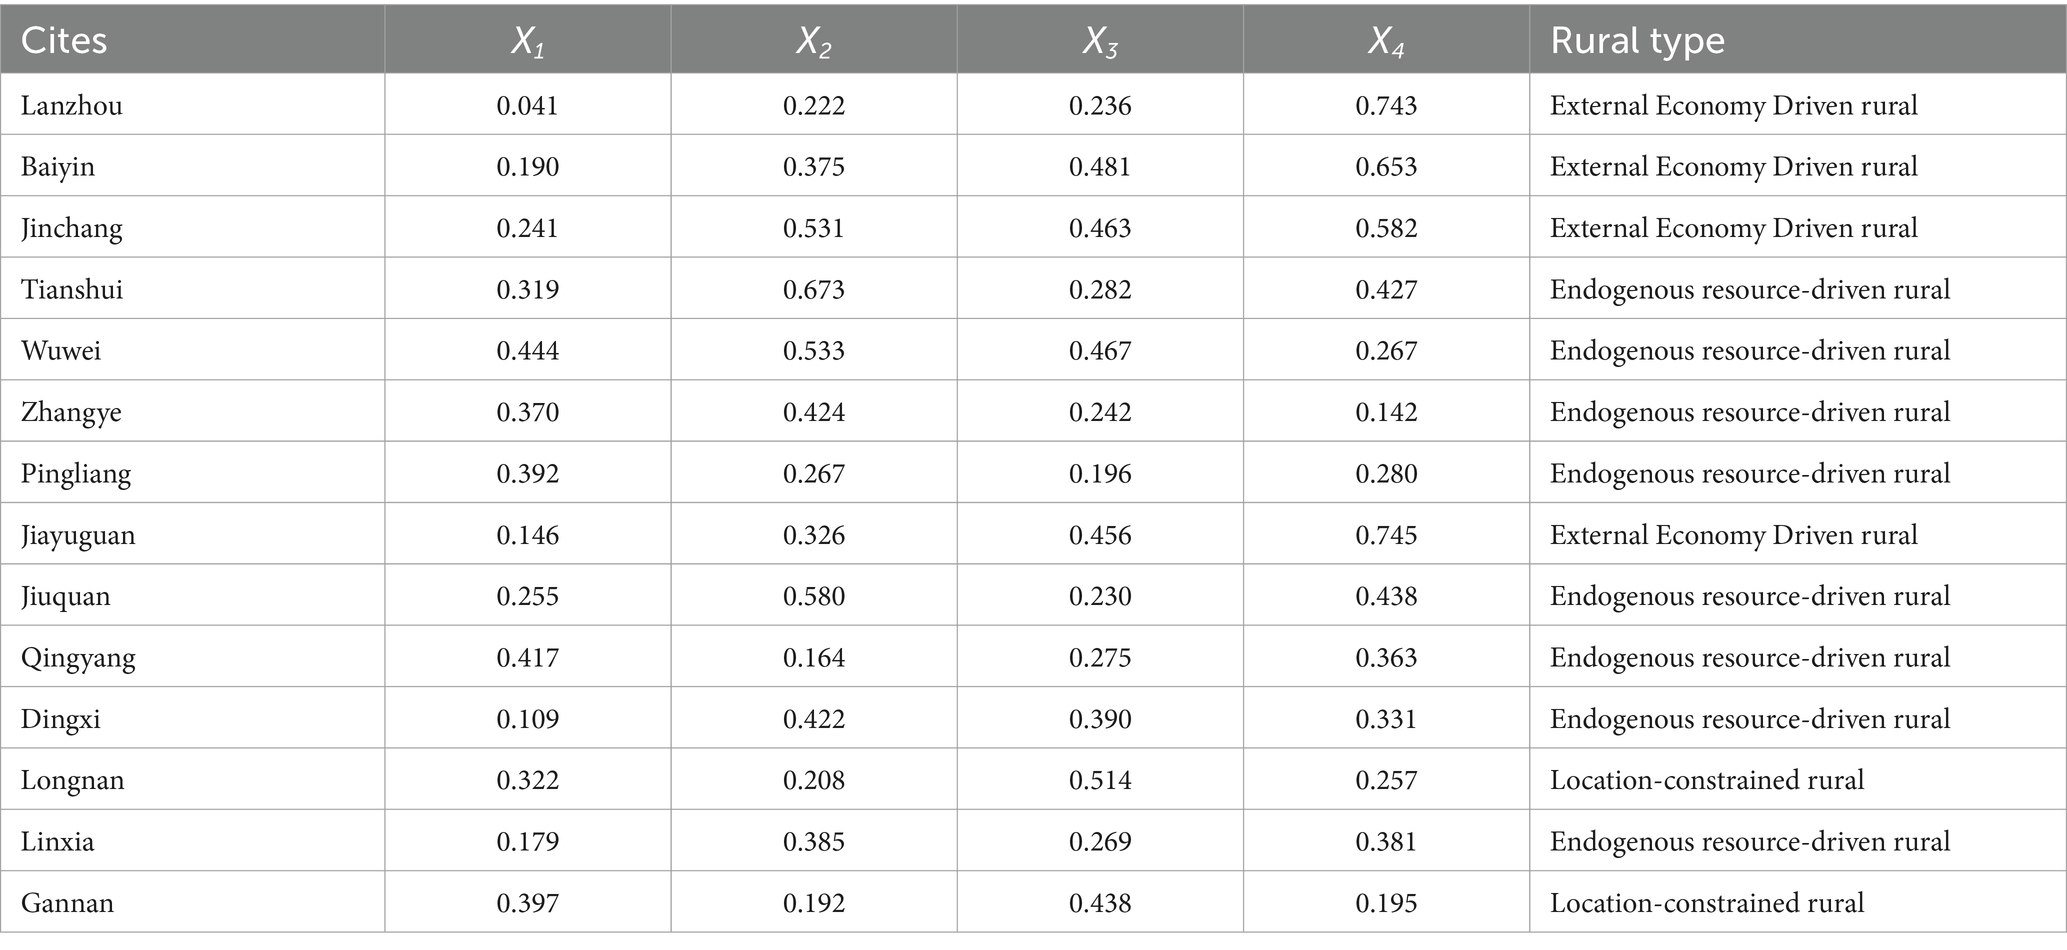
Table 3. Division rurality of 14 cities of Gansu province based on human settlements factors.
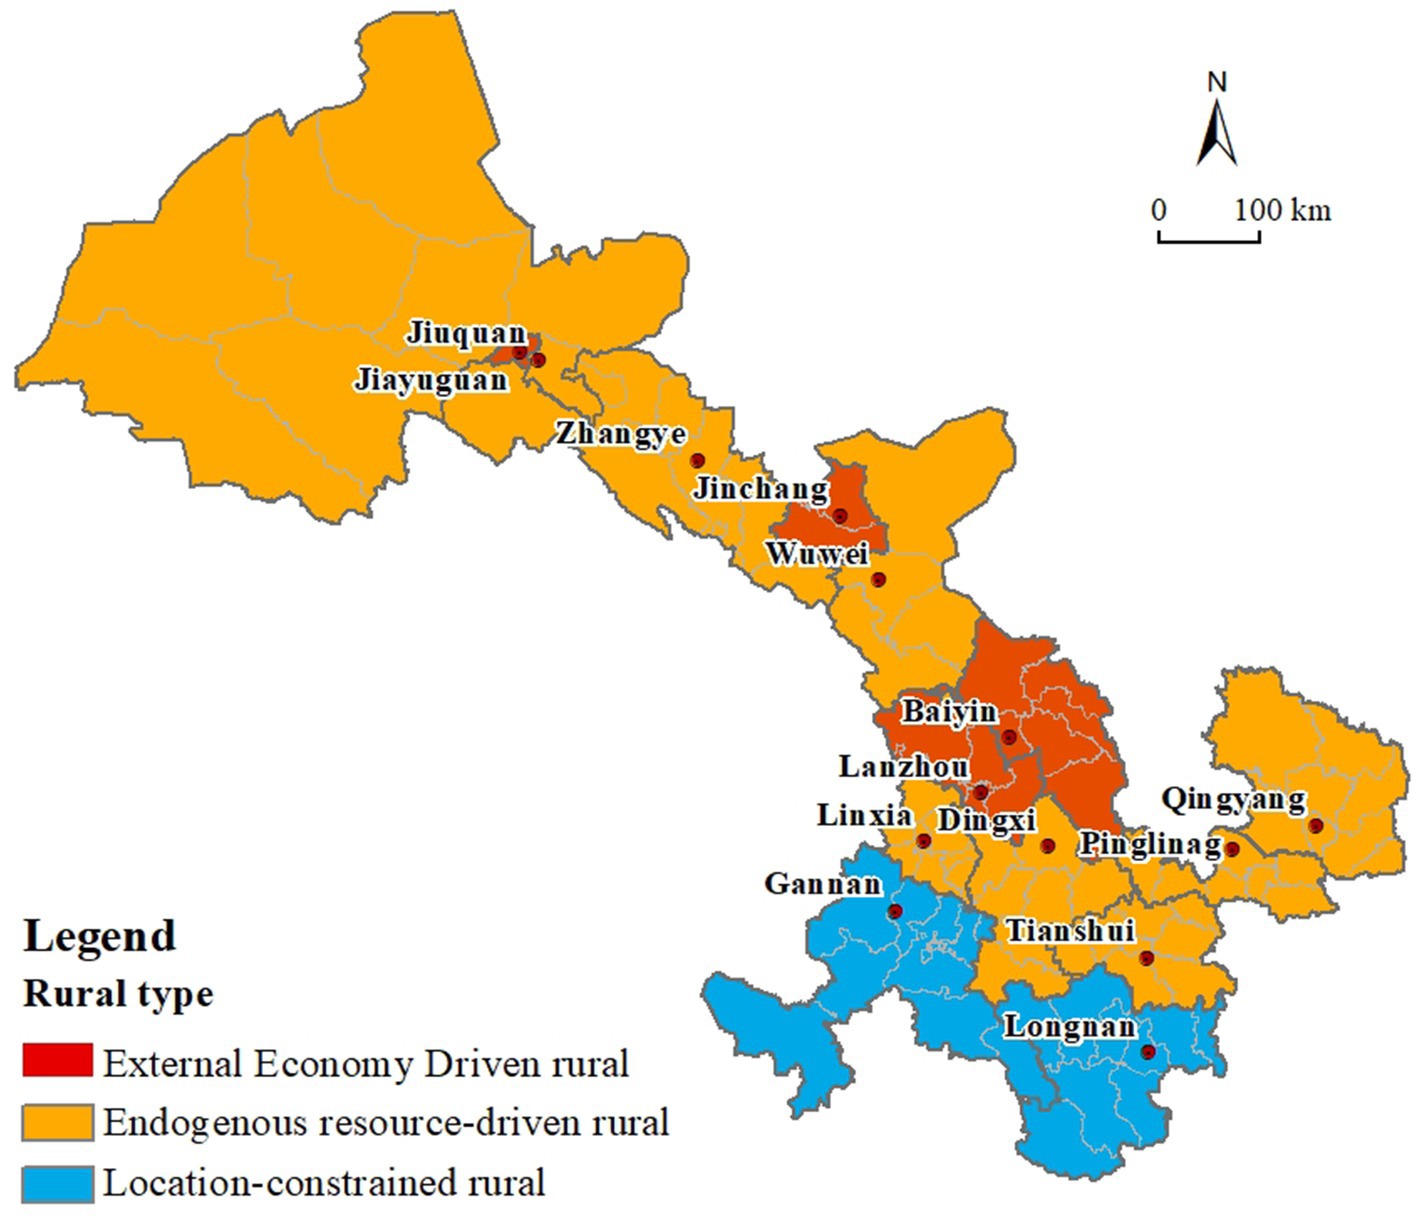
Figure 7. Regional distribution of rural.
Lanzhou (q = 0.743), Jiayuguan (q = 0.745), Baiyin (q = 0.653), and Jinchang (q = 0.582) came under external economy-driven rural areas, where social factors mainly influenced development (Table 3). Meanwhile, only two cities, Longnan (q = 0.514) and Gannan (q = 0.438) came under location-constrained rural areas, and infrastructure factors mainly influenced the rural growth of these cities. A total of eight cities came under endogenous resource-driven rural areas. Among them, rural growth in Qingyang and Pingliang was primarily influenced by natural factors, while humanities factors influenced rural growth in the other six cities. Of note, Tianshui displayed the largest q value of 0.673, while Linxia Autonomous Prefecture had the smallest q value of 0.385.
4 Discussion
4.1 Spatial differentiation mechanism of rurality in Gansu province
The rurality index reflects the changing characteristics of rural areas in response to social and economic progress. However, it does not evaluate the merits, drawbacks, or stages of development within these areas (Li et al., 2015). The correlation analysis between the rurality index and the human settlement environment index indicates that rural development is shaped by various factors related to human settlement conditions.
1. Natural factors constitute the base of rural growth. Gansu province is a vast territory, with varied topography, landform, and climate, as well as countless differences in regional growth (Figure 3). Hexi region, with flat topography and expedient transport, has large areas of traditional agricultural cultivation depending on irrigation in the Qilian Mountains. Hence, the Hexi region primarily develops agriculture and animal husbandry, leading to a moderately high rurality index. Meanwhile, Longzhong and Longdong regions are situated in the hilly areas of the Loess Plateau, with severe topographic fragmentation, unique geographic conditions, and relatively low rainfall, resulting in its dominance in traditional mountain agriculture and slow rural transition. Conversely, Longnan and Gannan regions mainly comprise forests and grasslands, making these suitable for animal husbandry and forestry rather than large-scale agricultural production, thereby resulting in a high rurality index. Of note, the spatial distribution of rurality in Gansu province directly correlates with the distribution attributes of natural resources like climate, topography, and geomorphology. Usually, industries in regions with poor natural resources prefer traditional agriculture and animal husbandry owing to their low level of roughness and efficiency, rendering their rural development slow while the rurality index high.
2. Human-centric factors significantly influence the dynamics of rural growth. The work by Ellis and Galluzzo highlights that village development is closely tied to elements such as farmers’ income, living conditions, and employment opportunities (Ellis and Biggs, 2001; Galluzzo, 2018). Table 2 and Figure 3 illustrate that humanities factors strongly correlate with rurality. However, except for the rural population factor, a significant negative correlation was noted between other humanities factors and rurality, suggesting that augmenting farmers’ standard of living plays a crucial role in successfully decreasing rurality. Per the Statistical Yearbook of Gansu province (2011, 2021), farmers’ residential income and consumption in Gannan and Longnan are low, leading to a high rurality index here.
3. Infrastructure factors, such as superior location, convenient transportation, and public facilities, are key support for rural growth. Typically, the closer the proximity to capital cities, railways, and major transportation routes, the higher the access to economic and service resources. Our findings suggested an increase in the rurality index with distance from provincial capitals, major highways, and railroads, indicating that counties with relatively high rurality indices are at the edge of their geographic range and economic sphere of influence (Figure 3; Doogan et al., 2018). Moreover, counties in Longnan and Gannan regions are scattered and not easily accessible, resulting in the progressive marginalization of rural growth in these regions and a high rural index. Besides, the level of regional communication and medical care negatively correlated with rurality, indicating a high level of rurality in areas with low regional amenities. The study by Doogan and Mao identified differences in regional infrastructure—specifically medical and healthcare services, transportation accessibility, and communication networks—as critical drivers of disparities in rural development, particularly in underdeveloped regions. These findings align closely with the conclusions drawn in this study (Mao et al., 2015; Doogan et al., 2018).
4. Social factors are the foremost factors influencing the spatial differentiation of rurality. The rapid growth of industrialization and urbanization stimulates significant migration of rural populations to cities, resulting in the quick decline of rural landscape culture and, thus, swift reduction of the rurality index (Chen et al., 2014). The rurality index of Longzhong area with Lanzhou as the center ranged between low and middle, and the value showed a noteworthy declining trend (Figure 3). Figure 7 shows that the above-scale industrial output per-capita and tertiary industry per-capita negatively correlate with rurality, implying that the expansion of the industrial and mining industry led to the clustering of the rural population at the location of factories. For example, Akesai County in Jiuquan, which is on the edge of the desert, has rich mineral resources and, thus, a low rurality index (Li et al., 2015). Another exciting finding is that the tertiary sector in counties with a high rurality index was inclined to increase remarkably over the 10 years, and so did the correlation between the two. Of note, the advancement of the third sector can raise the income of the population and encourage the rapid transition of traditional agriculture in the countryside, thereby effectively decreasing the rurality index.
4.2 Measures to enhance rurality in Gansu province
The studies conducted by Debnath, Baulch, and Henderson highlight the utility of the rurality index in guiding regional rural development strategies (Debnath and Bardhan, 2018; Baulch et al., 2024; Henderson et al., 2024). Incorporating social and human factors into the rurality index enables a comprehensive analysis of regional disparities in rural development, offering valuable insights for addressing rural development challenges and guiding the policy development process. Combining the above research results with the rural development policies in this region, we put forward the following suggestions for rural development in Gansu province.
1. The government should scrap its “one-size-fits-all” agricultural and rural development policy and comprehend the nature of rural issues in different regions to endorse regional rural growth (Cleland, 1995; Li et al., 2015). External economy-driven rural areas depend on the surrounding strong urban economy. Romano and Jacquet described the characteristics of cities, suburbs and villages to explore the rural development mechanism in the context of urbanization. The study indicates that facilitating rural adaptation to urbanization can be an effective rural development strategy. However, it is essential to prioritize the management of homestead reclamation, farmland and food security, environmental restoration, and the preservation of rural characteristics during this process (Romano et al., 2016; Jacquet et al., 2017). Therefore, the focus of rural growth in this region should be on leveraging the economic benefits of urban industries. For example, it can take the benefit of its decent location and expedient transportation amenities to undertake part of the urban productive service functions to gain integrated growth. Conversely, development in endogenous resource-driven rural areas relies on its resource settings. Thus, agricultural infrastructure and labor training should be reinforced to surge land productivity. Meanwhile, the absence of infrastructure and public services in location-constrained rural areas adversely affects the livelihood needs of farmers, such as access to transportation, healthcare, and education. Hence, infrastructure and public service facilities, such as roads and communication, should be improved in location-constrained rural areas. Furthermore, the quality and variety of facilities should be enhanced to promote growth in these regions.
2. Governments should modify development patterns and mechanisms consistent with the dominant factors of spatial differentiation in rurality. The impact of human settlement factors on rural spatial growth in Gansu province is markedly different. Thus, the direction of rural growth can be decided comprehensively per the spatial differentiation attributes of the rurality index and human settlement factors. For example, Longnan and Gannan regions, which have a high rurality index, are rich in tourism resources, including natural ecology, vernacular humanities, and folk culture (Mitchell and Doyle, 1996). Consequently, future rural development policies in these regions could implement the concepts of agro-tourism integration, eco-tourism, and vernacular folklore, focusing on financial, technological, and human resources support (Halfacree, 1993). For other regions having medium-level rurality indices, such as Longzhong, Longdong, and Longdongnan, the government should proactively investigate varied modes of agricultural expansion, rural economic organizations, and new types of agribusiness relations to judiciously optimize the spatial distribution pattern of rurality.
3. As human settlements influence the spatial pattern of rurality, rural development policies should be articulated such that they recognize the interaction between the spatial attributes of the rurality index and the habitat elements. Besides, the selection of rurality indicators should consider aspects like accessibility, rural landscape, and culture, as well as further upgrade the rurality evaluation model, to enhance the precision of rural problem identification. Moreover, rurality assessment should comprehend the actual needs of rural residents through interviews, questionnaires, and field visits to obtain pertinent data for articulating more judicious and viable policies and suggestions. In addition, rural development can be explored from different scales, such as towns and villages, and combined with socioeconomic analysis, to frame differentiated rural policies. Briefly, future rural research should further the understanding of rural areas to draft more inclusive, regionalized, and viable rural development policies. Furthermore, optimizing the pattern of rural growth should focus on the natural conditions, level of facilities, and stage of socioeconomic development of different regions. Accordingly, future research on the differences between macro-regions and intra-villages warrants further improvement to articulate a more integrated, regionalized, and practicable rural development policy.
5 Conclusion
The rurality index can reflect the basic characteristics of the county’s rural spatial pattern and provide effective guidance to rural development problems. We constructed a rurality index system to determine the spatial distribution attributes of rurality in Gansu province, as well as analyze its spatial heterogeneity influencing factors by the elements of human settlements. As some flaws were observed in the determination of rural spatial differences only by the rurality index, we further explored the rural development types of Gansu province using the influence intensity of human settlements. This indicator system can depict the basic attributes of rural spatial patterns in counties in less developed regions, so we believe that rurality plays an active role in policy articulation to address rural development issues (Beynon et al., 2016). The conclusions of the study are as follows:
1. The spatial distribution of rurality in Gansu province shows considerable differences, and the rurality index displays a spatial pattern of gradual surge from the west to the east. The counties with “extremely low” rurality index are primarily the municipal governments of Lanzhou, Baiyin, and Jiayuguan, while those with “extremely high” rurality index are largely scattered in Gannan, south of Longdongnan, and north of Longdong.
2. High-High counties in the rurality index are primarily situated in the Gannan region and the western part of Longdongnan, with the number declining from 17 in 2010 to 9 in 2020. Low-Low counties are mainly situated in the Longzhong region centered on Lanzhou and parts of Hexi. Notably, the spatial distribution pattern of the rurality index in Gansu province changed only a little during 2010–2020. Meanwhile, counties with a reduction of one or more levels in the rurality index are mostly located in the western part of Longzhong, Gannan, most of southeast Longdong, and the eastern and western fringes of Hexi, creating a distribution pattern along the Qilian Mountains. Of note, counties with increased rurality indexes are primarily ethnic minority concentration areas.
3. The spatial differentiation of the rurality index in Gansu province is influenced by various human settlement factors, which, in turn, are primarily influenced by humanities factors. With the evolution of rural social development, the influence degree of natural factors declined, while the influence degree of infrastructure factors increased considerably. Moreover, the correlation analysis infers that counties (districts) with a higher rurality index are categorized by a high degree of topographic relief and distance from surrounding provincial capitals, major highways, and railroads. Such counties are on the edge of geographical and socioeconomic development. Furthermore, the correlation between the rurality index and the level of communication has increased markedly during 2010–2020.
4. Based on the influence of different habitat factors on rural spatial differentiation, this study categorizes rural areas in Gansu province into three types: external economy-driven rural areas, endogenous resource-driven rural areas, and location-constrained rural areas. Lanzhou, Jiayuguan, Baiyin, and Jinchang are the external economy-driven rural areas, where rurality changes are primarily influenced by social factors. Meanwhile, Gannan and Longnan belong to location-constrained rural areas, where rural development is primarily influenced by infrastructure factors. Overall, there are eight endogenous resource-driven rural areas, among which the rural growth of Qingyang and Pingliang is largely influenced by natural factors, while that of other cities is mostly influenced by humanities factors.
The rural area is a complex regional system, making it challenging for government policies aimed at rural development to achieve revitalization without a comprehensive understanding of regional rural patterns (Liu et al., 2019). While the rurality index can provide insights into rural spatial patterns and industrial structure, it has limitations and cannot fully capture the needs of rural development (Nelson et al., 2021). In the Hexi region of Gansu province, the rurality index is relatively high and shows an upward trend. However, relying solely on the rurality index to develop agricultural policies for this region is problematic, as it does not adequately support food production and agricultural modernization. In contrast, Aksai Autonomous County in Jiuquan City and Minqin County in Wuwei City have relatively low rurality indices due to their focus on industrial mining and ecological migration. Policies in these areas should prioritize farmers’ livelihoods, infrastructure development, and the modernization of agriculture.
Given the strengths and limitations of the rurality index, several areas warrant attention for further enhancement. First, the selection of rurality indicators should encompass a broader range of characteristics, such as transport accessibility, rural landscape, and cultural aspects, to refine the rurality evaluation model and improve the accuracy of the identification of rural problems. Second, to better understand the actual needs of rural residents, assessment models should also incorporate interviews, surveys, and field visits. Identification of differences among various villages through methods like hierarchical analysis and multiple regression can provide valuable insights for creating more effective and feasible developmental policies. Third, it is important to examine the mechanisms behind rural disparities at various scales, including towns and villages, and integrate these findings with socioeconomic analyses to develop tailored livelihood and economic development policies. In conclusion, future research on rural issues should aim for a deeper, more comprehensive understanding of these areas to guide the development of policies that are regionally tailored, evidence-based, and effective.
Data availability statement
The original contributions presented in the study are included in the article/supplementary material, further inquiries can be directed to the corresponding author.
Author contributions
XW: Formal analysis, Methodology, Software, Visualization, Writing – original draft. MG: Data curation, Investigation, Project administration, Validation, Writing – review & editing. XT: Funding acquisition, Writing – review & editing.
Funding
The author(s) declare that financial support was received for the research, authorship, and/or publication of this article. This research was funded by the National Natural Science Foundation of China, grant number 52068040; and the National Natural Science Foundation of Gansu Province, grant number 20JR10RA244.
Conflict of interest
The authors declare that the research was conducted in the absence of any commercial or financial relationships that could be construed as a potential conflict of interest.
Generative AI statement
The authors declare that no Gen AI was used in the creation of this manuscript.
Publisher’s note
All claims expressed in this article are solely those of the authors and do not necessarily represent those of their affiliated organizations, or those of the publisher, the editors and the reviewers. Any product that may be evaluated in this article, or claim that may be made by its manufacturer, is not guaranteed or endorsed by the publisher.
Footnotes
3. ^https://lbsyun.baidu.com/products/map
References
Ali, A. M. S. (2007). Population pressure, agricultural intensification and changes in rural systems in Bangladesh. Geoforum 38, 720–738. doi: 10.1016/j.geoforum.2006.11.028
Baulch, B., Huynh, M. S. N., and Tran, T. D. (2024). The changing distribution of land in rural Vietnam, 2004–2014. Land Use Policy 142:107186. doi: 10.1016/j.landusepol.2024.107186
Beynon, M. J., Crawley, A., and Munday, M. (2016). Measuring and understanding the differences between urban and rural areas. Environ. Plan. B 43, 1136–1154. doi: 10.1177/0265813515605096
Biddle, C., and Azano, A. P. (2016). Constructing and reconstructing the “rural school problem” a century of rural education research. Rev. Res. Educ. 40, 298–325. doi: 10.3102/0091732X16667700
Brown, D. G., Johnson, K. M., Loveland, T. R., and Theobald, D. M. (2005). Rural land-use trends in the conterminous United States, 1950–2000. Ecol. Appl. 15, 1851–1863. doi: 10.1890/03-5220
Chen, R., Ye, C., Cai, Y., Xing, X., and Chen, Q. (2014). The impact of rural out-migration on land use transition in China: past, present and trend. Land Use Policy 40, 101–110. doi: 10.1016/j.landusepol.2013.10.003
Cloke, P. J. (1977). An index of rurality for England and Wales. Reg. Stud. 11, 31–46. doi: 10.1080/09595237700185041
Connor, D. S., Hunter, L., Jang, J., and Uhl, J. H. (2023). Family, community, and the rural social mobility advantage. Res. Soc. Stratification Mobility 87:100844. doi: 10.1016/j.rssm.2023.100844
Debnath, R., and Bardhan, R. (2018). Resource Symbiosis model through bricolage: a livelihood generation assessment of an Indian village. J. Rural. Stud. 60, 105–121. doi: 10.1016/j.jrurstud.2018.03.010
Doogan, N. J., Roberts, M. E., Wewers, M. E., Tanenbaum, E. R., Mumford, E. A., and Stillman, F. A. (2018). Validation of a new continuous geographic isolation scale: a tool for rural health disparities research. Soc. Sci. Med. 215, 123–132. doi: 10.1016/j.socscimed.2018.09.005
Ellis, F., and Biggs, S. (2001). Evolving themes in rural development 1950s-2000s. Dev. Policy Rev. 19, 437–448. doi: 10.1111/1467-7679.00143
Fang, F., Ma, L., Fan, H., Che, X., and Chen, M. (2020). The spatial differentiation of quality of rural life based on natural controlling factors: a case study of Gansu Province, China. J. Environ. Manag. 264:110439. doi: 10.1016/j.jenvman.2020.110439
Feng, Y., Liang, Z., and Wang, F. (2018). Spatial and temporal change of rurality in towns based on land use: a case of Panyu district and Conghua district in Guangzhou. Sci. Geogr. Sin. 38, 1499–1507. doi: 10.13249/j.cnki.sgs.2018.09.013
Frouws, J. (1998). The contested redefinition of the countryside. An analysis of rural discourses in the Netherlands. Sociol. Rural. 38, 54–68. doi: 10.1111/1467-9523.00063
Gajić, A., Krunić, N., and Protić, B. (2018). Towards a new methodological framework for the delimitation of rural and urban areas: a case study of Serbia. Geografisk Tidsskrift Danish J. Geography 118, 160–172. doi: 10.1080/00167223.2018.1503551
Galluzzo, N. (2018). A preliminary quantitative analysis of rural development in Romania using the PLS-SEM. Albanian J. Agricult. Sci. 17, 125–133.
Halfacree, K. H. (1993). Locality and social representation: space, discourse and alternative definitions of the rural. J. Rural. Stud. 9, 23–37. doi: 10.1016/0743-0167(93)90003-3
Han, D., Qiao, J., and Ma, Y. (2017). Spatio-temporal differentiation and evolution of rurality under the background of rapid industrialization: a case study of Gongyi city, Henan province. Geographical Res. 36, 2405–2418.
Harrington, V., and O’donoghue, D. (1998). Rurality in England and Wales 1991: a replication and extension of the 1981 rurality index. Sociol. Rural. 38, 178–203. doi: 10.1111/1467-9523.00071
Hedlund, M. (2016). Mapping the socioeconomic landscape of rural Sweden: towards a typology of rural areas. Reg. Stud. 50, 460–474. doi: 10.1080/00343404.2014.924618
Henderson, A., Barnes, A. P., and Hammond, J. (2024). Characterising diversity of rural farm households in eastern Africa: implications for food security and intra-household decision-making. Front. Sustain. Food Syst. 8:1397833. doi: 10.3389/fsufs.2024.1397833
Jacquet, J. B., Guthrie, E., and Jackson, H. (2017). Swept out: measuring rurality and migration intentions on the upper Great Plains. Rural. Sociol. 82, 601–627. doi: 10.1111/ruso.12145
Lakshmanan, T. (1982). A systems model of rural development. World Dev. 10, 885–898. doi: 10.1016/0305-750X(82)90063-8
Li, R., Huang, X., and Liu, Y. (2023). Spatio-temporal differentiation and influencing factors of China's urbanization from 2010 to 2020. Acta Geograph. Sin. 78, 777–791.
Li, Y., Liu, Y., and Long, H. (2010). Spatio-temporal analysis of population and residential land change in rural China. J. Nat. Resour. 25, 1629–1638.
Li, Y., Liu, Y., Long, H., and Cui, W. (2014). Community-based rural residential land consolidation and allocation can help to revitalize hollowed villages in traditional agricultural areas of China: evidence from Dancheng county, Henan province. Land Use Policy 39, 188–198. doi: 10.1016/j.landusepol.2014.02.016
Li, Y., Long, H., and Liu, Y. (2015). Spatio-temporal pattern of China's rural development: a rurality index perspective. J. Rural. Stud. 38, 12–26. doi: 10.1016/j.jrurstud.2015.01.004
Li, Z., Zhang, X., Li, H., and Fan, L. (2017). Research on rurality at village scale and rural development model: a case of Jintan City, Jiangsu Province. Scientia Geographica Sinica 37, 1194–1202. doi: 10.13249/j.cnki.sgs.2017.08.009
Liu, H. (2006). Changing regional rural inequality in China 1980–2002. Area 38, 377–389. doi: 10.1111/j.1475-4762.2006.00703.x
Liu, Y. (2018). Research on the urban-rural integration and rural revitalization in the new era in China. Acta Geograph. Sin. 73, 637–650.
Liu, J., Fang, Y., Qiao, J., Rosenberg, M. W., Wang, R., Liu, X., et al. (2025). Rural transformation and the future of China's "granary": a perspective on livelihood trajectories. J. Rural. Stud. 114:103524. doi: 10.1016/j.jrurstud.2024.103524
Liu, Y., and Li, Y. (2017). Revitalize the world’s countryside. Nature 548, 275–277. doi: 10.1038/548275a
Liu, Y., Zhou, Y., and Li, Y. (2019). Rural regional system and rural revitalization strategy in China. Acta Geograph. Sin. 74, 2511–2528.
Long, H. (2013). Land consolidation and rural spatial restructuring. Acta Geograph. Sin. 68, 1019–1028.
Long, H., Liu, Y., Li, X., and Chen, Y. (2010). Building new countryside in China: a geographical perspective. Land Use Policy 27, 457–470. doi: 10.1016/j.landusepol.2009.06.006
Long, H., Liu, Y., and Zou, J. (2009). Assessment of rural development types and their rurality in eastern coastal China. Acta Geograph. Sin. 64, 426–434.
Long, H., and Tu, S. (2017). Rural restructuring: theory, approach and research prospect. Acta Geograph. Sin. 72, 563–576.
Lyu, M., and Cao, X. (2020). The spatial characteristics of rurality and its relationship with the transportation accessibility in the loess plateau. Sci. Geogr. Sin. 40, 248–260. doi: 10.13249/j.cnki.sgs.2020.02.010
Madu, I. A. (2010). The structure and pattern of rurality in Nigeria. Geo J. 75, 175–184. doi: 10.1007/s10708-009-9282-9
Mao, L., Stacciarini, J.-M. R., Smith, R., and Wiens, B. (2015). An individual-based rurality measure and its health application: a case study of Latino immigrants in North Florida, USA. Soc. Sci. Med. 147, 300–308. doi: 10.1016/j.socscimed.2015.10.064
Marsden, T., and Sonnino, R. (2008). Rural development and the regional state: denying multifunctional agriculture in the UK. J. Rural. Stud. 24, 422–431. doi: 10.1016/j.jrurstud.2008.04.001
Minore, B., Hill, M. E., Pugliese, I., and Gauld, T. (2008). Rurality literature Review: Prepared for the north west local health integration network. Thunder Bay, ON: Centre for Rural and Northern Health Research, Lakehead University.
Mitchell, M., and Doyle, C. (1996). Spatial distribution of the impact of agricultural policy reforms in rural areas. Scott. Geogr. Mag. 112, 76–82. doi: 10.1080/14702549608554452
Nelson, K. S., and Nguyen, T. D. (2023). Community assets and relative rurality index: a multi-dimensional measure of rurality. J. Rural. Stud. 97, 322–333. doi: 10.1016/j.jrurstud.2022.12.025
Nelson, K. S., Nguyen, T. D., Brownstein, N. A., Garcia, D., Walker, H. C., Watson, J. T., et al. (2021). Definitions, measures, and uses of rurality: a systematic review of the empirical and quantitative literature. J. Rural. Stud. 82, 351–365. doi: 10.1016/j.jrurstud.2021.01.035
Nutley, S. D. (1980). The concept of “isolation”—a method of evaluation and a West Highland example. Reg. Stud. 14, 111–123. doi: 10.1080/09595238000185111
Ocaña-Riola, R., and Sánchez-Cantalejo, C. (2005). Rurality index for small areas in Spain. Soc. Indic. Res. 73, 247–266. doi: 10.1007/s11205-004-0987-3
Prieto-Lara, E., and Ocana-Riola, R. (2010). Updating rurality index for small areas in Spain. Soc. Indic. Res. 95, 267–280. doi: 10.1007/s11205-009-9459-0
Roberts, A. D. (2022). Comparison of satellite-correlated crowdsourced and geostatistical temperature projections for an atlanta heatwave daily snapshot: how differences in spatially-variable predictions may be correlated to economic status and land cover/land use. Sustain. Futures 4:100078. doi: 10.1016/j.sftr.2022.100078
Romano, S., Cozzi, M., Viccaro, M., and Persiani, G. (2016). A geostatistical multicriteria approach to rural area classification: from the European perspective to the local implementation. Agric. Agric. Sci. Procedia 8, 499–508. doi: 10.1016/j.aaspro.2016.02.055
Shoultz, G., Givens, J., Drane, J. W. J. P. R., and Review, P. (2007). Urban form, heart disease, and geography: a case study in composite index formation and bayesian spatial modeling. Popul. Res. Policy Rev. 26, 661–685. doi: 10.1007/s11113-007-9049-2
Shubin, S. (2006). The changing nature of rurality and rural studies in Russia. J. Rural. Stud. 22, 422–440. doi: 10.1016/j.jrurstud.2006.02.004
Smith, B. J., and Parvin, D. W. (1973). Defining and measuring rurality. J. Agric. Appl. Econ. 5, 109–113. doi: 10.1017/S008130520001089X
Teilmann, K. (2012). Measuring social capital accumulation in rural development. J. Rural. Stud. 28, 458–465. doi: 10.1016/j.jrurstud.2012.10.002
Valjarević, A., Filipović, D., Živković, D., Ristić, N., Božović, J., and Božović, R. (2021). Spatial analysis of the possible first Serbian conurbation. Appl. Spat. Anal. Policy 14, 113–134. doi: 10.1007/s12061-020-09348-1
Valjarević, A., Srećković-Batoćanin, D., Valjarević, D., and Matović, V. (2018). A GIS-based method for analysis of a better utilization of thermal-mineral springs in the municipality of Kursumlija (Serbia). Renew. Sust. Energ. Rev. 92, 948–957. doi: 10.1016/j.rser.2018.05.005
Wu, Q., Ye, J., and Chen, Y. (2022). The spatial differentiation of rurality in developed coastal regions of eastern China based on rural revitalization: the case of Zhejiang Province. Sci. Geogr. Sin. 42, 466–475. doi: 10.13249/j.cnki.sgs.2022.03.011
Yetiskul, E., Aydın, N., and Gökçe, B. (2021). Governing the rural: the case of Izmir (Turkey) in the Post-2000 era. J. Rural. Stud. 88, 262–271. doi: 10.1016/j.jrurstud.2021.11.001
Zhang, W., Zhou, L., Zhang, Y., Chen, Z., and Hu, F. (2022). Impacts of ecological migration on land use and vegetation restoration in arid zones. Land 11:891. doi: 10.3390/land11060891
Keywords: rurality index, human settlements, rural development, underdeveloped areas, rural livelihood, Gansu province
Citation: Wang X, Geng M and Tang X (2025) Unbalanced rural development in underdeveloped areas: rurality and human settlements. Front. Sustain. Food Syst. 8:1518683. doi: 10.3389/fsufs.2024.1518683
Edited by:
Sérgio António Neves Lousada, University of Madeira, PortugalReviewed by:
Aleksandar Valjarević, University of Belgrade, SerbiaSeher Dirican, Cumhuriyet University, Türkiye
Copyright © 2025 Wang, Geng and Tang. This is an open-access article distributed under the terms of the Creative Commons Attribution License (CC BY). The use, distribution or reproduction in other forums is permitted, provided the original author(s) and the copyright owner(s) are credited and that the original publication in this journal is cited, in accordance with accepted academic practice. No use, distribution or reproduction is permitted which does not comply with these terms.
*Correspondence: Xianglong Tang, dGFuZ3hsQG1haWwubHpqdHUuY24=
†Present address: Xueyi Wang, School of Architecture, Southwest Jiaotong University, Chengdu, China