 Cassio Pinheiro Edelstein1*
 Marney E. Isaac2,3
 Luis Orozco-Aguilar1
 Felipe Peguero4,5Diego Delgado-Rodríguez6
 Rolando H. Cerda1
- 1Agroforestry and Genetic Improvement of Coffee and Cacao Unit, Centro Agronómico Tropical de Investigación y Enseñanza (CATIE), Turrialba, Costa Rica
- 2Department of Physical and Environmental Sciences and Department of Global Development Studies, University of Toronto Scarborough, Toronto, ON, Canada
- 3Department of Geography, University of Toronto, Toronto, ON, Canada
- 4Texas A&M University Higher Education Center, McAllen, TX, United States
- 5Texas A&M AgriLife Research and Extension Center, Weslaco, TX, United States
- 6Forests and Biodiversity in Productive Landscapes Unit, Centro Agronómico Tropical de Investigación y Enseñanza (CATIE), Turrialba, Costa Rica
Cocoa agroforestry systems (AFS) provide multiple ecosystem services, which are influenced by features of the shade tree community. By strategically selecting and managing shade trees based on their functional traits, cocoa farmers can affect functional diversity of AFS and potentially enhance the benefits they deliver. In this research, we applied functional trait ecology to better understand the effect of functional diversity of cocoa AFS on three ecosystem services: carbon storage, soil fertility, and provisioning of cocoa and other products. To achieve this, we characterized 30 AFS across a gradient of ecological complexity and established relationships between functional diversityw indices and ecosystem services using ANOVA and multiple regression models. As a result, two contrasting ecological dynamics were observed: low-complexity AFS, dominated by resource-conservative traits (higher leaf dry matter content, higher stem specific density, and low leaf nitrogen concentration), were associated with lower carbon stocks and soil fertility, while high-complexity AFS, characterized by resource-acquisitive traits (low leaf dry matter content, low stem specific density, and high leaf nitrogen concentration), delivered greater ecosystem services. Through the multiple regression analysis, we found that AFS dominated by species with greater maximum potential height, greater leaf nitrogen concentration, lower leaf dry matter content, lower leaf mass per area, and lower leaf nitrogen-phosphorus ratio were associated with higher carbon storage (R2 = 0.84), soil fertility (R2 = 0.7 for soil nitrogen), and multiple ecosystem services (R2 = 0.78). Additionally, cocoa yields were negatively correlated with shade cover and the dominance of large-leaf shade trees, revealing a potential trade-off between maximizing yields and enhancing ecosystem services. Nevertheless, the models indicated that a win-win scenario can be achieved when shade trees are productive, generating additional benefits. Finally, our study highlights critical relationships between shade tree traits and delivery of key ecosystem services for farm sustainability and farmer livelihoods.
1 Introduction
Agroforestry is an agricultural technique involving multiple species in the same area, with at least two components interacting with each other and at least one woody perennial species (Somarriba, 1990; Torquebiau, 2000). As a science, agroforestry branches from agronomy and forestry but diverges from both due to its inherent complexity resulting from multiple species interactions. Traditional agronomic and forestry approaches view crop performance as an outcome of crop genetics, environmental conditions, and management practices (Burdon et al., 2017; Beres et al., 2020). However, these approaches lack methodologies to analyze the interactions between multiple species, which is essential in agroforestry systems (AFS) research, design and management (Martin and Isaac, 2015). In contrast, trait-based ecology analyzes functional diversity, a distinct component of ecosystem biodiversity (Martin and Isaac, 2015). This approach projects the performance of a plant community with diverse species, such as AFS, based on the specific attributes of its individuals which affect species-ecosystem interactions: the functional traits (McGill et al., 2006; Díaz et al., 2007; Isaac et al., 2024).
Characterizing plant populations by their functional traits rather than their taxonomic identities, trait-based ecology reduces the vast array of species to a more manageable set of variables. These functional traits, measurable in plants from different species, allow setting common scales to compare species and their ecological functions (Cadotte, 2011). The traits of individuals can be analyzed at a community level through functional diversity, which is the value and range of functional traits of organisms in a given ecosystem (Tilman, 2001). This framework makes it possible to quantify and analyze interspecific and intraspecific species interactions and the associated community ecological processes, such as resource exploration, resource complementarity, ecological redundancy and competition (Tilman, 2001; Díaz et al., 2007; Violle et al., 2007; Martin and Isaac, 2015; Isaac et al., 2024). Focusing on ecological processes from interconnected components in a system, functional diversity contributes to disentangling the chain of interactions that result from multiple species consortiums in AFS (Martin and Isaac, 2015, 2018; Sauvadet et al., 2020b; Sauvadet et al., 2020a; Addo-Danso et al., 2024).
The trait-based ecology approach also can be applied to analyze the relationship between community compositions and ecosystem services in agroecosystems. Since plant functional diversity is linked to ecological processes, it consequently affects ecosystem properties and services (Díaz et al., 2007). For instance, functional diversity in AFS has been associated with microclimate regulation (Gagliardi et al., 2021), pathogen incidence (Avelino et al., 2023), soil fertility (Sauvadet et al., 2020b; Sauvadet et al., 2020a; Addo-Danso et al., 2024), and soil biological health (Moço et al., 2010). Yet, little work has explored how tree trait diversity in AFS affects system multifunctionality, particularly its influence on supporting, regulating, and provisioning ecosystem services, and how much trait diversity is needed to achieve these outcomes. Exploring these relationships is increasingly important in the current context, where biodiversity conservation and climate change mitigation are part of the global agenda, and AFS are being promoted for its potential to delivery ecosystem services (Terasaki Hart et al., 2023; Orozco-Aguilar et al., 2024).
Costa Rica is one of the most extensively studied tropical regions in the field of agroforestry (Somarriba et al., 2001; Nair et al., 2021), with research primarily focusing on traditional variables, including structural and compositional aspects such as canopy cover, tree density, species diversity, provision of goods, among others (Deheuvels et al., 2012; Ngo Bieng et al., 2013; Cerda et al., 2014). Although functional diversity has gained recognition for its role in understanding agroforestry systems, it remains underexplored in Costa Rican contexts. Applying the trait-based ecology approach could advance the objectives of the Cocoa National Plan for 2018–2028 (Comisión Interinstitucional de Cacao, 2018), which seeks to enhance Costa Rica’s cocoa production through sustainable practices, including the adoption of improved cocoa varieties and shade trees that deliver critical ecosystem services.
This research quantified and characterized the functional diversity and key ecosystem services of cocoa AFS across a gradient of ecological complexity, from simple to highly biodiverse systems. Furthermore, we analyzed the effect of functional diversity on the delivery of ecosystem services of provisioning (yield of cocoa and other products), regulation (carbon storage), and support (soil fertility) to better elucidate the critical relationship between shade tree traits and AFS functioning.
2 Materials and methods
2.1 Study site and sampling strategy
The research was conducted in 30 AFS distributed in the central and southern Caribbean region of Costa Rica, between 9° 30’ N and 10° 8’ N, and 82° 34’ W and 83° 21’ W, an area characterized by average temperatures ranging from 21°C to 31°C (Solano, 1996). Annual precipitation in this region varies between 2,470 and 3,844 mm, which characterizes it as a tropical rainforest climate (Solano, 1996). In this region, most cocoa is grown in AFS, under the canopy of shade trees and intercropped with banana trees and annual crops (Somarriba et al., 2003; Deheuvels et al., 2012). The AFS types in this region vary widely, from multi-strata, highly diverse systems established from seed to more simple and intensive production systems that utilize improved cocoa varieties (Cerda Bustillos et al., 2013).
To analyze the effect of functional diversity on ecosystem services along a gradient of ecological complexity, cocoa AFS plots (n = 30) with different species richness values, a traditional biodiversity proxy (Moreno-Mateos et al., 2020), were selected. Species richness is correlated with functional diversity (Lawton et al., 1998; Naeem, 2002; Tilman, 1999) and can be visually estimated when comparing AFS with contrasting conditions, facilitating the selection of plots for functional diversity analysis. Therefore, to capture a potential gradient of functional diversity, the selected plots included AFS with a range of species richness, from relatively low to high shade tree diversity, based on the species composition observed in contemporary cocoa farms using clonal cocoa varieties within the study area (Figure 1). The cocoa clones grown across the sampled AFS were those recommended by CATIE (Phillips-Mora et al., 2013) and are widely cultivated in the region, namely: CATIE-R1, CATIE-R4, CATIE-R6, CC-137, ICS-95 T1, PMCT-58, and IMC-67 (Figure 2).
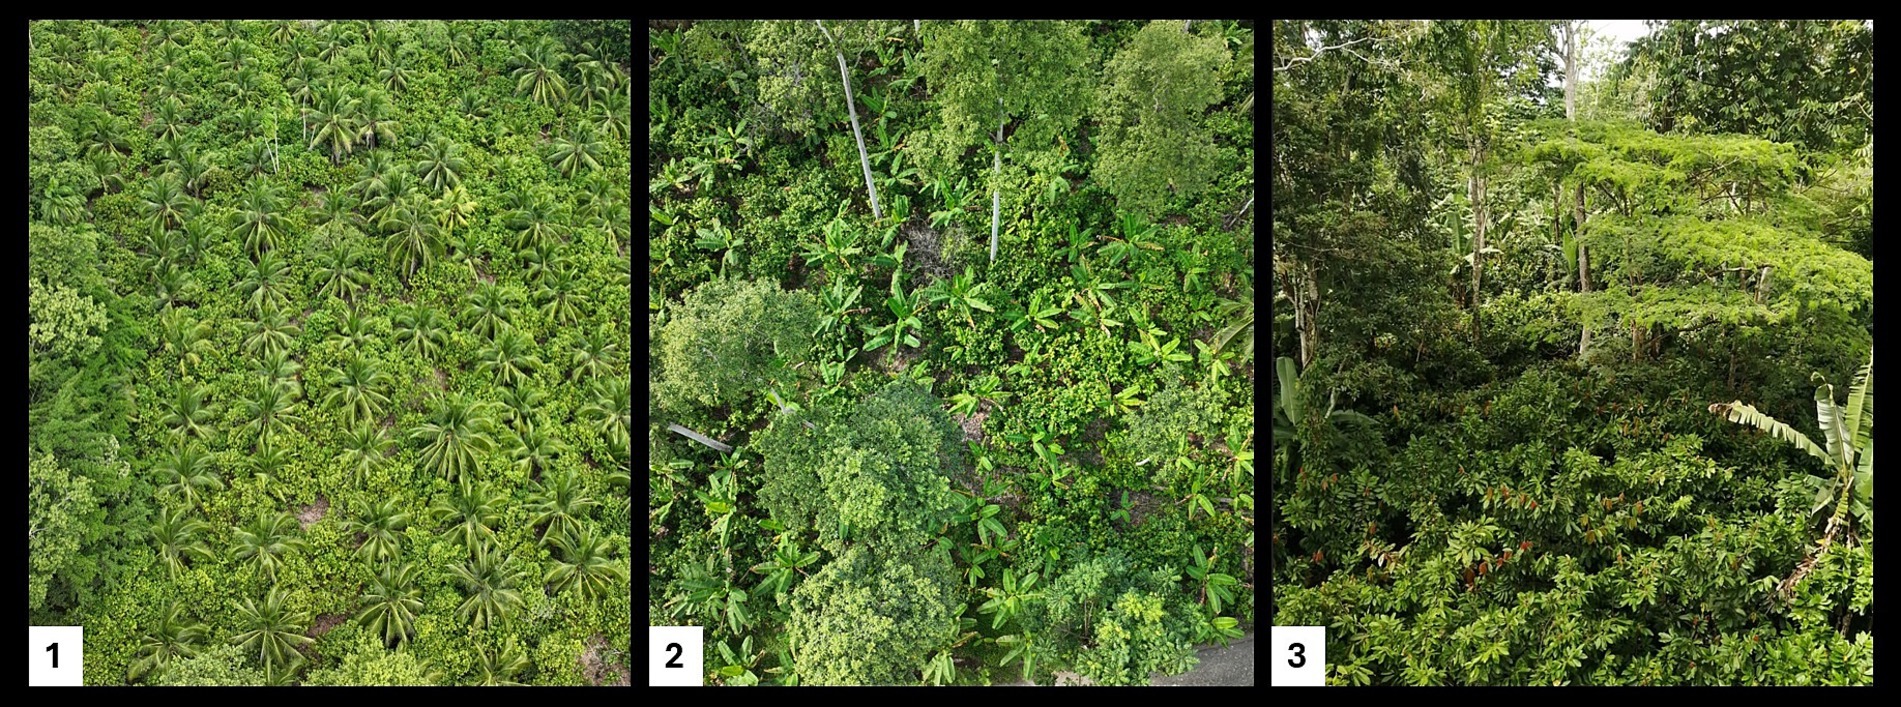
Figure 1. Examples of sampled agroforestry systems (AFS) representing different levels of ecological complexity: (1) low, (2) medium, and (3) high. Pictures 1 and 2 by Jimmy Medina (Ministry of Agriculture of Costa Rica); picture 3 by Leonel Coto (CATIE).
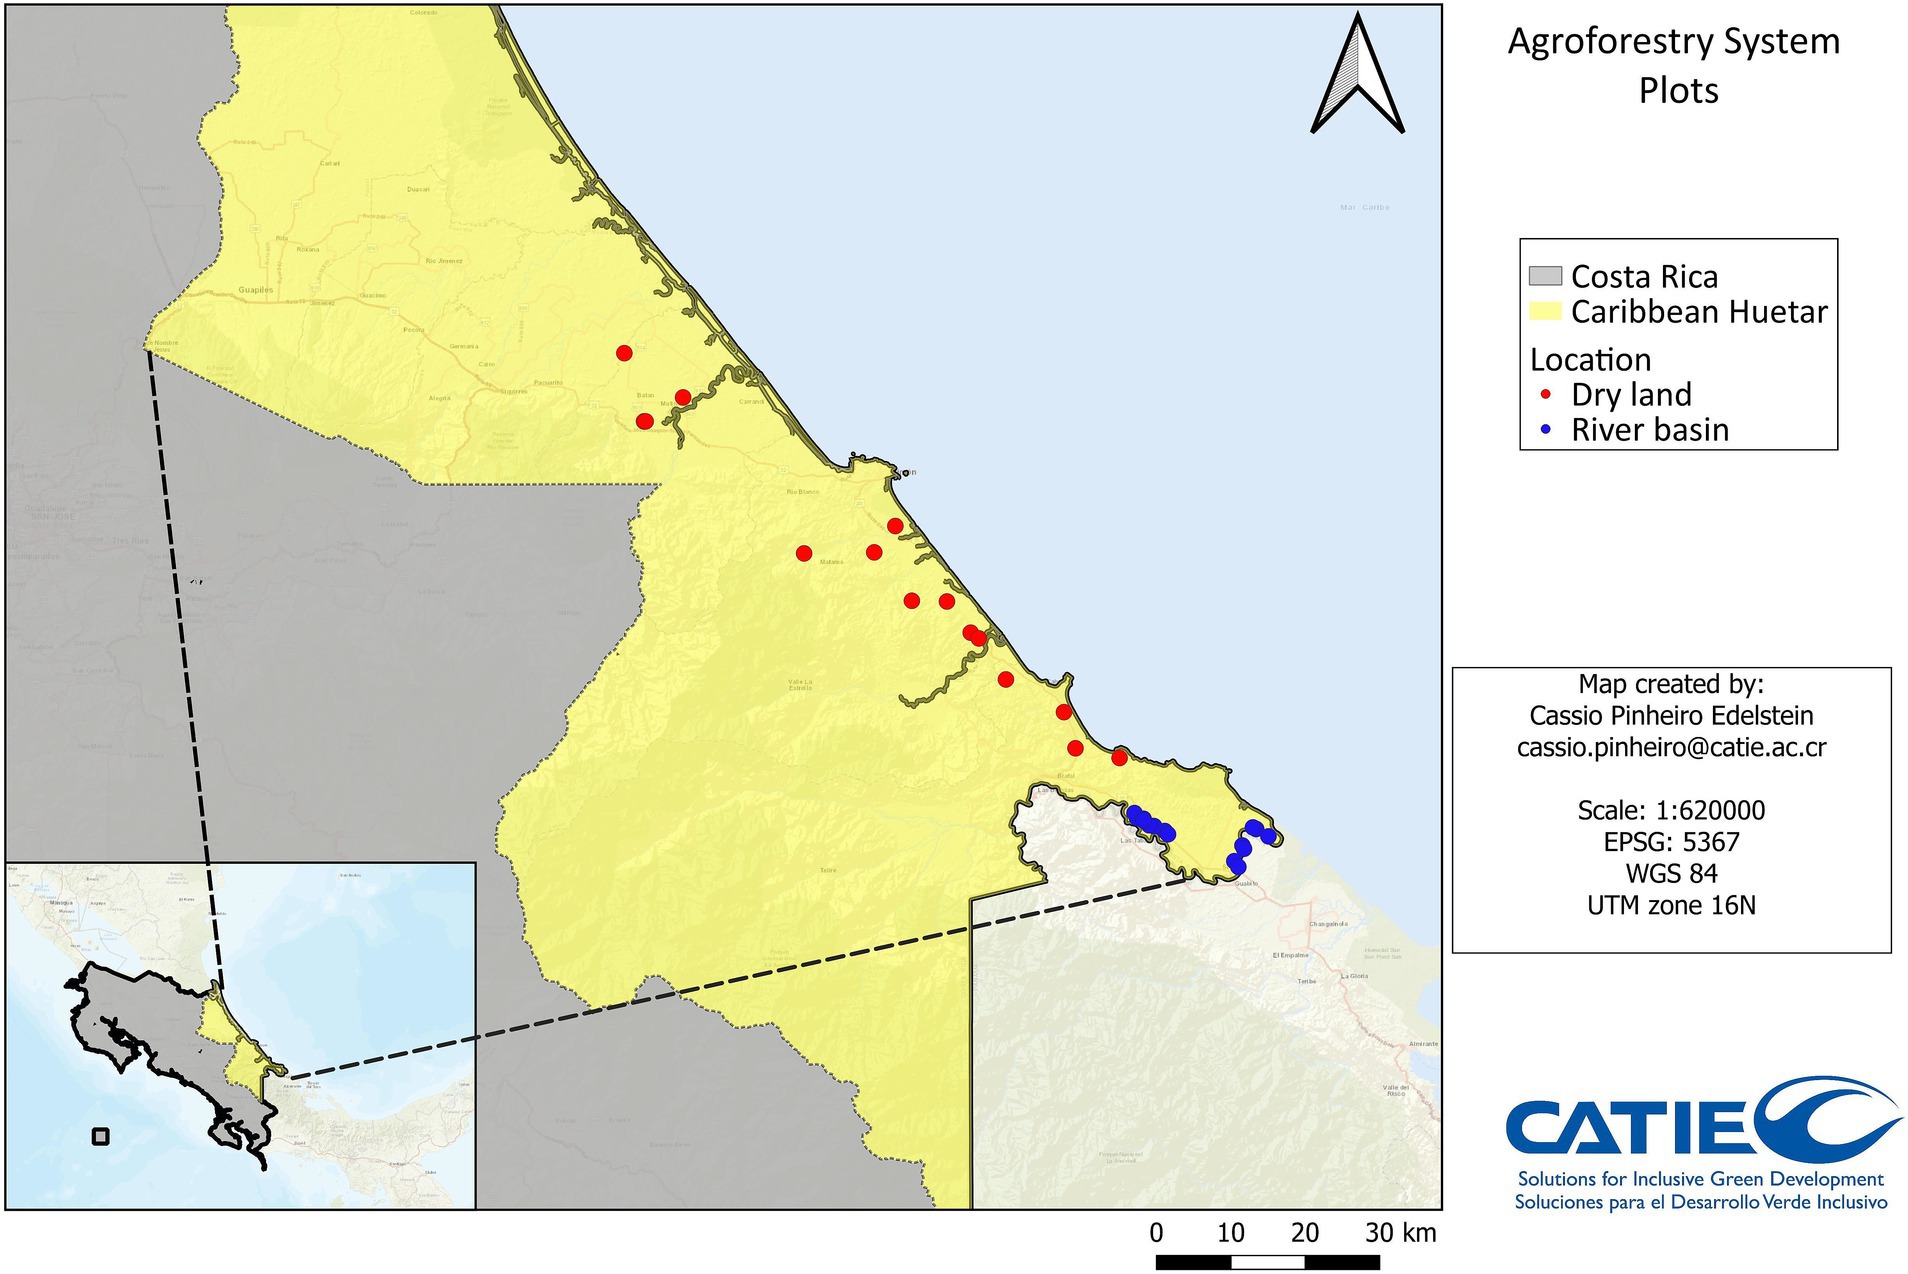
Figure 2. Distribution of the 30 agroforestry systems (AFS) plots in Caribbean Huetar region of Costa Rica. Blue dots indicate plots in the Sixaola river basin and red dots indicate plots outside the Sixaola river basin.
We used the 2020–2021 cocoa census data from Costa Rica (Ministerio de Agricultura y Ganadería de Costa Rica (MAG), 2021) to identify farms that met the selection criteria, and we further refined the selection process by employing a chain referral sampling method, consulting with the technical staff of the Ministry of Agriculture. Sampled plot consisted of 30 farms meeting the following criteria: (a) being outside indigenous territories; (b) solely AFS (no monocultures); (c) plantation age of 5–15 years; (d) having clonal cocoa varieties; (f) practiced at least one annual pruning; (g) recorded a minimum yield of 100 kg ha−1 year−1; (h) having a minimum density of 30 shade trees per hectare.
This methodical selection ensured that the farms shared consistent management practices and agroforestry conditions, thereby minimizing confounding variables. These standardized criteria allowed for a robust comparative analysis of cocoa production systems across the sampled AFS.
2.2 Data collection
In each AFS, a 1,000 m2 plot (20×50 m) was established to inventory and characterize the diversity and structure of the targeted AFS. Plots were divided into four 250 m2 subplots for soil and shade measurements, ensuring well-distributed data collection.
2.2.1 Plant inventory
All woody perennial individuals with a diameter at breast height (DBH) ≥ 5 cm were identified and measured for both commercial bole height and total height (m). All cocoa trees and banana stems were counted, and representative samples (10 cocoa trees and up to 10 banana stems) were randomly selected and measured (total height, DBH for banana, and diameter at 30 cm for cocoa). These measurements were used to calculate species richness, species abundance, functional diversity indices, and carbon stocks.
Canopy cover was measured using the HabitApp mobile application (Farfán, 2014) by taking one upward-facing picture per subplot at the center, 3 m above the ground, above the cocoa canopy. Average shade cover for each plot was calculated from the four subplot images.
2.2.2 Soil sampling
Soil texture and fertility data were collected using composite samples from each subplot at a depth of 5–20 cm. Sampling locations were determined based on the following criteria: (1) an intermediate distance between the trunk and canopy edge of the most dominant shade species, comprising approximately 80% of the tree biomass in the plot (Garnier et al., 2004); (2) 1 m away from the base of a cocoa trunk; and (3) an area with relatively low tree canopy cover (adapted from Sauvadet et al., 2020b; Sauvadet et al., 2020a).
Samples were dried at 40°C for 48 h, sieved (2 mm for most analyses; 0.25 mm for nitrogen (N) and soil organic carbon (SOC)), and analyzed for N and SOC concentrations using the combustion method. Phosphorus (P) and potassium (K) concentrations were determined using the Olsen method (Olsen et al., 1954), while calcium (Ca), magnesium (Mg), and soil pH were assessed using 1 N potassium chloride solution and the water method, respectively. Soil texture was determined using the hydrometer method (Bouyoucos, 1962).
2.2.3 Farmers interview
Semi-structured interviews were applied to farmers to capture data on plantation age (years), area (ha), and estimated cocoa production (kg.ha−1.year−1). Since most farmers did not keep records of annual production, yield was estimated indirectly by asking about their typical productivity patterns.
Farmers were asked to estimate:
1. The number of months with high productivity (HP) and low productivity (LP).
2. The average number of harvest days per month during HP and LP periods.
3. The average cocoa yield per harvest day during each productivity period.
Based on this information, cocoa production during LP (Equation 1) and HP months (Equation 2) were estimated to determine the annual cocoa productivity (Equation 3):
The conversion factor of 1/3 was applied to account for the typical ratio of fresh to dry cocoa beans (Lachenaud et al., 2007).
2.2.4 Functional diversity characterization
We assessed nine functional traits: maximum vegetative height (Hmax, m); leaf area (LA, mm2); specific leaf area (SLA, mm2 mg−1); leaf mass per area (LMA, mg mm−2); leaf dry matter content (LDMC, mg g−1); leaf nitrogen concentration (LNC, mg g−1); leaf phosphorus concentration (LPC, mg g−1), leaf nitrogen and phosphorus concentration ratio (N:P, unitless); specific stem density (SSD, g cm−3). These traits were selected due to their documented links to key ecosystem services targeted in this research—plant productivity, nutrient cycling, and carbon stocks (Cornelissen et al., 2003; Díaz et al., 2007; Finegan et al., 2015; Pérez-Harguindeguy et al., 2013).
Leaf traits (LA, SLA, LMA, LDMC) were measured on 25 sun-exposed leaves collected from two branches of each of five mature trees across various locations in the study area, following the guidelines of Pérez-Harguindeguy et al. (2013). SSD for Musaceae stems was determined using the water displacement method adapted from Pérez-Harguindeguy et al. (2013), and Hmax was averaged from the five tallest stems recorded in the inventory (Pérez-Harguindeguy et al., 2013). The functional trait values measured using these methods are detailed in Appendix 1.
Trait values for Hmax, SSD, LNC, LPC, and N:P were supplemented with data from bibliographic sources and databases (Henry et al., 2013; Kattge et al., 2011; Orwa et al., 2009; Sousa et al., 2017; Sousa et al., 2019). To ensure reliability, bibliographic data were included only if they met specific criteria: traits were documented at the species level, published in peer-reviewed journals or academic theses, and ideally sourced from studies conducted in the same climate zone (humid tropics). In cases where species-specific data were unavailable, genus-level values or data from similar climates were used. If no other data met these criteria, unpublished information from online trait databases was considered as a last resort (Kattge et al., 2011). The functional trait values obtained through these methods and assigned to each of the dominant species are detailed in Appendix 2.
2.3 Data analysis
2.3.1 Calculation of functional indices
The functional diversity of sampled AFS was quantified using single-trait and multi-trait indices, reflecting different aspects of ecosystem functional diversity. The single-trait functional metric used was the Community Weighted Mean (CWM), while the multi-trait indices were functional dispersion (FDis) and quadratic Rao (RaoQ).
For all the species inventoried within AFS, only those species comprising 80% of the total basal area in each plot were considered dominant (Garnier et al., 2004). According to the Mass Ratio Hypothesis, dominant species strongly influence ecosystem properties through their functional traits (Grime, 1998). To express species’ influence, the functional indices formulas were weighted by the relative basal area of the respective species population. This measure was chosen over relative abundance to avoid overestimating the impact of highly dense, low-biomass species (e.g., cocoa) and underestimating low-density, high biomass species (e.g., shade trees).
The CWM reveals the communities’ dominant functional trait values and helps to elucidate the mechanisms driving ecosystem services (Díaz et al., 2007; Finegan et al., 2015; Garnier et al., 2004; Violle et al., 2007). The CWM is calculated for each trait in each plot using Equation 4, which involves multiplying the trait value (X) of each dominant species (i) by its relative basal area (RBA) within the plot.
The multi-trait indices FDis and Rao’s Q contribute to understanding the relationship between plant communities and ecosystem properties by examining functional trait variability (Laliberté and Legendre, 2010). The niche complementarity hypothesis suggests that functional trait variability within a community is linked to the differentiation of ecological strategies and the range of niches explored within the community, processes that influence ecosystem properties differently (Díaz et al., 2011). FDis and Rao’s Q can be calculated for low-diversity ecosystems, which is necessary for comparing the simple AFS considered in this study. The difference between these two indices is that while Rao’s Q is influenced by species richness or the number of significantly different traits, FDis is not affected by species richness, but by the addition of significantly different new traits. Both, the CWM and multi-trait indices were calculated using the FD package in R.
2.3.2 Quantification of ecosystem services
The provisioning service was quantified by cocoa productivity (kg ha−1 year−1). Additionally, the potential provisioning capacity of the AFS was estimated by combining cocoa productivity with the potential production of commercial timber and fruits (including banana and plantain), calculated based on the tree densitiy (individuals ha−1) of these species. These measures were considered representative of AFS provisioning, as the densities of exploitable species potentially impact income diversification, gross income, and contribute to household consumption (Cerda et al., 2014). The combination of cocoa productivity (kg ha−1 year−1) with fruit and timber densities (trees ha−1) was accomplished by applying Equations 5, 6, following the methodology of Kearney et al. (2019).
The climate regulation service considered here was the aboveground carbon (Mg ha−1) stored in trees, encompassing all shade trees, Musaceae, and cocoa. Aboveground carbon stocks were estimated by applying tree measurements (DBH and total height) obtained in the field, together with wood densities values from existing databases (Zanne et al., 2009; Kattge et al., 2020), and factored into allometric equations (Appendix 3). The resulting aboveground biomass was converted into carbon stock by applying a carbon fraction of 0.47 (Intergovernmental Panel on Climate Change (IPCC), 2006).
The support service assessed here was soil fertility, measured from collected soil samples from each plot, which were further analyzed for nitrogen (N), phosphorus (P), potassium (K), acidity, and soil organic carbon (SOC). A Composite Soil Fertility Index, representing the overall fertility condition of each AFS was calculated by (1) converting acidity to its inverse value with Inverse Acidity = 1 – Acidity; (2) standardizing N, P, K, and inverse acidity from 0 to 1; (3) adding all the variables. This Composite Soil Fertility Index was deemed satisfactory as it showed a significant relationship with cocoa productivity in linear regression analysis (p-value = 0.0443; α = 0.05).
2.3.2.1 Multiple environmental service index
To simultaneously assess multiple environmental services, the three ecosystem services—carbon stocks, provisioning, and soil fertility—were combined into a composite index, following Kearney et al. (2019). The first step taken in the process was to standardize all environmental service indicator values to a range of 0.1 to 1 (Equation 5).
Where Yi is the score of the variable i, αi is the original value, ai is the maximum, and bi is the minimum observed value.
For environmental services composed of elements from different units, composite scores were calculated by standardizing each element of the respective environmental service and adding them up after multiplying by a PCA-derived weighting factors, its respective eigenvectors (Equation 6):
Where CI is the composite index, Yi is the standardized value from Equation 5, and Wi is the PCA weighting factor.
Finally, the Composite Index (CI) is standardized again using Equation 5, and the scores from the three ecosystem service categories are summed.
2.4 Statistical analysis
2.4.1 Characterization of cocoa AFS along a gradient of complexity
To characterize functional diversity in AFS across a gradient of ecological complexity, the 30 AFS plots were grouped based on species richness using cluster analysis (Ward’s method, with Euclidean distances). This analysis categorized the farms into groups of low, medium, and high ecological complexity. The low complexity group comprised 8 farms with shade tree diversity ranging from 1 to 2 species; the medium complexity group, contained 17 farms with shade tree diversity ranging from 3 to 8 species; and the high complexity group, included 5 farms with shade tree diversity ranging from 9 to 13 species.
Subsequently, the general AFS structure and botanic composition, the ecosystem services, and the functional diversity indices were characterized for each AFS group. These variables were compared among the groups using variance analysis (ANOVA), with Extended and Mixed Linear Models for continuous variables, and with Generalized Linear and Mixed Effect Models for count variables, applying the Fisher’s LSD post-hoc test (α = 0.05).
2.4.2 Relationship between functional diversity and ecosystem services
Multiple regressions were performed to evaluate the relationship between functional diversity and key ecosystem services. The dependent variables in the regression models were carbon stocks, cocoa yield, soil organic carbon (SOC), soil nitrogen (N), phosphorus (P), potassium (K), the Composite Soil Fertility Index, and the Multiple Ecosystem Service Index. The explanatory variables consisted of computed functional diversity indices (CWMs and multi-trait functional indices). In addition, for the carbon stock model, soil parameters (N, P, K, acidity, and soil texture) were also included as explanatory variables. Similarly, the cocoa productivity model included the same soil parameters and canopy cover. For the soil fertility ecosystem services and the Multiple Ecosystem Service Index models, soil texture was also included as an explanatory variable.
To account for different measurement scales, all variables were normalized from 0 to 1. Quadratic terms were included for all independent variables. Given that the plots were in two contrasting areas—within the Sixaola River basin, where they are susceptible to flood events, and outside the basin, where floods are unlikely—the models accounted for location effects to control for this variation.
The regression models were refined through a two-step procedure. First, because the number of explanatory variables (Table 1) exceeded the number of observations, a forward selection method was employed to reduce the number of variables by retaining only the significant variables (α = 0.05) using the “forward.sel” function from the “adespatial” package in R Software. To account for the location effect, a location indicator variable was included as an explanatory variable. Second, a linear mixed model was fitted with the selected explanatory variables using Infostat, incorporating the location as a random effect. Multicollinearity among parameters was assessed using Variance Inflation Factors (VIF > 10) and by removing collinear variables. To account for heteroscedasticity, the varExp function was employed, and appropriate transformations were applied to ensure normality. Since this research intended to explore the relationships between functional diversity and ecosystem services, but not defining predictive models, the final model retained only significant variables (α = 0.05). Different candidate models were compared using the Akaike Information Criterion (AIC) to select the best-fitting model.
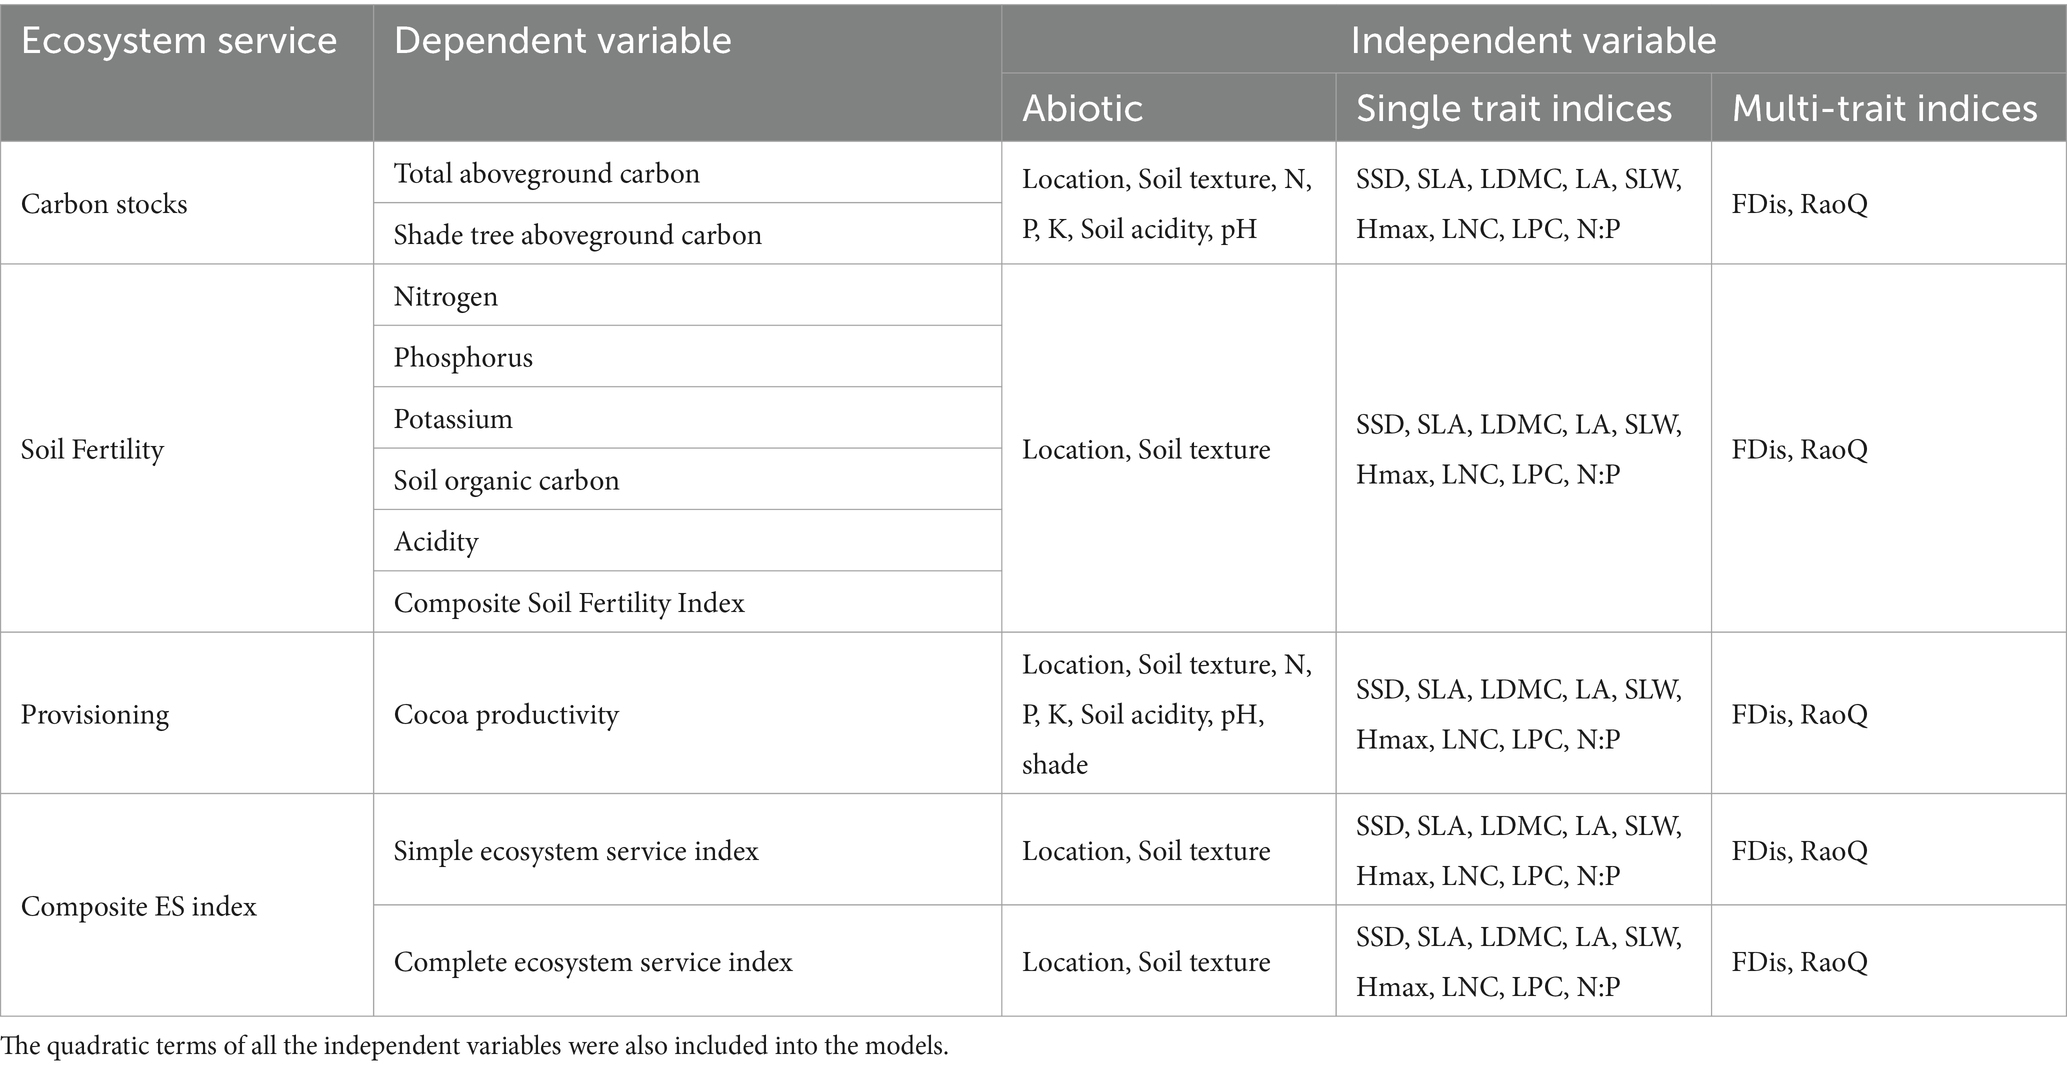
Table 1. Variables included in the multiple regression models.
3 Results
3.1 General characterization
Forty-five tree species, including cocoa and non-tree plants such as banana/plantain, coconut, and peach palm, were identified in the 30 AFS plots, with 28 of these species were dominant based on the Mass Ratio Hypothesis. Most species identified were useful for farmers, with commercial uses for timber or fruits, and seven leguminous tree species. Twelve non-commercial value tree species, were also recorded (Appendix 4). The most frequent shade tree were Cordia alliodora, Musaceae, Nephelium lappaceum, Bactris gasipaes, Cedrela odorata, Cocos nucifera, Hieronyma alchornoides and Persea americana. The dominant shade tree species varied across the AFS according to the ecological complexity (Appendix 5).
Regarding the structural features of the AFS groups, shade cover, trees basal area and tree densities—except of cocoa tree density—followed the same pattern of the ecological complexity gradient as described by species richness, increasing from the low-complexity group to the high-complexity group (Table 2).
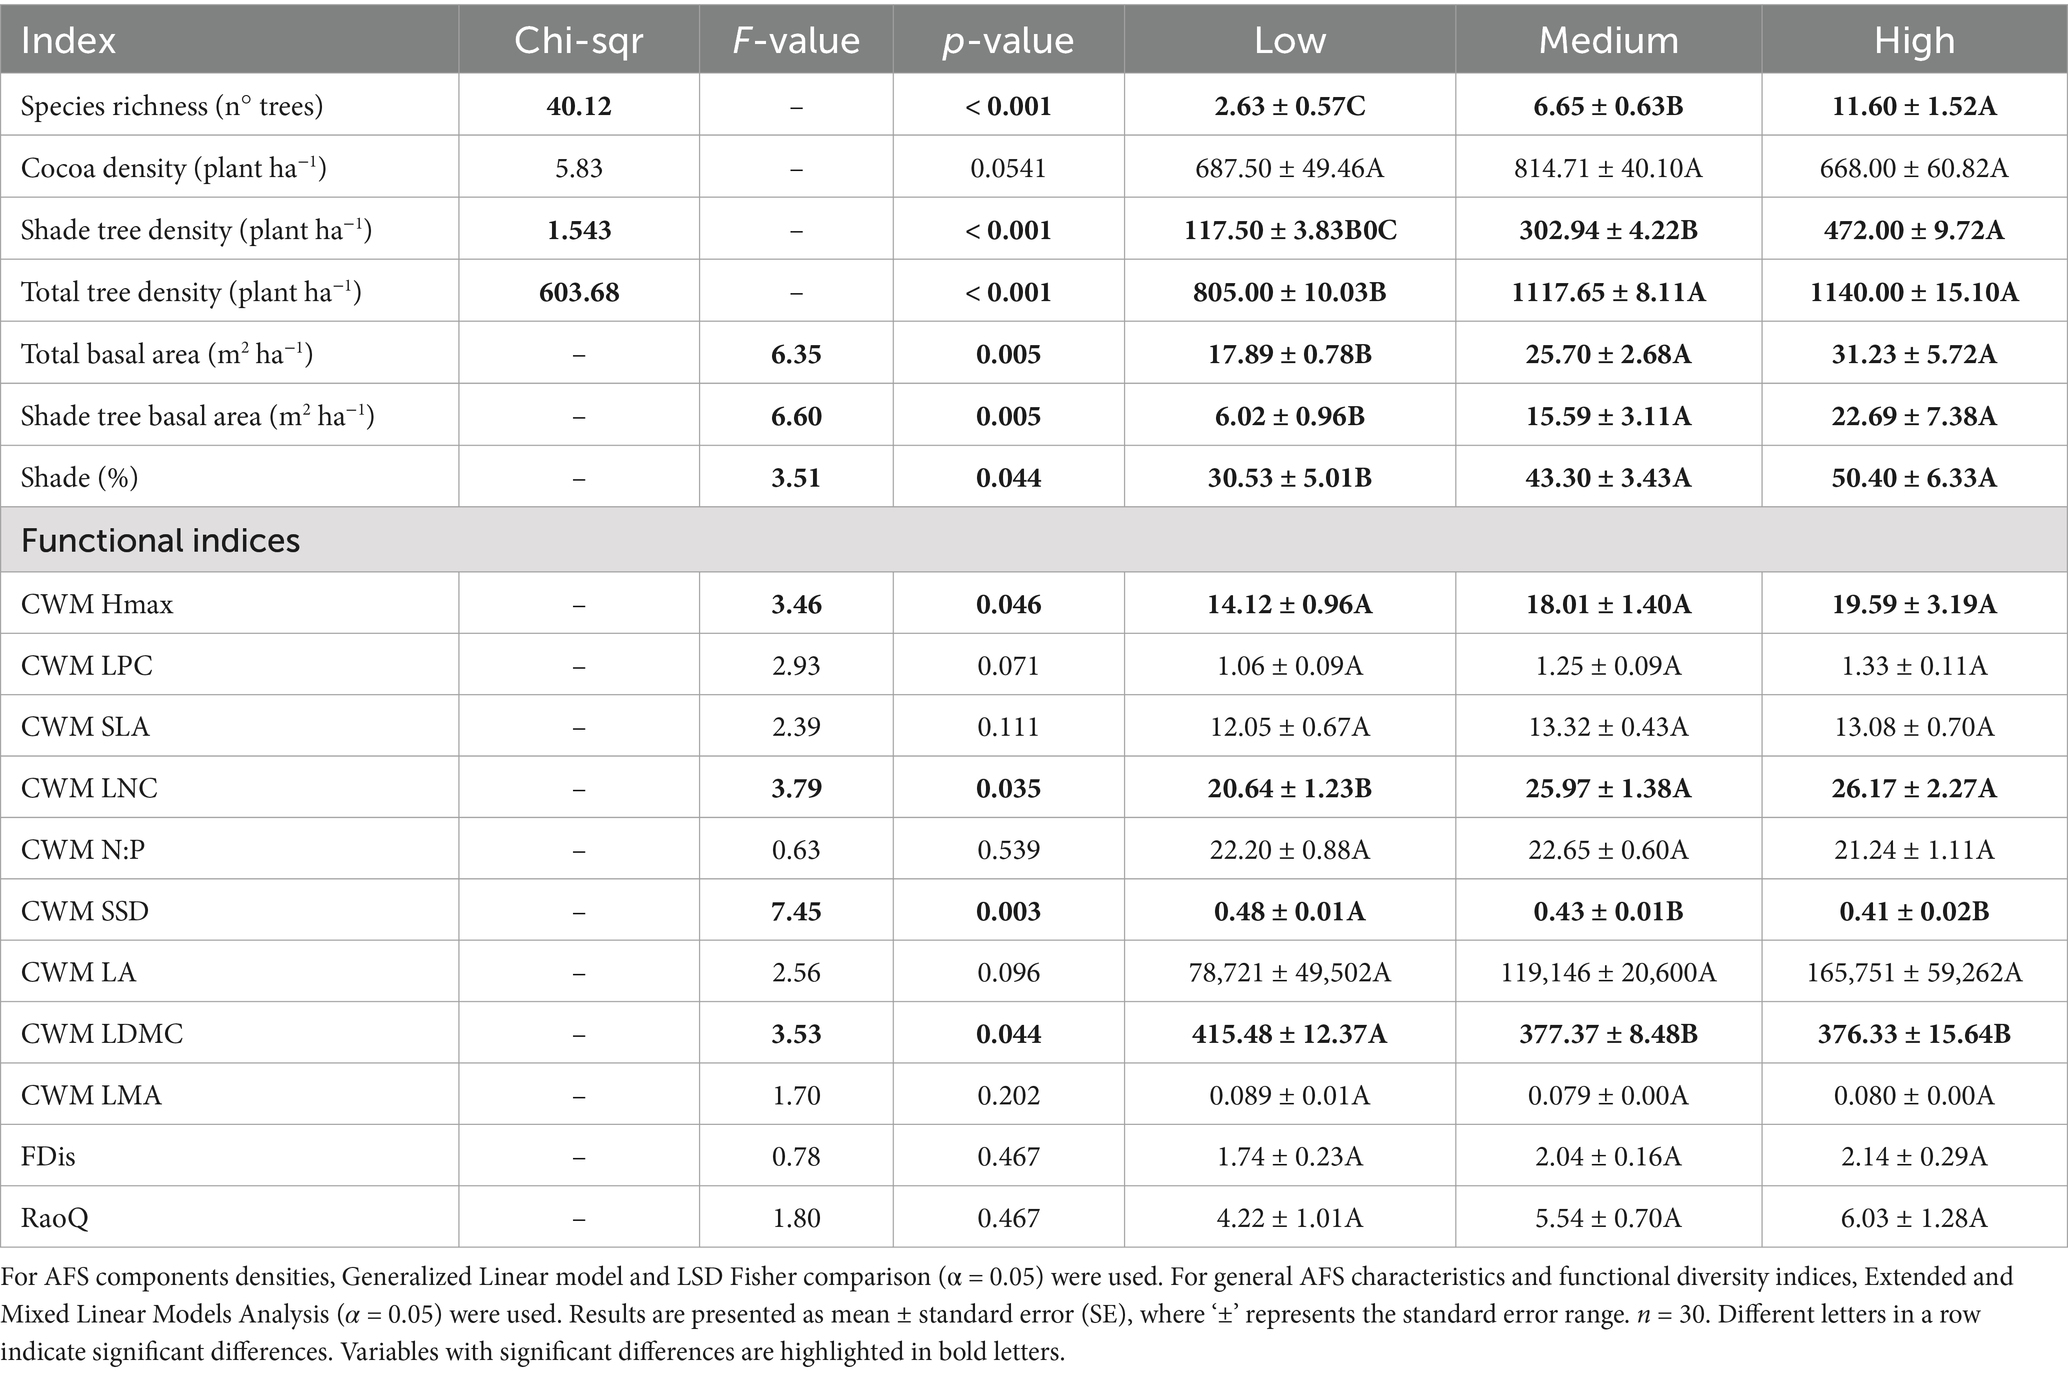
Table 2. Comparison across ecological complexity agroforestry system (AFS) groups.
3.2 Characterization of functional traits
The dominant species identified in the AFS were separated into six Plant Functional Types (PFT). Two PFT of non-tree plants were defined a priori due to their distinct phylogenetics from dicot trees: the Arecaceae, composed by Bactris gasipaes (peach palm) and Cocos nucifera (coconut), and the Musaceae, composed by Musa acuminata (cavendish banana) and Musa paradisiaca (plantain). The remaining species were subjected to a cluster analysis based on the leaf traits SLA, LMA, LNC, LPC, NP, and LDMC, resulting in three additional PFT (Figure 3). The PFT were satisfied by a MANOVA, with significant differences between all the groups (p < 0.0001).
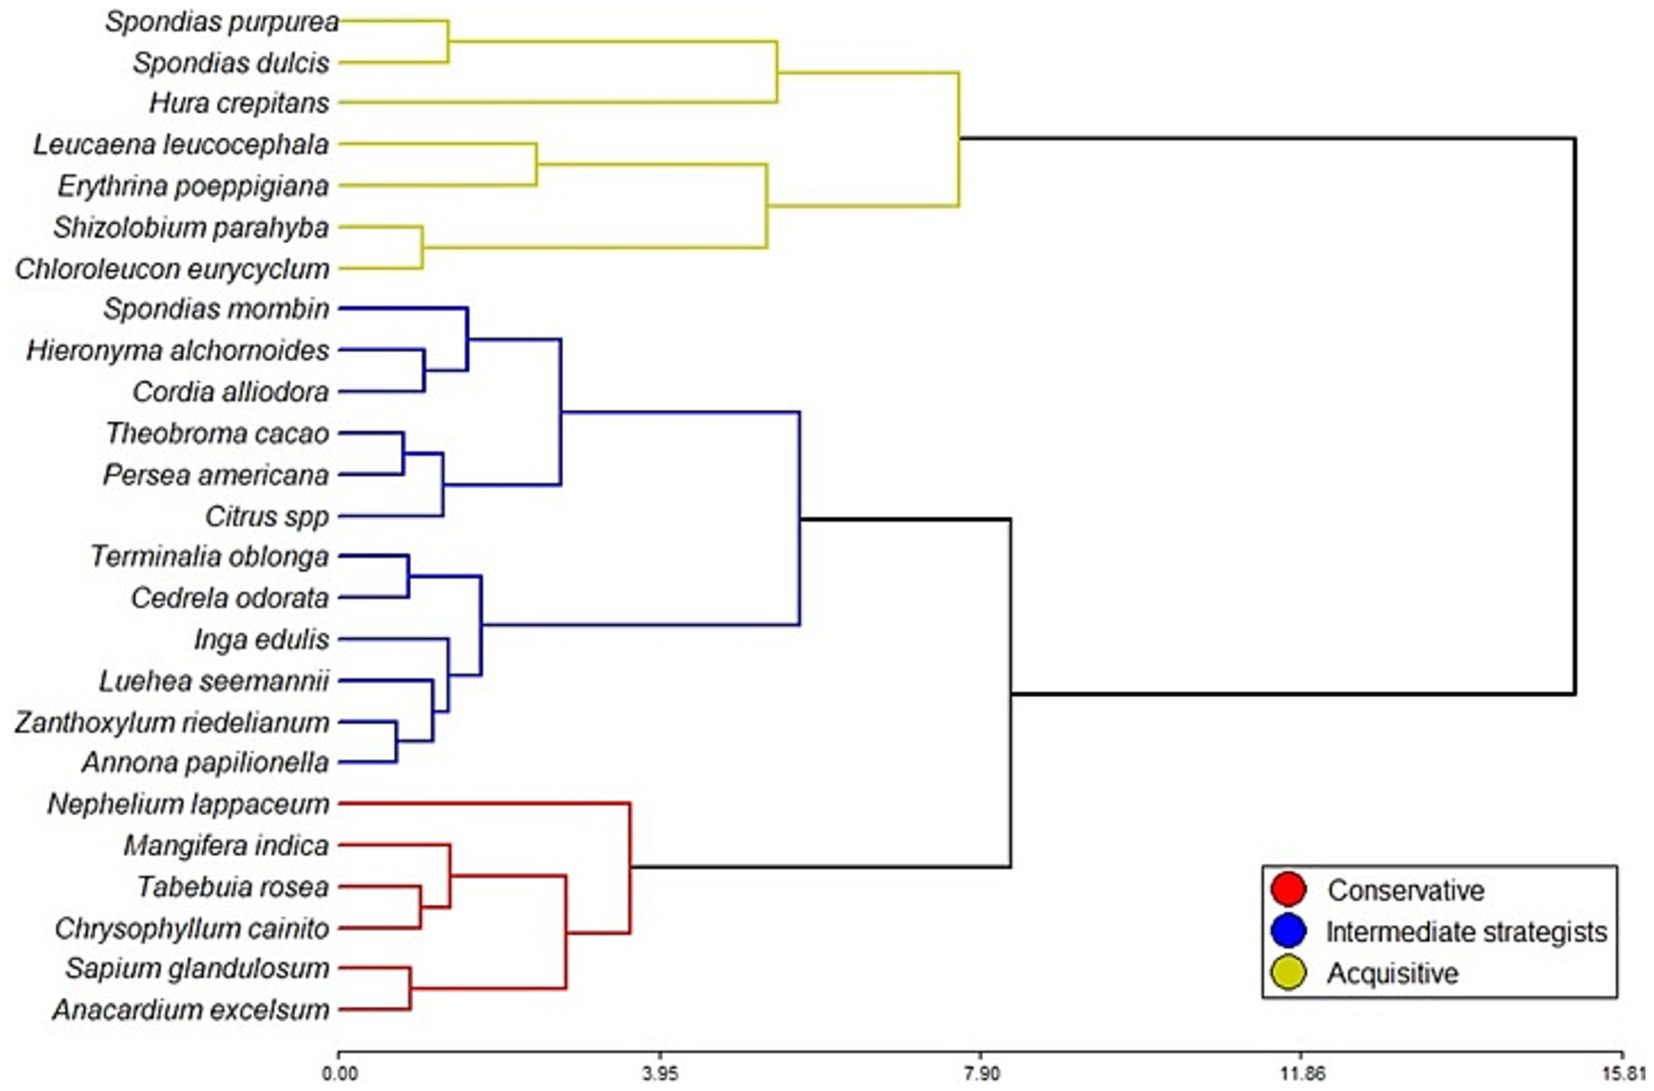
Figure 3. Plant Functional Types (PFT), formed with Cluster analysis using the Ward method and Euclidian distances. The clustering was based on the Community Weighted Mean (CWM) of Specific Leaf Area (SLA), Leaf Mass per Area (LMA), Leaf Nitrogen Concentration (LNC), Leaf Phosphorus Concentration (LPC), Leaf Nitrogen-Phosphorus Ratio (N:P) and Leaf Dry Matter Content (LDMC) from the 28 dominant species.
PFT were well distributed along the plant economic spectrum (Figure 4), reflecting different ecological strategies among them. Most of the differences between species were attributed to SLA, LNC, N ratio, LDMC, LMA, LA, and SSD (PC1), supporting the hypothesis that leaf traits are crucial for assessing plant ecological strategies (Wright et al., 2004). Additionally, species differences were explained by LPC, LA, N:P ratio and, most notably, by Hmax and SSD (PC 2), confirming that whole-plant traits contribute significantly to evaluate plant ecological strategies (Reich, 2014).
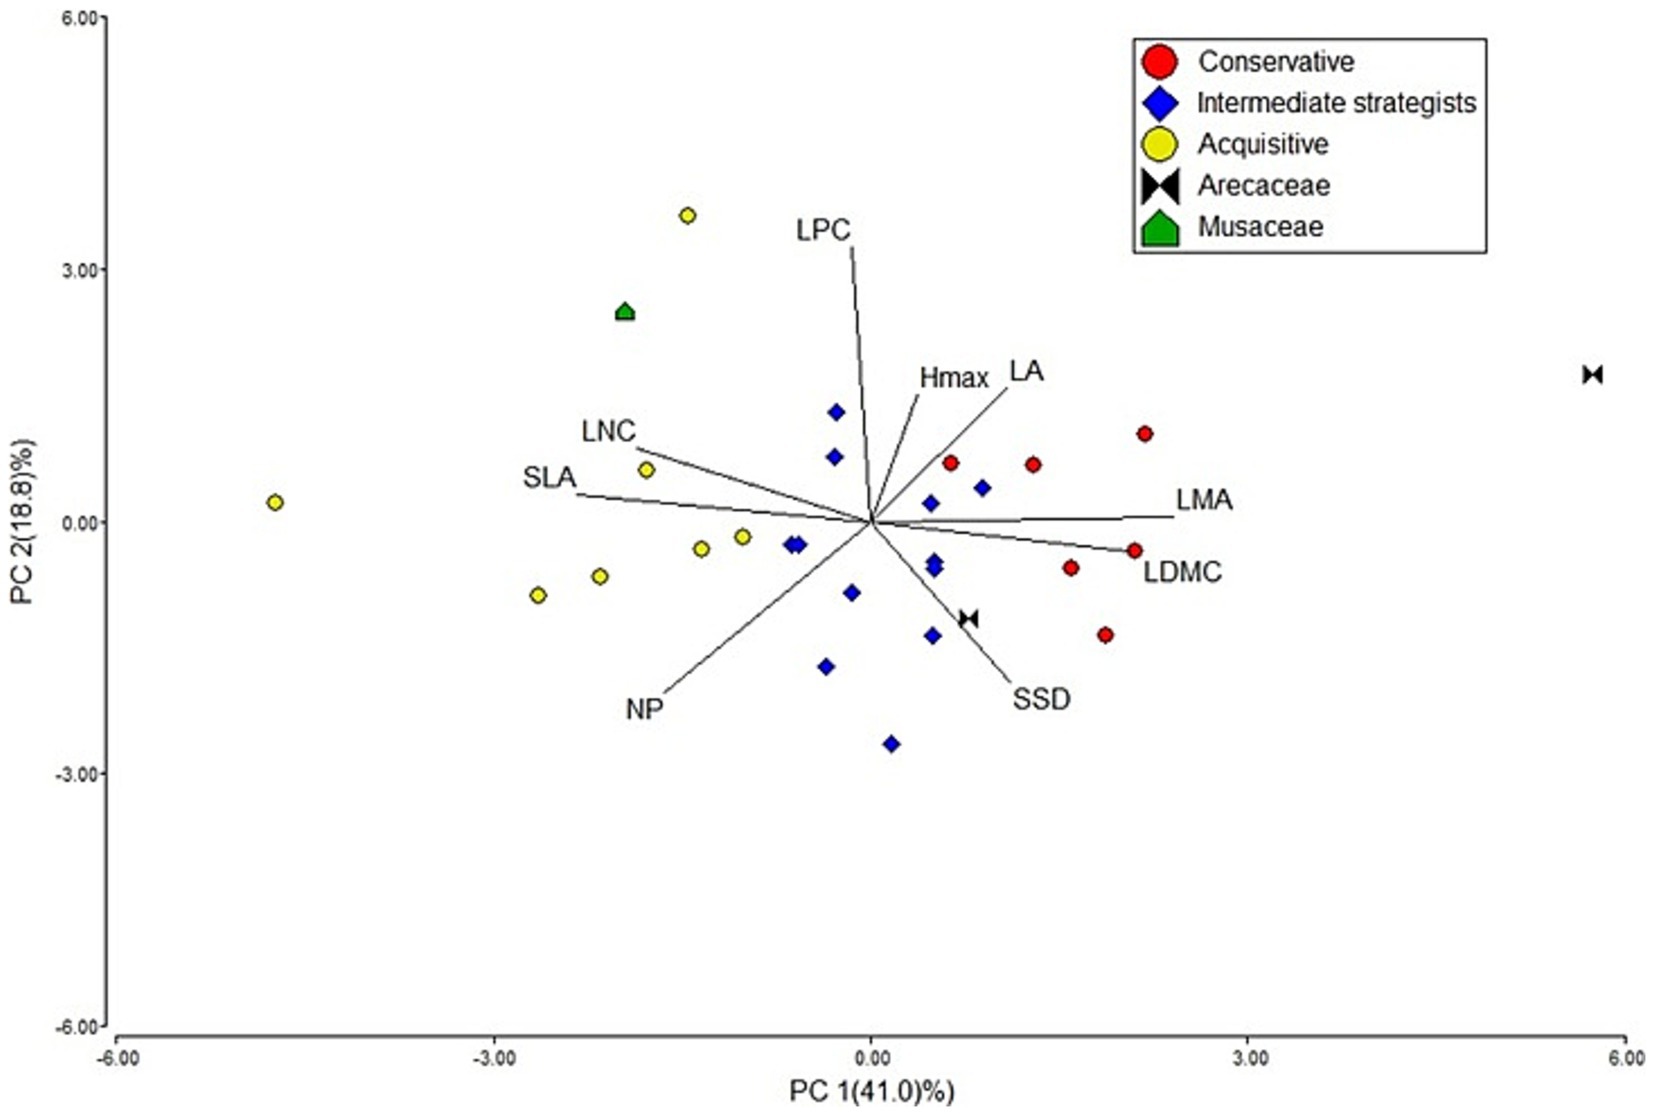
Figure 4. Plant economic spectrum of the dominant agroforestry systems (AFS) species in a Principal Component Analysis. The leaf economic spectrum is represented by the first axis, in which leaf traits hold the greatest loadings. The Plant Functional Types (PFT) are identified in the caption.
The species on the negative side of PC1 were associated with acquisitive traits, with leguminous trees being well-represented in this PFT. On the opposite side of PC1 were species linked to conservative traits. Intermediate strategists were more concentrated near the center of the PCA and exhibited higher LPC values, primarily due to the presence of Theobroma cacao, Citrus spp., and Persea americana.
3.3 Functional diversity characterization
The CWM of LNC, SSD, and LDMC were significantly different between the AFS groups (p-value <0.05), with inferior values for the low ecological complexity AFS compared to the medium and high-complexity AFS. The low-complexity AFS exhibited conservative traits, which are typically associated with slow plant growth and slow leaf litter decomposition, due to a low LNC and high SSD and LDMC (Garnier et al., 2004; Finegan et al., 2015). The medium and high-complexity AFS exhibited acquisitive traits, linked to fast growth and fast decomposition rates, attributed to the higher LNC and low SSD and LDMC (Garnier et al., 2004; Finegan et al., 2015). Additionally, the CWM Hmax was significantly different among groups in the ANOVA test; however, the Fisher’s LSD posthoc test did not find any significant differences, which might be explanined by the small sample size and high variability within the groups. CWM LPC, SLA, LMA, LA were not significantly different among groups.
The multi-trait indices, FDis and RaoQ, were not significantly different among the AFS groups. It was expected that higher ecological complexity would lead to a wider range of traits, resulting in higher FDis and RaoQ values. However, the extensive variability of these indices within the AFS groups prevented the confirmation of clear patterns
3.4 Characterization of ecosystem services
3.4.1 Provisioning: cocoa yield and other AFS products
Cocoa yields were significantly different among AFS groups (p-value <0.05; Table 3). The low-complexity group had the highest cocoa yield, while the medium and high-complexity groups produced relatively less. The high-complexity group exhibited the lowest average yield but also had the greatest variability. When analyzing cocoa yield per tree, we found no significant differences between the AFS groups (Table 3). Fruit tree diversity (species richness) was higher in medium and high-complexity groups. However, fruit and timber tree densities were not statistically different across the groups. The densities of Musaceae were significantly higher in the medium and high-complexity AFS groups compared to the low-complexity AFS groups. However, the variability in Musaceae densities was high within all groups because many AFS, regardless of their ecological complexity, did not contain Musaceae.
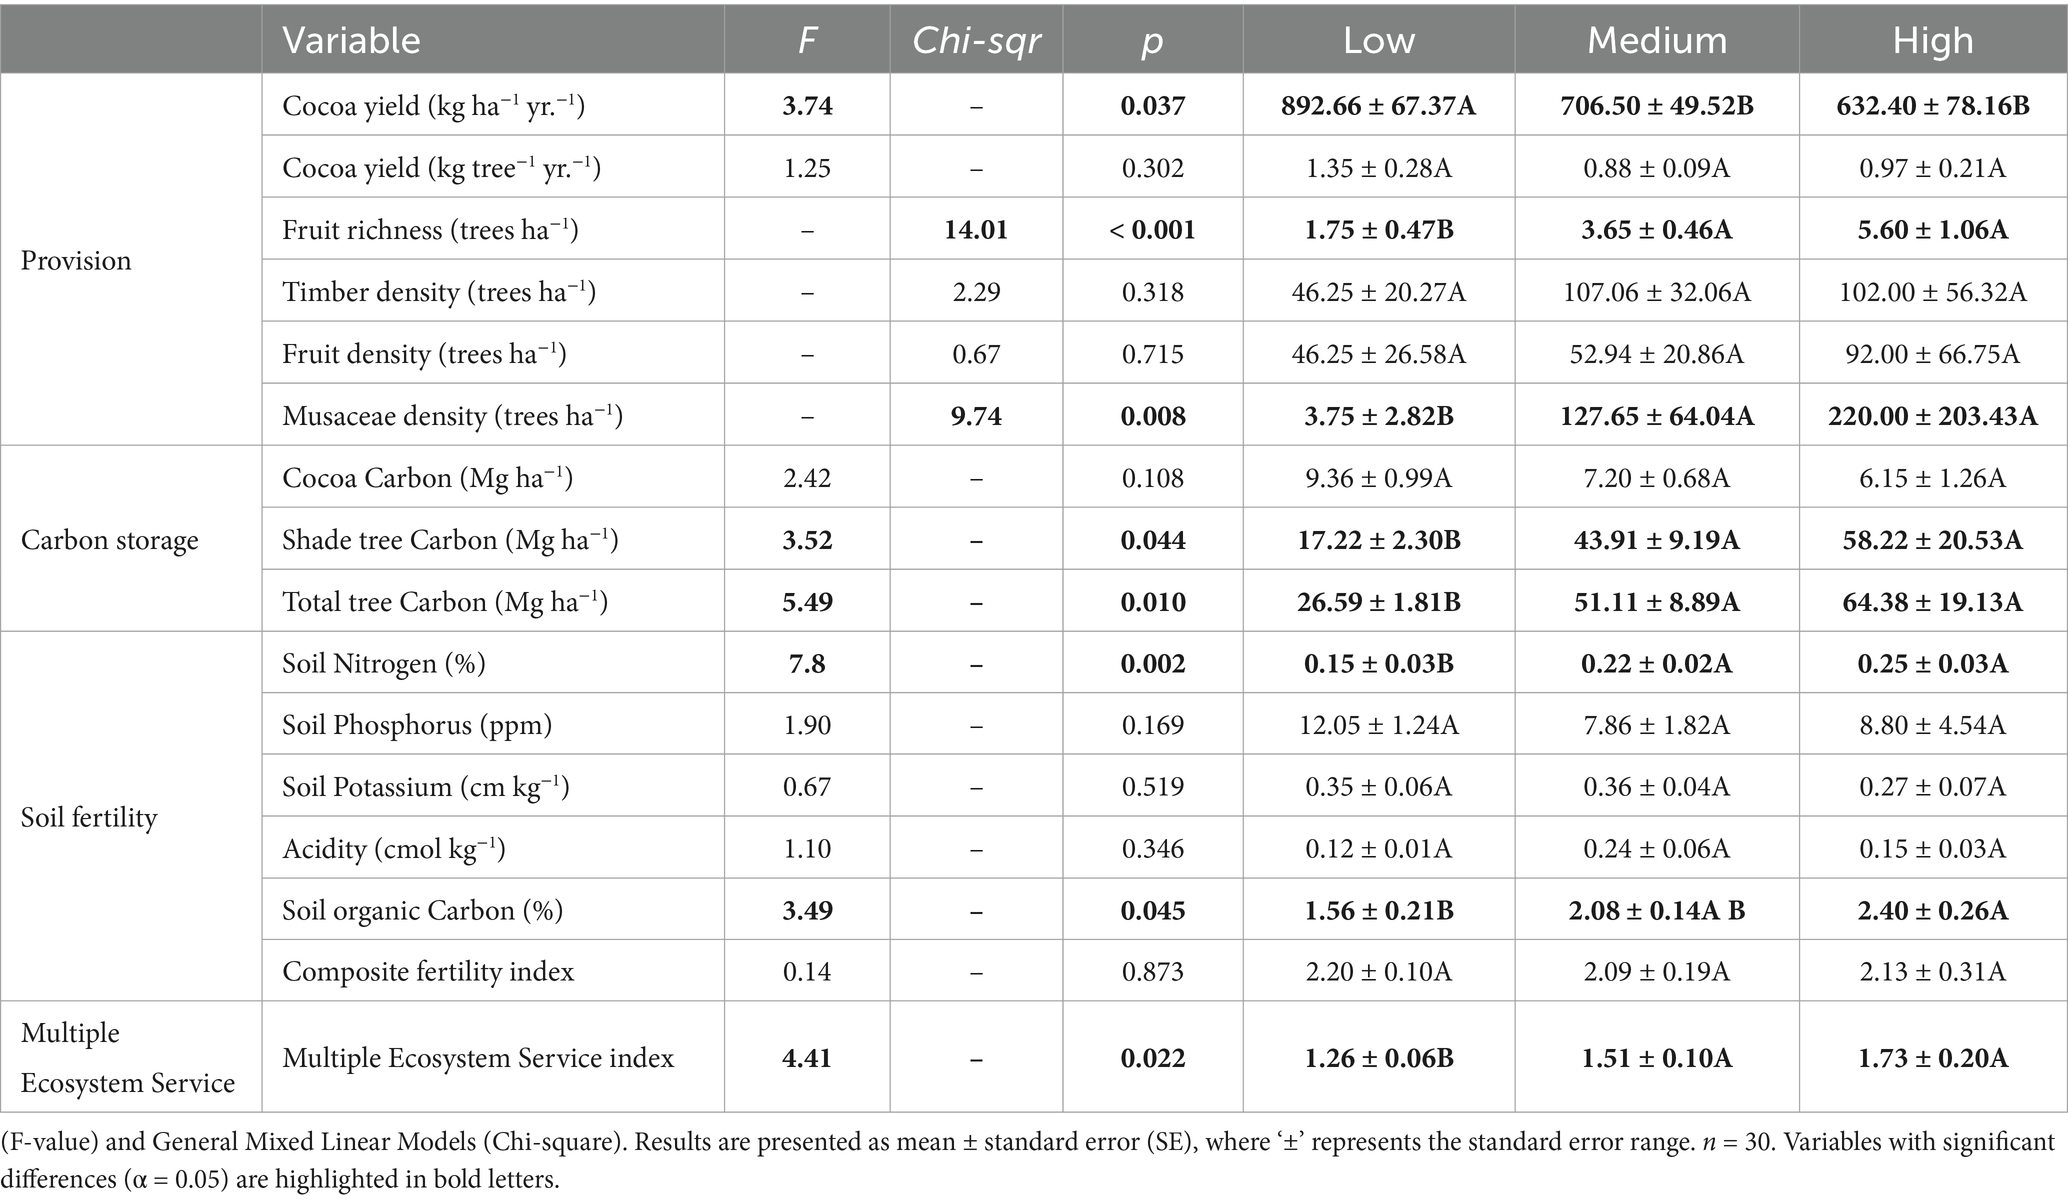
Table 3. Comparison of provision, carbon storage and soil fertility across ecological complexity agroforestry system (AFS) groups using extended and mixed linear models.
3.4.2 Regulating: carbon stock
The AFS groups presented significant differences for the aboveground carbon stocks (Table 3). The low-complexity group exhibited smaller carbon stocks, with an average of 26.59 Mg ha−1 of carbon. In contrast, the medium and high-complexity groups displayed statistically equal carbon stocks, averaging 51.11 and 64.38 Mg ha−1, respectively. The shade trees made the greatest contribution to the carbon stocks in all the AFS groups, representing on average 75% of the total carbon stocks.
3.4.3 Supporting: soil fertility
The Composite Soil Fertility Index, as a proxy for overall soil fertility, did not differ among groups. However significant differences were observed in nitrogen (N) and soil organic carbon (SOC) levels. Both, the total soil N and the SOC were significantly lower in the low-complexity group than in the medium and high-complexity groups (Table 3). In the low-complexity group, the average levels of N and SOC were below the minimum nutrient requirements for cocoa cultivation, while, on average, the other two AFS groups had adequate levels for these nutrients (Snoeck et al., 2016). Additionally, the pH values of all the AFS groups were within the appropriate range for cocoa cultivation (Quesada et al., 2012). Phosphorus was deficient in most AFS plots, as expected from highly weathered tropical soils. Potassium was similar across AFS groups, and on average, these AFS plots meet the minimum K requirement for cocoa cultivation.
3.4.4 Multiple ecosystem services
The Multiple Ecosystem Service Index, which simultaneously considers carbon stocks, soil fertility and provision of cocoa and other AFS products, exhibited a significant difference among the AFS groups. The low AFS group had an inferior value compared to the medium and high-complexity AFS groups.
3.5 Relationship between the functional diversity and the production of ecosystem Services in Cocoa Agroforestry Systems
The multiple regression analysis (Table 4) revealed several statistically significant relationships between functional diversity and the delivery of targeted ecosystem services.
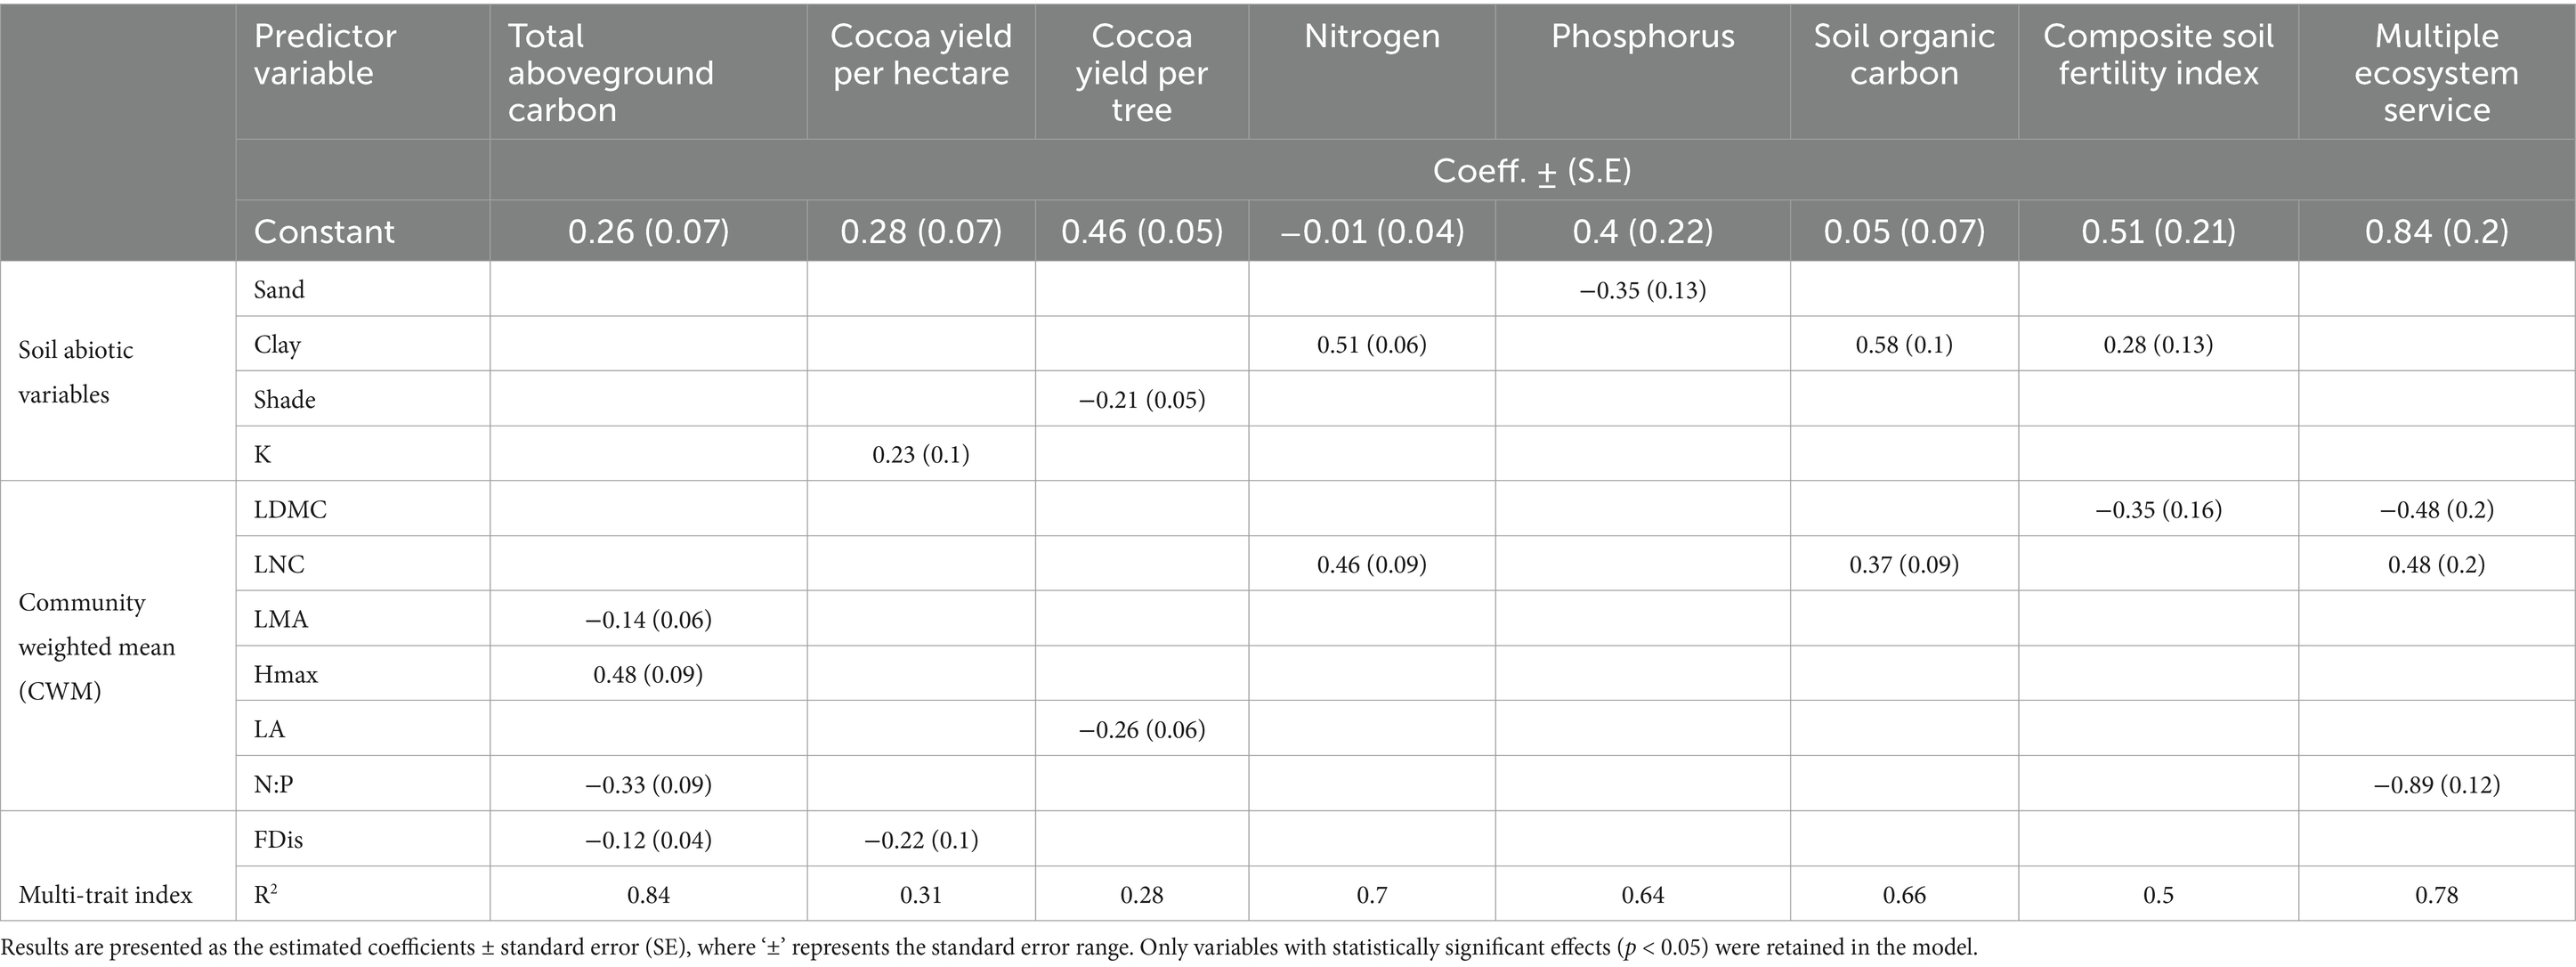
Table 4. Results of multiple regression models for ecosystem service proxies, with functional diversity indices and abiotic parameters as fixed effects and location as a random effect.
Carbon stock exhibited a significant positive relationship with CWM Hmax and a significant negative relation with CWM LMA, N:P, and FDis. These variables accounted for 84% of the variability in total carbon stock values, with Hmax as the most influential predictor.
In terms of crop productivity, cocoa yield per hectare was positively linked to K levels and negatively associated with FDis. Together, these indices explained 31% of the variability in cocoa yield per hectare. When analyzing yield per tree, the predictors were shade cover and leaf area (CWM LA), which had significant negative relationships and accounted for 28% of the variability in cocoa yield per tree.
For the soil fertility models, SOC and N had a significant and positive relation with the CWM LNC and soil clay proportion. These two independent variables explained 66 and 70% of SOC and N variability, respectively, and clay proportion was the most important predictor for these variables. Similarly, the most important predictor for soil P concentration was soil texture, where a negative relationship with sand proportion explained 64% of P variability, but conversely, this model showed no association with FD indices. Furthermore, the soil fertility composite index showed a significant and positive relationship with clay and a significant and negative relationship with LDMC, which was the most influential predictor. In contrast, none of the independent variables showed a significant relationship with K content.
The Multiple Ecosystem Service Index presented a significant negative relationship with LDMC and N:P, and a significant positive relationship with LNC. Together, these predictors explained 78% of the variability in the Multiple Ecosystem Service Index, with N:P ratio having the largest impact on the ecosystem services.
Overall, these results demonstrate important linkages among key ecosystem services, functional diversity attributes, and soil properties in the sampled AFS plots. The statistical models explain substantial portions of variability across indicators, highlighting the utility of functional diversity for understanding ecosystem functioning.
4 Discussion
4.1 Comparison between AFS with contrasting ecological complexities
In cocoa AFS featuring grafted clones from CATIE, an ascending trend in tree densities, basal area, and shade cover was observed along a gradient of ecological complexity based on species richness. This ecological pattern, which links composition and structural complexity, was associated with corresponding changes in functional diversity, marked by an increase in CWM of LNC and Hmax, and a decrease in CWM of LDMC and SSD. These functional traits are key variables related to resource use patterns and reflect distinct ecological strategies of each AFS. The variation in these traits positions the tree species along the plant economic spectrum, characterizing them as either acquisitive or conservative species in terms of their resource use strategies.
Acquisitive plant strategists are associated with fast rates of ecosystem processes, such as rapid decomposition of their nutritionally rich leaves and efficient primary productivity with a reduced cost of leaf construction, resulting in a greater competitive ability due to faster resource acquisition (Cornwell et al., 2008; Gorné et al., 2022). Conservative plant strategists, on the opposite side of the functional trait spectrum, have a conservative use of resources and slower growth rates (Carreño-Rocabado et al., 2012, Reich 2014, Maracahipes et al., 2018; Gorné et al., 2022).
AFS with medium and high ecological complexity were characterized by the dominance of acquisitive species, defined by traits such as low LDMC and SSD and high LNC, which align with “fast” ecological strategies. In contrast, low-complexity AFS were dominated by conservative species with high LDMC and SSD and low LNC, corresponding to “slow” ecological strategies. These distinct functional profiles reflect the ecological complexity gradient observed in cocoa AFS and provide a basis for understanding how different strategies drive ecosystem functioning (Díaz et al., 2007; Wright et al., 2004).
The different ecological strategies among groups also manifested as differences on ecosystem services delivering. On average, AFS plots had 46.78 Mg ha−1 of carbon, similar to the results from Somarriba et al. (2013) for Costa Rica and Central America cocoa AFS. However, carbon stock values exhibited wide variability across the AFS groups, ranging from 17.84 to 149.13 Mg ha−1. The slow-conservative-low-complexity group had lower carbon stocks, while the faster-acquisitive-medium and high-complexity groups had higher carbon stocks.
For the soil fertility service, the faster-acquisitive medium and high-complexity AFS groups were associated with higher soil fertility. These acquisitive species can improve soil fertility through a high biomass input and labile and fast decomposable leaves (Negret et al., 2016; Gorné et al., 2022). The quality of the leaf litter from these acquisitive species, with a distinct composition from cocoa leaves, has positive impact on soil ecological processes, increasing nutrient availability (Sauvadet et al., 2020b; Sauvadet et al., 2020a; Addo-Danso et al., 2024). Therefore, in terms of aboveground carbon and soil fertility, the medium and high-complexity groups were more dynamic, storing more carbon and making nutrients more available.
However, more complex systems were not necessarily superior in all aspects. The medium and high-complexity groups had significantly lower cocoa yields per hectare than the Low-complexity group, suggesting a tradeoff between ecosystem services of carbon storage and soil fertility, and cocoa provision, as reported in previous investigations (Blaser et al., 2018).
Nevertheless, when the cocoa tree density per hectare is taken into account, cocoa yield per tree does not differ significantly among the groups. This highlights the importance of considering different ecological processes at various scales (Lindborg et al., 2017). While the hectare serves as a unit for landscape-scale ecosystem analysis and supports farmers in optimizing resources within the constraints of limited property areas, analyzing yield on a per-tree basis provides a perspective on plant ecophysiology, revealing how a cocoa tree responds to environmental conditions. These contrasting results—higher yields from the low-complexity AFS at a landscape level but no difference among AFS groups at the ecophysiological level—suggest that cocoa yield is not entirely linked to the ecological complexity of AFS. Therefore, other factors must be assessed to fully explain cocoa yields. Still, the analysis of cocoa yield per tree reveals low plasticity in the clonal cocoa varieties, which maintain similar production regardless of ecological conditions.
When analyzing all these ecosystem services together, through the Multiple Ecosystem Service Index, significant differences among the AFS groups were observed. Higher values of multiple ecosystem services were observed for the medium and high-complexity AFS, which is consistent with other publications that found that diversity of functional traits can lead to complementary resource use and improved ecosystem functioning (Isaac et al., 2024). From a provisioning perspective, the Multiple Ecosystem Service Index should be understood through the logic of the Land Equivalent Ratio, as the contribution of different components within an agroforestry system can offset the reduction in cocoa yield caused by species competition (Mead and Willey, 1980). Therefore, our findings suggest that a win-win scenario—positive for carbon, soil fertility, and provisioning—can be achieved when the shade trees are productive and can generate benefits. Otherwise, a tradeoff between ecosystem services is more likely.
In summary, the characterization of functional diversity along a gradient of ecological complexity in AFS groups demonstrates that the low ecological complexity group exhibited predominantly conservative traits, while the medium and high ecological complexity groups displayed predominantly acquisitive traits. These trait profiles imply slower biomass growth and nutrient availability in the low-complexity group, and faster biomass growth and nutrient availability in the medium and high-complexity groups. This difference in trait profiles may be associated with different production strategies. Producers in the low-complexity group may not be interested in the benefits from the shade trees and may focus solely on cocoa productivity, whereas producers in the medium and high-complexity groups seek multiple outcomes from their AFS.
4.2 The effect of functional diversity on ecosystem services
Based on the multiple regression model analysis, seven out of the nine functional indices showed significant effects on ecosystem services, including both the single and multi-trait indices. Specifically, the CWM of Hmax, LMA, LA, LNC, N:P, LDMC, and the FDis (Figure 5).
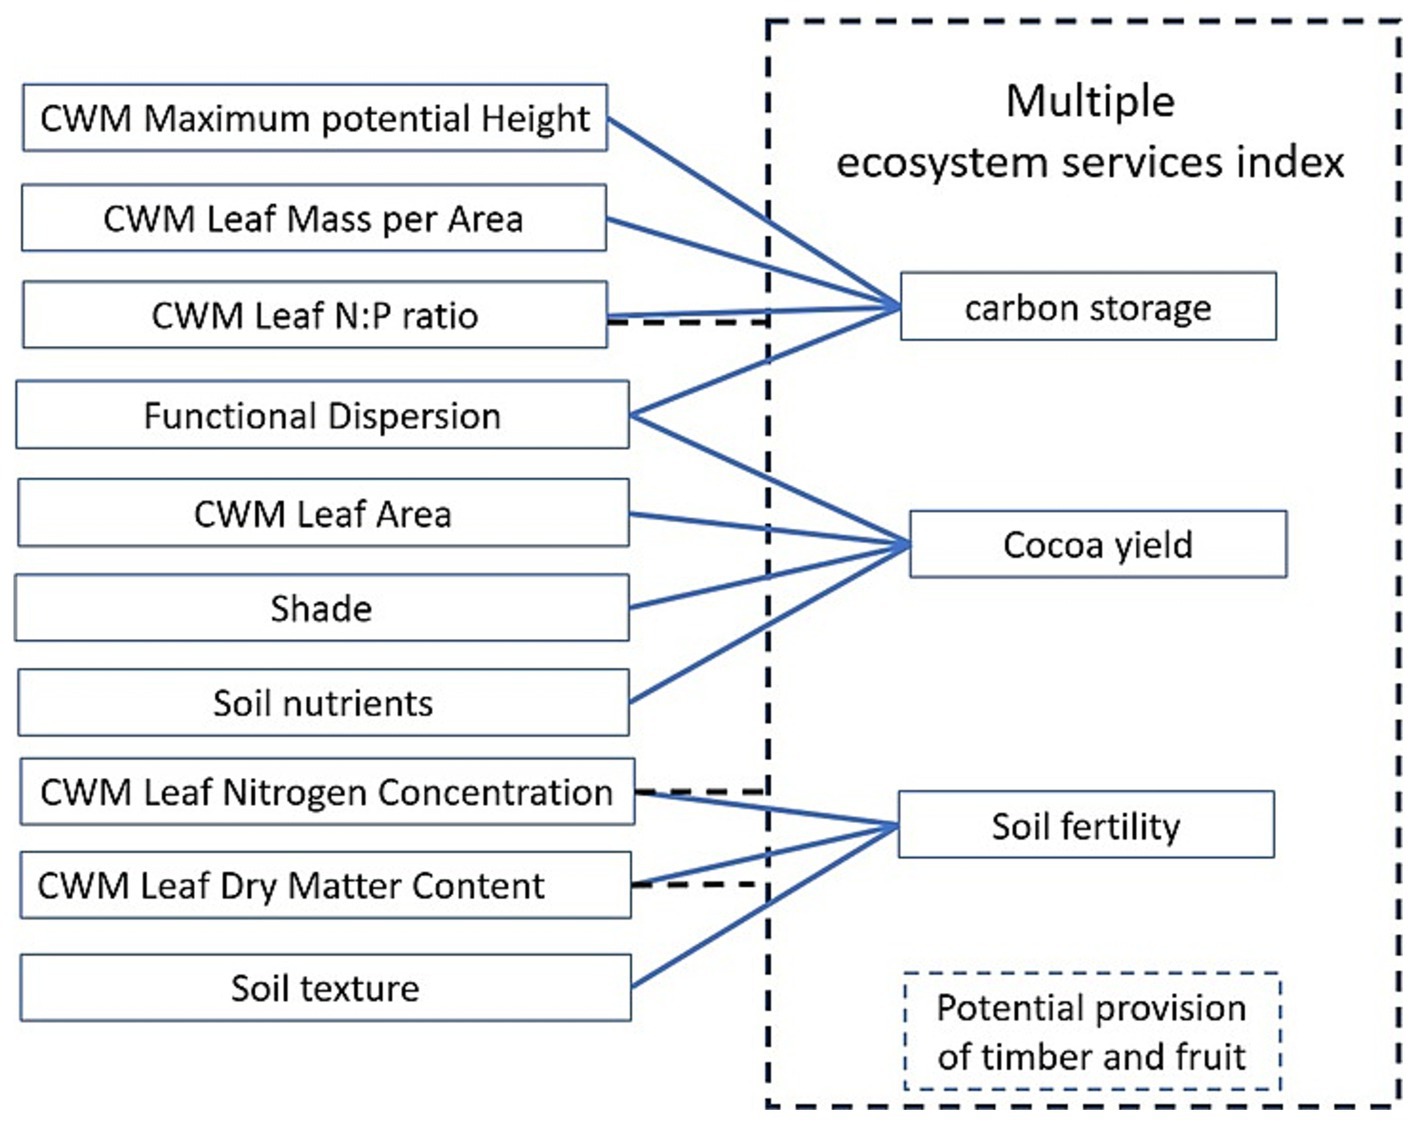
Figure 5. Scheme of the multiple regression models from the effect abiotic factors and functional diversity indices on ecosystem services. Blue lines represent the significant covariation between independent variables and ecosystem services. The dashed line represents the significant relations with Multiple Ecosystem Service Index, that also includes the potential provision from timber and fruit trees.
As expected, AFS dominated by tall species (high CWM of Hmax) were associated with higher carbon stocks, a pattern similar to those observed in natural forests (Conti and Díaz, 2013; Finegan et al., 2015). In cocoa AFS, the CWM of LMA was inversely correlated with carbon stock increments because the acquisitive nature of AFS with low LMA promotes faster plant growth and, consequently, carbon stock accumulation from an early stage. The leaf N:P ratio also emerged as a significant predictor, showing an inverse relationship with carbon stocks, consistent with patterns observed in natural forests (Finegan et al., 2015). In these cocoa AFS, the CWM of N:P ratio is inversely associated with the CWM of LPC and Hmax (according to the Spearman correlation, Appendix 6). High values of CWM of N:P ratios were found when shade trees were dominant, which raises carbon stocks, while low values of the CWM of N:P ratio occurred when cocoa was more prevalent, resulting in lower carbon stocks due to the reduced presence of shade trees. This explains why functional dispersion (FDis) is also a key predictor, exhibiting an inverse relationship with total aboveground carbon. When FDis is low, traits are less dispersed and can be concentrated in specific functions which are associated with greater carbon stocks.
The trait syndrome revealed in the models for the soil fertility service indicates that resource-acquisitive plants, with higher CWM LNC and lower CWM LDMC, were associated with higher soil fertility, as expected from leguminous trees (Epihov et al., 2021), which have strong representation in this functional group. In contrast, cocoa presents the opposite trait profile, with lower LNC and relatively higher LDMC. This result reflects that AFS incorporating shade trees with dissimilar traits from cocoa contributes to improved soil functions, which has been previously associated with resource complementarity due to phylogenetic differences (Sauvadet et al., 2020b; Sauvadet et al., 2020a) and dissimilarities in leaf litter traits (Sauvadet et al., 2020b; Sauvadet et al., 2020a) between cocoa and shade trees.
The models for cocoa yield exhibited a positive association with K, as extensively documented in the literature (Hartemink, 2005). However, a notable negative relationship was observed with FDis, suggesting that agroforestry systems with contrasting functional traits tend to yield less cocoa. This is expected: in cocoa AFS, cocoa stands out as the dominant species, and a progressive dominance of shade trees (increase in FDis) can affect cocoa’s ecophysiological processes, such as light availability and disease incidence, impacting its productivity. Consequently, a system with low FDis represents a system with cocoa predominance, and similar to the low-complexity AFS groups described earlier, produces higher cocoa yield per hectare. In this context, FDis serves as a surrogate for shade cover or shade tree density and as an indicator of species interactions within agroforestry systems. Furthermore, the negative relationship of cocoa yield per tree with shade cover and CWM LA suggests that the average yield of cocoa trees increases when shade levels are kept around 30% (Table 2), as reported by several studies (Somarriba et al., 2018; Blaser et al., 2018; Ramírez-Argueta et al., 2022), especially when controlling the shade from plants with large leaf areas.
When evaluating the effect of functional diversity on multiple ecosystem services—carbon storage, soil fertility, and provisioning of cocoa and other AFS products through one single variable—the most important predictors of multifunctionality in AFS were leaf traits, including LNC, N:P ratio, and LDMC. According to the models for individual environmental services, LNC and LDMC were linked to soil fertility, and LNC and N:P were associated with carbon storage. Provisioning, which includes cocoa yield as well as fruit and timber tree densities, was associated with growth response traits, the same traits that affect carbon storage. This trait syndrome suggests that AFS can maximize multiple ecosystem services when they include acquisitive shade tree species, with high LNC and low LDMC, and when there is a dominance of shade tree species over cocoa, which is expressed through a high N:P ratio profile. This can be expected when the benefits from timber and fruit trees are utilized for provisioning.
We conclude that, in order to optimize specific ecosystem services, it is advisable to design the AFS including species with functional traits that contribute to the desired outcomes. For maximizing carbon storage in AFS that are 5 to 15 years old, it is recommended to have low variability of functional traits (low FDis), predominantly composed of tall trees (high Hmax), with high LNC, and low LMA. The soil fertility can be increased when shade trees consist of species with high LNC and low LDMC.
These findings suggest that cocoa production likely benefits from factors such as adequate potassium levels, moderate shade cover, lower densities of shade trees with large leaf area (CWM LA), and reduced variability in functional traits (FDis), which is achieved by limiting the dominance of acquisitive shade trees in AFS.
Our research indicates that AFS dominated by acquisitive species with low LMA, LDMC, and N:P ratios, and high LNC and Hmax, are associated with improvements in multiple ecosystem services. Maintaining low trait variability, represented by a low FDis, through selecting species that are predominantly linked to specific ecological processes—such as enhancing carbon storage and increasing cocoa yield—appears to promote multifunctionality in agroforestry systems (AFS). While there is a potential tradeoff between ecosystem services and cocoa productivity, a win-win scenario is likely to be achieved by utilizing resources from timber and fruit trees. Achieving this balance is especially effective when the shade provided by acquisitive species is maintained at an appropriate level. These insights underscore the importance of strategic selection of functional traits and trait-based management in optimizing the multifunctionality of AFS.
Data availability statement
The original contributions presented in the study are included in the article/Supplementary material, further inquiries can be directed to the corresponding author.
Author contributions
CE: Conceptualization, Data curation, Formal analysis, Investigation, Methodology, Project administration, Visualization, Writing – original draft, Writing – review & editing. MI: Writing – original draft, Writing – review & editing, Conceptualization, Methodology. LO-A: Writing – original draft, Writing – review & editing. FP: Writing – original draft, Writing – review & editing. DD-R: Resources, Writing – original draft, Writing – review & editing. RC: Writing – original draft, Writing – review & editing, Conceptualization, Funding acquisition, Methodology, Project administration, Resources, Supervision.
Funding
The author(s) declare that financial support was received for the research, authorship, and/or publication of this article. This study was supported by a scholarship from the Latin-American Model Forest Network and the Government of Canada. Field work and open access publication of this research was made possible by funding from the KoLFACI project (Korea-Latin America Food & Agriculture Cooperation Initiative/https://kolfaci.org/main) coordinated by the Coffee and Cocoa Agroforestry Unit of CATIE. The Forests and Biodiversity in Productive Landscapes Unit of CATIE supported the collection and analysis of the leaf and soil samples.
Acknowledgments
We gratefully acknowledge the cocoa producers from Huetar Caribe, Costa Rica for providing the opportunity for this research, the Latin-American Model Forests Network, the Government of Canada, and the Forests and Biodiversity in Productive Landscapes Unit of CATIE for the scholarship, the Ministry of Agriculture of Costa Rica and its staff—Rocío Fallas, Kennet Bolivar., Jimmy Medina, Daniela Mora, and Ányelo Moya—for assisting in identifying the studied population, the Coffee and Cocoa Agroforestry Unit for supporting the fieldwork and laboratory analysis, the Forests and Biodiversity in Productive Landscapes Unit of CATIE for providing tools and facilitating leaf sample collection, Bryan Finegan for their technical advices, Leonel Coto for practical advices on leaf sample collection, Fernando Casanoves, Sergio Vilchez, and Eduardo Corrales from the Biostatistics Unit of CATIE for their support, and Jeison Salazar for his field assistance.
Conflict of interest
The authors declare that the research was conducted in the absence of any commercial or financial relationships that could be construed as a potential conflict of interest.
Generative AI statement
The authors declare that no Gen AI was used in the creation of this manuscript.
Publisher’s note
All claims expressed in this article are solely those of the authors and do not necessarily represent those of their affiliated organizations, or those of the publisher, the editors and the reviewers. Any product that may be evaluated in this article, or claim that may be made by its manufacturer, is not guaranteed or endorsed by the publisher.
Supplementary material
The Supplementary material for this article can be found online at: https://www.frontiersin.org/articles/10.3389/fsufs.2024.1507555/full#supplementary-material
References
Addo-Danso, S. D., Asare, R., Tettey, A., Schmidt, J. E., Sauvadet, M., Coulis, M., et al. (2024). Shade tree functional traits drive critical ecosystem services in cocoa agroforestry systems. Agric. Ecosyst. Environ. 372:109090. doi: 10.1016/j.agee.2024.109090
Avelino, J., Gagliardi, S., Perfecto, I., Isaac, M. E., Liebig, T., Vandermeer, J., et al. (2023). Tree effects on coffee leaf rust at field and landscape scales. Plant Disease, 107, 247–261. doi: 10.1094/PDIS-08-21-1804-FE
Beres, B. L., Hatfield, J. L., Kirkegaard, J. A., Eigenbrode, S. D., Pan, W. L., Lollato, R. P., et al. (2020). Toward a better understanding of genotype × environment × management interactions—a global wheat initiative agronomic research strategy. Front. Plant Sci. 11, 1–10. doi: 10.3389/fpls.2020.00828
Blaser, W. J., Oppong, J., Hart, S. P., Landolt, J., Yeboah, E., and Six, J. (2018). Climate-smart sustainable agriculture in low-to-intermediate shade agroforests. Nature Sustainability 1, 234–239. doi: 10.1038/s41893-018-0062-8
Bouyoucos, G. J. (1962). Hydrometer method improved for making particle size analyses of Soils1. Agron. J. 54, 464–465. doi: 10.2134/agronj1962.00021962005400050028x
Burdon, R. D., Li, Y., Suontama, M., and Dungey, H. (2017). Genotype × site × silviculture interactions in radiata pine: knowledge, working hypotheses and pointers for research. N.Z. j. of For. Sci 47:6. doi: 10.1186/s40490-017-0087-1
Cadotte, M. W. (2011). The new diversity: management gains through insights into the functional diversity of communities. J. Appl. Ecol. 48, 1067–1069. doi: 10.1111/j.1365-2664.2011.02056.x
Carreño-Rocabado, G., Peña-Claros, M., Bongers, F., Alarcón, A., Licona, J. C., and Poorter, L. (2012). Effects of disturbance intensity on species and functional diversity in a tropical forest. J. Ecol. 100, 1453–1463. doi: 10.1111/j.1365-2745.2012.02015.x
Cerda Bustillos, R., Espin-Chion, T., and Cifuentes, M. (2013). Carbono en sistemas agroforestales de cacao de la Reserva Indígena Bribri de Talamanca, Costa Rica. Agroforestería en las Américas 49, 33–41.
Cerda, R., Deheuvels, O., Calvache, D., Niehaus, L., Saenz, Y., Kent, J., et al. (2014). Contribution of cocoa agroforestry systems to family income and domestic consumption: looking toward intensification. Agrofor. Syst. 88, 957–981. doi: 10.1007/s10457-014-9691-8
Comisión Interinstitucional de Cacao (2018). Plan Nacional de Cacao: Hacia la consolidación de una agrocadena competitiva y sostenibe, Costa Rica: Comisión Interinstitucional de Cacao. 34:1–26.
Conti, G., and Díaz, S. (2013). Plant functional diversity and carbon storage - an empirical test in semi-arid forest ecosystems. J. Ecol. 101, 18–28. doi: 10.1111/1365-2745.12012
Cornelissen, J. H. C., Lavorel, S., Garnier, E., Díaz, S., Buchmann, N., Gurvich, D. E., et al. (2003). A handbook of protocols for standardised and easy measurement of plant functional traits worldwide. Aust. J. Bot. 51, 335–380. doi: 10.1071/BT02124
Cornwell, W. K., Cornelissen, J. H. C., Amatangelo, K., Dorrepaal, E., Eviner, V. T., Godoy, O., et al. (2008). Plant species traits are the predominant control on litter decomposition rates within biomes worldwide. Ecology Letters, 11, 1065–1071. doi: 10.1111/j.1461-0248.2008.01219.x
Deheuvels, O., Avelino, J., Somarriba, E., and Malezieux, E. (2012). Vegetation structure and productivity in cocoa-based agroforestry systems in Talamanca, Costa Rica. Agric. Ecosyst. Environ. 149, 181–188. doi: 10.1016/j.agee.2011.03.003
Díaz, S., Lavorel, S., de Bello, F., Quétier, F., Grigulis, K., and Robson, T. M. (2007). Incorporating plant functional diversity effects in ecosystem service assessments. Proc. Natl. Acad. Sci. USA 104, 20684–20689. doi: 10.1073/pnas.0704716104
Díaz, S., Quétier, F., Cáceres, D. M., Trainor, S. F., Pérez-Harguindeguy, N., Bret-Harte, M. S., et al. (2011). Linking functional diversity and social actor strategies in a framework for interdisciplinary analysis of nature’s benefits to society. Proc. Natl. Acad. Sci. USA 108, 895–902. doi: 10.1073/pnas.1017993108
Epihov, D. Z., Saltonstall, K., Batterman, S. A., Hedin, L. O., Hall, J. S., van Breugel, M., et al. (2021). Legume–microbiome interactions unlock mineral nutrients in regrowing tropical forests. Proc. Natl. Acad. Sci. 118:e2022241118. doi: 10.1073/pnas.2022241118
Farfán, F. F. (2014). Agroforestería y sistemas agroforestales con café. Cenicafé. Available at: http://hdl.handle.net/10778/4213Farfán (Accessed September, 30, 2024).
Finegan, B., Peña-Claros, M., Oliveira, A., Ascarrunz, N., Bret-Harte, M. S., Carreño-Rocabado, G., et al. (2015). Does functional trait diversity predict above-ground biomass and productivity of tropical forests? Testing three alternative hypotheses. J. Ecol. 103, 191–201. doi: 10.1111/1365-2745.12346
Gagliardi, S., Avelino, J., Virginio Filho, E. M., and Isaac, M. E. (2021). Shade tree traits and microclimate modifications: implications for pathogen management in biodiverse coffee agroforests. Biotropica 53, 1356–1367. doi: 10.1111/btp.12984
Garnier, E., Cortez, J., Billès, G., Navas, M. L., Roumet, C., Debussche, M., et al. (2004). Plant functional markers capture ecosystem properties during secondary succession. Ecology 85, 2630–2637. doi: 10.1890/03-0799
Gorné, L. D., Díaz, S., Minden, V., Onoda, Y., Kramer, K., Muir, C., et al. (2022). The acquisitive–conservative axis of leaf trait variation emerges even in homogeneous environments. Ann. Bot. 129, 709–722. doi: 10.1093/aob/mcaa198
Grime, J. P. (1998). Benefits of plant diversity to ecosystems: immediate, filter and founder effects. J. Ecol. 86, 902–910. doi: 10.1046/j.1365-2745.1998.00306.x
Hartemink, A. E. (2005). Nutrient stocks, nutrient cycling, and soil changes in cocoa ecosystems: a review. Advan. Agronomy 86, 227–253. doi: 10.1016/S0065-2113(05)86005-5
Henry, M., Bombelli, A., Trotta, C., Alessandrini, A., Birigazzi, L., Sola, G., et al. (2013). GlobAllomeTree: international platform for tree allometric equations to support volume, biomass and carbon assessment. Biogeosci. Forestry 6, 326–330. doi: 10.3832/ifor0901-006
Intergovernmental Panel on Climate Change (IPCC). (2006). Guidelines for National Greenhouse gas Inventories. Volume 4: Agriculture, Forestry and Other Land Use. IPCC, Geneva. Available at: https://www.ipcc-nggip.iges.or.jp/public/2006gl/vol4.html (Accessed September, 30, 2024).
Isaac, M. E., Gagliardi, S., Ordoñez, J. C., and Sauvadet, M. (2024). Shade tree trait diversity and functions in agroforestry systems: a review of which traits matter. J. Appl. Ecol. 61, 1159–1173. doi: 10.1111/1365-2664.14652
Kattge, J., Bönisch, G., Diaz, S., Lavorel, S., Prentice, I., Leadley, P., et al. (2020). TRY plant trait database – enhanced coverage and open access. Glob. Chang. Biol. 26, 119–188. doi: 10.1111/gcb.14904
Kattge, J., Diaz, S., Lavorel, S., Prentice, I., Leadley, P., Bönisch, G., et al. (2011). TRY - a global database of plant traits. Glob. Chang. Biol. 17, 2905–2935. doi: 10.1111/j.1365-2486.2011.02451.x
Kearney, S. P., Fonte, S. J., García, E., Siles, P., Chan, K. M. A., and Smukler, S. M. (2019). Evaluating ecosystem service trade-offs and synergies from slash-and-mulch agroforestry systems in El Salvador. Ecol. Indic. 105, 264–278. doi: 10.1016/j.ecolind.2017.08.032
Laliberté, E., and Legendre, P. (2010). A distance-based framework for measuring functional diversity from multiple traits. Ecology 91, 299–305. doi: 10.1890/08-2244.1
Lawton, J. H., Naeem, S., Thompson, L. J., Hector, A., and Crawley, M. J. (1998). Biodiversity and ecosystem function: getting the Ecotron experiment in its correct context. Funct. Ecol. 12, 848–852.
Lindborg, R., Gordon, L. J., Malinga, R., Bengtsson, J., Peterson, G., Bommarco, R., et al. (2017). How spatial scale shapes the generation and management of multiple ecosystem services. Ecosphere 8:e01741. doi: 10.1002/ecs2.1741
Lachenaud, P., Paulin, D., Ducamp, M., and Thevenin, J. M. (2007). Twenty years of agronomic evaluation of wild cocoa trees (Theobroma cacao L.) from French Guiana. Sci. Hortic. 113, 313–321. doi: 10.1016/j.scienta.2007.05.016
Ministerio de Agricultura y Ganadería de Costa Rica (MAG) (2021). Censo Nacional de Cacao. San José, Costa Rica: Ministerio de Agricultura y Ganadería de Costa Rica.
Maracahipes, L., Carlucci, M. B., Lenza, E., Marimon, B. S., Marimon, B. H., Guimarães, F. A. G., et al. (2018). How to live in contrasting habitats? Acquisitive and conservative strategies emerge at inter- and intraspecific levels in savanna and forest woody plants. Perspec. Plant Ecol. Evolution and Systematics 34, 17–25. doi: 10.1016/j.ppees.2018.07.006
Martin, A. R., and Isaac, M. E. (2015). Review: plant functional traits in agroecosystems: a blueprint for research. J. Appl. Ecol. 52, 1425–1435. doi: 10.1111/1365-2664.12526
Martin, A. R., and Isaac, M. E. (2018). Functional traits in agroecology: Advancing description and prediction in agroecosystems. J Appl Ecol, 55, 5–11. doi: 10.1111/1365-2664.13039
McGill, B. J., Enquist, B. J., Weiher, E., and Westoby, M. (2006). Rebuilding community ecology from functional traits. Trends Ecol. Evol. 21, 178–185. doi: 10.1016/j.tree.2006.02.002
Mead, R., and Willey, R. W. (1980). The concept of a ‘land equivalent ratio’ and advantages in yields from intercropping. Exp. Agric. 16, 217–228. doi: 10.1017/S0014479700010978
Moço, M. K. S., Gama-Rodriques, E. F., Gama-Rodriques, A. C., Machado, R. C. R., and Baligar, V. C. (2010). Relationships between invertebrate communities, litter quality and soil attributes under different cacao agroforestry systems in the south of Bahia, Brazil. Appl. Soil Ecol. 46, 347–354. doi: 10.1016/j.apsoil.2010.10.006
Moreno-Mateos, D., Alberdi, A., Morriën, E., Van Der Putten, W. H., Rodríguez-Uña, A., and Montoya, D. (2020). The long-term restoration of ecosystem complexity. Ecol. Evol. 4, 676–685. doi: 10.1038/s41559-020-1154-1
Naeem, S. (2002). Disentangling the impacts of diversity on ecosystem functioning in combinatorial experiments. Ecology 83:2925. doi: 10.2307/3072027
Nair, P. K. R., Kumar, B. M., and Nair, V. D. (2021). “Historical developments: the coming of age of agroforestry” in An introduction to agroforestry: Four decades of scientific developments (Cham: Springer), 3–20.
Negret, B., Pulido, E. R., Cabrera, M., Osorio, C., Paz, H., López, J. O., et al. (2016). La ecología funcional como aproximación al estudio, manejo y conservación de la biodiversidad: Protocolos y aplicaciones : Instituto de Investigación de Recursos Biológicos Alexander von Humboldt, 236.
Ngo Bieng, M. A., Gidoin, C., Avelino, J., Cilas, C., Deheuvels, O., and Wery, J. (2013). Diversity and spatial clustering of shade trees affect cacao yield and pathogen pressure in Costa Rican agroforests. Basic. Appl. Ecol. 14, 329–336. doi: 10.1016/j.baae.2013.03.003
Olsen, S. R., Cole, C. V., and Watanabe, F. S. (1954). Estimation of available phosphorus in soils by extraction with sodium bicarbonate. Washington DC: USDA circular no. 939, US government printing office.
Orozco-Aguilar, L., López, A. S., Cerda, R., Casanoves, F., Ramirez-Argueta, O., Matute, J., et al. (2024). CacaoFIT: the network of cacao field trials in Latin America and its contribution to sustainable cacao farming in the region. Front. Sustain. Food Systems. 8:1–25. doi: 10.3389/fsufs.2024.1370275
Orwa, C., Mutua, A., Kindt, R., Jamnadass, R., and Simons, A. (2009). Agroforestree database: A tree reference and selection guide, version 4.0. Nairobi, KE: World Agroforestry Centre ICRAF.
Pérez-Harguindeguy, N., Diaz, S., Garnier, E., Lavorel, S., Poorter, H., Jaureguiberry, P., et al. (2013). New handbook for standardised measurement of plant functional traits worldwide. Aust. J. Bot. 61, 167–234. doi: 10.1071/BT12225
Phillips-Mora, W., Arciniegas-Leal, A., Mata-Quirós, A., and Motamayor-Arias, J. (2013). Catalogue of cacao clones selected by CATIE for commercial plantings. 1st Edn. Turrialba, C.R: Tropical Agricultural Research and Higher Education Center (CATIE), 68.
Quesada, C. A., Phillips, O. L., Schwarz, M., Czimczik, C. I., Baker, T. R., and Patiño, S. (2012). Basin-wide variations in Amazon forest structure and function are mediated by both soils and climate. Biogeosciences 9, 2203–2246. doi: 10.5194/bg-9-2203-2012
Ramírez-Argueta, O., Orozco-Aguilar, L., Dubón, A. D., Díaz, F. J., Sánchez, J., and Casanoves, F. (2022). Timber growth, cacao yields, and financial revenues in a long-term experiment of cacao agroforestry systems in northern Honduras. Front. Sustain. Food Syst. 6:1–17. doi: 10.3389/fsufs.2022.941743
Reich, P. B. (2014). The world-wide ‘fast–slow’ plant economics spectrum: A traits manifesto. Journal of Ecology, 102, 275–301. doi: 10.1111/1365-2745.12211
Sauvadet, M., Asare, R., and Isaac, M. E. (2020a). Evolutionary distance explains shade tree selection in agroforestry systems. Agric. Ecosyst. Environ. 304:107125. doi: 10.1016/j.agee.2020.107125
Sauvadet, M., Saj, S., Freschet, G. T., Essobo, J. D., Enock, S., Becquer, T., et al. (2020b). Cocoa agroforest multifunctionality and soil fertility explained by shade tree litter traits. J. Appl. Ecol. 57, 476–487. doi: 10.1111/1365-2664.13560
Snoeck, D., Koko, L., Joffre, J., Bastide, P., and Jagoret, P. (2016). Cacao nutrition and fertilization. Sustain. Agriculture Rev. 19, 155–202. doi: 10.1007/978-3-319-26777-7_4
Solano, J. (1996). Aspectos fisiográficos básicos para las principales regiones de Costa Rica. Costa Rica: Ministerio del Ambiente y Energía, Instituto Meteorológico Nacional.
Somarriba, E., Beer, J., and Muschler, R. (2001). Research methods for multistrata agroforestry systems with coffee and cacao: recommendations from two decades of research at CATIE. Agrofor. Syst. 53, 195–203. doi: 10.1023/A:1013380605176
Somarriba, E., Cerda, R., Orozco, L., Cifuentes, M., Dávila, H., and Espin, T. (2013). Carbon stocks and cocoa yields in agroforestry systems of Central America. Agric. Ecosyst. Environ. 173, 46–57. doi: 10.1016/j.agee.2013.04.013
Somarriba, E., Orozco-Aguilar, L., Cerda, R., and López Sampson, A. (2018). Analysis and design of the shade canopy of cocoa-based agroforestry systems. Achieving sustain. cultivation of cocoa, 469–500. doi: 10.19103/AS.2017.0021.29
Somarriba, E., Trivelato, M., Villalobos, M., Suárez, A., Benavidez, P., Morán, K., et al. (2003). Diagnóstico agroforestal de pequeñas fincas cacaoteras orgánicas de indígenas Bribri y Cabécar de Talamanca. Costa Rica. Agroforestería en las Américas 10, 24–30.
Sousa, K., van Zonneveld, M., Holmgren, M., Kindt, R., and Ordonez, J. (2019). The future of coffee and cocoa agroforestry in a warmer Mesoamerica. Sci. Rep. 9:8828. doi: 10.1038/s41598-019-45491-7
Sousa, K., van Zonneveld, M., Imbach, P., Casanoves, F., Kindt, R., and Ordonez, J. (2017). Suitability of key central American agroforestry species under future climates: an atlas. ICRAF Occas. Pap. 26, 469–500.
Terasaki Hart, D. E., Yeo, S., Almaraz, M., Beillouin, D., Cardinael, R., Garcia, E., et al. (2023). Priority science can accelerate agroforestry as a natural climate solution. Nat. Clim. Chang. 13, 1179–1190. doi: 10.1038/s41558-023-01810-5
Tilman, D. (1999). The ecological consequences of changes in biodiversity: a search for general principles†. Ecology 80, 1455–1474. doi: 10.1890/0012-9658(1999)080[1455:TECOCI]2.0.CO;2
Tilman, D. (2001). Functional diversity. Encyclopedia of. Biodiversity 3, 109–120. doi: 10.1006/rwbd.1999.0154
Torquebiau, E. F. (2000). A renewed perspective on agroforestry concepts and classification. C. R. Acad. Sci. III 323, 1009–1017. doi: 10.1016/s0764-4469(00)01239-7
Violle, C., Navas, M. L., Vile, D., Kazakou, E., Fortunel, C., Hummel, I., et al. (2007). Let the concept of trait be functional! Oikos 116, 882–892. doi: 10.1111/j.2007.0030-1299.15559.x
Wright, I. J., Reich, P. B., Westoby, M., Ackerly, D. D., Baruch, Z., Bongers, F., et al. (2004). The worldwide leaf economics spectrum. Nature 428, 821–827. doi: 10.1038/nature02403
Keywords: shade trees, theobroma cacao, functional ecology, functional traits, agroecosystems, carbon sequestration
Citation: Edelstein CP, Isaac ME, Orozco-Aguilar L, Peguero F, Delgado-Rodríguez D and Cerda RH (2025) Effects of functional diversity on ecosystem services in cocoa agroforestry systems in Costa Rica. Front. Sustain. Food Syst. 8:1507555. doi: 10.3389/fsufs.2024.1507555
Edited by:
Liming Ye, Ghent University, BelgiumReviewed by:
Tarit Kumar Baul, University of Eastern Finland, FinlandAthina Koutouleas, The University of Copenhagen, Denmark
Copyright © 2025 Edelstein, Isaac, Orozco-Aguilar, Peguero, Delgado-Rodríguez and Cerda. This is an open-access article distributed under the terms of the Creative Commons Attribution License (CC BY). The use, distribution or reproduction in other forums is permitted, provided the original author(s) and the copyright owner(s) are credited and that the original publication in this journal is cited, in accordance with accepted academic practice. No use, distribution or reproduction is permitted which does not comply with these terms.
*Correspondence: Cassio Pinheiro Edelstein, Y2Fzc2lvLmVkZWxzdGVpbkBnbWFpbC5jb20=