- 1Department of Food Science, College of Food Science and Technology, Sichuan Tourism University, Chengdu, China
- 2School of Food Science and Technology, Shihezi University, Shihezi, China
- 3Institute of Agricultural Products Processing, Xinjiang Academy of Agricultural and Reclamation Science, Shihezi, China
- 4Department of Food Science, University of Massachusetts, Amherst, MA, United States
The rose hydrosol was extracted from Yunnan Dark Red Rose petals by steam distillation, and the extraction process was optimized by response surface methodology. Besides, volatile compounds in the rose hydrosol were analyzed by headspace solid phase microextraction-gas chromatography–mass spectrometry (HS-SPME-GC–MS) and its antioxidant activity was also verified. The results showed that the sensory score of rose hydrosol was the highest when the ratio of flower to liquid was 1:2 (w/v), the reflux time was 5 min, the distillation temperature was 120°C, and the concentration of sodium chloride was 3%. The scavenging rates of rose hydrosol on DPPH, ⋅OH and superoxide anion (⋅O2−) were 26.13, 55.56 and 10.76% respectively, the polyphenol content was 14.9 ± 2.5 GAE mg/g, and the content of flavonoids in pure dew was 19.3 ± 1.3 RE mg/g which indicated that the extracted rose hydrosol had adequate antioxidant activity. Our study provides a theoretical reference for the utilization of rose hydrosol in food and cosmetic fields.
Highlights
1. The volatile compounds in rose hydrosol were mainly alcohols and ethers.
2. The compounds with the highest predominance in rose hydrosol were methyl eugenol and β-phenylethanol, which provided a pleasant aroma.
3. The free radical scavenging ability results and the high content of polyphenols and flavonoids revealed that rose hydrosol had antioxidant activity.
1 Introduction
Rose (Rose rugosa Thunb.), which originated in China’s eastern coastal areas, Japan, the Korean Peninsula and the Russian Far East, is a shrub plant of the Rosaceae family (Gateva et al., 2024; Lee et al., 2018). Rose is mainly used for greening, ornamental purposes and production of essential oil. However, as a plant medicinal and culinary application, it has significant utilization value. Rose is high in vitamins, polysaccharides, minerals, and amino acids. Therefore, food industries have developed products such as rose cake, rose sauce (Xia et al., 2021), rose vinegar, and rose health beverages (Malek et al., 2024). As a medicinal material in Traditional Chinese Medicine, rose promotes blood circulation, improves blood flow, regulates the body’s ability to regulate its internal environment, relieves depression, and possesses a calming effect (Ba, 2024). In addition, rose can be used to prevent cardiovascular diseases, delay aging, and treat neurological diseases (Lee et al., 2018). Studies have shown that rose extract alleviates the stress caused by endurance exercise by reducing oxidative stress, which has been confirmed in a rat sleep deprivation stress model (Na et al., 2016). Dark Red Rose (Rosa chinensis Jacq ‘Crimson Glory’ H.T.), also known as Crimson Glory, is native to Germany and are mainly distributed in the Southwest China, such as Yunnan, Guizhou, and Sichuan Provinces. The flowers have large black and red patterns, possessing a velvety texture and emitting a strong rose fragrance.
Rose hydrosol is a by-product in the process of essential oil production. In other words, in the process of preparing essential oil by steam distillation, essential oil compounds are evaporated with steam, condensed, and layered to obtain both a light-phase essential oil and a heavy-phase water phase. The heavy phase is hydrosol (Qiu et al., 2023). Rose contains a high number of water-soluble volatile aromatic substances, including alcohols, acids, aldehydes, ethers, and esters, and a small number of flavonoids and minerals. These water-soluble compounds are effectively preserved during the extraction process of rose hydrosol. This preservation contributes to its multifunctional properties, including skin color improvement, moisturization, whitening, and antioxidation, making it highly valuable in cosmetic development (Chaudhuri et al., 2024). The water-soluble compounds in hydrosol are responsible for many of its activities. Zhang et al. (2017) have studied the antioxidant compounds in flowers of five Chimonanthus species. Among the five Chimonanthus species, C. praecox flower had the highest number of secondary metabolites and presented the most potent antioxidant activity. The other four flowers contained the same types of ingredients as C. praecox, but exhibited lower antioxidant activity. The main volatile compounds in rose hydrosol are β-phenylethanol, citronellol, geraniol, eugenol, linalool and rose ether (Zhao et al., 2016). The main methods for extracting rose hydrosol are steam distillation, solvent extraction, and supercritical CO2 extraction (Gateva et al., 2024). Rose hydrosol is favored by teenagers and most women because of its safety, aroma and antioxidant functions. Rose water is used as a condiment in South Asian countries and is also used to make rose milk drinks in Malaysia (Lee et al., 2018). Few studies have investigated the correlation between the antioxidant activity and phenolic compounds of rose hydrosol. Therefore, it is necessary to explore the correlation between polyphenols in rose hydrosol and its antioxidant capacity.
Utilizing steam distillation technology to extract safe and high-quality rose hydrosol enables its use as a supplementary ingredient in food. This approach is crucial not only for enhancing the social and economic value of roses but also for fostering growth in the aromatic plant industry and food sector. In this study, the volatile compounds and antioxidant activity of rose hydrosol were analyzed, offering insights that can guide the development of antioxidant products derived from hydrosols, improve resource utilization, and expand economic benefits.
2 Materials and methods
2.1 Source of raw materials
Yunnan Dark Red Rose, which was purchased from Yunnan Ouli Agricultural Development Co., Ltd., was produced in Eshan Yi Autonomous County, Yunnan Province. It was stored in the refrigerator (BCD-245D, Qingdao Haier Co., Ltd., Shandong, China) at 4°C until further analysis. We acquired 1,1-diphenyl-2-trinitrophenyl hydrazine (DPPH) and 2,2-linked nitrogen-di- (3-ethyl-benzothiazole-6-sulfonic acid) diammonium salt from Shanghai Yuanye Biotechnology Co., Ltd. NaCl and Na2CO3 were obtained from Tianjin Zhiyuan Chemical Reagent Co., Ltd. Rutin and vitamin E were purchased from Beijing Solaibao Technology Co., Ltd., and gallic acid, Folin–Ciocalteu (FC), sodium nitrite, and aluminum nitrate were purchased from Shanghai Maclin Biochemical Technology Co., Ltd. n-ketones C4–C9 standards were purchased from Sinopharm Chemical Reagent Beijing Co., Ltd. All these reagents are analytically pure.
2.2 Rose hydrosol preparation and extraction
Steam distillation was performed by method (Baibuch et al., 2023) with some modifications. Briefly, 40 g rose petals (mashed) were placed in a 500 mL distillation flask and mixed with 3% sodium chloride (4.8 g sodium chloride in 160 mL distilled water). The parameters of the electric heating furnace were the following: the condensation temperature was 0°C and the distillation time was 3 h. The condensate collected by distillation was centrifuged (1,500 r/min × 10 min) and separated from the oil. The upper layer was rose essential oil, and the lower layer was rose hydrosol stock solution. After aseptic filling, the obtained rose hydrosol samples were stored at 4 ± 2°C in the dark.
2.2.1 Single factor experiment on extraction of rose hydrosol
Steam distillation was performed by method (Baibuch et al., 2023) with some modifications. At 120°C and a flower-to-liquid ratio of 1:2 (w/v), rose hydrosol was subjected to reflux for 0, 5, 10, and 15 min. At the same temperature (120°C) and a reflux time of 5 min, the flower-to-liquid ratio varied as 1:1, 1:2, 1:3, and 1:4. Additionally, maintaining a reflux time of 5 min and a flower-to-liquid ratio of 1:2, the distillation temperature was set to 110, 120, 130, and 140°C.
2.2.2 Optimization of response surface methodology for extracting rose hydrosol
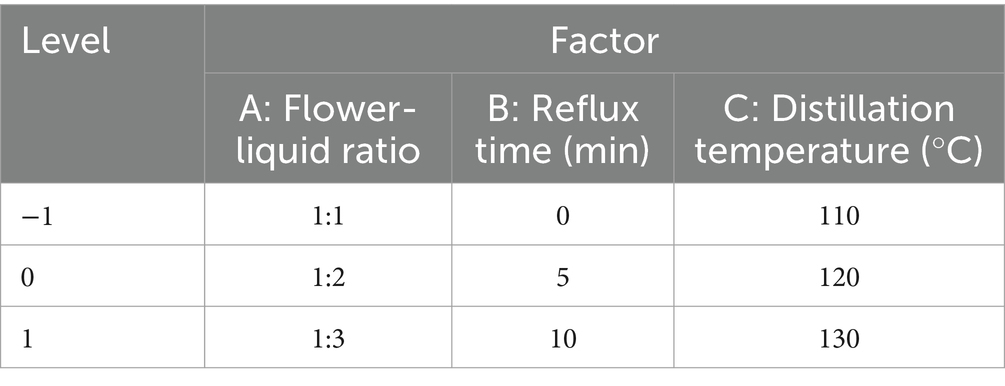
Based on the single factor experiment of extracting rose hydrosol and taking the factors of flower-liquid ratio (A), reflux time (B), and distillation temperature (C) as random factors and the sensory score as the response value (Y), we conducted response surface analysis with three factors and three levels. The experimental design is shown in Table 1.
2.2.3 Determination of ultimate process parameters by sensory evaluation index
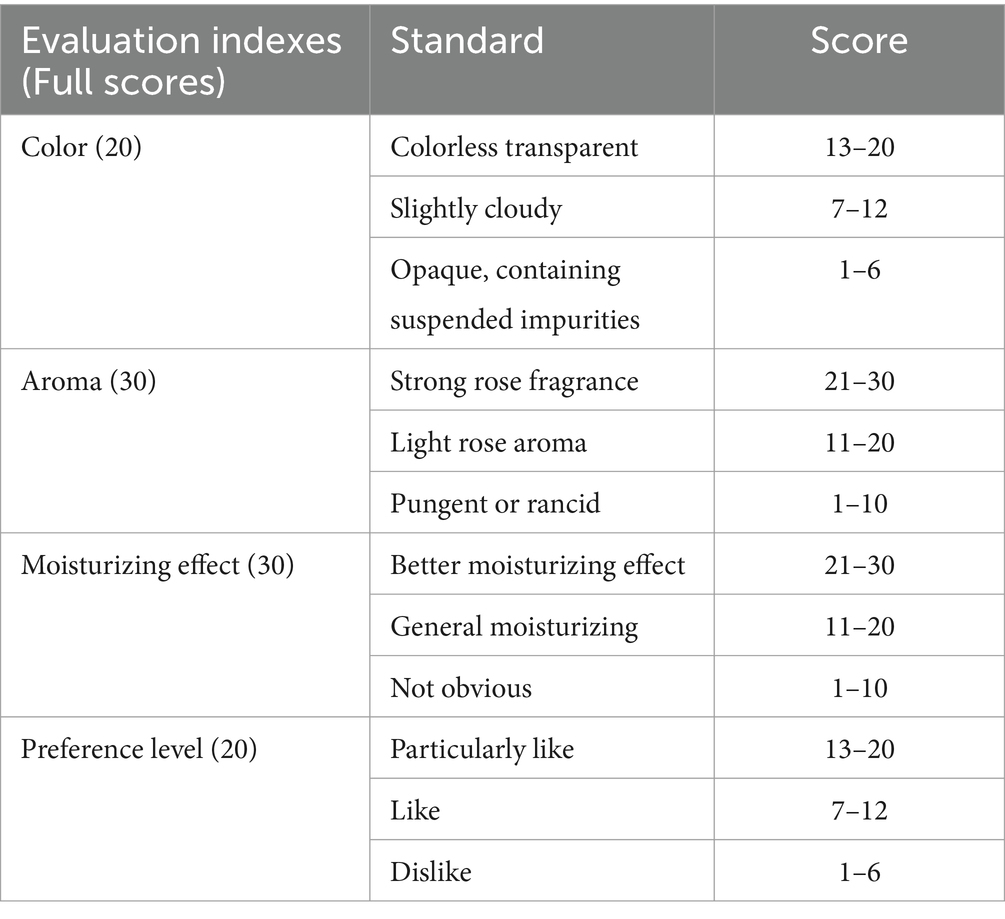
The study considered whether stamens were included in the optimum extraction process parameters. Four groups of control rose hydrosol products were established for sensory evaluation, as detailed in Table 2. The sensory indexes of rose hydrosol can directly influence consumer acceptance. Therefore, high-quality rose hydrosol can be guaranteed by sensory evaluation from three aspects: color, aroma, and moisturizing effect and preference level. Through this sensory index to determine the subsequent experiments, the extraction process parameters of rose hydrosol. For sensory evaluation, we selected six evaluators (the ratio of male to female was 1:1, and the average age was 22) from the laboratory. The evaluators underwent training and had no biased preferences, ensuring the reliability of the results. The sensory evaluation was carried out in a sensory evaluation laboratory at the Institute of Food Science and Technology of Shihezi University, in compliance with ISO 8589:2007 (Frangipane et al., 2024).
Samples (20 mL) were placed in a 50 mL beaker to observe the color and viscosity of rose hydrosol. Odorless absorbent paper was chosen, cut into strips measuring 8 cm in length and 4 cm in width, for odor evaluation of the samples. The sensory evaluation indexes are detailed in Table 2. Through the sensory evaluation of similar hydrosol products, four comprehensive indexes have been developed.
2.3 HS-SPME-GC–MS analysis
Volatile compounds were determined using headspace-gas chromatography–mass spectrometry (HS-GC–MS) equipped with an HT3 space sampler (Teledyne Tekmar) and a 7,890 B GC–MS gas chromatograph (Agilent Technologies). We performed HS-GS-MS as previously reported (Dai et al., 2024; Zhong et al., 2024) with some modifications. A PDMS extraction head was used to extract the volatile compounds of rose hydrosol. We added 3.00 g sodium chloride to the headspace bottle and removed 6 mL rose hydrosol sample into the headspace bottle. Subsequently, we added the rotor and covered the rubber plug, pressing the aluminum cover tightly. After stirring at 50°C for 15 min, we inserted the extraction head into the headspace bottle and performed the extraction for 30 min.
An HP-5MS chromatographic column (30 m × 0.25 mm × 0.25 mm) was used, Helium was the carrier gas, the flow rate was set to 1 mL/min, and the inlet temperature was 220°C. The initial injection temperature was 35°C and the initial holding time was 2 min. The temperature was increased to 80°C at 4°C/min, followed by an increase to 140°C at 2°C/min, and finally to 230°C at 5°C/min. The ion source was Electron impact (EI) with an electron energy of 70 eV. The ion source temperature was maintained at 240°C. The transmission line temperature was set at 240°C, with a scanning range from 30.00 to 550.00 amu.
All analyses were performed in triplicate. The Kovats’ retention index (KI) of each compound was calculated using n-ketones C4–C9 (Sinopharm Chemical Reagent Beijing Co., Ltd., Beijing, China) as external references. Volatile compounds were identified based on KI and retention time compared to the library and mass spectrum of the NIST 2014 (National Institute of Standards and Technology).
2.4 Determination of antioxidant activities
2.4.1 Determination of DPPH radical scavenging activity
DPPH radical scavenging activity was determined as previously reported (Chen et al., 2020) with some modifications. Vitamin C (Vc) control solutions were prepared with distilled water at concentrations of 0.10 mg/mL, 0.40 mg/mL, 0.80 mg/mL, 1.00 mg/mL, and 2.00 mg/mL. To measure the DPPH radical scavenging activity, 1 mL of each Vc solution and 1 mL of DPPH solution at various concentrations were mixed in test tubes, reacted for 30 min at room temperature in the dark, and A1 was measured at 517 nm. Additionally, 1 mL of ethanol was mixed with 1 mL of Vc solution to measure A2, and 1 mL of DPPH solution was mixed with 1 mL of distilled water to measure A3, both following the same procedure. The Vc solution was then replaced with rose hydrosol extracted under optimal conditions, and its DPPH free radical scavenging rate was determined using the same method. The DPPH radical scavenging rate of the rose hydrosol was compared with that of the different concentrations of Vc solution. Each group of samples was tested three times, and a microplate reader was used to measure the optical density of each sample. To calculate DPPH radical scavenging rate, we used the following formula:
where A1 is the absorbance value at 517 nm (1 mL of vitamin C [Vc] solution and 1 mL of DPPH solution reacted for 30 min at room temperature in the dark); A2 is the absorbance value at 517 nm (1 mL of ethanol and 1 mL of Vc solution reacted for 30 min at room temperature in the dark); and A3 is the absorbance value at 517 nm (1 mL of DPPH solution and 1 mL of distilled water reacted for 30 min at room temperature in the dark).
2.4.2 Determination of·OH radical scavenging activity
·OH radical scavenging activity was determined as previously reported (Ma et al., 2023) with some modifications. Vc control solutions were prepared with distilled water at concentrations of 0.10 mg/mL, 0.40 mg/mL, 0.80 mg/mL, 1.00 mg/mL, and 2.00 mg/mL. To measure the hydroxyl radical (·OH) scavenging activity, 1 mL of each Vc solution was mixed with 1 mL of FeSO4 (10.0 mmol/L) solution, 1 mL of salicylic acid-ethanol solution (10.0 mmol/L), and 1 mL of hydrogen peroxide solution (8.0 mmol/L) in a test tube. The mixture was reacted in a constant temperature water bath at 37°C for 30 min, allowed to stand for another 30 min, and A1 was measured at 510 nm. For the control measurements, distilled water was used instead of hydrogen peroxide solution to determine A2, and distilled water was used instead of the Vc solution to determine A3. The Vc solution was then replaced with rose hydrosol extracted under optimal conditions, and the hydroxyl radical scavenging rate was determined using the same method. The hydroxyl radical scavenging rates of rose hydrosol and Vc solutions at different concentrations were compared, with each group of samples being tested three times. To calculate ·OH radical scavenging activity, we used the following formula:
where, A1 is the absorbance value at 510 nm (1 mL of Vc solution, 1 mL FeSO4 solution, 1 mL of salicylic acid-ethanol solution and 1 mL of hydrogen peroxide solution reacted in a constant temperature water bath at 37°C for 30 min, and allowed to stand for 30 min); A2 is the absorbance value at 510 nm (hydrogen peroxide solution was replaced by distilled water solution); and A3 is the absorbance value at 510 nm (The Vc solution was replaced by distilled water solution).
2.4.3 Determination of ·O2− radical scavenging activity
⋅O2− radical scavenging activity was determined as previously reported (Bai et al., 2021) with some modifications. Control solutions of Vc were prepared in distilled water at concentrations of 0.10 mg/mL, 0.40 mg/mL, 0.80 mg/mL, 1.00 mg/mL, and 2.00 mg/mL. For the experimental procedure, 2 mL of each Vc solution with varying concentrations was mixed sequentially with 4.5 mL of Tris–HCl buffer (pH = 8.2, 50.0 mmol/L) and 0.5 mL of pyrogallol (25.0 mmol/L), thoroughly shaken, and incubated in a water bath at 25°C for 6 min. Following incubation, 1 mL of HCl (10.0 mmol/L) was added, mixed well, and A1 was measured at 325 nm. Control measurements were conducted using distilled water instead of pyrogallol to determine A2 and using distilled water instead of Vc solution to determine A3, following the same protocol. Subsequently, the Vc solution was substituted with rose hydrosol extracted under optimal conditions, and the scavenging rate of ⋅O2− free radicals was determined using the same method. The scavenging rates of ·O2− free radicals for rose hydrosol and Vc solutions at different concentrations were compared, with each sample group repeated three times. To calculate ·O2− radical scavenging activity, we used the following formula:
where A1 is absorbance value at 325 nm (2 mL of Vc solution, 4.5 mL Tris–HCl buffer, and 0.5 mL pyrogallol reacted in a water bath at 25°C for 6 min and mixed with 1 mL HCl); A2 is absorbance value at 325 nm (pyrogallol was replaced by distilled water); and A3 is absorbance value at 325 nm (Vc solution was replaced by distilled water).
2.4.4 Determination of polyphenol content
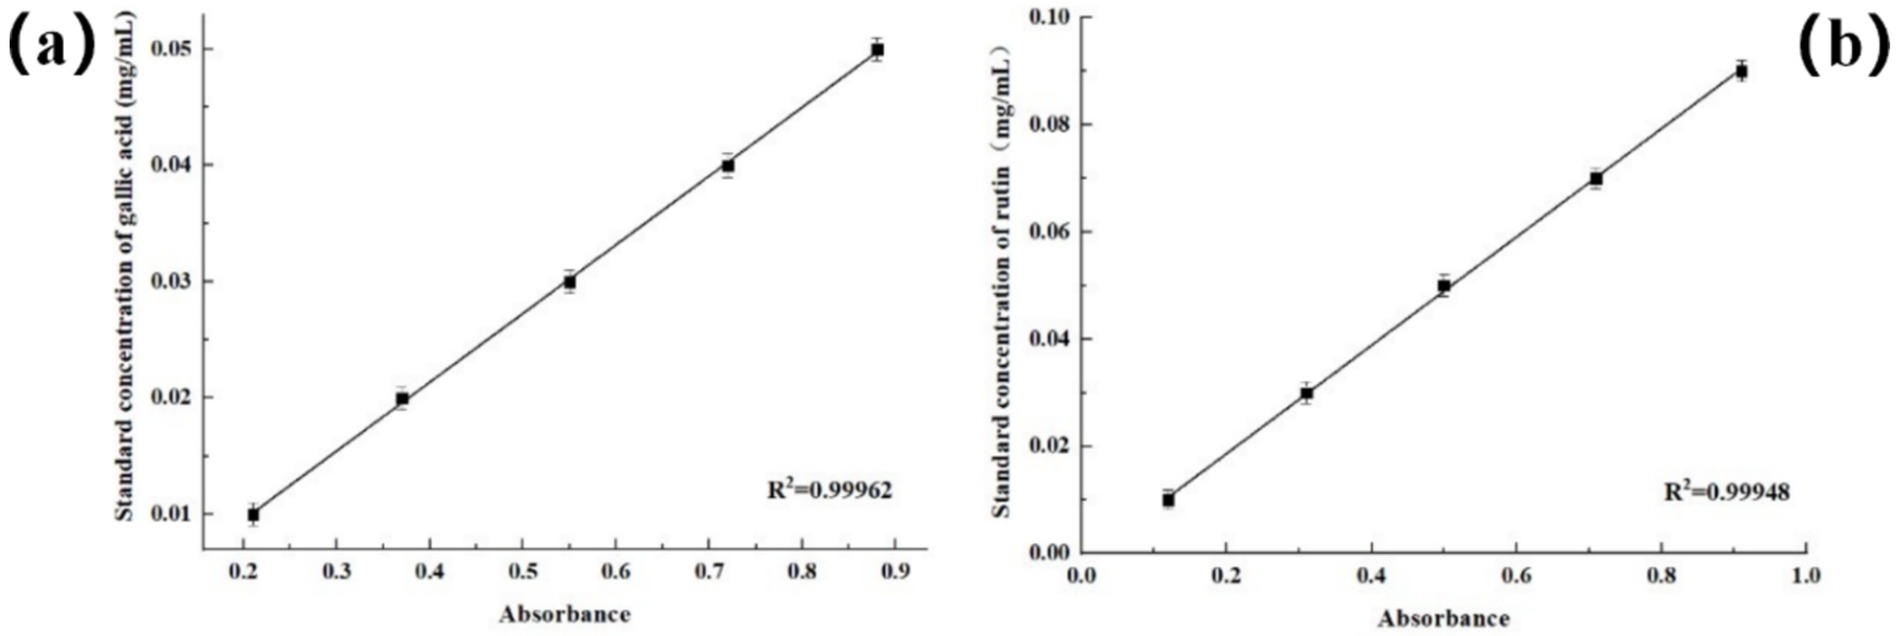
Polyphenol content was determined as previously reported (Blicharski and Oniszczuk, 2017) with some modifications. Standard solutions of gallic acid were prepared at concentrations of 0.01 mg/mL, 0.02 mg/mL, 0.03 mg/mL, 0.04 mg/mL, and 0.05 mg/mL. The polyphenol content in rose hydrosol was determined using Folin phenol colorimetry with gallic acid as the standard. Specifically, 1 mL of gallic acid solutions at the five concentrations was mixed with 5 mL of 10% Folin phenol reagent, allowed to stand for 7 min, followed by the addition of 4 mL of 7.5 g/100 mL sodium carbonate solution. The reaction proceeded at room temperature in the dark for 1 h, and absorbance was measured at 765 nm. A standard curve was constructed using distilled water as the blank control to establish the regression equation relating gallic acid concentration (y in mg/mL) to absorbance (x). The polyphenol content in rose hydrosol was determined by diluting 1 mL of the hydrosol to 100 mL with a volumetric flask and measuring absorbance using the same method as described above. The content of polyphenol in rose hydrosol was calculated according to the content of total phenol (mg/g) in each gram of rose (calculated by GAE).
where C is the content of polyphenols in the determination solution, mg/mL; V is the volume of the solution, mL; N is the dilution factor; and M is the weight of rose petals, g.
2.4.5 Determination of flavonoid content
Flavonoid content was determined as previously reported (Blicharski and Oniszczuk, 2017) with some modifications. A standard solution of rutin was prepared by weighing 25 mg of rutin standard and dissolving it in a 100 mL volumetric flask, adjusting the volume with ethanol to obtain a concentration of 0.25 mg/mL rutin. The flavonoid content in rose hydrosol was determined using the sodium nitrite-aluminum nitrate-sodium hydroxide color development method. Various volumes (0, 1.0, 3.0, 5.0, 7.0, 9.0 mL) of the rutin standard solution were transferred into 25 mL volumetric flasks, diluted to 15 mL with anhydrous ethanol, and then treated sequentially with 1 mL of 5% sodium nitrite solution for 5 min, followed by 1 mL of 10% aluminum nitrate solution for another 5 min, and finally with 5 mL of 10% sodium hydroxide solution before adjusting the volume to 25 mL with anhydrous ethanol. A standard curve was constructed using distilled water as a blank control to establish the regression equation correlating rutin concentration (y in mg/mL) to absorbance (x). The flavonoid content in rose hydrosol was calculated as rutin equivalent (RE) in mg/mL. To analyze the hydrosol, 1 mL was diluted 100 times in a 100 mL volumetric flask. The content of total flavonoids in rose hydrosol was calculated according to the content of total flavonoids (mg/g) per each gram of roses (calculated as RE).
where C is the content of flavonoids in the solution, mg/mL; V is the volume of the solutions, mL; N is the dilution factor; M is the weight of rose petals, g.
2.5 Statistical analysis
Antioxidant activity measurements were reported as mean ± standard deviation, with error bars in the figures representing the standard deviation. Statistical analysis was performed using SPSS software (version 26.0, IBM, New York, United States). One-way ANOVA was conducted, and statistical significance (p < 0.05) was determined using Duncan’s multiple range test. Data processing was carried out using Origin 2018, SPSS 25, and Microsoft Excel 2019.
3 Results and discussion
3.1 Analysis of single factor experiment on extraction of rose hydrosol
As shown in Table 3, when the flower-to-liquid ratio was 1:4, the fragrance of the rose hydrosol was diluted, resulting in a weaker and shorter-lasting scent. A longer reflux time produced rose hydrosol with a rich and long-lasting fragrance, but it also introduced an odor that compromised the original scent. Additionally, without any reflux time, the aroma of the rose hydrosol was weak. These experimental results indicate that both no reflux and excessively long reflux times negatively affect the fragrance quality of rose hydrosol. The optimal reflux time was found to be 5 min, yielding the best fragrance quality.
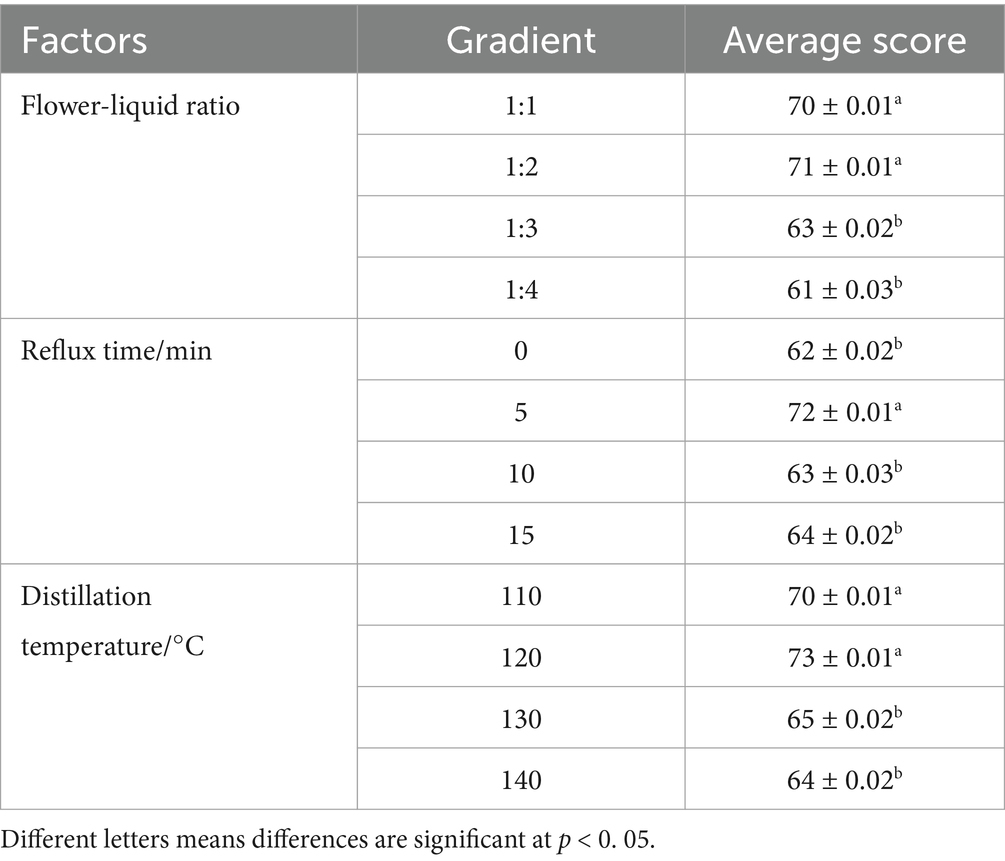
Table 3. Sensory scores of flower-liquid ratio, reflux time, and distillation temperature on of rose hydrosol.
When the distillation temperature was below 100° C, the extraction process was prolonged due to the slow evaporation rate of the steam. As seen in Table 3, at a distillation temperature of 120°C, the rose hydrosol achieved the highest sensory score of 73, followed by scores of 70, 65, and 64 at 110, 130, and 140°C, respectively. Therefore, the best extraction results were obtained at a distillation temperature of 120°C.
Based on the results of the single-factor test, we selected a flower-to-liquid ratio of 1:1, 1:2, and 1:3, reflux times of 0, 5, and 10 min, and distillation temperatures of 110, 120, and 130°C for the follow-up response surface methodology experiment.
3.2 Analysis of optimization of response surface methodology for extracting rose hydrosol
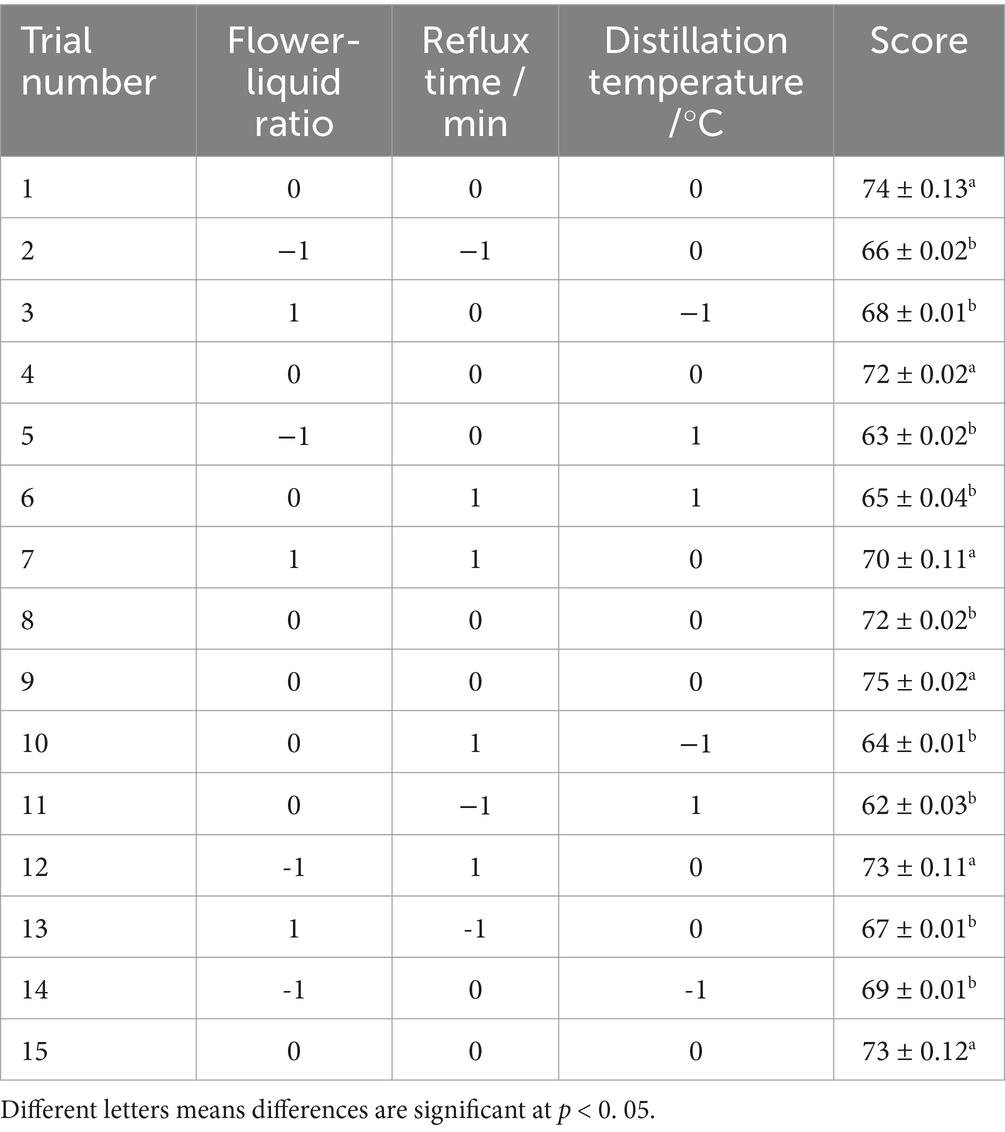
Based on the optimal flower-to-liquid ratio, reflux time, and distillation temperature determined from the single-factor experiments, the extraction conditions for rose hydrosol were further optimized using RSM. The sensory score of rose hydrosol was used as the evaluation index, and the experiment was designed using the Box–Behnken method. This involved a response surface analysis of three factors at three levels each. The experimental scheme and results are presented in Table 4.
As shown in Table 4, the highest comprehensive sensory score for the extracted rose hydrosol was achieved with a flower-to-liquid ratio of 1:2, a reflux time of 5 min, and a distillation temperature of 120°C. The scores exceeded 70, indicating high-quality rose hydrosol under these conditions.
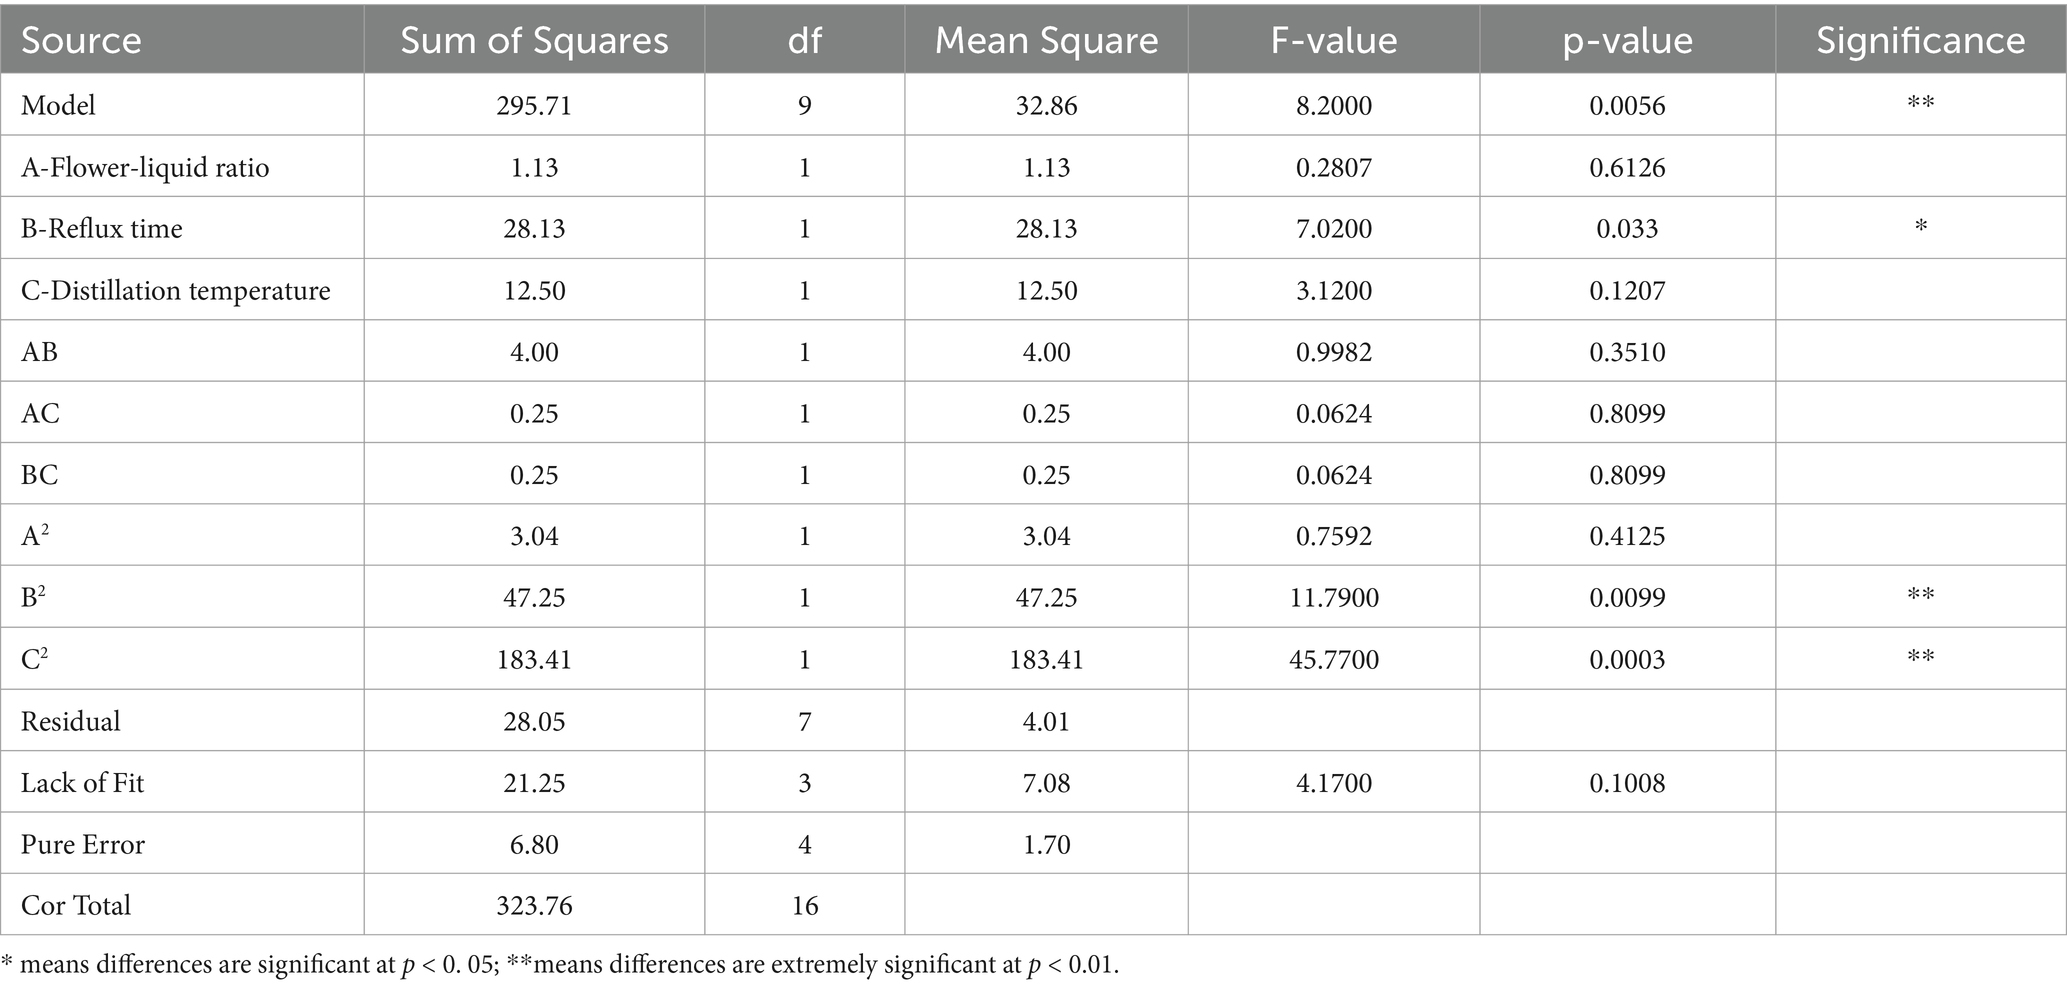
Using Design-Expert software, the experimental data were processed, and a regression equation was established. The independent variables were the flower-liquid ratio (A), reflux time (B), and distillation temperature (C), while the dependent variable was the comprehensive sensory score (Y) of the rose hydrosol. The regression equation is as follows: Y = 73.20–0.38A + 1.88B-1.25C-1.00AB + 0.25 AC + 0.25 BC-0.85A2-3.35B2-6.60C2.
As shown in Table 5, the p-value for the model was 0.0056, indicating significant results (p < 0.01). The linear effects of flower-liquid ratio (A) and distillation temperature (C) on the sensory score were not significant, whereas the linear effect of reflux time (B) was significant. Among the quadratic terms, only A2 and B2 had significant effects on the sensory score. The model’s R-squared value (R2 = 0.9134) and adjusted R-squared value (R2adj = 0.8020) showed that the model fit the actual data well, with minimal error, accurately reflecting the relationship between the extraction parameters and the sensory score.
The F-value analysis indicated that within the experimental range, the factors influencing the quality of rose hydrosol in descending order were reflux time (B), distillation temperature (C), and flower-liquid ratio (A). Response surface diagrams generated using Design-Expert software (Figure 1) illustrated the impact of each factor on the sensory score. The steep surface of the diagram for reflux time indicated its significant effect on the sensory score, followed by the gentler surface for distillation temperature.
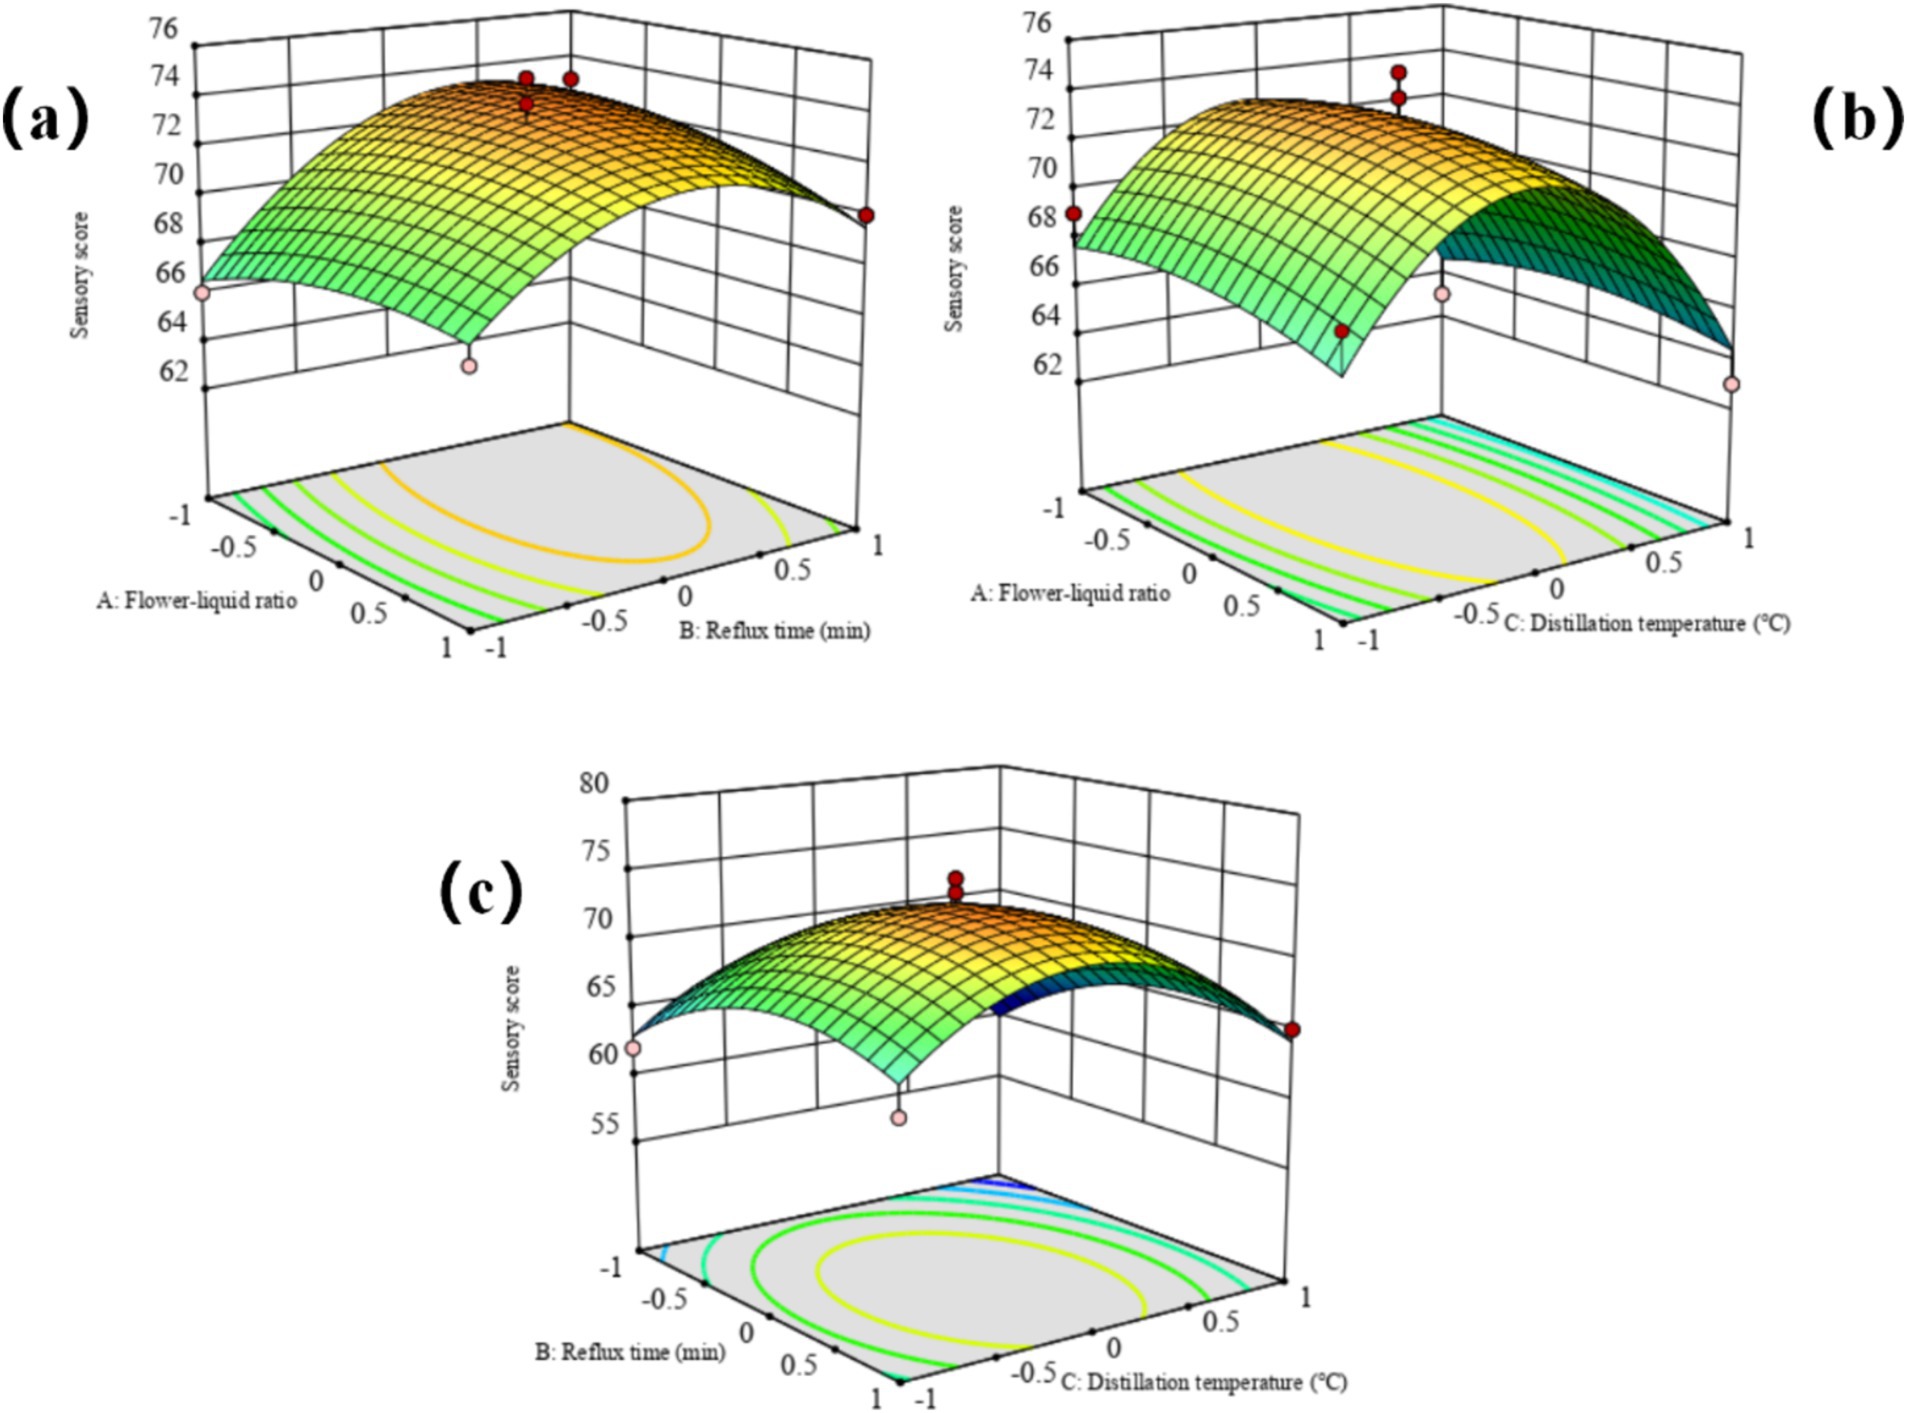
Figure 1. Response surface plots of the interactive effects of various factors on sensory score of rose hydrosol. (A) Flower-liquid ratio, (B) Reflux time (min), (C) Distillation temperature (°C).
3.3 Analysis of ultimate process parameters by sensory evaluation index
Under the optimal extraction conditions of rose hydrosol obtained through the above experiments, we explored the effects of rose stamen on the sensory score of rose hydrosol. Six evaluators analyzed and scored the rose hydrosol extracted by four different methods (Table 6) according to scoring standards (Table 2). The evaluation results are shown in Table 6. The rose hydrosol from group 1 was colorless, transparent, rich in fragrance, and favored by the evaluators. This extraction method did not include stamens, and the concentration of sodium chloride was 3%. Therefore, in the following experiments, the rose hydrosol was extracted under the following extraction conditions: no stamens, a fixed flower-liquid ratio of 1:2, a reflux time of 5 min, a distillation temperature of 120°C, and a sodium chloride concentration of 3%. We measured antioxidant indexes and flavor of the rose hydrosol under these extraction conditions. The optimal distillation conditions obtained were close to the model prediction, which showed that the ultimate optimized process parameters were reasonable and feasible and could be used for large-scale extraction of rose hydrosol.
3.4 Analysis of volatile compounds
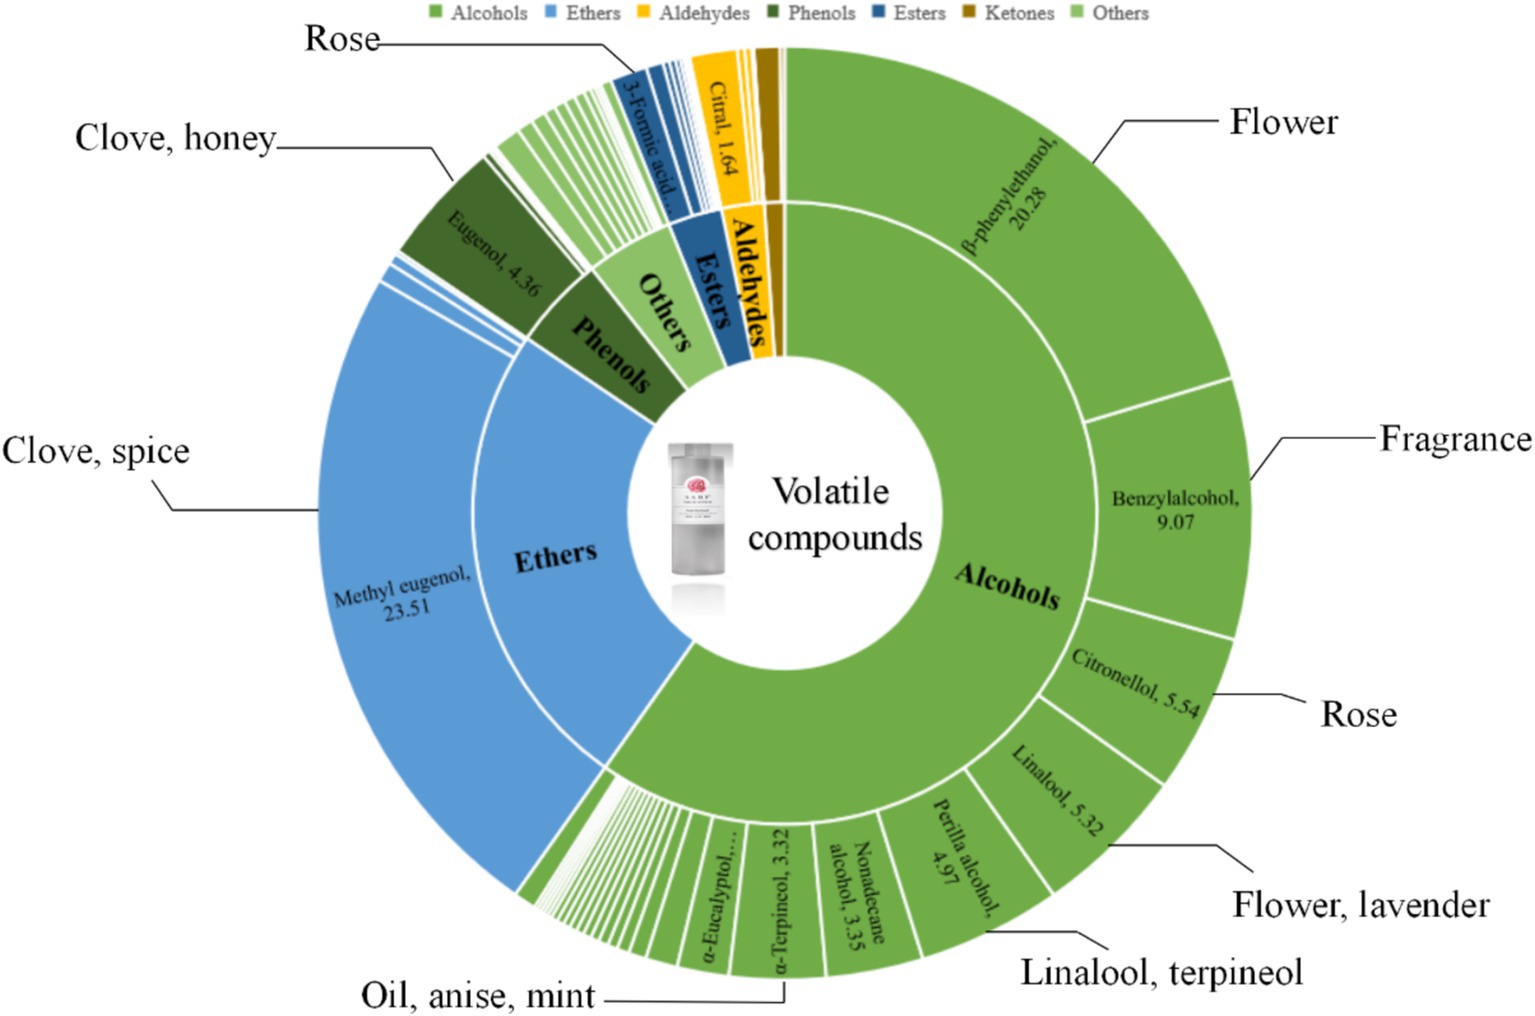
The volatile compounds of rose hydrosol were systematically analyzed using headspace solid-phase microextraction (HS-SPME) combined with gas chromatography–mass spectrometry (GC–MS). The compounds were identified by searching the NIST17.L library configured in the GC–MS system, and the mass spectrum data of each component were analyzed. The relative mass percentage of each component was measured using the peak area normalization method. The total ion current chromatogram of rose hydrosol is shown in Figure 2. A total of 86 volatile substances were identified, including alcohols, phenols, and aldehydes.
As seen in Tables 7, a total of 43 alcohol compounds were identified in rose hydrosol, making them the primary volatile substances. These included β-phenylethanol, benzyl alcohol, citronellol, linalool, perilla alcohol, and α-terpineol. Phenylethanol and β-citronellol contributed significantly to the characteristic rose fragrance, with phenylethanol imparting a sweet honey aroma. β-citronellol, known for its elegant rose scent, has antimicrobial properties against Staphylococcus aureus and Salmonella typhi and is widely used in cosmetics (D'Angiolillo et al., 2018). Phenylethanol and β-citronellol are the main sources of the rose fragrance in rose hydrosol.
Four ether compounds were identified: eugenol methyl ether, 4-methyl anisole (MSO), isoeugenol methyl ether, and allyl benzyl ether. Eugenol methyl ether was the most abundant, constituting 23.51% of the volatile compounds. This compound imparts a sweet rose fragrance with a hint of lilac. Some studies have reported that phenylethanol is the most abundant component and can vary depending on the rose variety, origin, harvest season, and extraction method (Gateva et al., 2024; Hassan et al., 2024).
Six phenols were identified, including eugenol, 2,4-di-tert-butylphenol, isoasphenol, 5-anisol, 2-(1,1-dimethyl-2-propenyl)-3,6-dimethylphenol, and 2,6-di-tert-butyl-p-cresol (BHT), with eugenol comprising 4.36% of the volatile substances. Five aldehydes were identified: citral, 3-furaldehyde, 3-cyclohexene−1-acetaldehyde, benzaldehyde, and long leaf aldehyde. Citral, with its lemon scent, adds a fresh note to the rose hydrosol (D'Angiolillo et al., 2018).
Two ketones, damascenone and 2,7-dimethyl-(2H)-benzofuranone, were identified. The content of damascenone in Yunnan Dark Red Rose is only 0.89%, distinguishing it from other rose varieties. Nine esters, including 3-methyl amyl formate, butyl trans-3-ene phthalate, methyl docosahexaenoic acid, and dibutyl phthalate, were present but in low quantities, likely due to residual essential oil components, and had minimal impact on the overall fragrance.
From Figure 3 and Table 7, it is evident that alcohols are the most abundant substances in rose hydrosol, comprising 58.7%. Compounds such as β-phenylethanol, benzyl alcohol, citronellol, linalool, perilla alcohol, and α-terpineol significantly contribute to the rose hydrosol’s aroma. Ethers are the second most abundant group, with eugenol methyl ether being the most prevalent at 23.51%. Phenols account for 4.9%, with eugenol being the highest at 4.36%. Esters, ketones, aldehydes, and other substances make up 2.8, 1.1, 3.3, and 4.6%, respectively, none of which are prominent volatile substances.
3.5 Analysis of antioxidant activities
3.5.1 Analysis of DPPH, ·OH, and ·O2− radical scavenging activity
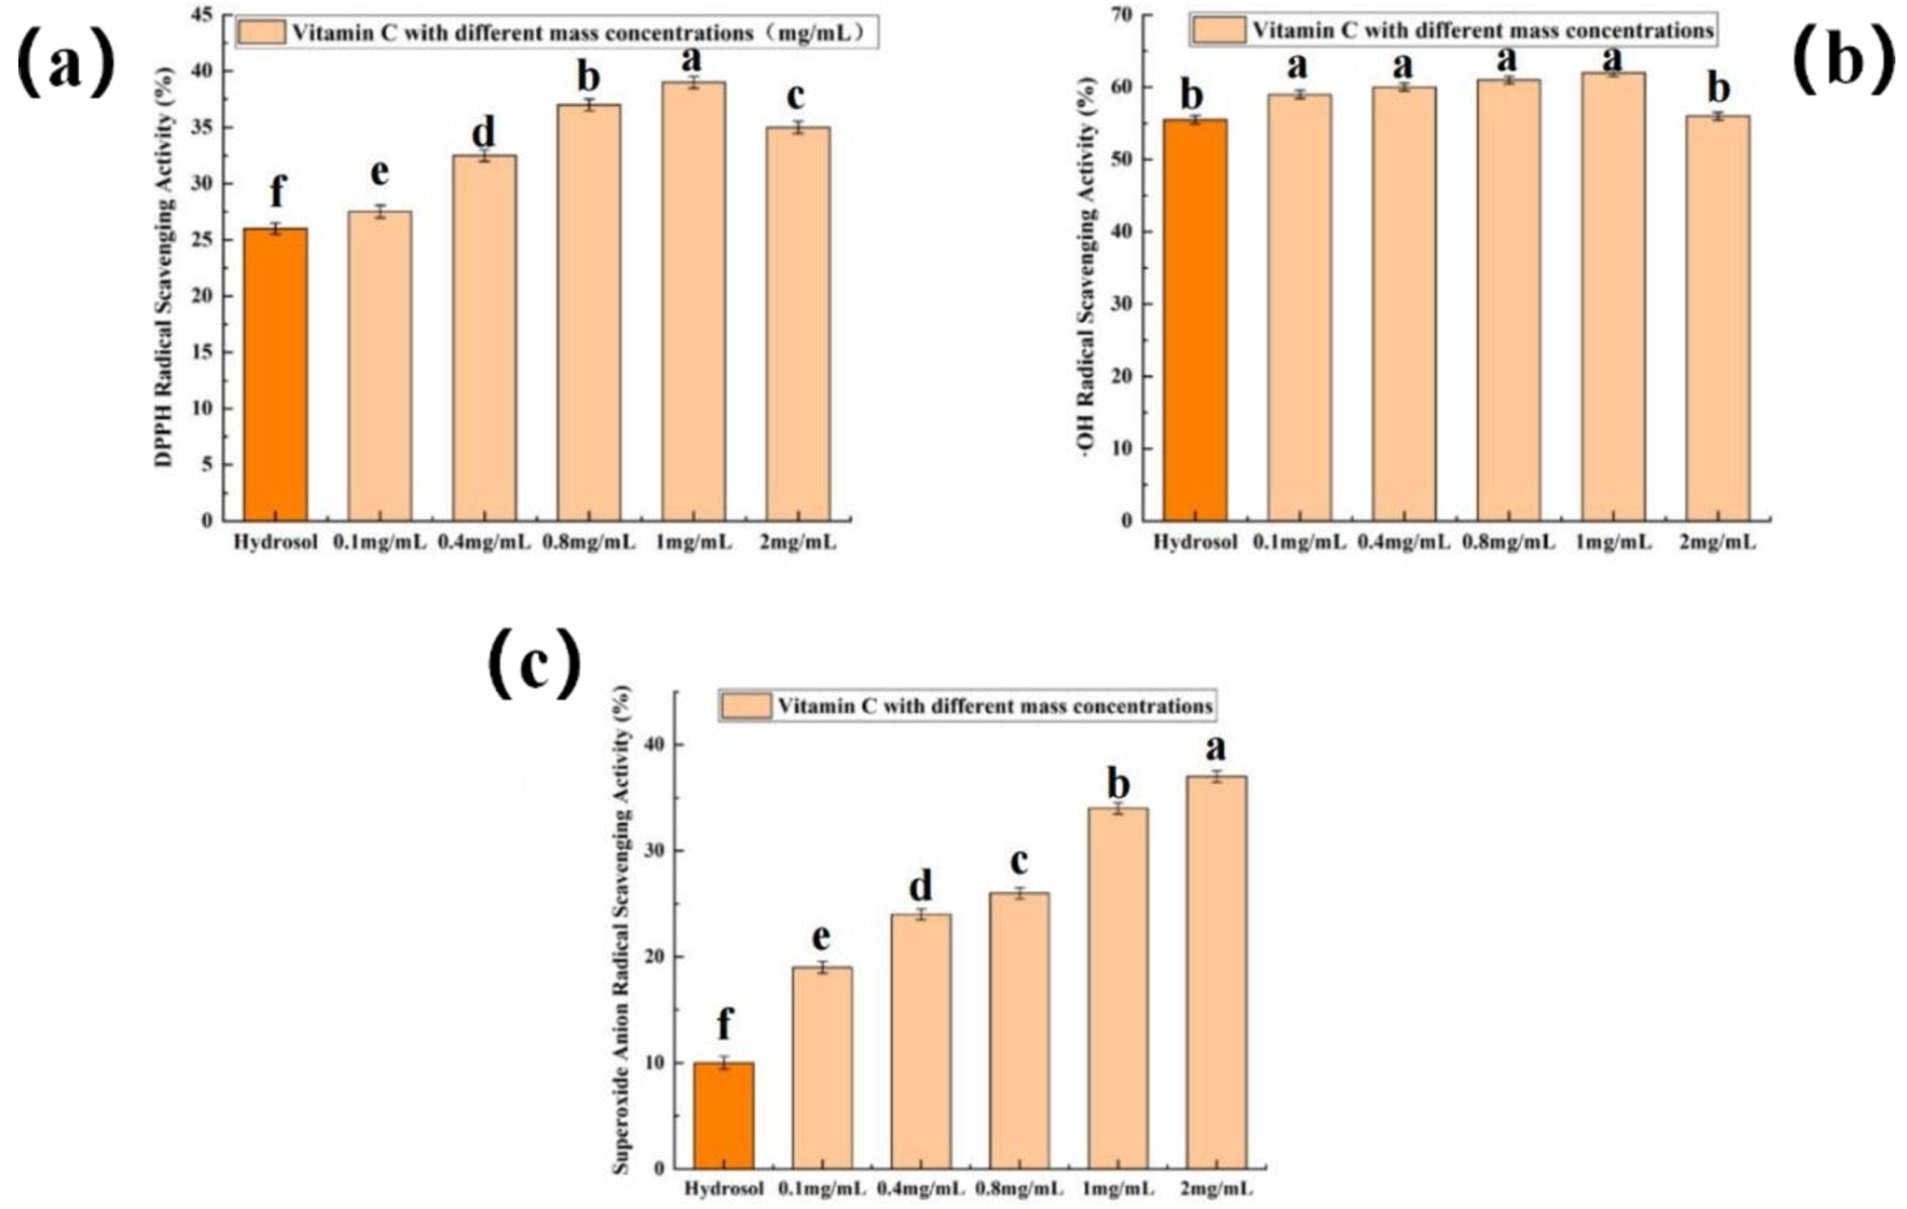
DPPH is a singlet electron with strong oxidation ability. When it is dissolved in water, it is blue-purple, and the solution has the maximum absorption at 517 nm. When antioxidant is added to the solution, the antioxidant can pair with DPPH, and the stronger the pairing ability is, the smaller the absorbance will be (Chen et al., 2020). Therefore, the ability of antioxidant to scavenge DPPH can be judged by measuring the absorbance. Figure 4A showed that the DPPH scavenging rate increased with increasing Vc concentration (0.1–1 mg/mL). The scavenging rate of rose hydrosol to DPPH was 26.13%, which was similar to that of 0.1 mg/mL Vc. This indicated that rose hydrosol possessed a notable ability to scavenge DPPH and had great potential for use as a natural antioxidant. Antioxidants in food have an important influence on the scavenging ability of hydroxyl radicals (Hassan et al., 2024). From Figure 4B, when the concentration of Vc was in the range of 0.1–1.6 mg/mL, the scavenging rate of p-OH radical was increasing with the increase of Vc concentration, and it increased slowly, basically floating around 60%. The scavenging rate of rose hydrosol on ·OH was 55.56%, which showed that rose hydrosol had antioxidant activity in vitro. By detecting the hydroxyl radical scavenging ability of different antioxidants, we can evaluate their antioxidant effects and provide basis for the screening and development of antioxidants (Hassan et al., 2024). As shown in Figure 4C, the scavenging ability of Vc for ⋅O2− increased with Vc concentration. The scavenging rate of rose hydrosol for superoxide radicals was 10.76%, demonstrating a weaker, yet notable, antioxidant activity. This finding is consistent with previous studies (Gateva et al., 2024).
3.5.2 Analysis of polyphenol and flavonoid content
Polyphenols and flavonoids are a large class of components with antioxidant effects. Mainly due to the fact that they contain multiple phenolic hydroxyl structures. Phenolic hydroxyl groups have strong redox ability and can react with free radicals, thus reducing the damage of free radicals to biomolecules (Hassan et al., 2024). From the gallic acid standard curve (Figure 5), we obtained a linear regression equation y = 0.05915x - 0.0023 (R2 = 0.9996). The polyphenol content in rose hydrosol was 14.9 ± 2.5 GAE mg/g; however, the long transport times of raw materials might reduce the polyphenol content. The polyphenols in rose hydrosol had antioxidant activity, consistent with a previous study (Alonso et al., 2022). From the rutin standard curve (Figure 5), we obtained a linear regression equation y = 0.10097x - 0.00149 (R2 = 0.9995), and the content of flavonoids in rose hydrosol was 19.3 ± 1.3 RE mg/g, which was consistent with a previous study (Alonso et al., 2022). The content of flavonoids may be reduced due to the long transport time of raw materials, the temperature difference between the origin of the roses and the laboratory, and the extended duration of the experiment.
3.6 Exploration on correlation between antioxidant activities and polyphenols
Oxidative stress can have damaging effects on the skin (Hassan et al., 2024; Wu et al., 2024) including causing skin aging, free radical damage, inflammation, and even potentially carcinogenic effects. Phenolics, which are commonly found in natural products, have attracted considerable interest due to their exceptional antioxidant properties. These compounds contain one or more hydroxyl groups on the benzene ring. Baijiu, the oldest distilled spirit in the world, is rich in phenolics compared to other reported trace constituents (He et al., 2021). Studies in vitro have demonstrated its strong ability to scavenge free radicals (Wu et al., 2023). Interestingly, a study revealed that rose hydrosol, in addition to being abundant in various flavor compounds, contains phenolics among its volatiles (Table 7). It is notable that the distillation process used to produce rose hydrosol is similar to that used in liquor production. Considering this correlation, further investigation is warranted to explore the relationship between the types and quantities of polyphenols in rose hydrosol and their antioxidant properties.
4 Conclusion
Through the single factor experiment, the extraction process of rose hydrosol was optimized by response surface Box–Behnken analysis. According to the prediction results of the model, the optimal ratio of flower to liquid was 1:2, the reflux time was 5 min, and the distillation temperature was 120°C. The optimal distillation conditions obtained were close to the model prediction, which showed that the final optimized process parameters are reasonable and feasible and can be used for large-scale extraction of rose hydrosol. Based on the optimal technological parameters for the extraction of rose hydrosol, several groups of experiments were carried out, and through sensory evaluation, the extraction parameters with the best color and the strongest aroma of rose were selected. By analyzing the volatile compounds of rose hydrosol and studying its antioxidant activity, we can establish a theoretical basis for developing new technologies, optimizing rose hydrosol quality, and maximizing the product’s value.
Data availability statement
The original contributions presented in the study are included in the article/supplementary material, further inquiries can be directed to the corresponding authors.
Author contributions
YW: Conceptualization, Data curation, Formal analysis, Methodology, Software, Writing – original draft. CX: Formal analysis, Investigation, Writing – original draft. ZZ: Investigation, Software, Writing – review & editing. WL: Funding acquisition, Project administration, Resources, Software, Writing – original draft. CW: Supervision, Visualization, Writing – review & editing. YY: Investigation, Writing – original draft. ZL: Conceptualization, Resources, Writing – original draft. TW: Investigation, Resources, Writing – original draft. NZ: Software, Writing – original draft. HX: _.
Funding
The author(s) declare that financial support was received for the research, authorship, and/or publication of this article. This work was supported by the Special Project of Technological Innovation System Construction in Hebei Province (Counterpart Assistance) [Grant No. 2019-400409], Sichuan Science and Technology Department Regional Innovation Cooperation Project [Grant No. 24QYCX0265].
Acknowledgments
We are grateful to International Science Editing (http://www.internationalscienceediting.com) for editing this manuscript.
Conflict of interest
The authors declare that the research was conducted in the absence of any commercial or financial relationships that could be construed as a potential conflict of interest.
Publisher’s note
All claims expressed in this article are solely those of the authors and do not necessarily represent those of their affiliated organizations, or those of the publisher, the editors and the reviewers. Any product that may be evaluated in this article, or claim that may be made by its manufacturer, is not guaranteed or endorsed by the publisher.
References
Alonso, A. M., Reyes-Maldonado, O. K., Puebla-Pérez, A. M., Arreola, M. P. G., Velasco-Ramírez, S. F., Zúñiga-Mayo, V., et al. (2022). GC/MS analysis, antioxidant activity, and antimicrobial effect of Pelargonium peltatum (Geraniaceae). Molecules 27:436. doi: 10.3390/molecules27113436
Bai, Z. Z., Ni, J., Tang, J. M., Sun, D. Y., Yan, Z. G., Zhang, J., et al. (2021). Bioactive components, antioxidant and antimicrobial activities of Paeonia rockii fruit during development. Food Chem. 343:128444. doi: 10.1016/j.foodchem.2020.128444
Baibuch, S., Zema, P., Bonifazi, E., Cabrera, G., Portocarrero, A. D. M., Campos, C., et al. (2023). Effect of the drying method and optimization of extraction on antioxidant activity and phenolic of rose petals. Antioxidants 12:681. doi: 10.3390/antiox12030681
Blicharski, T., and Oniszczuk, A. (2017). Extraction methods for the isolation of Isoflavonoids from plant material. Open Chem. 15, 34–45. doi: 10.1515/chem-2017-0005
Chaudhuri, P., Zeeshan, M., Wakchaure, N., Prajapati, D., Jayswal, T., Patel, S., et al. (2024). Novel drying cum floral water extraction technique for rose petals. Dry. Technol. 42, 685–695. doi: 10.1080/07373937.2024.2301939
Chen, X., Liang, L., and Han, C. (2020). Borate suppresses the scavenging activity of gallic acid and plant polyphenol extracts on DPPH radical: a potential interference to DPPH assay. Lwt Food Sci. Technol. 131:109769. doi: 10.1016/j.lwt.2020.109769
Dai, L., Yang, L., Li, Y., Li, S., Yang, D., Li, Y., et al. (2024). Origin differentiation based on volatile constituents of genuine medicinal materials L. via HS-GC-MS, response surface methodology, and chemometrics. Phytochem. Anal. 35, 567–578. doi: 10.1002/pca.3313
D'Angiolillo, F., Mammano, M. M., and Fascella, G. (2018). Pigments, polyphenols and antioxidant activity of leaf extracts from four wild rose species grown in Sicily. Notulae Botanicae Horti Agrobotanici Cluj Napoca 46, 402–409. doi: 10.15835/nbha46211061
Frangipane, M. T., Garzoli, S., de Vita, D., Massantini, R., and Corona, P. (2024). Identifying the sensory profile and fatty acid composition for quality valorization of Marrone chestnut cultivars. Eur. Food Res. Technol. 250, 2837–2847. doi: 10.1007/s00217-024-04579-9
Gateva, S., Jovtchev, G., Angelova, T., Gerasimova, T., Dobreva, A., and Mileva, M. (2024). Genotoxic and anti-genotoxic potential of hydrosols from water-steam distillation of oil-bearing roses Rosa centifolia L. and Rosa gallica L. from Bulgaria. Pharmaceuticals 17:657. doi: 10.3390/ph17050657
Hassan, J., Koohi, M. K., Sharifzadeh, A., Babaei, M., Moghadam, S., and Sharestani, A. P. (2024). Extraction and purification of oleuropein from olive leaves. Nat. Prod. Res. 1, 1–9. doi: 10.1080/14786419.2024.2345754
He, X., Huang, Y. M., Górska-Horczyczak, E., Wierzbicka, A., and Jelen, H. H. (2021). Rapid analysis of baijiu volatile compounds fingerprint for their aroma and regional origin authenticity assessment. Food Chem. 337:128002. doi: 10.1016/j.foodchem.2020.128002
Lee, M. H., Nam, T. G., Lee, I., Shin, E. J., Han, A. R., Lee, P., et al. (2018). Skin anti-inflammatory activity of rose petal extract (Rosa gallica) through reduction of MAPK signaling pathway. Food Sci. Nutr. 6, 2560–2567. doi: 10.1002/fsn3.870
Ma, R. J., Cao, T. Q., An, H. X., Yu, S. S., Ji, H. Y., and Liu, A. J. (2023). Extraction, purification, structure, and antioxidant activity of polysaccharide from Rhodiola rosea. J. Mol. Struct. 1283:135310. doi: 10.1016/j.molstruc.2023.135310
Malek, M. A., Gowda, S. G. B., Gowda, D., and Hui, S. P. (2024). Analysis of lipid composition and characterization of acyl steryl glycosides in rose petals by using nontargeted LC/MS. J. Food Meas. Charact. 18, 2385–2396. doi: 10.1007/s11694-023-02329-1
Na, J. R., Oh, D. R., Han, S., Kim, Y. J., Choi, E., Bae, D., et al. (2016). Antistress effects of Rosa rugosa Thunb. On Total sleep deprivation-induced anxiety-like behavior and cognitive dysfunction in rat: possible mechanism of action of 5-HT6 receptor antagonist. J. Med. Food 19, 870–881. doi: 10.1089/jmf.2016.3660
Qiu, L. Q., Zhang, M., Adhikari, B., and Chang, L. (2023). Microencapsulation of rose essential oil using Perilla protein isolate-sodium alginate complex Coacervates and application of microcapsules to preserve ground beef. Food Bioprocess Technol. 16, 368–381. doi: 10.1007/s11947-022-02944-8
Wu, Y. S., Chen, H., Sun, Y., Huang, H., Chen, Y. Y., Hong, J. X., et al. (2023). Integration of Chemometrics and sensory metabolomics to validate quality factors of aged baijiu (Nianfen baijiu) with emphasis on long-chain fatty acid ethyl esters. Food Secur. 12:87. doi: 10.3390/foods12163087
Wu, D., Yang, Z. H., Li, J., Huang, H. L., Xia, Q. L., Ye, X. Q., et al. (2024). Optimizing the solvent selection of the ultrasound-assisted extraction of sea buckthorn (Hippophae rhamnoides L.) pomace: phenolic profiles and antioxidant activity. Food Secur. 13:482. doi: 10.3390/foods13030482
Xia, A. N., Tang, X. J., Dong, G. Z., Lei, S. M., Liu, Y. G., and Tian, X. M. (2021). Quality assessment of fermented rose jams based on physicochemical properties, HS-GC-MS and HS-GC-IMS. Lwt Food Sci. Technol. 151:112153. doi: 10.1016/j.lwt.2021.112153
Zhang, X. F., Xu, M., Zhang, J. W., Wu, L. S., Liu, J. J., and Si, J. P. (2017). Identification and evaluation of antioxidant components in the flowers of five Chimonanthus species. Ind. Crop. Prod. 102, 164–172. doi: 10.1016/j.indcrop.2017.03.014
Zhao, C. Y., Xue, J., Cai, X. D., Guo, L., Li, B., and Wu, S. (2016). Assessment of the key aroma compounds in rose-based products. J. Food Drug Anal. 24, 471–476. doi: 10.1016/j.jfda.2016.02.013
Keywords: rose hydrosol, headspace solid-phase microextraction-chromatography-mass spectrometry (HS-SPME-GC–MS), volatile compounds, antioxidant activity, response surface methodology
Citation: Wan Y, Xu C, Zhu Z, Liu W, Wei C, Yi Y, Liu Z, Wang T, Zhu N and Xiao H (2024) Extraction of rose hydrosol from Yunnan Dark Red Rose by steam distillation: optimization, antioxidant activity, and flavor assessment. Front. Sustain. Food Syst. 8:1496327. doi: 10.3389/fsufs.2024.1496327
Edited by:
Poonam Sharma, Integral University, IndiaReviewed by:
Saroj Kumar Giri, Central Institute of Agricultural Engineering (ICAR), IndiaHaroon Elrasheid Tahir, Jiangsu University, China
Copyright © 2024 Wan, Xu, Zhu, Liu, Wei, Yi, Liu, Wang, Zhu and Xiao. This is an open-access article distributed under the terms of the Creative Commons Attribution License (CC BY). The use, distribution or reproduction in other forums is permitted, provided the original author(s) and the copyright owner(s) are credited and that the original publication in this journal is cited, in accordance with accepted academic practice. No use, distribution or reproduction is permitted which does not comply with these terms.
*Correspondence: Zhongyan Zhu, emh1enlAc2N0dS5lZHUuY24=; Wenyu Liu, bGl1d2VueXVjY0AxMjYuY29t
†These authors have contributed equally to this work
 Yilai Wan1,2†
 Chengjian Xu
 Zhongyan Zhu