
95% of researchers rate our articles as excellent or good
Learn more about the work of our research integrity team to safeguard the quality of each article we publish.
Find out more
ORIGINAL RESEARCH article
Front. Sustain. Food Syst. , 17 December 2024
Sec. Climate-Smart Food Systems
Volume 8 - 2024 | https://doi.org/10.3389/fsufs.2024.1492883
 Niangjijia Nyangchak1*
 Motso Yang2
Green agriculture is critical for tackling climate change by ensuring carbon neutrality and food security. This article assesses green agriculture as a response to climate change through green efficiency and the underlying mechanisms of green agricultural development in China’s Qinghai Province from 2000 to 2021. It employs a non-radial and non-oriented DEA model, super Slacks-Based Measure, to gage green efficiency. The Logarithmic Mean Divisia Index decomposition model and the Tapio decoupling model are utilized to further analyze the influencing factors and trends in greening the agriculture. Field research has been conducted to gain a holistic understanding of the intricate factors steering sustainable agriculture. The study reveals that Qinghai’s journey in greening agriculture is marked by distinct stages: stabilization (2000–2008), deterioration (2009–2016), recovery (2017–2019), and efficient stage (2020–2021). Notably, shifts in policies and input structures have influenced the green efficiency in agricultural production. The province has largely retained strong decoupling since 2012, indicating the effectiveness of sustainable practices in mitigating the detrimental impacts of intensive farming. The study also identifies economic growth as the primary factor negatively impacting green efficiency, followed by energy intensity, carbon intensity, and population scale. Finally, the study outlines policy insights for greening agriculture.
Green agriculture embodies a holistic approach to agricultural practices and climate change rooted in sustainability principles. Its primary goal is to ensure food security for all by reducing the strain on natural resources and mitigating environmental degradation through rapid recycling and limiting external inputs (Food and Agriculture Organization of the United Nations (FAO), 2023). This approach necessitates the adaptation of tools, techniques, and knowledge to the specific climate and ecological conditions of regions (Food and Agriculture Organization of the United Nations (FAO), 2023). This shift is urgently needed due to the ecological footprint of conventional agriculture. It also contributes to poverty reduction, enhances livelihoods, and meets nutritional needs through sustainable policies and practices (Food and Agriculture Organization of the United Nations (FAO), 2023). While the total global food demand is projected to rise over 62 percent by 2050, factoring in climate change impacts (Van Dijk et al., 2021), green agriculture offers a sustainable pathway to meet these demands.
Achieving carbon neutrality through agriculture is of paramount importance for addressing climate change. Carbon neutrality is commonly understood as achieving a balance between the amount of carbon dioxide emissions released into the atmosphere and its offset, resulting in net zero. The current trajectory of greenhouse gasses far surpasses the Paris Agreement’s goal of limiting global warming to well below 2°C, preferably 1.5°C (United Nations Environment Programme (UNEP), 2022). Swift and equitable departure from fossil fuel usage is imperative, necessitating a 45 percent reduction in greenhouse gas emissions by 2030 and achieving carbon neutrality by 2050 (United Nations Environment Programme (UNEP), 2022; IPCC, 2023). Agriculture, forestry, and other land uses account for approximately 20 percent of global emissions, with agricultural production expected to increase by more than 50 percent by 2050 to meet food demand (Flammini et al., 2022; IPCC, 2023). These sectors significantly contribute to carbon, methane, and nitrous oxide emissions, comprising 23 percent of total net anthropogenic greenhouse gas emissions globally (IPCC, 2019a). The complex interplay of natural and human factors complicates the distinction between natural and anthropogenic fluxes (IPCC, 2019b). Agriculture contributes, and susceptible, to climate change, affecting food security due to rising temperatures, altered precipitation patterns, and increased extreme weather events (Food and Agriculture Organization of the United Nations (FAO), 2021b; Food and Agriculture Organization of the United Nations (FAO), 2021a). Urgent transformative action in agriculture, including emissions reduction, substantial financial support, and adaptation measures, is essential to ensure a sustainable and resilient future for agriculture and our planet.
China, with the largest population and agricultural land, has become a significant emitter of greenhouse gases (Wang et al., 2014; Wang and Zhang, 2019). Sustainable agricultural development is crucial for China to achieve its twin objectives of peaking carbon emissions by 2030 and attaining carbon neutrality by 2060. Climate change and emissions from agriculture present challenges to green agricultural development, necessitating well-coordinated and high-quality development strategies (Liu et al., 2019; Song et al., 2022). China is committed to enhancing green agricultural production to bolster national food security, implementing various measures such as the Rural Revitalization Strategy, National Sustainable Agriculture Development Plan (2015–2030), the 14th FYP Agricultural Green Development Plan, and the National Modern Agricultural Industrial Parks (Ministry of Agriculture and Rural Affairs (MARA), 2022). Green agriculture aligns with China’s national strategy of constructing an ecological civilization with sustainable development goals (Zhang and Chen, 2021; Chen et al., 2022). China’s economic shift from high-speed growth to high-quality development requires a focus on green agricultural development (Shen et al., 2022).
Given the rise of agricultural carbon emissions, it is imperative to quantify and understand green agricultural efficiency for achieving carbon neutrality, holding global significance for stabilizing climate change (Chen et al., 2021). A greener and efficient agriculture signifies the likelihood of carbon neutrality. Therefore, the analysis of agricultural carbon emissions is pivotal for green agricultural development, aiming for low-carbon growth (Xu et al., 2020). This need is particularly acute in China due to its limited resources and dense population (Shen et al., 2018).
The Qinghai-Tibet Plateau (QTP), which overlaps with Northwest China, is exceptionally vulnerable to climate change. Agriculture and animal husbandry are vital for regional livelihoods and national ecological security on the QTP, but they pose significant challenges related to climate change and ecological sustainability (Yu et al., 2022). Located at the juncture of Northwest China and the Qinghai-Tibet Plateau, Qinghai features distinct ecological and climatic conditions that make it highly vulnerable to climate change. This vulnerability, coupled with its significant roles in agriculture and animal husbandry, makes it a critical area for studying the impacts and mechanisms of green agriculture aimed at achieving carbon neutrality. Additionally, the region has historically been understudied, particularly at the provincial level, which further underscores the need for a focused investigation into its green agricultural practices and policies. This study aimed to fill the existing knowledge gap by providing a comprehensive analysis of Qinghai’s green agricultural efficiency and its influencing factors over a two-decade period, offering insights that are crucial for regional and global applications of sustainable agricultural practices.
As a response to climate change, this study assesses the green efficiency and the underlying influencing mechanisms in the development of green agriculture in Qinghai from 2000 to 2021. The analysis employs a non-radial and non-oriented DEA (Data Envelopment Analysis) model, the super-efficiency SBM (Slacks-Based Measure), to assess green efficiency. The LMDI (Logarithmic Mean Divisia Index) decomposition model is used to further scrutinize the influencing mechanisms behind the greening of agriculture, shedding light on the effects of agricultural energy structure, carbon intensity, economic growth, and population dynamics on greening efforts. Furthermore, the study employs the Tapio decoupling model, evaluating the greening trends in agriculture. To enhance the study’s depth, field research has been conducted, involving open-ended interviews. This comprehensive methodology ensures a nuanced understanding of the intricate factors influencing the pursuit of green agriculture for addressing climate change.
The novelty and contribution of this research is threefold: First, it assessed green efficiency and influencing mechanisms of green agriculture between 2000 and 2021 in Qinghai for the first time to provide a longitudinal perspective on green agriculture as a response to climate change. This perspective contributes to the province, country, and other developing countries understanding mechanisms influencing the development of green agriculture for achieving carbon neutrality and climate stabilization. Second, the study uses a holistic set of methods to address the topic in understanding green agricultural development in a contextual basis of case study. Thirdly, the study outlines insights on policy implications in sustainable agriculture that have regional, national, and global implications for achieving carbon neutrality as a response to climate change.
The existing body of literature offers valuable insights into fostering green agriculture for addressing climate change. China’s agricultural carbon emissions follow an inverted U-shaped trend, mainly driven by agricultural fertilizer, while the overall growth rate displays a gradual decline (Liu et al., 2021). Promoting green agriculture requires substantial green finance to align with China’s focus on low-carbon growth (Han et al., 2023). Agricultural green development propels the green economy, involving clean production, technological advancements, agricultural science, green trade, and international collaboration (Chen et al., 2017; Liu et al., 2020; Liu et al., 2021; Zhang and Chen, 2021; Liu et al., 2023). The enhancement of clean agricultural production, investment in agricultural science and technology research, and deepening the integration of industrialization and agricultural modernization are pivotal components in advancing China’s green agriculture (Liu et al., 2021). Furthermore, innovative solutions such as internet and digital technologies are instrumental in promoting sustainability, making them indispensable for the future of agriculture in the face of climate change crisis (Shen et al., 2022; Lioutas et al., 2021). Notably, their adoption on a larger scale in precision sowing, deep fertilizing, subsoiling, and no-tillage practices fosters green agriculture (Fang et al., 2021).
The ability of China to transition its agriculture toward carbon neutrality in response to climate change hinges on specific policies at the regional, provincial, municipal, and county levels. Regional and local governance play pivotal roles in fostering sustainable development. While the national level has witnessed an increase in the green efficiency of innovation, particularly in the central and western regions, thereby reducing regional disparities (Zhao et al., 2021), the overall green efficiency of China’s agricultural innovation remains moderate with notable spatial differences (He et al., 2021). Eastern China stands out as a pioneer in green agricultural growth, while western China shows promising potential. In contrast, central China’s agricultural land faces degradation due to reduced technological efficiency in fertilizer use (Liu and Feng, 2019). The regional disparities underscore the importance of targeted investments, educational enhancements, and technical innovations (Wang et al., 2019; Liu et al., 2021; Zhang and Chen, 2021; Guo et al., 2021). The promotion of green agriculture is crucial for accelerating agricultural and rural green development (Zhang et al., 2023). Environmental regulation serves as the foundation for green agricultural development, emphasizing the spatial spillover effect of environmental regulations and the necessity for urban–rural integration and market reforms (Ma et al., 2022). Challenges posed by distortions in factor markets necessitate policy reforms to enhance agricultural green total factor productivity, bridge regional gaps, and establish a framework for high-quality green agricultural development (Yang et al., 2022).
In China, particularly in regions like Northwest, green agriculture plays a pivotal role in ensuring food security and responding to climate change. Agricultural policies have a significant impact on the delicate balance between food supply and demand in these areas (Liu and Xu, 2023). An example of such policy is China’s grain-for-green initiative in this region, aimed at bolstering ecological security. However, this policy has inadvertently led to increased reliance on agricultural energy and agrochemical inputs, highlighting the caveat of relying solely on non-renewable resources (Wang et al., 2014). Overdependence on purchased resources not only hampers the effectiveness of the policy but also contradicts China’s broader environmental objectives. Consequently, China is striving for zero growth in the use of chemical fertilizers and pesticides. It encourages the utilization of livestock and poultry manure and promotes the recycling of agricultural plastic film for water use efficiency (Center for International Knowledge on Development (CIKD), 2021). Sustainable agricultural practices such as the green agriculture are indispensable in Northwest China and nationwide for green transitioning toward carbon neutrality as a response to climate change (Wang et al., 2014). However, there remains a dearth of substantial research in this area, hindering a comprehensive understanding of the dynamics of green agriculture for addressing climate change (Liu and Xu, 2023).
While agriculture and animal husbandry significantly contribute to carbon emissions in China’s Qinghai-Tibet Plateau (QTP), cropland and grassland serve as crucial carbon sinks, offsetting the overall impact of these emissions (Li et al., 2021). Despite technological advancements, economic and population growth on the QTP has led to increased carbon emissions. Agricultural activities, especially inputs like electricity and nitrogen fertilizer, are major contributors to these emissions (Yu et al., 2022). To enhance sustainability, it is imperative to utilize renewable organic resources, optimize agricultural structures, adopt cleaner energy sources, and improve agrochemical efficiency (Yu et al., 2022). Policy interventions are crucial for transitioning to green development strategies on the QTP, aligning population growth, investment, and green policies with ecological preservation and sustainable agricultural practices for climate stabilization (Wang et al., 2022). Moreover, regional disparities within the QTP underline the necessity for tailored approaches to address diverse food security concerns. The eastern part faces more human disturbances and challenges, while the western part exhibits a stable food production system and high self-sufficiency, primarily reliant on agricultural and livestock development (Wang et al., 2023).
In Qinghai, like the broader northwestern region of China, the levels of greening agriculture have historically trailed behind the national average. Agricultural activities in Qinghai have heavily relied on freshwater resources for irrigation, leading to increased water pollution (Fan and Fang, 2020; Dong et al., 2021). Significant challenges persist in the agricultural industry’s structure, infrastructure, and monitoring mechanisms for promoting green agriculture (Haijing et al., 2019). However, there has been notable improvement, especially with the increased adoption of mechanized agricultural operations in the northwestern region, contributing positively to the greening of agriculture (Guo et al., 2020). The rise in farmer income and advancements in agricultural technology have furthered the cause of greening agriculture across the region.
Importantly, Qinghai has implemented various policy measures to promote green agricultural practices and technologies, enhance resource efficiency, and reduce pollutant emissions (Fan and Fang, 2020). In its 14th Five Year Plan, Qinghai has outlined ambitious goals, including the development of an industrial chain for green organic food production, upgrading the ecological animal husbandry industry, and reducing chemical fertilizer use while increasing organic fertilizer efficiency. These efforts are geared toward building a base of green agricultural output and certifying over 1,000 green agricultural products by 2025 (Qinghai Provincial People's Congress (QPPC), 2021). The province is also focusing on improving the production capacity of distinct agricultural and livestock resources, integrating scientific and technological support, developing new forms of production, and ensuring high-quality, competitive agricultural and livestock products to guarantee food security in the face of climate change crisis (Qinghai Provincial People's Congress (QPPC), 2021).
Despite various media and policy reports on the development of green agriculture in Qinghai, a comprehensive and systematic literature, especially the improvement of green efficiency and its driving factors on green agriculture as a response to climate change is notably absent. Addressing this gap is crucial for outlining the trajectories of greening efforts, identifying influencing factors, and evaluating the efficiency of achieving green agriculture conducive to carbon neutrality. A deeper understanding of the region’s unique opportunities and challenges is essential for the formulation of effective policies to tackle the climate crisis. Filling this literature gap in assessing green agriculture in Qinghai holds policy and research implications not only for the region but also for the broader context of China and other developing countries aiming for green agricultural development.
The SBM model has been widely employed to assess efficiency in green agriculture on the national scale, incorporating various variables and sectors within index frameworks (Bai et al., 2018; He et al., 2021; Zhao et al., 2021; Liu et al., 2021; Meng and Qu, 2022; Ma et al., 2022; Yang et al., 2022; Zhang et al., 2023). In addition to the SBM model, the study employs the LMDI decomposition model to further evaluate influencing factors of efficiency. The LMDI model is commonly utilized to analyze agricultural carbon emissions intensity, efficiency, and the influencing factors of agricultural carbon emissions (Li et al., 2022).
This study conducts a comprehensive assessment of green efficiency in agriculture by employing the DEA model of the super-efficiency SBM method, alongside the LMDI decomposition model and the Tapio decoupling index. These models are utilized in this study to align with existing literature, enhancing the replicability of the study. Additionally, field research conducted in Qinghai province supplements the analysis. The combined use of these models and methods facilitates the evaluation of green efficiency across different variables, with agricultural carbon emissions serving as a focal point. The results are cross validated to enhance robustness. For instance, efficiency scores obtained from the super-efficiency SBM method are corroborated with decomposition factors related to agricultural carbon emissions and decoupling states between economic growth and carbon emissions over the study period. Furthermore, external validation is conducted by comparing efficiency scores with existing literature and key policy themes, particularly during Five Year Plan periods, in the discussion section. The paper synthesizes observations from field research, including visits to green agricultural production sites, as well as solar, wind, and hydro power stations in Haixi Mongol and Tibetan Autonomous Prefecture, Hainan Tibetan Autonomous Prefecture, and Huangnan Tibetan Autonomous Prefecture within Qinghai province, as illustrated in Figure 1. These three prefectures are at the forefront of green agriculture and organic livestock production, leveraging their extensive cropland and pastureland.
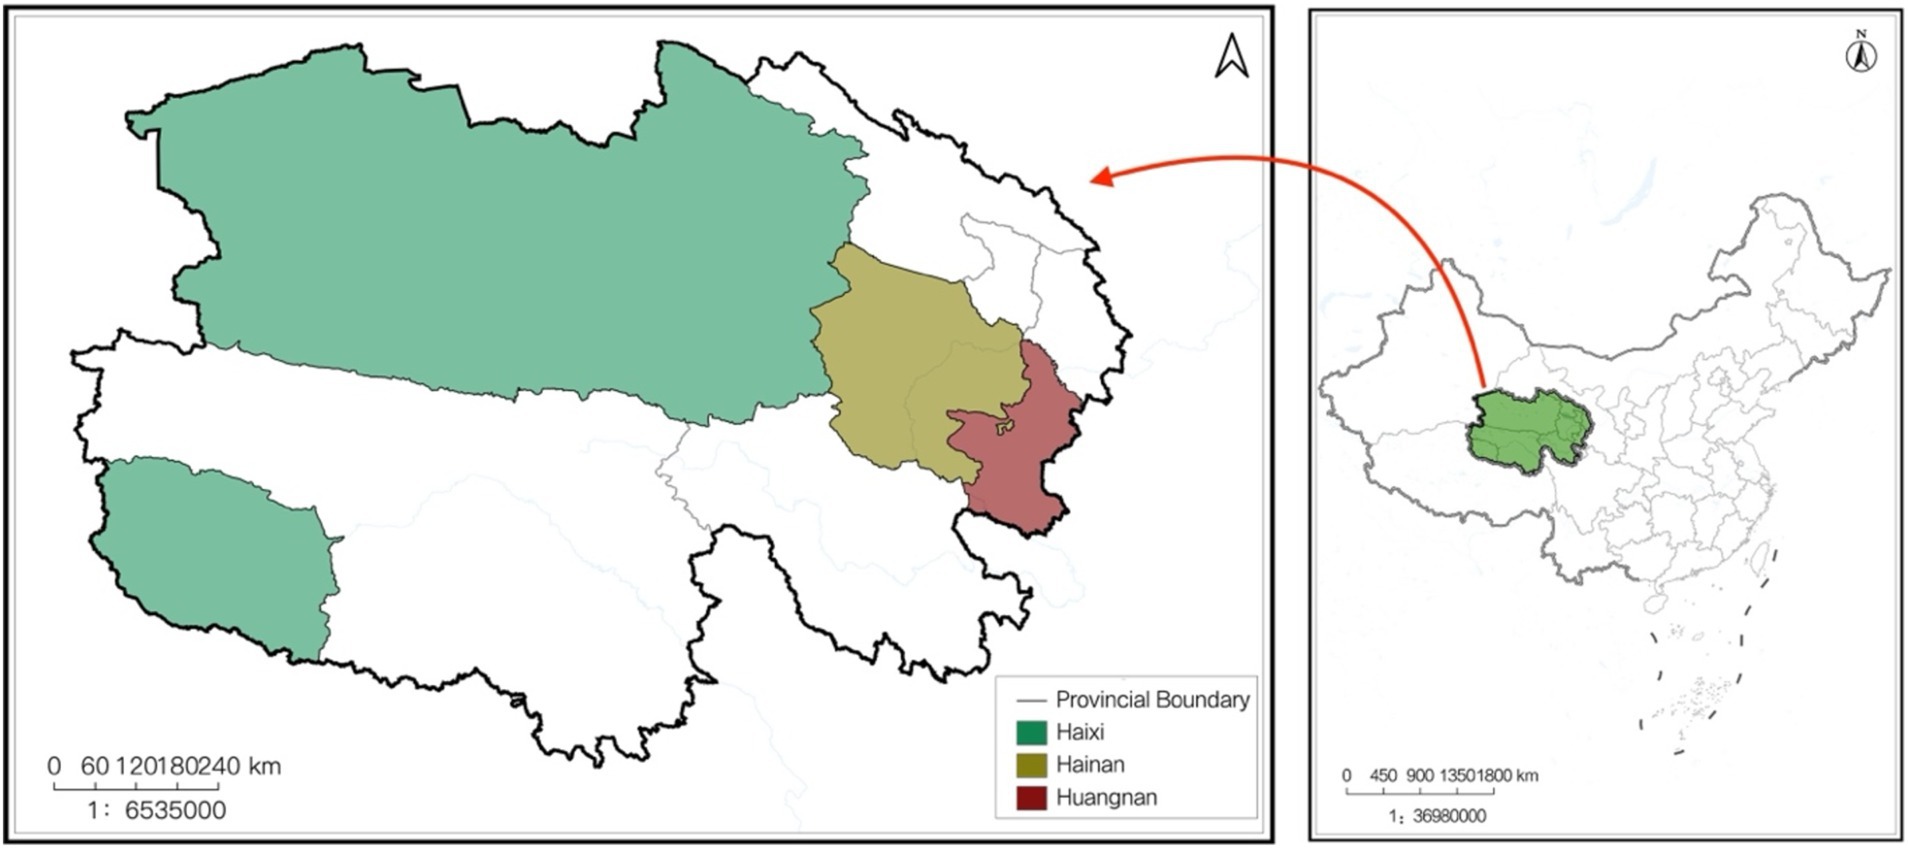
Figure 1. Map of study area.
In the super SBM model of this research, fixed asset investment, labor, and energy are used as inputs, with GDP as the desired output, and CO2 emissions, chemical fertilizers, pesticides, plastic films, and diesel consumption as the undesirable outputs. To ensure consistency with existing literature and facilitate future replication, the study integrated carbon emissions, GDP per capita, population, and energy consumption within the agricultural sector into the LMDI model. Data and its descriptions are provided in Table 1.
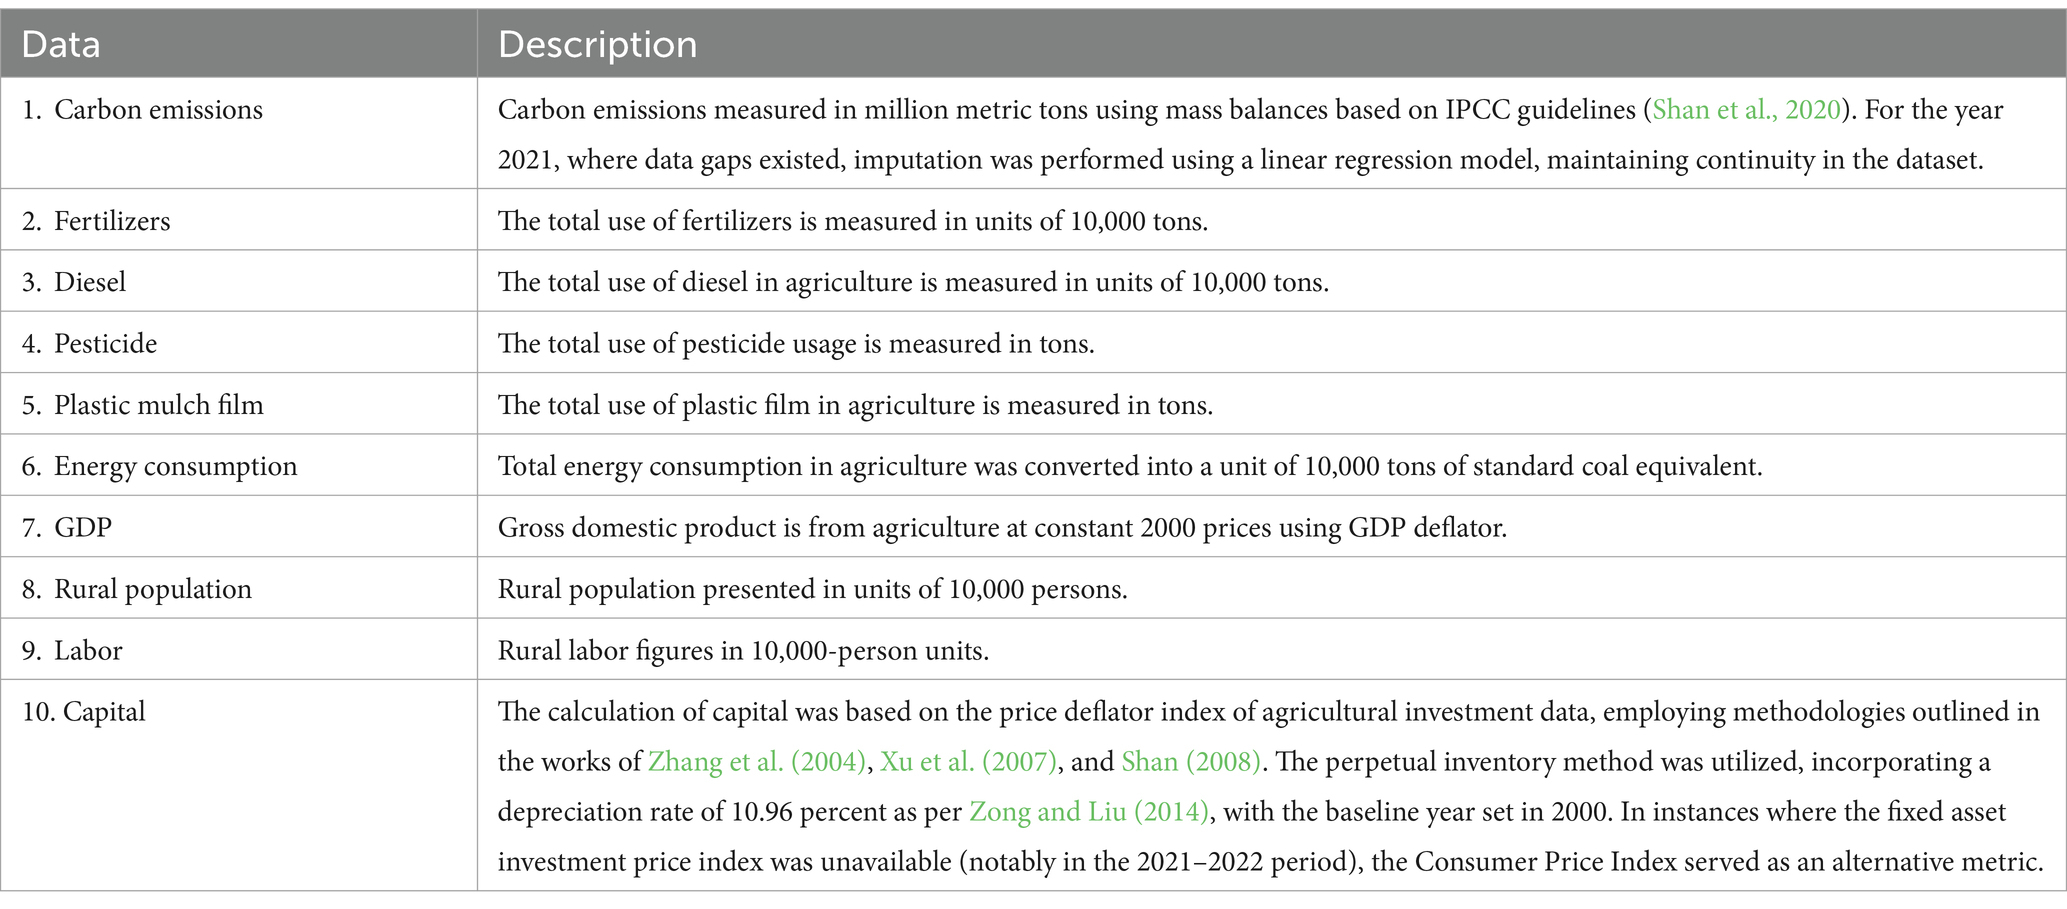
Table 1. Data and description.
All data over 2000–2021 were sourced from the China Statistical Yearbook, China Rural Statistical Yearbook, Qinghai Statistical Yearbook, China Energy Statistical Yearbook, Historical Data of China’s GDP Accounting 1952–2002, China Fixed Asset Investment Statistical Yearbook 2004–2017, and CEADs.
In assessing green efficiency in agriculture, this study employs a non-radial, non-oriented DEA model known as SBM developed by Tone (2001). It integrates the concepts of super-efficiency and undesirable output (Tone, 2002, 2003). In this model, with decision-making units (DMU) represented by input vectors desired output vectors and undesired output vectors then the production possibility set is defined as: where represents the weight coefficient vector. The two inequalities in the function signify that the actual input meet or exceed the frontier input, the actual desired output should be less than or equal to the frontier output, and the actual undesirable output should surpass or equal the frontier. Therefore, each DMU is characterized by input (X), desirable output (Y), and undesirable output (Z), with the excess of inputs denoted by undesirable outputs denoted by , and the shortage of expected outputs denoted by (Tone, 2003).
Given the absence of a SBM model formula accounting for undesirable output in the work of Tone (2003), this study adopts the formula proposed by Cheng (2014) to assess the efficiency of DMUs ( ). The resulting super SBM model incorporating undesirable output is derived as follows:
wherein, represents the efficiency value of the DMU, while and denote the number of variables corresponding to inputs, expected outputs, and undesired outputs, respectively. A DMU is considered valid, denoted by = 1, when there are no excesses or shortages in inputs ( ), expected outputs ( ), or undesired outputs ( ). If is less than 1, the DMU is non-valid, indicating room for improvement. The model calculates an efficiency value as ≥ 1. Equal weighting is expressed as .
Unlike super-efficiency models grounded in radial and directional DEA approaches, the super-efficiency SBM model does not solely emphasize the condition where (Tone, 2002). Instead, it identifies efficient DMUs and assigns a value of 1 to inefficient ones. This study derived results for the super-efficiency-SBM model through a synthesis of outcomes from both non-super efficiency and super-efficiency models. Efficient regions were computed using the super-efficiency model, whereas inefficient regions were determined using the non-super-efficiency model. The slack variables and Lambda coefficients were computed utilizing the coefficients derived from the non-super efficiency model.
The fundamental concept of decoupling involves assessing the relationship between changes in resource consumption or pollutant emissions and changes in economic growth over a specific timeframe (United Nations Environment Programme (UNEP), 2011). The Decoupling Index (DI) for the year is calculated as follows:
wherein, represents the change in resource consumption in the target year, and represents economic growth during the same period. It mainly describes the states of relative decoupling, where the rate of resource consumption is lower than that of economic growth, and absolute decoupling, where resource consumption or pollutant emissions decrease despite economic growth.
Tapio (2005) introduced the concept of decoupling elasticity, measuring the incremental value sensitivity, enhancing earlier decoupling models (OECD, 2002, 2006; UNEP, 2011). The Tapio decoupling model, offering multiple decoupling states, has been widely employed to assess the decoupling relationship between carbon emissions and economic growth (Dong et al., 2019; Wang and Yan, 2022; Du et al., 2022; Xie et al., 2023; Ding and Zhang, 2023). The Tapio decoupling model is expressed as follows:
wherein, signifies the decoupling index for a specific period, represents the growth rate of carbon emissions, and denotes the growth rate of economic growth. The target and base years are denoted as and , respectively. Decoupling states are interpreted based on eight categories established by Tapio (2005), as outlined in Table 2.
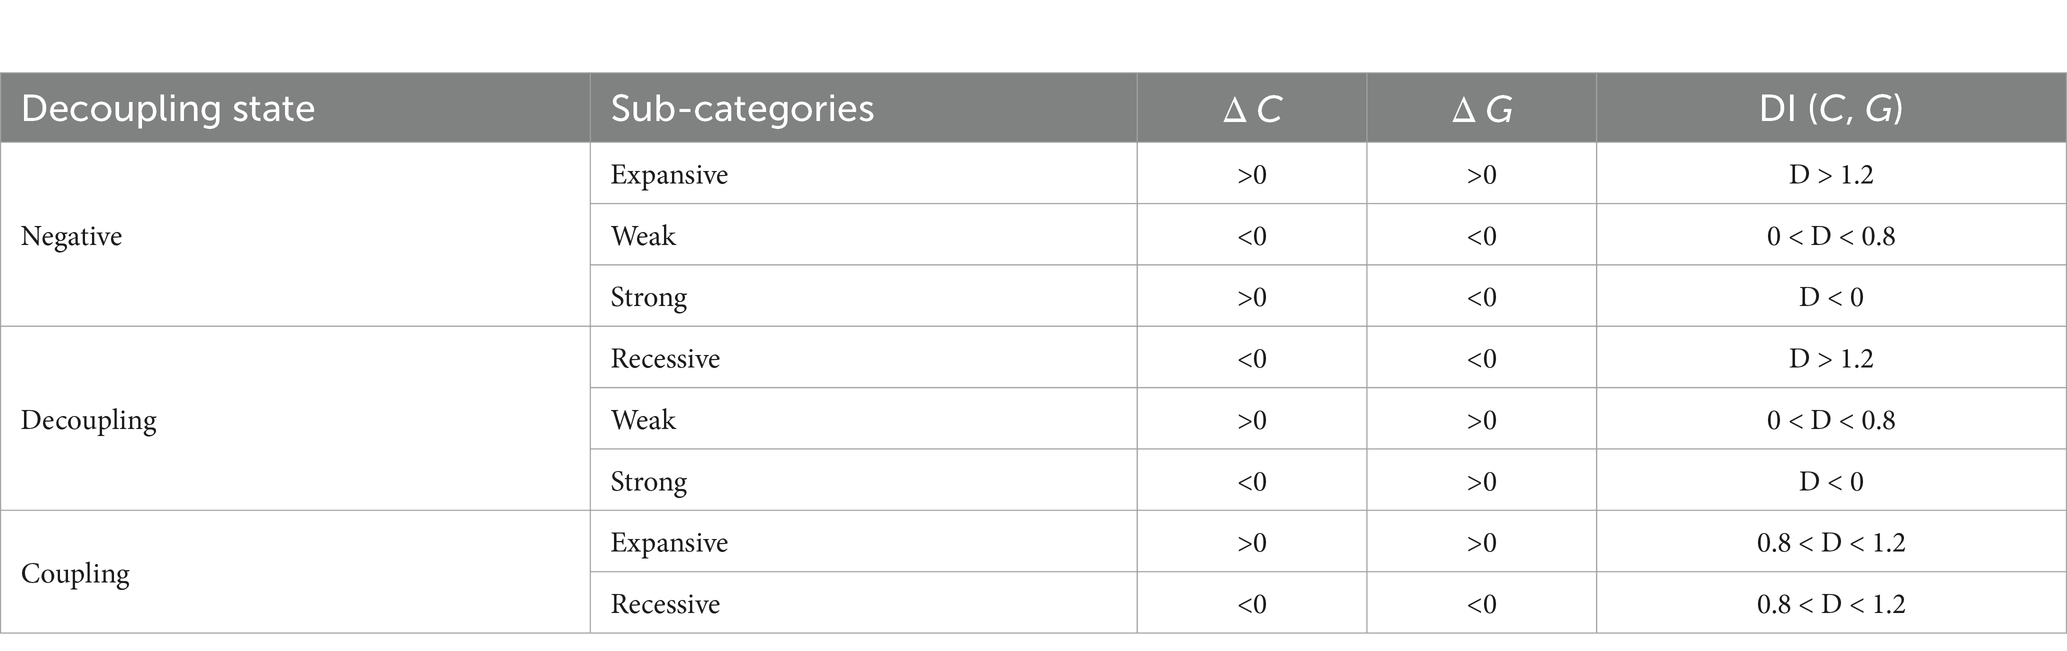
Table 2. Decoupling state criteria.
Apart from the DEA models, several studies have utilized Logarithmic Mean Divisia Index (LMDI) factor decompositions to assess energy efficiency (Dong et al., 2019; Sheng et al., 2021; Andrei et al., 2022). The LMDI has emerged as a dominant decomposition model for analyzing the influencing factors of energy-related carbon emissions (Ang, 2015). The LMDI method offers comprehensive decomposition without residual errors, ensuring consistency in both addition and multiplication decomposition. Additionally, it can handle zero values in the data, making it a robust analytical tool (Ang et al., 1998; Wang and Wang, 2020).
Drawing upon established literature on the LMDI method (Ang et al., 1998; Ang, 2004, 2005, 2015), this study employs the Kaya identity (Kaya, 1990) and the LMDI method (Ang, 2015) to further evaluate the influencing factors of green efficiency. The approach involves decomposing the influencing factors into energy intensity, energy structure, economic growth, and population scale. Utilizing the Kaya identity, the decomposition factors for carbon emissions are calculated as follows:
wherein, stands for agricultural sector. denotes carbon emissions in year . denotes total energy consumption in year . denotes GDP in year . denotes population in year . The variables and represent the simplified terms for energy structure factor or carbon intensity of energy, for energy consumption intensity factor or energy intensity of GDP, for economic growth factor or GDP per capita, and for population scale factor, respectively. Using the additive LMDI decomposition model, the change in carbon emissions from the base year to the target year is obtained as:
wherein, represents the change in the total growth of carbon emissions. signify the effects of energy structure intensity, energy consumption intensity, economic growth, and population on carbon emissions, respectively. A negative LMDI decomposition factor has a promoting effect on carbon emissions while a positive factor has a hindering effect on carbon emissions. The LMDI decomposition factors are expressed as:
The integrated models of Tapio decoupling and LMDI can be expressed as:
wherein, represents the change in the growth of carbon emissions. represents the change in GDP growth. represent decoupling index of each decomposition factor, calculated as:
In addition to quantitative analysis, this study conducted field research involving open-ended interview questions to gain a comprehensive understanding of green agricultural development in Qinghai. A tailored set of interview questions designed for specific agricultural units is provided in Appendix A.1. This study interviewed over 30 participants using self-selection and snowballing methods. The participants were consisted of government officials, experts, and firms engaged in the green agricultural sector. These interviews, forming strategic samples rather than probability samples, served as the foundation for theoretical generalization, aiming for a thorough understanding of the broader context, as outlined by Grønmo (2019).
This paper synthesizes insights from qualitative approach with quantitative findings. Although quantitative data predominates in the presentation, qualitative data remains essential, albeit less prominently displayed. The results of the fieldwork corroborate the overarching observations made from statistical analyses, influencing policy recommendations, and providing a nuanced understanding of the contextual dynamics of the study area. A summary of the qualitative observations is provided in the discussion section. This fieldwork constitutes a crucial element of both this paper and a wider, ongoing research initiative.
Discussing the agricultural economy sets the stage for a more nuanced analysis of green efficiency and its factors, illustrating its integration into the broader economic context and its potential to drive sustainable transformation in Qinghai’s agriculture toward sustainability and carbon neutrality. By initially examining the agricultural economy’s current state, including output growth, capital investment, and labor dynamics, we can understand how the sector is adapting through mechanization, urban migration, and investment trends. These elements are essential for assessing the sector’s resilience and its ability to adopt sustainable practices.
In Qinghai, although the share of agriculture to GDP has been decreasing, the sector’s production output has consistently grown, as shown in Supplementary Tables B.1, B.2. The positive correlation between capital investment and GDP indicates that investments are being effectively utilized, fostering economic and infrastructure growth.
The agricultural labor force has diminished due to mechanization and a shift to other sectors (Supplementary Table B.1). Despite this reduction, technological advancements and increased productivity have ensured that GDP growth remains unaffected. Concurrently, the rural population has decreased as part of a global trend toward urbanization, yet this has not reduced capital investment, suggesting continued potential and profitability in the sector by both the government and investors.
Figure 2 and Supplementary Table B.2 reveal a marked and consistent rise in the gross output value across various agricultural domains, including farming, animal husbandry, forestry, fishery, and agricultural services. This growth reflects a strategic emphasis on technological adoption, diversified and high-value crop cultivation, market-oriented practices, sustainable conservation, responsible aquaculture, and sustainable harvesting. As a result, rural per capita disposable income has steadily increased, indicating economic advancement and improved living standards for the rural population.
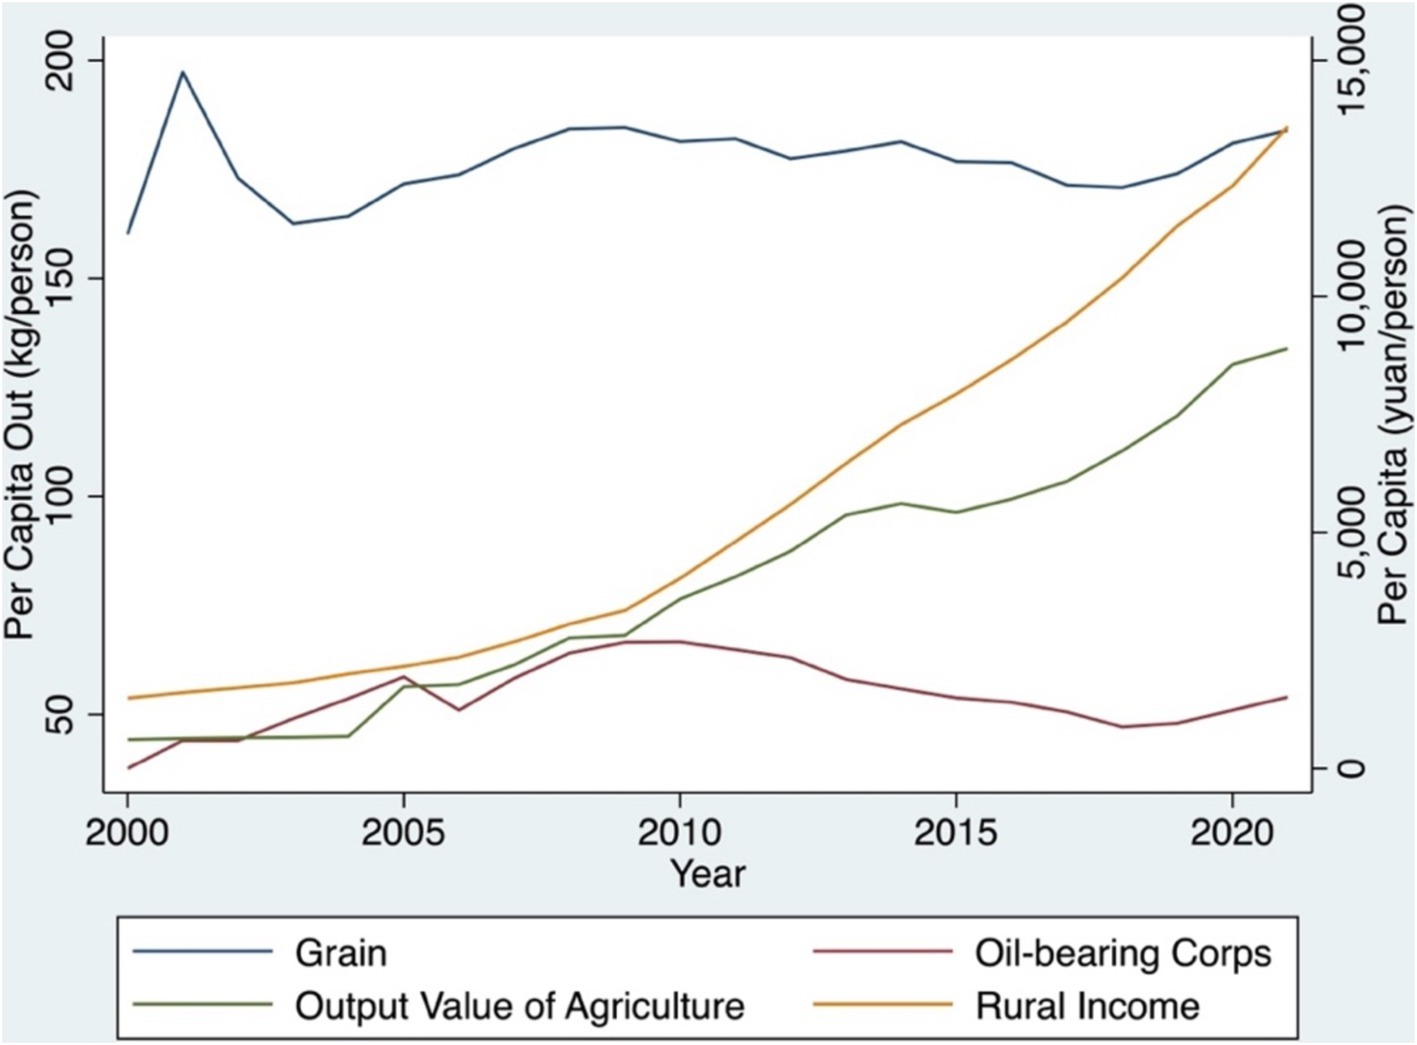
Figure 2. Per capita output and disposable rural income.
The agricultural landscape in Qinghai embraces a diversified approach to food production, focusing on food security, economic diversification, and sustainable practices, as detailed in Supplementary Table B.3. Notably, grain production has grown consistently, reflecting efforts to secure the region’s food supply. There has also been a steady increase in the production of oil-bearing crops, vegetables, and edible fungi. In contrast, fruit production has remained stable. Additionally, there has been a moderate rise in aquatic product production.
In livestock farming, detailed in Supplementary Table B.4, Qinghai has adopted a diverse approach, producing meat, milk, poultry eggs, and honey. The significant increase in livestock production responds to growing demand for animal-based products, indicating a robust and expanding local economy. Meat products not only provide essential protein but also significantly contribute to agricultural revenue. However, production of milk and honey experiences fluctuations. Additionally, the decline in sheep and goat wool production may reflect shifts in the textile industry or consumer preferences.
Detailing the dynamics of agricultural inputs and emissions is essential for analyzing green efficiency and its drivers in agriculture. It places efficiency gains in context, illustrating their connection to broader changes in agricultural practices and environmental management strategies. By examining changes in input usage, such as reductions in agrochemicals and shifts to sustainable energy sources, this analysis highlights the tangible effects of technological advancements and policy initiatives. This provides a measurable indication of progress toward greener practices and supports further investments in similar technologies and policies.
Supplementary Table C.1 reveals a marked reduction in agrochemical fertilizers, from 7.17 million tons in 2000 to 4.89 million tons in 2021, particularly since 2015. Figure 3 illustrates that this decline includes nitrogenous, phosphate, potash, and compound fertilizers, reflecting a shift toward organic farming, crop rotation, and more efficient fertilizer use. Meanwhile, stable diesel usage suggests ongoing mechanization in agriculture, supporting consistent productivity and food security through improved fertilizer efficiency and reduced wastage.
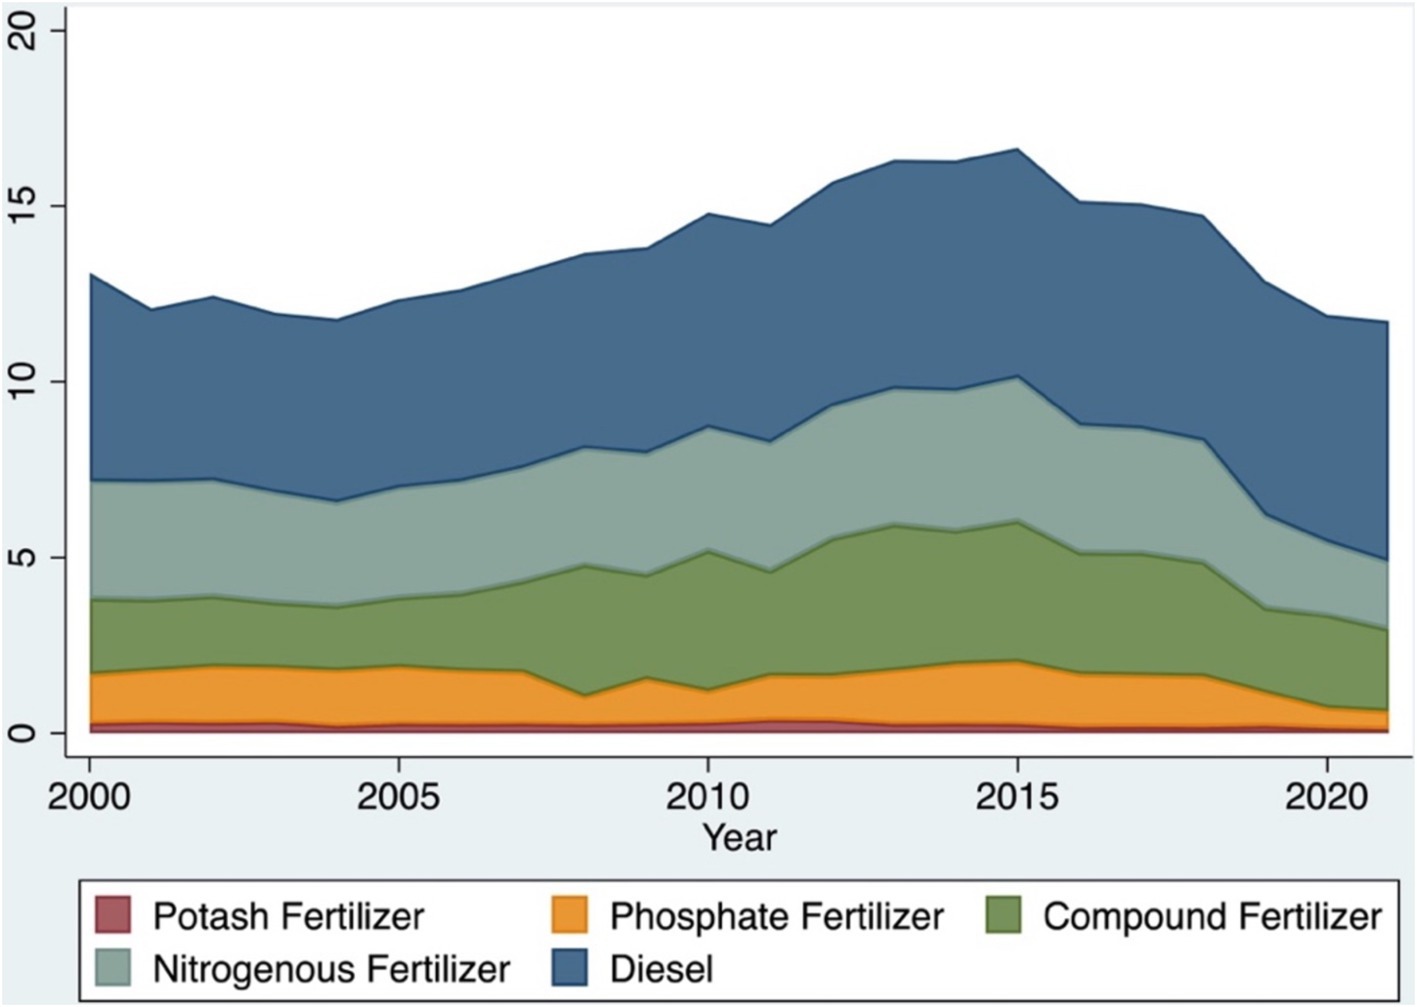
Figure 3. Trend of chemical fertilizers and diesel.
Despite the reduction in chemical fertilizers and pesticides, there has been an increase in plastic film usage, indicating a shift toward more controlled and intensive cultivation methods (Supplementary Table C.1). This intensification necessitates policies that promote sustainable practices to mitigate environmental impacts, such as microplastic pollution from plastic film mulch in cropland soil (Feng et al., 2021). Alternatives and initiatives should be explored to promote more sustainable plastic use in agriculture and manage plastic waste effectively (Hofmann et al., 2023).
Additionally, agricultural practices have become more energy-intensive, efficient, and modernized with increased electricity use and mechanization, as indicated in Supplementary Table C.2. While agricultural machinery enhances productivity, it raises environmental concerns. Policymakers should consider strategies such as the “Internet + agricultural machinery” platform and low-carbon agricultural machinery to promote mechanized agriculture and foster a low-carbon economy (Ma et al., 2023). Furthermore, Supplementary Table C.1 illustrates a positive trend in efficient water usage due to improved infrastructure for water-efficient irrigation, adoption of drought-resistant crop varieties, and controlled expansion of cultivated land.
Against the backdrop of agricultural economy, inputs, and emissions, Figure 4 illustrates an overview of agricultural green efficiency in Qinghai from 2000 to 2021, indicating how carbon emissions are managed in agricultural production. Agricultural green efficiency, denoted by a score of 1 or above, signifies effective agricultural production without unnecessary carbon emissions, while a score below 1 indicates inefficiency. According to Table 3, the agricultural sector maintained a mean efficiency value of 0.8335 with a standard deviation of 0.1902 during this period. The efficiency values, represented as , were equal to or greater than 1 ( ) for 10 years, primarily concentrated between 2000 and 2008. Conversely, inefficiency values ( ) persisted for 12 years, notably concentrated between 2009 and 2019. Remarkably, efficiency values exceeded 1 in 2020–2021.
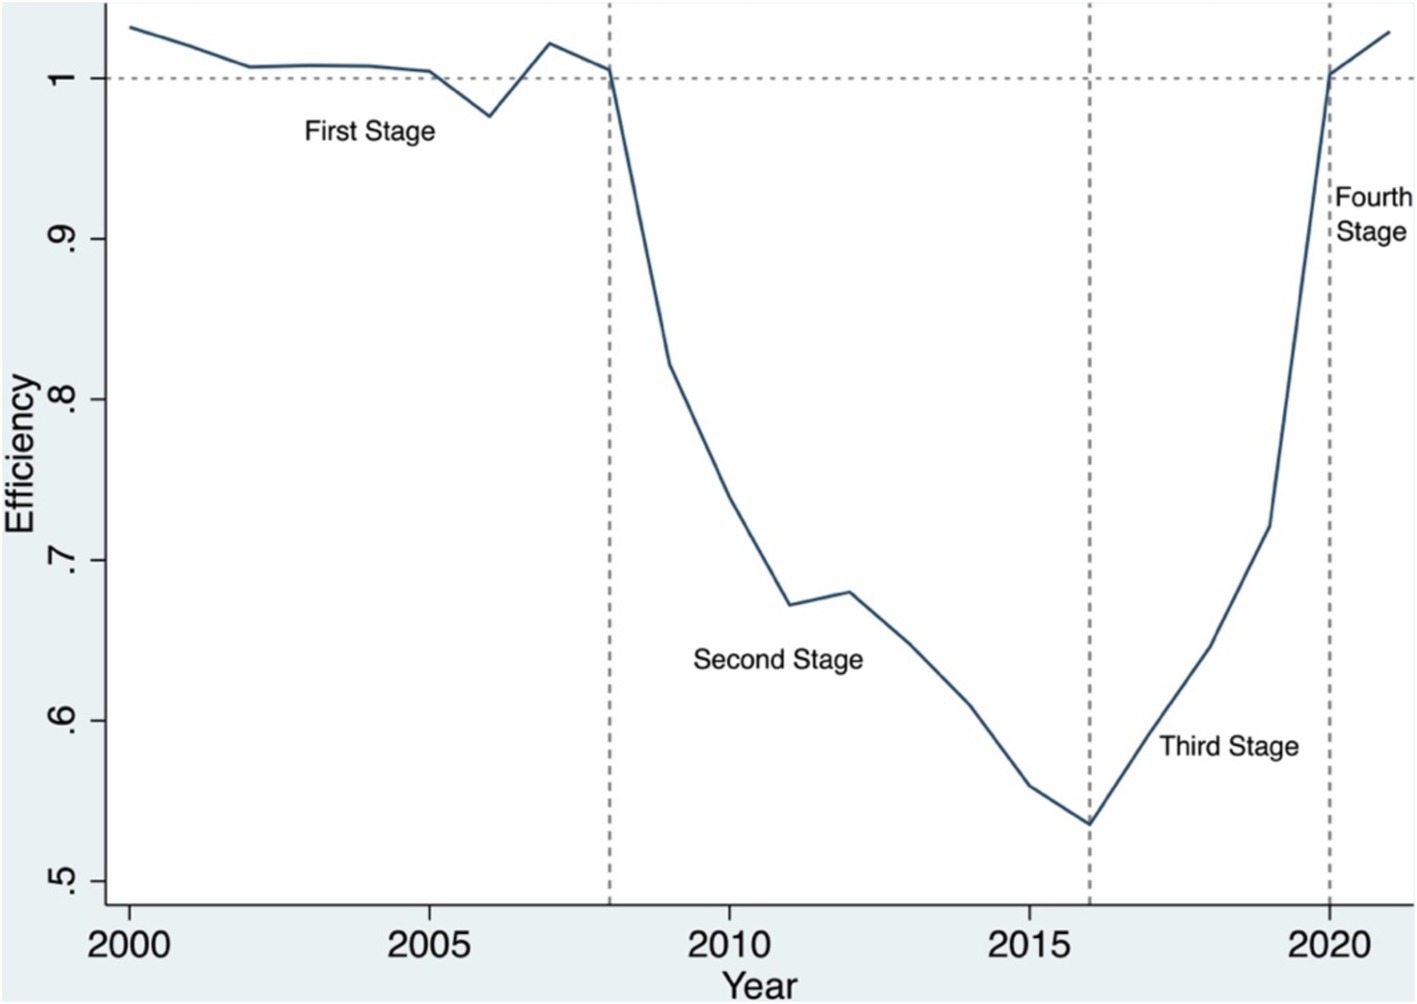
Figure 4. Green efficiency in Qinghai’s agricultural production.

Table 3. Summary of efficiency, 2000–2021.
The trends in agricultural green efficiency during this period can be categorized into distinct stages: stabilization, deterioration, recovery, and efficient. The stabilization stage, from 2000 to 2008, displayed consistent efficiency with values around or above 1, indicating efficient management of agricultural carbon emissions. This trend aligns with the implementation of the grain-for-green policy since 1999 (Wang and Zhang, 2019). This policy encouraged ecological restoration by converting marginal cropland into forests or grasslands. Local farmers were incentivized to abandon agricultural production on these lands and were compensated with grain and cash, effectively slowing ecological degradation, particularly in the desertified areas of Northwest China (Wang et al., 2014). This period also corresponds with the 10th Five Year Plan (2001–2005) of the province, which emphasized for the first time the promotion of agricultural water conservation, ecological agriculture, modern animal husbandry, and efficient green agriculture. These efforts were further reinforced in the 11th Five Year Plan (2006–2010), focusing on the development of ecological animal husbandry, green products, and the improvement of production scale.
The deterioration period between 2009 and 2016 marked a significant decline in green efficiency, reaching its nadir in 2016. This deterioration occurred post the grain-for-green policy period, coinciding with a swift increase in the carbon footprint (Wang and Zhang, 2019). Following the grain-for-green policy, challenges emerged, including low-quality and insufficient cropland, leading to heightened agricultural energy and agrochemical inputs. This surge aimed at sustaining and enhancing land productivity for food security, contributing to a decline in green efficiency. Notably, as indicated in Supplementary Table C.1, agrochemical fertilizer usage peaked in 2015, and plastic film usage increased six-fold from 2009 to 2016. Agricultural energy and electricity consumption almost doubled during this period. The accelerated growth in relative carbon emissions due to plastic film and diesel inputs surpassed national averages, challenging both the grain-for-green policy’s effectiveness and China’s 2005 energy-saving and emission-reduction policy (Wang et al., 2014). These changes, also evident elsewhere in China, significantly impacted green agricultural production and underscored the province’s unique challenges, emphasizing the need for targeted interventions promoting sustainable practices and efficient resource utilization (Wang and Zhang, 2019). Despite these challenges, the 12th Five Year Plan (2011–2015) emphasized low-carbon, circular, ecological, and green development, including green organic agricultural and livestock products, although their effects were gradual.
The recovery stage, from 2017 to 2019, witnessed an ongoing recovery, with efficiency remaining below 1 but displaying a consistent upward trend. This indicated sustained efforts in adopting sustainable agricultural practices to enhance green efficiency, though not yet fully successful. During this stage, the 13th Five Year Plan (2016–2020) continued the emphasis on low-carbon, green development, and green industries, including agriculture.
In the efficient stage, from 2020 to 2021, a notable improvement in efficiency emerged, surpassing the threshold of 1 by 2020. This suggested that agricultural practices had become more carbon-efficient, possibly due to the adoption of green technologies or efficient practices. Meanwhile, the 14th Five Year Plan (2021–2025) further reinforced the focus on low-carbon, green development, and green agriculture.
These fluctuations in Qinghai’s agricultural green efficiency appear to be intricately tied to agricultural policies. The province’s rise in green efficiency underscores the potential of innovative policies.
The LMDI factor decomposition model provides further insights on the driving factors of green efficiency in Qinghai’s agricultural development. Figure 5 illustrates the effects of carbon intensity, energy intensity, economic growth per capita, and population scale on carbon emissions in Qinghai’s agricultural production from 2001 to 2021. The total effect curve indicates the combined impact of these factors on agricultural carbon emissions.
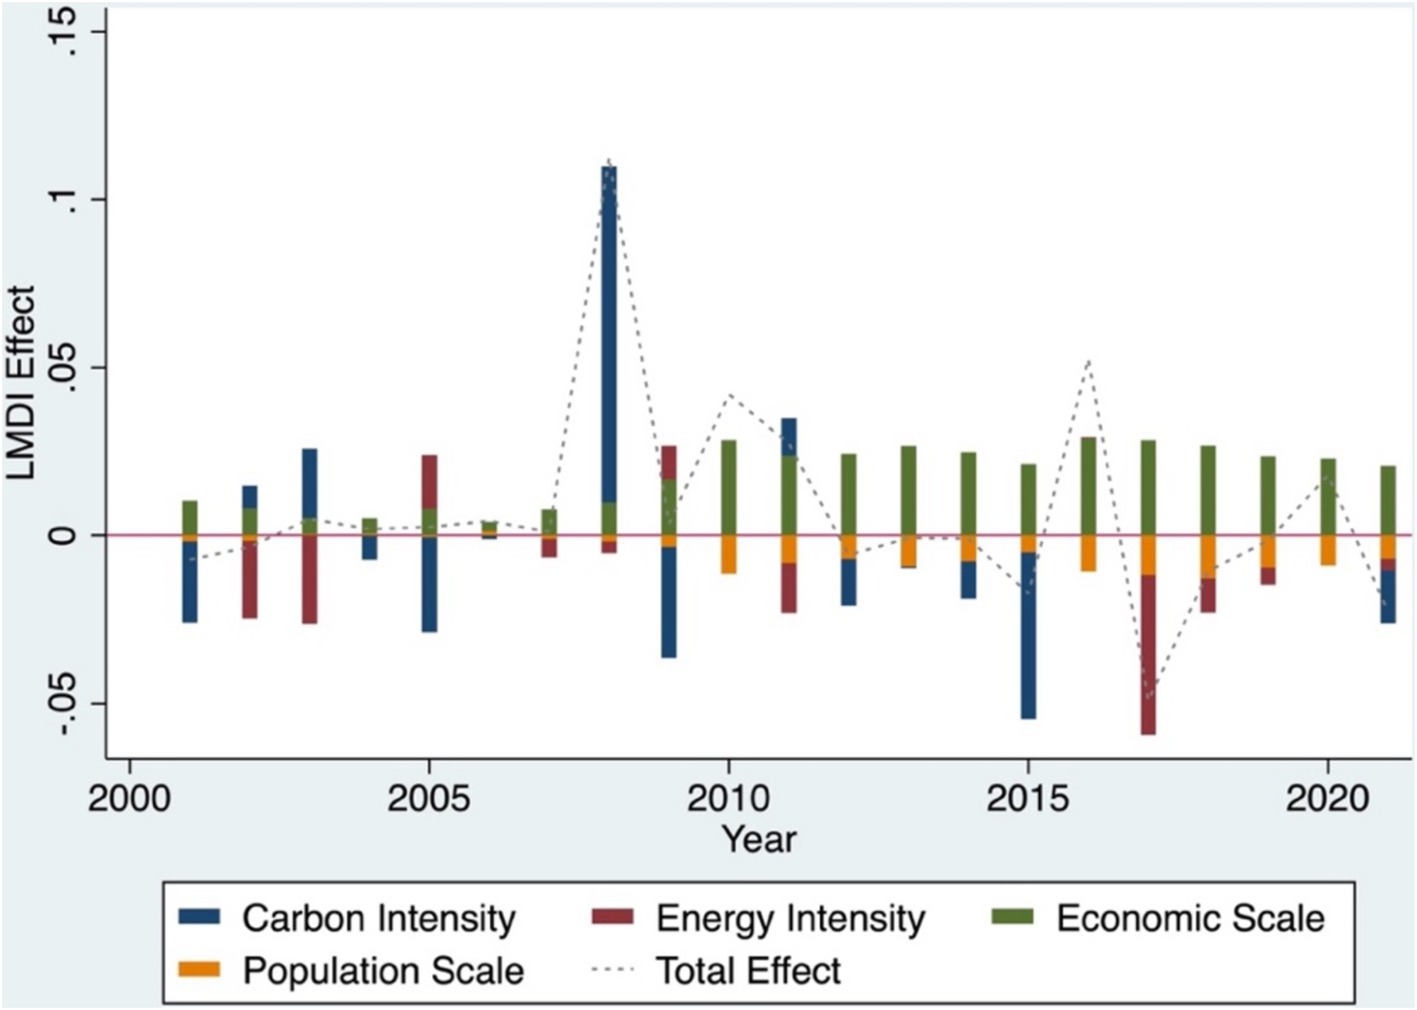
Figure 5. LMDI factor decomposition.
The total effect exhibits fluctuations, signifying the presence of countervailing forces affecting agricultural green efficiency. Among this intricate interplay of factors, economic growth emerges as the most negative force on green efficiency from 2000 to 2021, despite the rise in economic activity per capita. This influence is particularly notable between 2009 and 2016, confirming its role in the deterioration stage of green efficiency highlighted in Figure 4. Notably, not all high economic growth impedes green efficiency; for instance, during 2009 and 2015, economic growth remains high while green efficiency maintains levels above 1.
Energy intensity generally shows a promoting effect on green efficiency. However, it ranks second in negative effect after economic growth. Out of 21 years, it had a detrimental effect for 9 years, especially in 2005, 2009, 2015, and 2016. Its most significant positive influence occurred in 2017. Except for these 9 years, agricultural production has become increasingly energy-efficient, leading to a decline in carbon emissions per unit of GDP.
The effects of carbon intensity of energy and energy intensity closely align, with both exhibiting negative effect in 8 and 9 years, respectively. However, carbon intensity fluctuated widely over the years. Its most detrimental effect occurred in 2008 with an outlier value of 0.1099, marking the highest individual impact on agricultural green efficiency during the study period. Overall, carbon intensity has promoted green efficiency, indicating a shift toward more efficient energy utilization in the agricultural sector.
Among these combined factors, population scale exerted the least negative influence on green efficiency, except for slight downturns in 2003, 2004, and 2006. This implies that the agricultural sector managed its green efficiency while rural population have been gradually fallen since 2006. The most promoting effects of agricultural carbon emissions in Qinghai were population scale, energy intensity, and carbon intensity. The combined factors displayed fluctuations over the years, indicating both progress and constraints in implementing sustainable agricultural practices. Nevertheless, recent years, especially since 2012, have shown relatively consistent improvement.
The ultimate goal of green efficiency in agriculture is to produce more with less environmental cost. Decoupling analysis directly relates to this by measuring how well agricultural economic output is being achieved independent of increased carbon emissions, thus providing another metric to gage green efficiency. The fluctuations and transitions in decoupling states over the years provide a historical perspective on how agricultural practices have evolved in response to policy changes, technological advancements, and external pressures such as climate change. Understanding these trends helps policymakers and stakeholders pinpoint what strategies have been most effective and where further adjustments are needed.
Figure 6 presents an analysis of the carbon growth rate, economic growth rate, and decoupling index for Qinghai’s agricultural sector from 2001 to 2021. The decoupling index offers nuanced insights into the relationship between carbon emissions and economic growth.
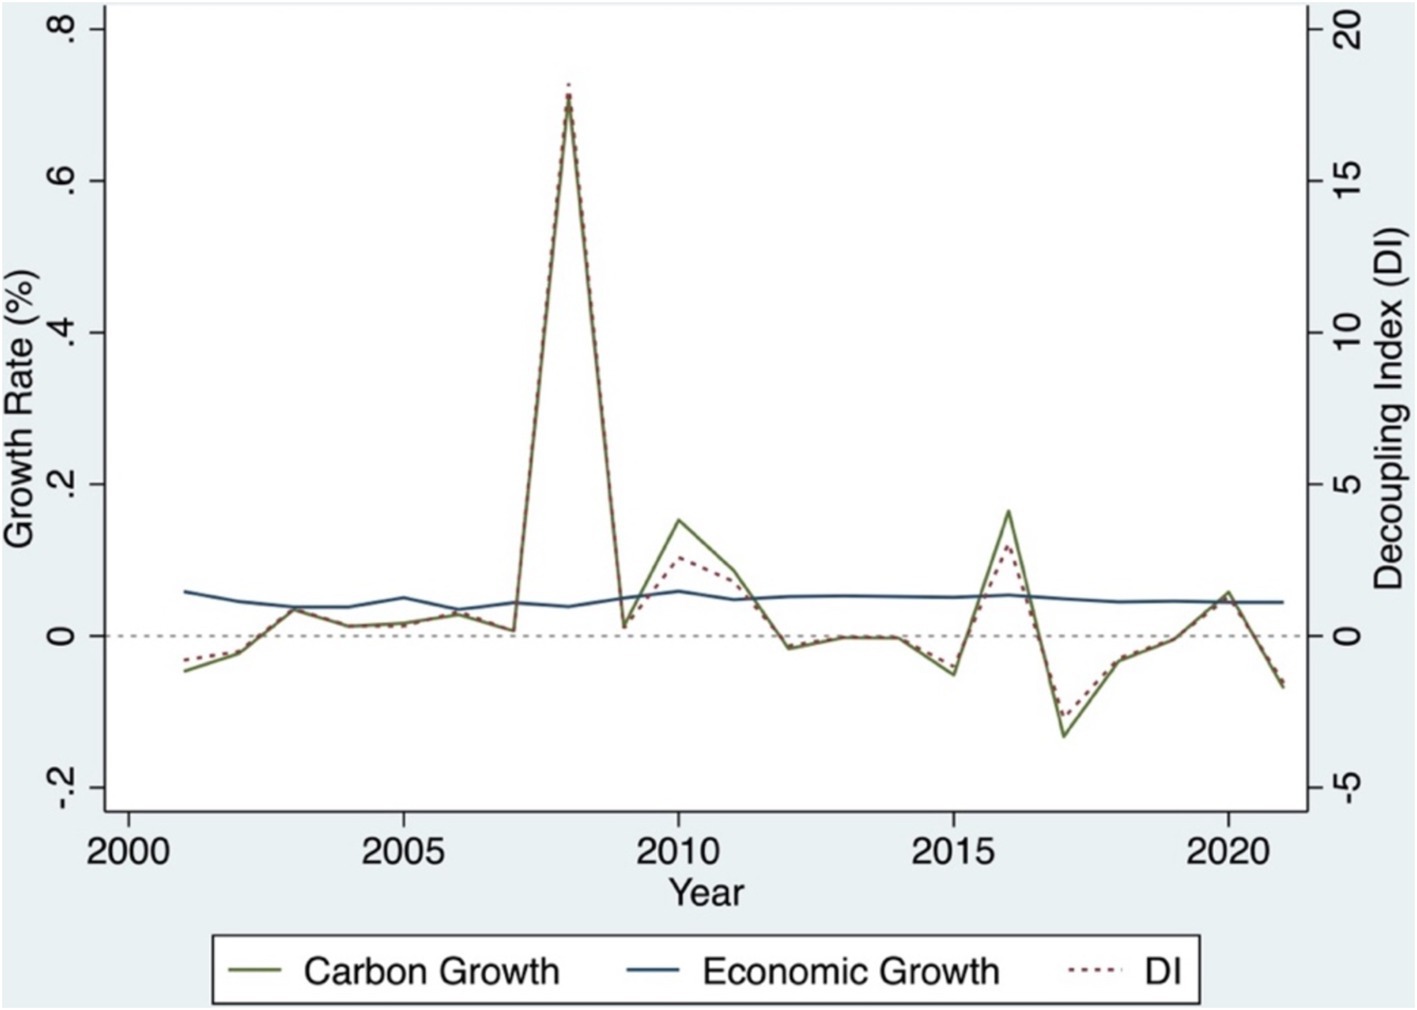
Figure 6. Decoupling index, growth rate of carbon emissions, and economic growth.
Between 2000 and 2011, decoupling in Qinghai’s agricultural production experienced wide fluctuations. During this period, it oscillated between strong, weak, and expansive negative decoupling to expansive coupling. However, from 2012 to 2021, the region predominantly achieved strong decoupling, with exceptions in 2016 and 2020 leading to expansive negative decoupling. These trends indicate that prior to 2012, efficiency in agricultural production in Qinghai was inconsistent, primarily due to fluctuating growth rates in carbon emissions influenced by changes in agricultural output and inefficient agricultural practices. Post-2012, there was a relative stabilization in the efficiency of agricultural carbon emissions. This pattern seems contradictory to the deterioration stage in green efficiency discussed in Figure 4. However, this deterioration was largely driven by economic growth, mirrored in the notably high economic growth rate during 2009–2016. Despite the overlapping 5 years (2012–2016) of the deterioration stage in green efficiency, the growth rate of carbon emissions largely decelerated into negative figures from 2012 to 2021. This slowdown led to strong decoupling in agricultural production. It implies that greener practices have become more effective in enhancing agricultural production while simultaneously reducing carbon emissions, signaling a positive shift toward sustainable agricultural practices in Qinghai.
The field research indicates that the provincial government has actively promoted green agricultural development, notably building a base for green organic agricultural and livestock products, in line with the national strategy for ecological civilization. This initiative is evident in the adoption of organic farming practices, certification of organic farmlands and grasslands, improved agricultural infrastructure, use of green feeds and organic fertilizers, and enhanced mechanization.
Geographically, Qinghai’s prefectures each present unique agricultural resource advantages. For instance, Haixi Prefecture, with its expansive lands, is ideal for large-scale cultivation of cash crops like gojiberry and quinoa. Additionally, its vast uncultivated and semi-arid areas are utilized for solar and wind power generation. Each county within the prefecture has distinctive resources contributing to diverse farming and livestock production capabilities. In contrast, prefectures such as Hainan and Huangnan, though better suited for farming and livestock, are predominantly characterized by smallholder farms which limit large-scale operations. The presence of the Yellow River through Hainan and Huangnan enhances their fishing output, particularly in freshwater reservoirs.
Challenges in the region include the adverse effects of the highland climate on agriculture and limited market competitiveness of local agricultural products like mutton, yak meat, and barley. Despite the availability of high-quality organic meats from free-range livestock, there is a lack of proper labeling and market transparency. The quality of meat from large-scale farms is often poor, compromised by using low-quality feed and chemicals aimed at increasing profit margins. Local producers also face competition from superior imported meats from Australia and New Zealand.
Overall, there is significant potential for developing green agriculture in Qinghai. Opportunities include leveraging the burgeoning renewable energy sector to enhance agricultural machinery and equipment, aligning with the Five-Year Plan’s focus on innovative and ecological agricultural products, and the emergence of small businesses experimenting with new product brands and markets, setting the stage for further development of green agriculture.
The study assessed greening agriculture in Qinghai, China from 2000 to 2021 in response to climate change. Throughout the studied period, Qinghai experienced various phases of green agricultural efficiency: initial stabilization, followed by a period of deterioration, subsequent recovery, and recent efficient management stages, correlating closely with changes in policy and economic strategies. The decline in green efficiency was correlated to the rapid increase in agrochemical fertilizers, plastic film usage, diesel consumption, and mechanization. To counter the adverse environmental repercussions of intensive farming, sustainable green agricultural practices have gained momentum in recent years, marking a pivotal step toward carbon neutrality in response to climate change.
This study also underscores several policy implications in greening agricultural production in response to climate change:
1. Given the positive correlation between green agricultural practices and efficiency in carbon emission management for climate stabilization, policies should emphasize investments in research and deployment of sustainable farming techniques that reduce carbon emissions, improve land use, and increase the energy efficiency of agricultural processes. Support for innovations such as precision agriculture, bio-fertilizers, and renewable energy sources in farming should be encouraged.
2. The study highlights increased agricultural inputs that were linked to a reduction in green efficiency. This suggests a need for targeted policy interventions during transition phases that might include better management of agricultural inputs, enhancing resource efficiency, promoting the use of organic inputs, stricter regulations on energy and agrochemical use, and improving waste management practices in agriculture to minimize environmental impacts.
3. The varying efficiency stages underscore the necessity of consistent and adaptive policy frameworks. The recovery phase (2017–2019) and the efficient phase (2020–2021) suggest that ongoing efforts to enhance green efficiency are beginning to bear fruit. Continued governmental support through targeted subsidies, research funding for climate smart and green technologies, the use of energy-efficient machinery and equipment, and educational programs for farmers on sustainable practices will be crucial to sustain and build on these gains.
4. The varying decoupling trends indicate the necessity for continuous monitoring and adaptation of agricultural strategies to ensure that economic growth does not lead to proportional increases in carbon emissions. Policies should focus on maintaining strong decoupling by integrating carbon management into all aspects of agricultural planning and development.
5. Qinghai’s experience underscores the importance of tailored regional climate change policies that take into account local conditions and challenges. Policies should support specific regional needs and potentialities, encouraging practices that are suitable for local ecological and socio-economic contexts, which could include support for organic farming, sustainable livestock practices, and preservation of local biodiversity.
Finally, this study presents two key limitations. First, despite conducting fieldwork within the study area, the integration of qualitative outcomes from this fieldwork into the overall study has been insufficient. The research predominantly depends on quantitative data and analysis. Second, the scope of the study is limited to Qinghai Province in China. Nonetheless, the findings from this research may have potential applicability to other provinces on the Qinghai-Tibetan Plateau and in similar contexts.
The original contributions presented in the study are included in the article Supplementary material, further inquiries can be directed to the corresponding author.
NN: Writing – original draft, Writing – review & editing, Data curation, Methodology, Supervision, Conceptualization, Formal analysis, Project administration, Validation, Investigation, Funding acquisition, Resources, Visualization, Software. MY: Writing – review & editing, Data curation, Supervision, Conceptualization, Investigation, Resources, Visualization.
The author(s) declare that financial support was received for the research, authorship, and/or publication of this article. This project is supported by the Postdoctoral Fellowship Program of CPSF under grant number GZC20240039.
The authors declare that the research was conducted in the absence of any commercial or financial relationships that could be construed as a potential conflict of interest.
All claims expressed in this article are solely those of the authors and do not necessarily represent those of their affiliated organizations, or those of the publisher, the editors and the reviewers. Any product that may be evaluated in this article, or claim that may be made by its manufacturer, is not guaranteed or endorsed by the publisher.
The Supplementary material for this article can be found online at: https://www.frontiersin.org/articles/10.3389/fsufs.2024.1492883/full#supplementary-material
Andrei, J., Avram, S., Băncescu, I., Deac, I., Gheorghe, C., and Diaconu, A. I. (2022). Decoupling of CO2, CH4, and N2O agriculture emissions in the EU. Front. Environ. Sci. 10:458. doi: 10.3389/fenvs.2022.920458
Ang, B. (2004). Decomposition analysis for policymaking in energy. Energy Policy 32, 1131–1139. doi: 10.1016/s0301-4215(03)00076-4
Ang, B. (2005). The LMDI approach to decomposition analysis: a practical guide. Energy Policy 33, 867–871. doi: 10.1016/j.enpol.2003.10.010
Ang, B. (2015). LMDI decomposition approach: a guide for implementation. Energy Policy 86, 233–238. doi: 10.1016/j.enpol.2015.07.007
Ang, B., Zhang, F., and Choi, K. C. (1998). Factorizing changes in energy and environmental indicators through decomposition. Energy 23, 489–495. doi: 10.1016/s0360-5442(98)00016-4
Bai, Y., Hua, C., Jiao, J., Yang, M., and Li, F. (2018). Green efficiency and environmental subsidy: evidence from thermal power firms in China. J. Clean. Prod. 188, 49–61. doi: 10.1016/j.jclepro.2018.03.312
Center for International Knowledge on Development (CIKD). (2021). “China’s Progress Report on Implementation of the 2030 Agenda for Sustainable Development (2021).” Available at: https://www.fmprc.gov.cn/mfa_eng/topics_665678/2030kcxfzyc/202109/P020211019152754484797.pdf (Accessed July 8, 2024).
Cheng, G. (2014). Data envelopment analysis: Methods and MaxDEA software. China: Intellectual Property Publishing House.
Chen, W., Chen, J., Xu, D., Liu, J., and Niu, N. (2017). Assessment of the practices and contributions of China’s green industry to the socio-economic development. J. Clean. Prod. 153, 648–656. doi: 10.1016/j.jclepro.2016.11.065
Chen, Y., Miao, J., and Zhu, Z. (2021). Measuring green total factor productivity of China's agricultural sector: a three-stage SBM-DEA model with non-point source pollution and CO2 emissions. J. Clean. Prod. 318:128543. doi: 10.1016/j.jclepro.2021.128543
Chen, Z., Sarkar, A., Rahman, A., Li, X., and Xia, X. (2022). Exploring the drivers of green agricultural development (GAD) in China: a spatial association network structure approaches. Land Use Policy 112:105827. doi: 10.1016/j.landusepol.2021.105827
Ding, S., and Zhang, H. (2023). Forecasting Chinese provincial CO2 emissions: a universal and robust new-information-based grey model. Energy Econ. 121:106685. doi: 10.1016/j.eneco.2023.106685
Dong, F., Li, J., Wang, Y., Zhang, X., Zhang, S., and Zhang, S. (2019). Drivers of the decoupling indicator between the economic growth and energy-related CO2 in China: a revisit from the perspectives of decomposition and spatiotemporal heterogeneity. Sci. Total Environ. 685, 631–658. doi: 10.1016/j.scitotenv.2019.05.269
Dong, H., Feng, Z., Yang, Y., Li, P., and You, Z. (2021). Sustainability assessment of critical natural capital: a case study of water resources in Qinghai Province, China. J. Clean. Prod. 286:125532. doi: 10.1016/j.jclepro.2020.125532
Du, Y., Liu, Y., Hossain, M. A., and Chen, S. (2022). The decoupling relationship between China’s economic growth and carbon emissions from the perspective of industrial structure. J. Clean. Prod. 20, 49–58. doi: 10.1016/j.cjpre.2022.03.006
Fang, L., Hu, R., Mao, H., and Chen, S. (2021). How crop insurance influences agricultural green total factor productivity: evidence from Chinese farmers. J. Clean. Prod. 321:128977. doi: 10.1016/j.jclepro.2021.128977
Fan, Y., and Fang, C. (2020). A comprehensive insight into water pollution and driving forces in Western China—case study of Qinghai. J. Clean. Prod. 274:123950. doi: 10.1016/j.jclepro.2020.123950
Feng, S., Lu, H., and Liu, Y. (2021). The occurrence of microplastics in farmland and grassland soils in the Qinghai-Tibet plateau: different land use and mulching time in facility agriculture. Environ. Pollut. 279:116939. doi: 10.1016/j.envpol.2021.116939
Flammini, A., Pan, X., Tubiello, F. N., Qiu, S. Y., Souza, L. R., Quadrelli, R., et al. (2022). Emissions of greenhouse gases from energy use in agriculture, forestry and fisheries: 1970–2019. Earth System Sci. Data 14, 811–821. doi: 10.5194/essd-14-811-2022
Food and Agriculture Organization of the United Nations (FAO). (2021a). Emissions from agriculture and Forest land. Global, regional and country trends 1990–2019. Available at: http://www.fao.org/food-agriculture-statistics/data-release/data-release-detail/en/c/1413420/ (Accessed July 8, 2024).
Food and Agriculture Organization of the United Nations (FAO). (2021b). Green and Climate-Resilient Agriculture. Available at: https://www.fao.org/3/cb6978en/cb6978en.pdf (Accessed July 8, 2024).
Food and Agriculture Organization of the United Nations (FAO). (2023). Regional Technical Platform on Green Agriculture. Available at: https://www.fao.org/3/cc6857en/cc6857en.pdf (Accessed July 8, 2024).
Grønmo, S. (2019). Social research methods: Qualitative, quantitative and mixed methods approaches. Sage.
Guo, H., Yi, X., Pan, C., Yang, B., and Li, Y. (2021). Analysis on the temporal and spatial features of the coupling and coordination of industrialization and agricultural green development in China during 1990–2019. Int. J. Environ. Res. Public Health 18:8320. doi: 10.3390/ijerph18168320
Guo, X., Huang, S., and Wang, Y. (2020). Influence of agricultural mechanization development on agricultural green transformation in Western China, based on the ML index and spatial panel model. Math. Probl. Eng. 2020, 1–17. doi: 10.1155/2020/6351802
Haijing, R., Yafei, L., and Shengxi, D. (2019). Research on the measurement of agricultural green development level in Qinghai Province. IOP Conference Series: Earth and Environ. Sci. 267:052031. doi: 10.1088/1755-1315/267/5/052031
Han, X., Wang, Y., Yu, W., and Xia, X. (2023). Coupling and coordination between green finance and agricultural green development: evidence from China. Financ. Res. Lett. 58:104221. doi: 10.1016/j.frl.2023.104221
He, W., Li, E., and Cui, Z. (2021). Evaluation and influence factor of green efficiency of China’s agricultural innovation from the perspective of technical transformation. Chin. Geogr. Sci. 31, 313–328. doi: 10.1007/s11769-021-1192-x
Hofmann, T., Ghoshal, S., Tufenkji, N., Adamowski, J. F., Bayen, S., Chen, Q., et al. (2023). Plastics can be used more sustainably in agriculture. Communications Earth Environ. 4:332. doi: 10.1038/s43247-023-00982-4
IPCC. (2019a). “Summary for policymakers,” in Climate change and land: an IPCC special report on climate change, desertification, land degradation, sustainable land management, food security, and greenhouse gas fluxes in terrestrial ecosystems. eds. P. R. Shukla, J. Skea, E. Calvo Buendia, V. Masson-Delmotte, H.- O. Pörtner, and D. C. Roberts, et al.
IPCC. (2019b). “Technical summary,” in Climate change and land: an IPCC special report on climate change, desertification, land degradation, sustainable land management, food security, and greenhouse gas fluxes in terrestrial ecosystemI. eds. P. R. Shukla, J. Skea, E. Calvo Buendia, V. Masson-Delmotte, H.-O. Pörtner, and D. C. Roberts, et al.
IPCC (2023). Climate change 2023: Synthesis report. Contribution of working groups I, II and III to the sixth assessment report of the intergovernmental panel on climate change. Geneva, Switzerland: IPCC, 35–115.
Kaya, Y. (1990). Impact of carbon dioxide emission control on GNP growth: Interpretation of proposed scenarios. Paris: IPCC Energy and Industry Subgroup, Response Strategies Working Group.
Li, J., Li, S., Liu, Q., and Ding, J. (2022). Agricultural carbon emission efficiency evaluation and influencing factors in Zhejiang province, China. Front. Environ. Sci. 10:1005251. doi: 10.3389/fenvs.2022.1005251
Li, M., Liu, S., Sun, Y., and Liu, Y. (2021). Agriculture and animal husbandry increased carbon footprint on the Qinghai-Tibet plateau during past three decades. J. Clean. Prod. 278:123963. doi: 10.1016/j.jclepro.2020.123963
Lioutas, E. D., Charatsari, C., and De Rosa, M. (2021). Digitalization of agriculture: a way to solve the food problem or a trolley dilemma? Technol. Soc. 67:101744. doi: 10.1016/j.techsoc.2021.101744
Liu, D., Zhu, X., and Wang, Y. (2021). China's agricultural green total factor productivity based on carbon emission: an analysis of evolution trend and influencing factors. J. Clean. Prod. 278:123692. doi: 10.1016/j.jclepro.2020.123692
Liu, X., and Xu, Y. (2023). Analysis of dynamic changes and Main obstacle factors of grain supply and demand balance in Northwest China. Sustain. For. 15:10835. doi: 10.3390/su151410835
Liu, Y., and Feng, C. (2019). What drives the fluctuations of “green” productivity in China’s agricultural sector? A weighted Russell directional distance approach. Resour. Conserv. Recycl. 147, 201–213. doi: 10.1016/j.resconrec.2019.04.013
Liu, Y., Sun, D., Wang, H., Wang, X., Yu, G., and Zhao, X. (2020). An evaluation of China’s agricultural green production: 1978–2017. J. Clean. Prod. 243:118483. doi: 10.1016/j.jclepro.2019.118483
Liu, Z., Wu, D., He, B.-J., Wang, Q., Yu, H., Ma, W., et al. (2019). Evaluating potentials of passive solar heating renovation for the energy poverty alleviation of plateau areas in developing countries: A case study in rural Qinghai-Tibet Plateau, China. Sol. Energy 187, 95–107. doi: 10.1016/j.solener.2019.05.049
Liu, Z., Zhang, M., Li, Q., and Zhao, X. (2023). The impact of green trade barriers on agricultural green total factor productivity: evidence from China and OECD countries. Econ. Analysis and Policy 78, 319–331. doi: 10.1016/j.eap.2023.03.011
Ma, G., Lv, D., Luo, Y., and Jiang, T. (2022). Environmental regulation, urban-rural income gap and agricultural green Total factor productivity. Sustain. For. 14:8995. doi: 10.3390/su14158995
Ma, W., Liu, T., Li, W., and Yang, H. (2023). The role of agricultural machinery in improving green grain productivity in China: towards trans-regional operation and low-carbon practices. Heliyon 9:e20279. doi: 10.1016/j.heliyon.2023.e20279
Meng, M., and Qu, D. (2022). Understanding the green energy efficiencies of provinces in China: a super-SBM and GML analysis. Energy 239:121912. doi: 10.1016/j.energy.2021.121912
Ministry of Agriculture and Rural Affairs (MARA). (2022). “农业农村部财政部关于认定第四批国家现代农业产业园的通知” (Notice of the Ministry of Agriculture and Rural Affairs and the Ministry of Finance on the identification of the fourth batch of national modern agricultural industrial parks). Available at: http://www.moa.gov.cn/govpublic/FZJHS/202201/t20220125_6387615.htm. (accessed on October 11, 2023).
OECD (2002). Indicators to measure decoupling of environmental pressures for economic growth. Paris: OECD.
Qinghai Provincial People's Congress (QPPC). (2021). Outline of the 14th Five-Year Plan for National Economic and Social Development of Qinghai Province and the Long-Range Goals for 2035. Available at: http://czt.qinghai.gov.cn/static/media/20230613085526_395.pdf (accessed on 12 October 2023).
Shan, H. (2008). Re-estimation of China's physical capital stock K: 1952-2006. J. Quantitative & Technical Econ. 10, 17–31.
Shan, Y., Huang, Q., Guan, D., and Hubacek, K. (2020). China CO2 emission accounts 2016-2017. Scientific Data. 7:54. doi: 10.1038/s41597-020-0393-y
Sheng, P., Li, J., Zhai, M., and Majeed, M. T. (2021). Economic growth efficiency and carbon reduction efficiency in China: coupling or decoupling. Energy Rep. 7, 289–299. doi: 10.1016/j.egyr.2020.12.043
Shen, Z., Baležentis, T., Chen, X., and Valdmanis, V. (2018). Green growth and structural change in Chinese agricultural sector during 1997–2014. China Econ. Rev. 51, 83–96. doi: 10.1016/j.chieco.2018.04.014
Shen, Z., Wang, S., Boussemart, J. P., and Hao, Y. (2022). Digital transition and green growth in Chinese agriculture. Technol. Forecast. Soc. Chang. 181:121742. doi: 10.1016/j.techfore.2022.121742
Song, Y., Zhang, B., Wang, J., and Kwek, K. (2022). The impact of climate change on China’s agricultural green total factor productivity. Technol. Forecast. Soc. Chang. 185:122054. doi: 10.1016/j.techfore.2022.122054
Tapio, P. (2005). Towards a theory of decoupling: degrees of decoupling in the EU and the case of road traffic in Finland between 1970 and 2001. Transp. Policy 12, 137–151. doi: 10.1016/j.tranpol.2005.01.001
Tone, K. (2001). A slacks-based measure of efficiency in data envelopment analysis. Eur. J. Oper. Res. 130, 498–509. doi: 10.1016/S0377-2217(99)00407-5
Tone, K. (2002). A slacks-based measure of super-efficiency in data envelopment analysis. Eur. J. Oper. Res. 143, 32–41. doi: 10.1016/S0377-2217(01)00324-1
Tone, K. (2003). Dealing with undesirable outputs in DEA: a slacks-based measure (SBM) approach. GRIPS Research Report Series I, 2003–0005.
UNEP. (2011). Decoupling natural resource use and environmental impacts from economic growth, A Report of the Working Group on Decoupling to the International Resource Panel. Available at: https://www.unep.org/resources/report/decoupling-natural-resource-use-and-environmental-impacts-economic-growth [accessed on 7 August 2023].
United Nations Environment Programme (UNEP). (2011). Agriculture: Investing in Natural Capital—Towards a Green Economy Pathways to Sustainable Development and Poverty Eradication. Available at: https://wedocs.unep.org/20.500.11822/22006 (Accessed July 10, 2024).
United Nations Environment Programme (UNEP). (2022). Emissions gap report 2022: The closing window — Climate crisis calls for rapid transformation of societies. Nairobi. Available at: https://www.unep.org/emissions-gap-report-2022 (Accessed July 10, 2024).
Van Dijk, M., Morley, T., Rau, M., and Saghai, Y. (2021). A meta-analysis of projected global food demand and population at risk of hunger for the period 2010–2050. Nature Food 2, 494–501. doi: 10.1038/s43016-021-00322-9
Wang, F., Liu, S., Liu, H., Zhao, Y., Dong, Y., Lam-Son, P. T., et al. (2023). Resilience assessment of the nitrogen flow system in food production and consumption for sustainable development on the Qinghai-Tibet plateau. Sci. Total Environ. 896:165223. doi: 10.1016/j.scitotenv.2023.165223
Wang, Q., and Wang, X. (2020). Moving to economic growth without water demand growth--a decomposition analysis of decoupling from economic growth and water use in 31 provinces of China. Sci. Total Environ. 726:138362. doi: 10.1016/j.scitotenv.2020.138362
Wang, S. L., Huang, J., Wang, X., and Tuan, F. (2019). Are China’s regional agricultural productivities converging: how and why? Food Policy 86:101727. doi: 10.1016/j.foodpol.2019.05.010
Wang, W., Li, K., Liu, Y., Lian, J., and Hong, S. (2022). A system dynamics model analysis for policy impacts on green agriculture development: a case of the Sichuan Tibetan area. J. Clean. Prod. 371:133562. doi: 10.1016/j.jclepro.2022.133562
Wang, X., Shen, J., and Zhang, W. (2014). Emergy evaluation of agricultural sustainability of Northwest China before and after the grain-for-green policy. Energy Policy 67, 508–516. doi: 10.1016/j.enpol.2013.12.060
Wang, X., and Yan, L. (2022). Driving factors and decoupling analysis of fossil fuel related-carbon dioxide emissions in China. Fuel 314:122869. doi: 10.1016/j.fuel.2021.122869
Wang, X., and Zhang, Y. (2019). Carbon footprint of the agricultural sector in Qinghai Province, China. Appl. Sci. 9:2047. doi: 10.3390/app9102047
Xie, P., Gong, N., Sun, F., Li, P., and Pan, X. (2023). What factors contribute to the extent of decoupling economic growth and energy carbon emissions in China? Energy Policy 173:113416. doi: 10.1016/j.enpol.2023.113416
Xu, B., Chen, W., Zhang, G., Wang, J., Ping, W., Luo, L., et al. (2020). How to achieve green growth in China’s agricultural sector. J. Clean. Prod. 271:122770. doi: 10.1016/j.jclepro.2020.122770
Xu, X., Zhou, J., and Shu, Y. (2007). Estimation of the capital stock of three industries in China's provinces and regions. Statistical Res. 24, 6–13.
Yang, Y., Ma, H., and Wu, G. (2022). Agricultural green Total factor productivity under the distortion of the factor market in China. Sustain. For. 14:9309. doi: 10.3390/su14159309
Yu, L., Liu, S., Wang, F., Liu, Y., Li, M., Wang, Q., et al. (2022). Effects of agricultural activities on energy-carbon-water nexus of the Qinghai-Tibet plateau. J. Clean. Prod. 331:129995. doi: 10.1016/j.jclepro.2021.129995
Zhang, J., Wu, G., and Zhang, J. (2004). The estimation of China’s provincial capital stock: 1952-2000 (Chinese). Econ. Res. 10:35–44.
Zhang, Q., Qu, Y., and Zhan, L. (2023). Great transition and new pattern: agriculture and rural area green development and its coordinated relationship with economic growth in China. J. Environ. Manag. 344:118563. doi: 10.1016/j.jenvman.2023.118563
Zhang, X., and Chen, H. (2021). Green agricultural development based on information communication technology and the panel space measurement model. Sustain. For. 13:1147. doi: 10.3390/su13031147
Zhao, N., Liu, X., Pan, C., and Wang, C. (2021). The performance of green innovation: from an efficiency perspective. Socio Econ. Plan. Sci. 78:101062. doi: 10.1016/j.seps.2021.101062
Keywords: green agriculture, climate change, carbon neutrality, policy, green efficiency
Citation: Nyangchak N and Yang M (2024) Greening agriculture as a response to climate change: a case study from China over 2000–2021. Front. Sustain. Food Syst. 8:1492883. doi: 10.3389/fsufs.2024.1492883
Edited by:
Matthew Tom Harrison, University of Tasmania, AustraliaReviewed by:
Shobhit Raj Vimal, University of Allahabad, IndiaCopyright © 2024 Nyangchak and Yang. This is an open-access article distributed under the terms of the Creative Commons Attribution License (CC BY). The use, distribution or reproduction in other forums is permitted, provided the original author(s) and the copyright owner(s) are credited and that the original publication in this journal is cited, in accordance with accepted academic practice. No use, distribution or reproduction is permitted which does not comply with these terms.
*Correspondence: Niangjijia Nyangchak, bnlhbmdjaGFrQHBrdS5lZHUuY24=
Disclaimer: All claims expressed in this article are solely those of the authors and do not necessarily represent those of their affiliated organizations, or those of the publisher, the editors and the reviewers. Any product that may be evaluated in this article or claim that may be made by its manufacturer is not guaranteed or endorsed by the publisher.
Research integrity at Frontiers
Learn more about the work of our research integrity team to safeguard the quality of each article we publish.