 Nguyen Ngoc Quang
- Marketing Faculty, National Economics University, Hanoi, Vietnam
This study investigated the factors affecting livelihood satisfaction and the differences between ethnic groups after selling farmland for renewable energy power projects in the Ninh Thuan province of Vietnam. Quantitative data were collected through direct questionnaires from 294 households selling land. Factor analysis and related tests were conducted to refine the scale and test the model, and structural equation modeling was conducted to assess the impact of factors on farmers’ livelihood satisfaction and compare the model between the Kinh and ethnic minority groups. The results showed that for the Kinh, all aspects impact livelihood satisfaction, in which economic-financial capital and natural capital have a stronger impact; for the minority group, natural capital has the strongest impact, and physical capital and social capital have insignificant impacts. This result indicates the need for individual solutions suitable for each group to promote livelihood satisfaction.
1 Introduction
The Government of Vietnam approved the Ninh Thuan Provincial Planning for the period 2021–2030 on November 10, 2023 (1,319/QD-TTg). Toward the end of 2023, Ninh Thuan was home to 57 renewable energy power projects (11 hydropower projects, 34 solar plants, and 12 wind power plants) with a total capacity of 3,161 MW. These renewable energy projects are using about 5,000 hectares of land, which has mainly been converted from agriculture and production forest land. The list of new sources approved to supplement planning will reach about 19,010.7 MW, of which wind power is 15,454 MW, solar power is 3,400 MW, hydropower is 144.5 MW, and other types (biomass power, waste power, geothermal power, and biogas power) are 12 MWW; with this capacity, it is necessary to recover and convert approximately 16,959 hectares of land (about 12,163 hectares of agricultural land and 4,796 hectares of non-agricultural land) and change the use purpose of about 13,464 hectares of agricultural land to non-agricultural land, resulting in 24,000–26,000 people being affected. Furthermore, Ninh Thuan’s potential power source capacity is very large, reaching 50,370 MW. Thus, the amount of land needed for this potential could be up to more than 30,000 hectares of land. At that time, the number of people directly affected was up to 55,000 people (1319/QD-TTg, 2023).
The livelihoods of farmers, especially those of ethnic minorities in central Vietnam, rely mainly on agricultural cultivation, agricultural land, or productive forest land. If this land resource is limited or lost, their livelihoods will be altered; they may have to change their careers or suffer from unemployment (Pham et al., 2021). Research in Chongqing, China, shows the importance of rural households choosing their livelihood strategy as well as the minority groups having diverse livelihoods (Mao et al., 2020). According to Abera et al. (2021), livelihood diversification (Chewaka resettled communities in southwestern Ethiopia) plays a decisive role in the reduction of poverty, food preservation, and improvement of the welfare of rural communities. The livelihoods of ethnic minority groups are also affected by climate change, as shown in studies conducted in Kenya (Olarewaju, 2020) and Vietnam (Tran et al., 2023); environmental studies on changes in areas of Kenya and Cameroon (Awazi and Quandt, 2021); and studies on the impact of management policies, such as the natural resource management program in Zimbabwe’s community (Jani, 2022) and the livelihood strategy approach to community-based planning and assessment in Indonesia (Walker et al., 2001). Research on the livelihoods of ethnic minorities combined with sustainable development of the buffer zone of Chu Yang Sing National Park, Central Highlands of Vietnam (Nguyen et al., 2019), shows that people who lose agricultural land need many resources for sustainable development, such as finance, infrastructure, and natural, social, and human resources.
Figures in the 2023 Statistical Yearbook of Vietnam show that the average population of Ninh Thuan in 2023 was about 601,200 people. The average population density was 179 people/km2, unevenly distributed and mainly concentrated in the coastal plain. The population consisted of three main ethnic groups, namely the Kinh ethnic group accounts for 75.6%, the Cham ethnic group for 13%, and the Raglay ethnic group for 11%; the remaining population belong to other ethnic groups (Statistical Yearbook of Vietnam, 2023). Compared to other localities, Ninh Thuan is a poor province with low and average income per capita; most people work in agriculture, and agricultural land is considered the main source of livelihood.
Based on the above issues, this study aimed to compare the differences in livelihood satisfaction between the majority Kinh ethnic group and other ethnic minority groups (Cham and Raglay) and build a sustainable livelihood model for the Ninh Thuan people when developing renewable energy, providing solutions that bring about a harmonious and sustainable combination of renewable energy projects and the livelihoods of those affected by these projects.
2 Research context
2.1 Land and agricultural land in Vietnam
Vietnam’s Land Law (2013) stipulates that land, including agricultural land, is owned by all people and managed on behalf of the State, and that the State can conduct land use planning, land allocation, and auctions to land users through the issuance of land use rights certificates. In the case of forestry and agricultural land, the State granted land use rights to all farmers from 1960 to 1993 and issued land use rights certificates in cases where people reclaimed and cultivated land before 1993. This law also allows forestry and agricultural land users to have the right to use, sublease, inherit, or sell their forest and agricultural land to others, but they do not have the right to own the land. The division and redistribution of forestry and agricultural land ended in 1993, when the first Land Law in Vietnam was introduced; this is why people born after this date in rural areas were not granted the right to use forestry and agricultural land. This policy fundamentally changed Vietnam’s legal land framework toward a market economy in which individuals, businesses, and organizations lease land from the State according to land planning. Previously granted forestry and agricultural land still has the rights mentioned in the first part of this paragraph. Consequently, many people born after 1993 no longer chose agriculture because they were not granted land (Huong, 2014).
Vietnam’s agricultural land has also expanded since the 1990s, with policies promoting domestic migration to uncultivated lands, mountainous areas, and remote rural areas, resulting in an increase in the total area of agricultural land by approximately 70% from 1975 to 1990. In the period from 1990 to 2000, the growth rate of agricultural land area decreased. According to data from the General Statistics Office, by 2023, the total area of agricultural production land reached 11.673 million hectares and forestry land reached 15.468 million hectares, corresponding to 35.23 and 46.683% of the country’s total land resources, with about 62 million people living in rural areas. The average agricultural land area per capita in the year 2023 was about 0.188 hectares (Statistical Yearbook of Vietnam, 2023). Vietnam’s agricultural production is characterized by being mainly tied to households, with nearly 90% of the total agricultural land area; however, the average land area per household is small, farming methods are still outdated, and modern technologies have not been applied according to the scale of modern agricultural farms.
In addition, owing to the implementation of the policy of equitable land division, each household can be divided into multiple plots of land in different locations based on differences in land quality, access to water, and distance and time of division (Nguyen and Warr, 2020). The fragmented status of divided land plots limits the application of mechanized machinery in agricultural production (Ayerst et al., 2020). Since Vietnam implemented its policy of economic integration with the region and the world, the economic structure has fundamentally changed; the proportion of agriculture has decreased, while industry and services have grown significantly. Consequently, approximately 10 million hectares of land (agricultural and forestry land) have been converted to other land types in the past three decades (Nguyen and Warr, 2020). Thus, land resources, considered the main livelihood of farmers, are increasingly lacking and unable to meet farming needs. Farmers, especially ethnic minorities, have become victims of urbanization and industrialization (York et al., 2011).
2.2 Current status of Vietnamese farmers’ livelihoods after selling Forest and agricultural land
Agricultural production creates the main source of income for farming households; in terms of economic structure, it is also the main economic component of Vietnam. According to data from the General Statistics Office (GOS), although Vietnam is in the process of a strong transition from the agricultural sector to industry and services, the agricultural sector still accounts for 61.14% of the population, 64.25% of households, and 65.48% of working people, and agriculture accounts for 13.27% of the gross domestic product (GDP) (GSO-General Statistics Office, 2021). In recent years, the agricultural sector has experienced many positive changes, such as increased exports of fruits and agricultural products, but Vietnamese agriculture still has a low added value compared to the global value chain (Pham et al., 2021). The main reason for this situation is that agricultural production is still spontaneous by farmers, the scale of production is tied to households, the professional level of farmers is still low, and material resources are limited. Laborers are mostly young children and older adults (Vien, 2020). Agricultural production in households is increasingly losing its importance and position in livelihoods in the rural areas of Vietnam. However, this work is still considered as a traditional livelihood for farmers. This viewpoint has created the mindset of holding land for self-defense; this is the main reason why the progression of accumulating and concentrating land is slow and difficult, hindering the process of agricultural industrialization (Vien, 2020).
In recent years, the rapid development of wind and solar power in the central provinces of Vietnam has led to the conversion of large areas of forest and agricultural land into wind and solar farms. Consequently, farmers gradually lose agricultural land, which is the most important factor in their livelihoods. Farmers are forced to switch from the traditional farming activities of growing main crops such as rice, coffee, cashew nuts, and pepper to raising poultry animals such as chickens, ducks, and geese; livestock such as pigs, buffaloes, cows, sheep, and goats; or raising fish. Many large-scale livestock farms have been established (Pham et al., 2021). In recent years, many green, smart, and environment-friendly agricultural models have emerged, creating a trend toward sustainable agricultural development (Nguyen and Warr, 2020).
In addition to the group of farmers converting to a modern agricultural farm model, a number of farmers have switched to several service and production jobs, such as taxi drivers, truck drivers, retailers, and construction contractors. These jobs have absorbed many agricultural workers and created occupations associated with the urbanization process. Some other groups, due to limited qualifications, financial resources, and often being in remote areas, have accepted simple jobs that do not require work skills or education but provide them with a source of employment and modest income (Pham et al., 2021).
Vien (2020) showed that after transferring agricultural land during the process of industrialization and urbanization, many farmers did not have enough land for cultivation; as a result, they lacked jobs or did not work enough hours to support themselves. Research by Suu (2021) shows that farmers’ livelihoods are unsustainable compared to the amount of agricultural cultivation on land allocated to them by the State. Their livelihoods may not leave them starving, but they consistently lack the income to maintain a minimum life in urban fringe areas after agricultural land is confiscated. In addition, during the career transition process, these farmers face many risks such as epidemics in livestock farming and unemployment during economic recessions (Suu, 2021).
From the view of the Asian Development Bank (ADB) (1998) and the Government of Vietnam, appropriate policies are needed to support households affected by land acquisition to ensure that their living standards and income are maintained at an equivalent level or higher than before their land was confiscated and relocated when farmers lost agricultural land, resulting in loss of employment or related sources of income. More specifically, policies to support farmers need to ensure income after land recovery and sustainable livelihoods for affected families.
According to the Department for International Development (DIFI), livelihoods include the physical, financial, and social resources and support activities needed to enable farmers to earn a living (DFID [Department For International Development], 2001). Hanstad et al. (2004) put forward the view that a livelihood is sustainable when it has the ability to respond and recover if affected or can enhance capacity and assets (present and future) without eroding the base natural resources. This viewpoint requires the development of a compensation and support policy for farmers whose land is recovered to build sustainable livelihoods by ensuring human, material, financial, and natural resources in the process of converting livelihood methods to ensure increased income for people after land recovery.
2.3 Research location
Ninh Thuan is in South Central Vietnam, with a long coastline covering an area of over 3,350 km2. The terrain of this province is mainly characterized by hills and mountains, with over 63.5% of the entire area being mainly low mountains, with altitudes ranging from 200 to 1,000 m. Its coastline length is greater than 105 km. Semi-mountainous areas account for over 14% of the land area, and the remaining area is coastal plain, accounting for over 22% of the land area. The basic climatic characteristics of the province are tropical savannah and subdeserts. The weather is hot, dry, windy, and has strong year-round evaporation (GSO-General Statistics Office, 2021). Combined with wind from the East Sea, Ninh Thuan is known as a land of sunshine and wind, which are harsh for agricultural cultivation but appropriate for building renewable energy projects.
Ninh Thuan is a province with a small population; its gross regional domestic product (GRDP) reached 27,320 billion VND (equivalent to 1.2 billion USD at the 2020 exchange rate), GRDP per capita reached 43.8 million VND (1,944 USD), and the average GRDP growth rate was over 10% in the period 2016–2020 (GSO-General Statistics Office, 2021). The above figures show that Ninh Thuan is a poor province with a minimal population size, lacking the natural and social resources necessary to develop modern industry and agriculture. Therefore, the Government of Vietnam has chosen to develop Ninh Thuan to become Vietnam’s renewable energy center. Figure 1 is a map of Vietnam on the left, in which the Ninh Thuan province is red, and on the right is a darker provincial boundary with images of the province’s districts.
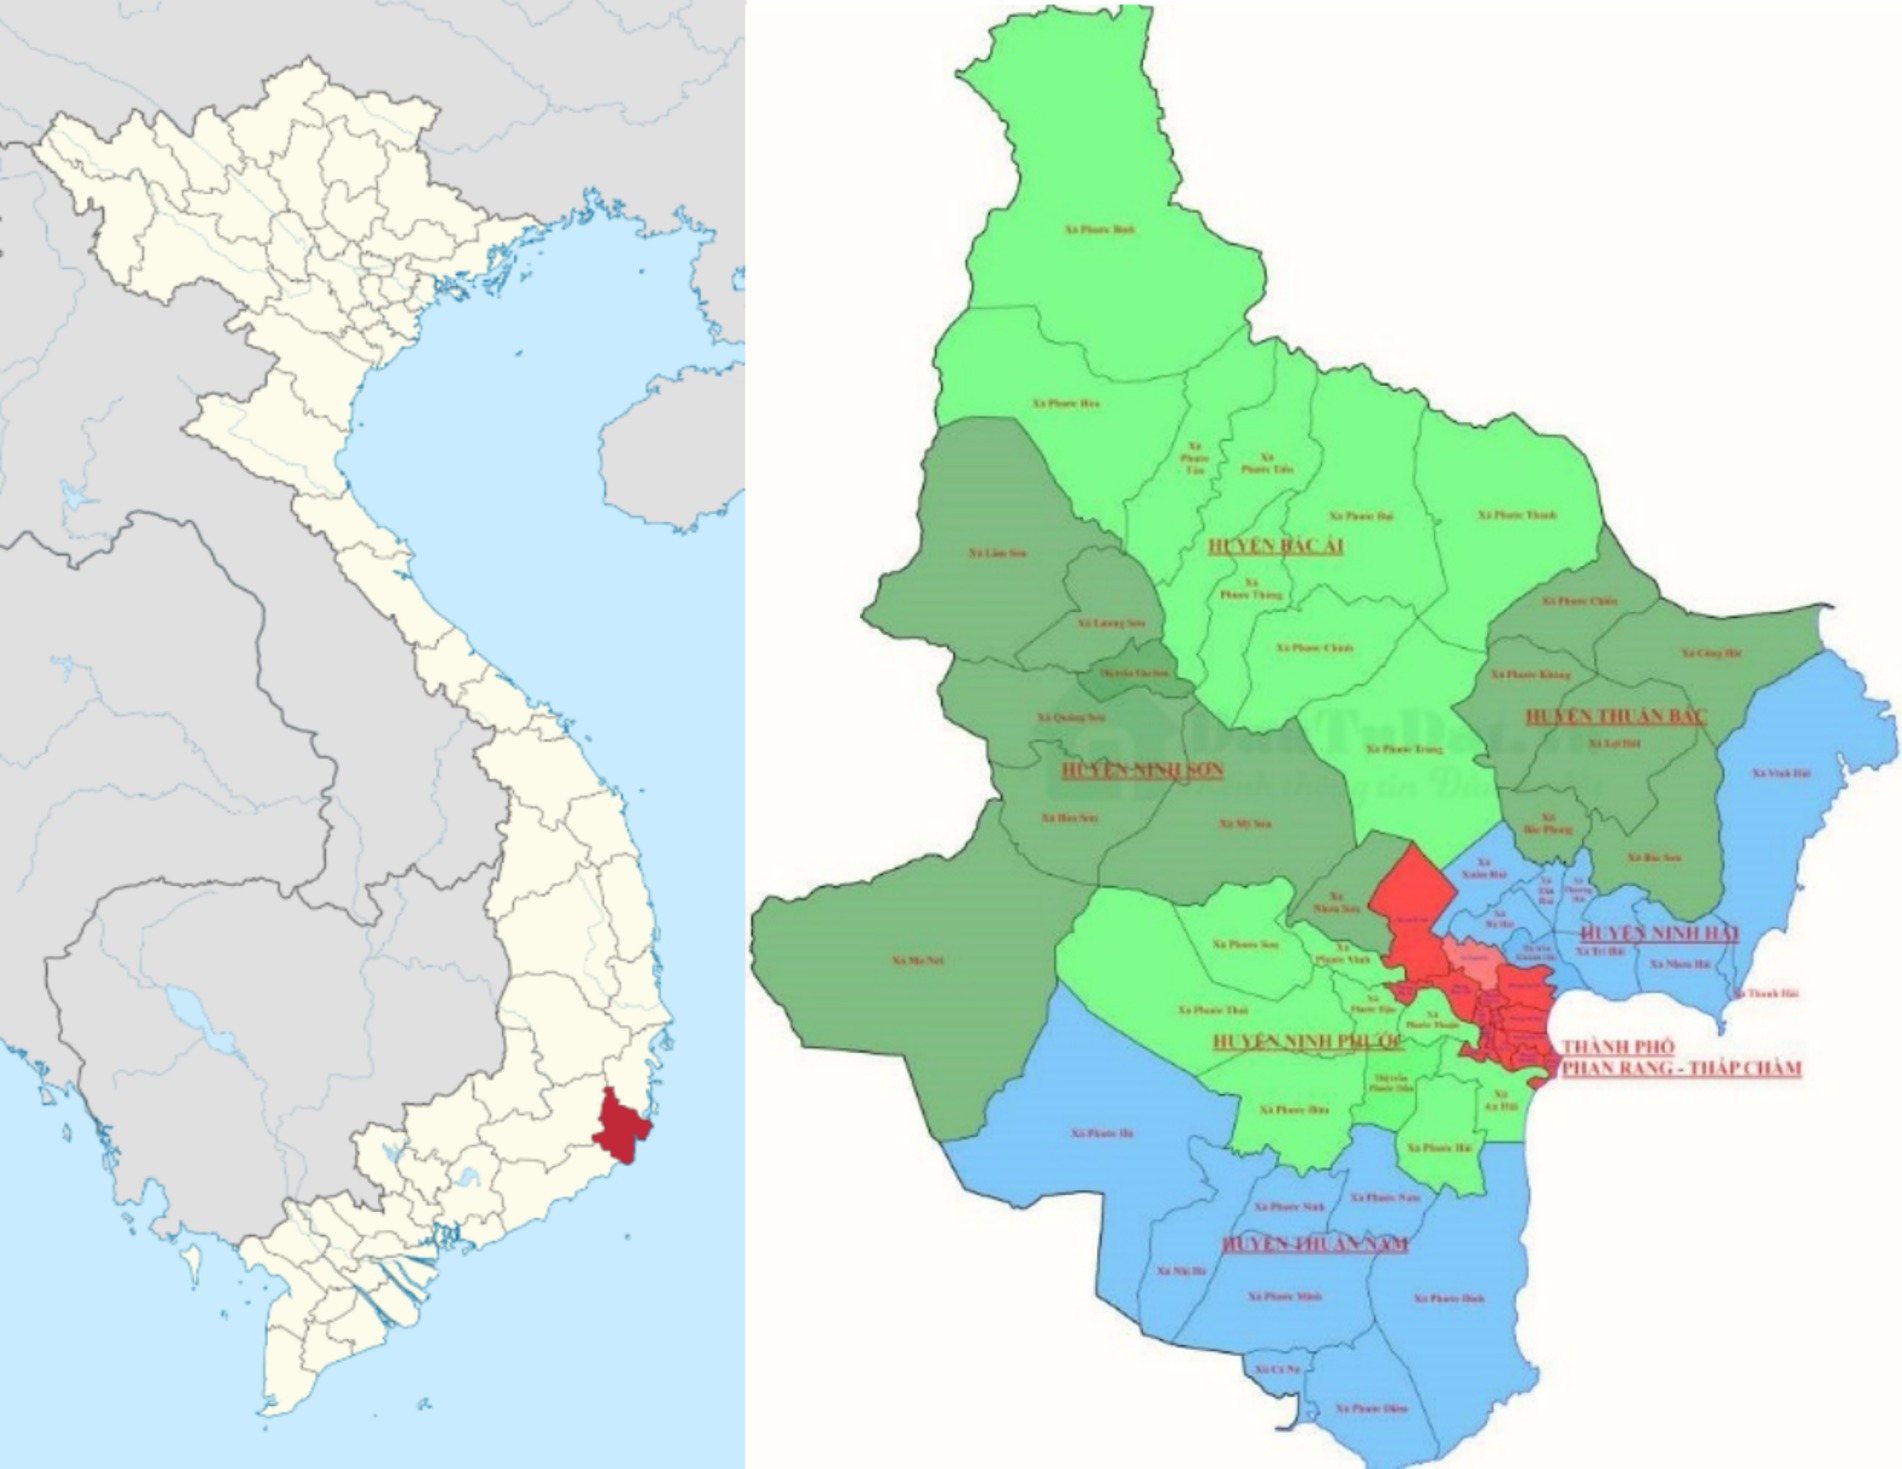
Figure 1. Ninh Thuan map.
3 Literature review
3.1 Livelihood and satisfaction
3.1.1 Livelihood capital
There are many approaches to studying livelihoods, including those of Chambers and Conway (1992), Scoones (1998), and the DFID [Department For International Development] (2001). In 2001, the UK DFID introduced the concept of livelihoods as a guide for its own support activities, in which livelihood “comprises the capabilities, assets and activities required for a means of living.” This concept is similar to that developed by Chambers and Conway (1992) and Scoones (1998). Dat et al. (2014) used this approach to study the vulnerability and adaptation of coastal livelihoods to the impacts of climate change in the northern coastal province of Vietnam. Hanstad et al. and Carney’s research confirms that a sustainable livelihood exists when it can address and recover from shocks and stresses and preserve or improve capabilities and assets (present and future) without depleting natural resources (Carney, 1998).
This study also used a livelihood model with five components that affect sustainable development (Morse et al., 2009). This model is presented in Figure 2, which includes the following factors: physical capital includes material elements such as production equipment, infrastructure, and technology needed for livelihoods. Economic-financial capital represents the ability to access money sources such as cash, credit, savings, and other financial assets that individuals and households need to achieve their goals. Social capital is understood as social and community resources that individuals and households can access and exploit to serve their livelihood needs, such as social groups, communities, and organizations. Social relationships, networks, associations, linkages, interactions, and exchanges help individuals and households access information sources and offer support to achieve living goals. Human capital also exists at the personnel and household level, which is the factor of available labor, including both quantity and quality; this takes shape from household size, health status, education and skills levels, leadership, and perceptions of formal and traditional ownership structures (procedures, rights, laws, and standards). The specific forms of human capital are knowledge, skills, labor, the ability to work, and good health, which help people achieve their goals and livelihood strategies. Natural capital comprises all natural resources, such as land, water, air (including quality and quantity measures), and related services through which individuals and household families effectively use these factors to create sustainable livelihoods. Depending on the livelihood characteristics of each region and population group, the need for natural capital varies greatly. Particularly for farmers, land resources are their primary and traditional source of capital.
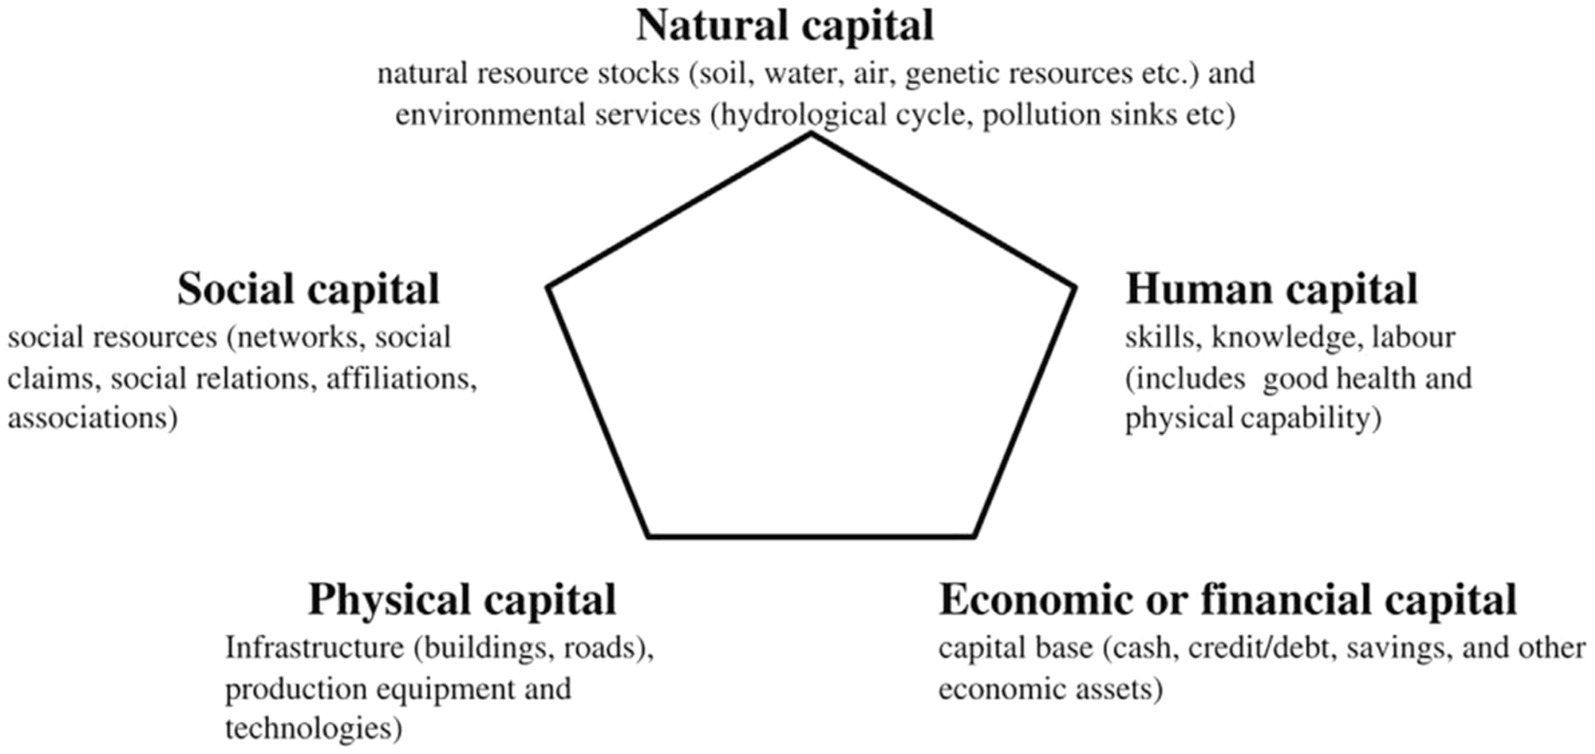
Figure 2. Sustainable livelihood capital model (Morse et al., 2009).
A model with five types of capital assets supports households in terms of capital, thereby reducing poverty and ensuring a sustainable livelihood (Ghazali et al., 2023; Tong et al., 2024). Furthermore, the model suggests that institutions, policies, and processes influence asset exposure and use, ultimately affecting farmers’ sustainable livelihoods (Paulo, 2005; He and Ahmed, 2022). The sustainable livelihood framework considers land resources as the central natural capital of rural household livelihoods and provides a foundation for them to approach other livelihood options and capital sources (Hanstad et al., 2004). Li et al. (2020) further develops the element of psychological capital into the sustainable livelihood assets. Studies in many countries conclude that land resources are the most valuable capital, an important means to achieve sustainable livelihoods for farmers, and that access to land determines livelihood security (Suu, 2021).
3.1.2 Impact of livelihood capital on satisfaction
Research by Khanal et al. (2024) on the impacts of livelihood assets on hydropower displacements’ livelihood strategies indicates that physical assets substantially influence livelihood strategies, promoting diversification and non-farming activities; social assets have a negative impact, whereas natural, financial, and human assets have no significant effect. Kumar et al. (2021) suggest that income sources and spending patterns after land sale, that is, professional income and increased spending on children’s education, household appliances, durables, entertainment, and events, positively and significantly affect farmers’ satisfaction. Basic infrastructure aspects, such as water, electricity, roads, and transportation, significantly influence farmers’ satisfaction. The results also show that improved living conditions and compensation, as well as their use for future financial enrichment after the land sale, significantly affect farmers’ satisfaction. In contrast, social facilities such as educational institutions, banks, hospitals, entertainment facilities, and social costs (i.e., pollution and health concerns) had no significant impact on farmer satisfaction. Niu et al. (2023) concluded that livelihood capital has a significantly positive impact on the subjective well-being of new professional farmers. The greater the accumulation of livelihood capital, the stronger their subjective well-being. However, when comparing the different social groups, there were differences in their levels of subjective well-being. Hu et al. (2023) concluded that livelihood capital and social adaptation both have a significant positive impact on herders’ life satisfaction and that the direct effect of social adaptation on life satisfaction is significantly greater than that of livelihood capital.
Research by Pham et al. (2021) in Hue indicates that when farmers have money from selling their land, most will buy costly durable goods, such as house building materials, cars, and motorbikes, or put it towards inheritance; as a result, they will spend all that money after 5 to 10 years. Only a small number of households finance this money to generate a new livelihood that helps them change their careers and establish a stable income; however, not all ethnic groups are the same. This research has opened up directions for us on the topic of differences in livelihood satisfaction between ethnic groups after selling farmland for renewable energy power projects in the Ninh Thuan province.
In this study, Kotler’s (1991) concept of satisfaction in the marketing field was used as the central dependent variable to evaluate the causal impact between five independent variables, which are the five components of the sustainable livelihood model (Morse et al., 2009), and the dependent variable, farmer satisfaction after selling land for renewable energy projects. According to Kotler (1991), satisfaction reflects a customer’s post-purchase assessment of product and service quality compared with pre-purchase expectations. In this case, farmer satisfaction was affected by the five components of the sustainable livelihood model. Truong (2022) also mentioned the use of the marketing satisfaction concept in studying livelihood and farmer issues.
3.2 Hypothesis and research methodology
With the research objective of comparing livelihood capital satisfaction between ethnic groups after selling farmland for renewable energy power projects, this study built a model to assess the impact of five factors in livelihood capital on people’s satisfaction after selling land and then compared this model with the Kinh group (the majority group) and other ethnic minority groups.
3.2.1 Hypothesis
The anticipated examination model included five independent factors corresponding to five sources of sustainable livelihoods (natural capital, physical capital, economic-financial capital, human capital, and social capital), and the dependent factor was farmer livelihood satisfaction. Thus, six hypotheses were proposed:
• Hypothesis H1: Natural capital (NACF) has a causal effect on farmers’ satisfaction (LLSF).
• Hypothesis H2: Physical capital (PHCF) has a causal effect on farmers’ satisfaction (LLSF).
• Hypothesis H3: Economic and financial capital (EFCF) has a causal effect on farmers’ livelihood satisfaction (LLSF).
• Hypothesis H4: Human capital (HUCF) has a causal effect on farmers’ livelihood satisfaction (LLSF).
• H5: Social capital (SOCF) has a causal effect on farmers’ satisfaction (LLSF).
• Hypothesis H6.0: There is no difference between Kinh farmers and ethnic minority groups in terms of the farmers’ livelihood satisfaction model.
• Hypothesis H6.1: There is a difference between Kinh farmers and ethnic minority groups in terms of the farmers’ livelihood satisfaction model.
3.2.2 Measurement of variables
The scale of independent variables was grouped into five factors according to the livelihood capital model; the variables in the scale were modified from Khanal et al. (2024), Hu et al. (2023), and He and Ahmed (2022). (1) Natural assets included five items; (2) physical assets included five items; (3) economic-financial assets included four items; (4) human assets included five items; and (5) social assets included four items. The dependent and independent variable scales were constructed as follows: For the dependent variable, the scale of farmers’ livelihood satisfaction was inherited and adjusted from He and Ahmed (2022), Hu et al. (2023), and Xiao et al. (2019), with six items: satisfaction with income increase, food safety, reasonable compensation policies, employment opportunities, improved living conditions, and enjoyment of infrastructure welfare. Table 1 presents the scale in detail.
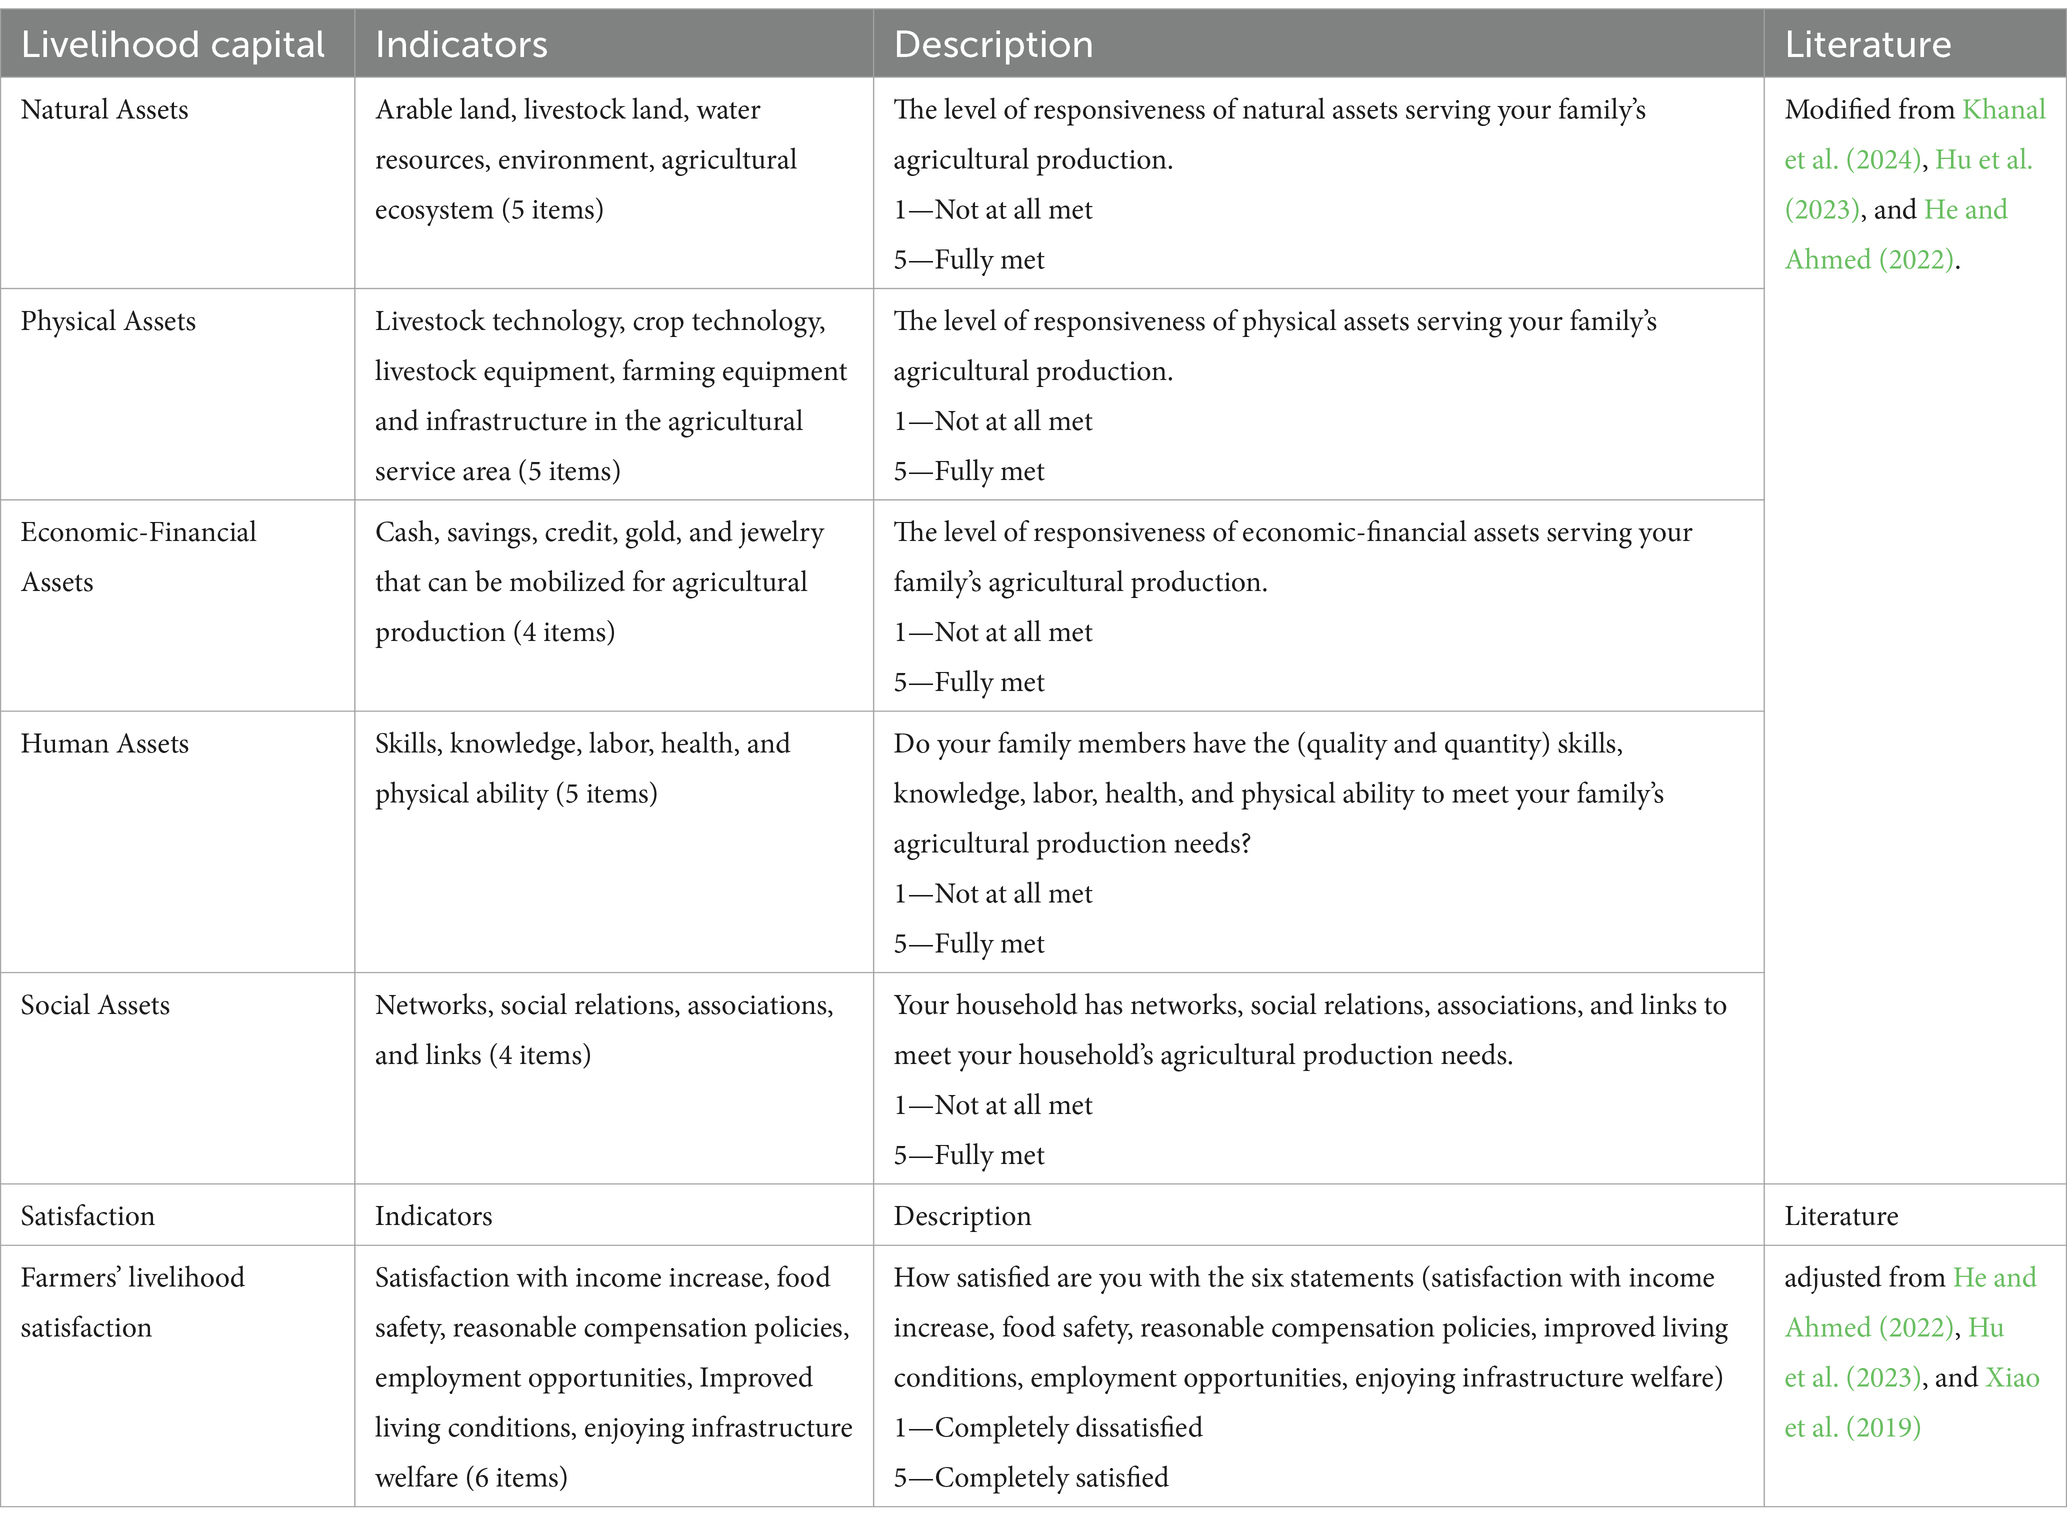
Table 1. Livelihood capital and satisfaction indicators.
4 Questionnaire, sample, data collection, and data analysis
The questions in the questionnaire were designed in three parts, wherein part one included the screening questions to select the right research subjects, part two involved the main question to build the research model with six factors and 29 variables (23 independent variables and 6 dependent variables; see Table 1), and part three involved the questions about the demographics of the research subjects, such as age, gender, education level, occupation that generates the main income of the family, family income, family size, population group, how the family used the money from selling land, description of house characteristics, and expensive durable items in the house.
This study was conducted through sampling, and the sampling method used was non-random (convenience) sampling by quota (selecting 3 out of 6 districts; in which Kinh households accounted for the majority of the population groups, not exceeding 70%). The reason for using this sampling method was because the author could not accurately determine the total study population and dispersed areas of the target households. The total population in this study included households that sold agricultural land or forest land to renewable energy power projects; these households resided in six districts with power projects: Bac Ai, Ninh Hai, Ninh Phuoc, Thuan Bac, Thuan Nam, and Ninh Son (see Figure 1). The sampling framework was formed from a list of households that sold land to the Bau Zon, Trung Nam Thuan Bac, Trung Nam Thuan Nam, Thien Tan, and Phuoc Thai power plants. This quantitative study was conducted in three districts of the Ninh Thuan province (Thuan Bac, Thuan Nam, and Ninh Phuoc), which have the most solar and wind power projects. Respondents were chosen from families that sold land for renewable power projects in 2019. Personal interviews were conducted at home between April and May 2024.
The sampling method used was non-random; therefore, the results of this study cannot be used to estimate the corresponding results of the entire study. Many scholars have proposed rules for determining the sample size in regression and factor analyses. The basic principle is that the larger the sample size, the better the quality of the statistical analysis. The sample-to-variable ratio was used to determine the sample size based on the number of variables in the study. This ratio should not be less than 5:1 (Hair et al., 2010; Hatcher, 1994; Suhr, 2006). The survey model included six factors and 29 variables. Therefore, the minimum number of samples required was 29 × 5 = 145. Kline (2005) offers sample size guidelines for analyzing structural equation models, suggesting that a sample of 100 is considered small, a sample of 100 to 200 is medium, and a sample of over 200 is considered large. The final dataset comprised 294 samples.
Participants were asked initial questions about their eligibility and willingness to participate, such as “Has your family directly sold forest or agricultural land to renewable energy projects within the past 5 years?” The participants were thoroughly informed about the aims of the study and expressed their understanding and willingness to participate freely. The authors pledged to keep the information confidential and that the response content will only be used in this study. This information was presented on the first page of the questionnaire. The participants read and agreed to provide information on the following pages of the questionnaire.
Data were entered and analyzed using SPSS 22 and AMOS 25 software. The data analysis process included descriptive statistical analysis, testing the reliability of the scale using Cronbach’s Alpha tool; Exploratory Factor Analysis (EFA), Confirmatory Factor Analysis (CFA), Structural Equation Modeling (SEM), and model comparison analysis were used to rigorously assess the variables and confirm the validity of the research model. EFA aimed to evaluate whether the proposed model structure is suitable for the specially designed questionnaire and data collected in this study. CFA was used to verify the factor structure of a set of observed variables and to test the hypothesis that a relationship exists between the observed variables and their underlying latent constructs. SEM tested and defined causal models between five independent factors corresponding to five sources of sustainable livelihoods and the dependent factor (farmers’ livelihood satisfaction) by comparing predicted covariances with observed data.
5 Research findings
5.1 Descriptive analysis
The personal characteristics of the research subjects were as follows: in terms of sex, males accounted for 55% and females accounted for 45%; in terms of age, the group over 50 years old accounted for 37%, followed by the group from 40 to 50 years old accounting for 25%, the group from 30 to 40 years old for 21%, and the group under 30 years old for 17%; in terms of educational level, the group that graduated from high school accounted for 46%, followed by the middle school graduate group accounting for 38%, and groups with other qualifications accounting for 16%. The Kinh ethnic group accounted for the largest proportion at 67%, followed by the Cham and Ragley ethnic groups at 29%, and the rest were other ethnic minorities at 4%. Occupations providing the main source of income for households were as follows: agricultural production accounted for the largest proportion at 38%; trading in the market was second at 21%; home-based shop owners accounted for 14%; bricklayers and carpenters accounted for 12%; taxi, truck, and bus drivers accounted for 10%; and other occupations accounted for 5%. Regarding average monthly household income, the group of households with income less than 12.5 million VND (500 USD) accounted for the largest proportion (61%), followed by the group of households with income from 12.5 25 million VND (500–1,000 USD), accounting for 22%, and the group of households with income greater than 25 million VND (1,000 USD), accounting for 17%. Observing household assets, most households had permanent housing built solidly with bricks and durable goods, such as LCD TVs, freezers, motorbikes, washing machines, and other essential appliances. These assets were primarily derived from the sale of land for renewable energy projects.
5.2 Exploratory factor analysis and confirmatory factor analysis
5.2.1 Exploratory factor analysis
The research model included one dependent factor (six variables: LLS1-LLS6), divided into two sub-factors, in which sub-factor 1 included four variables (satisfaction with income increase, food safety, reasonable compensation policies, and employment opportunities) and sub-factor 2 included two variables (improved living conditions and enjoyment of infrastructure welfare). The 23 variables were divided into five corresponding independent factors in the livelihood capital model (natural capital (NAC), physical capital (PHC), economic-financial capital (EFC), human capital (HUC), and social capital (SOC)).
EFA with principal component extraction and varimax rotation is presented in Table 2. These techniques help reduce the number of variables; instead of analyzing 23 independent variables and six dependent variables, only five independent factors and one dependent factor need to be analyzed. Kaiser-Meyer-Olkin (KMO) is a measure of the proportion of variance among variables; the higher the proportion, the higher the KMO value, and the more suited the data are to factor analysis. A KMO value of 0.832 is considered meritorious. Bartlett’s Test Sig. = 0.000 < 0.05. Rotation Sums of Squared Loadings (Cumulative %) = 69% > 50%. This confirms that 69% of the data variation is described by the model with five factors. Cronbach’s alpha results explain that all scales have coefficients greater than 0.65 and the total variable correlation coefficients are greater than 0.3. The Rotation Sums of Squared Loadings of LLSF is 0.86, which confirms that 86% of the data variation is described by the two sub-factors, LLSF1 and LLSF2. Thus, the 29 variables used had sufficient reliability for the CFA. These results are consistent with the experimental criteria of Hair et al. (2010).
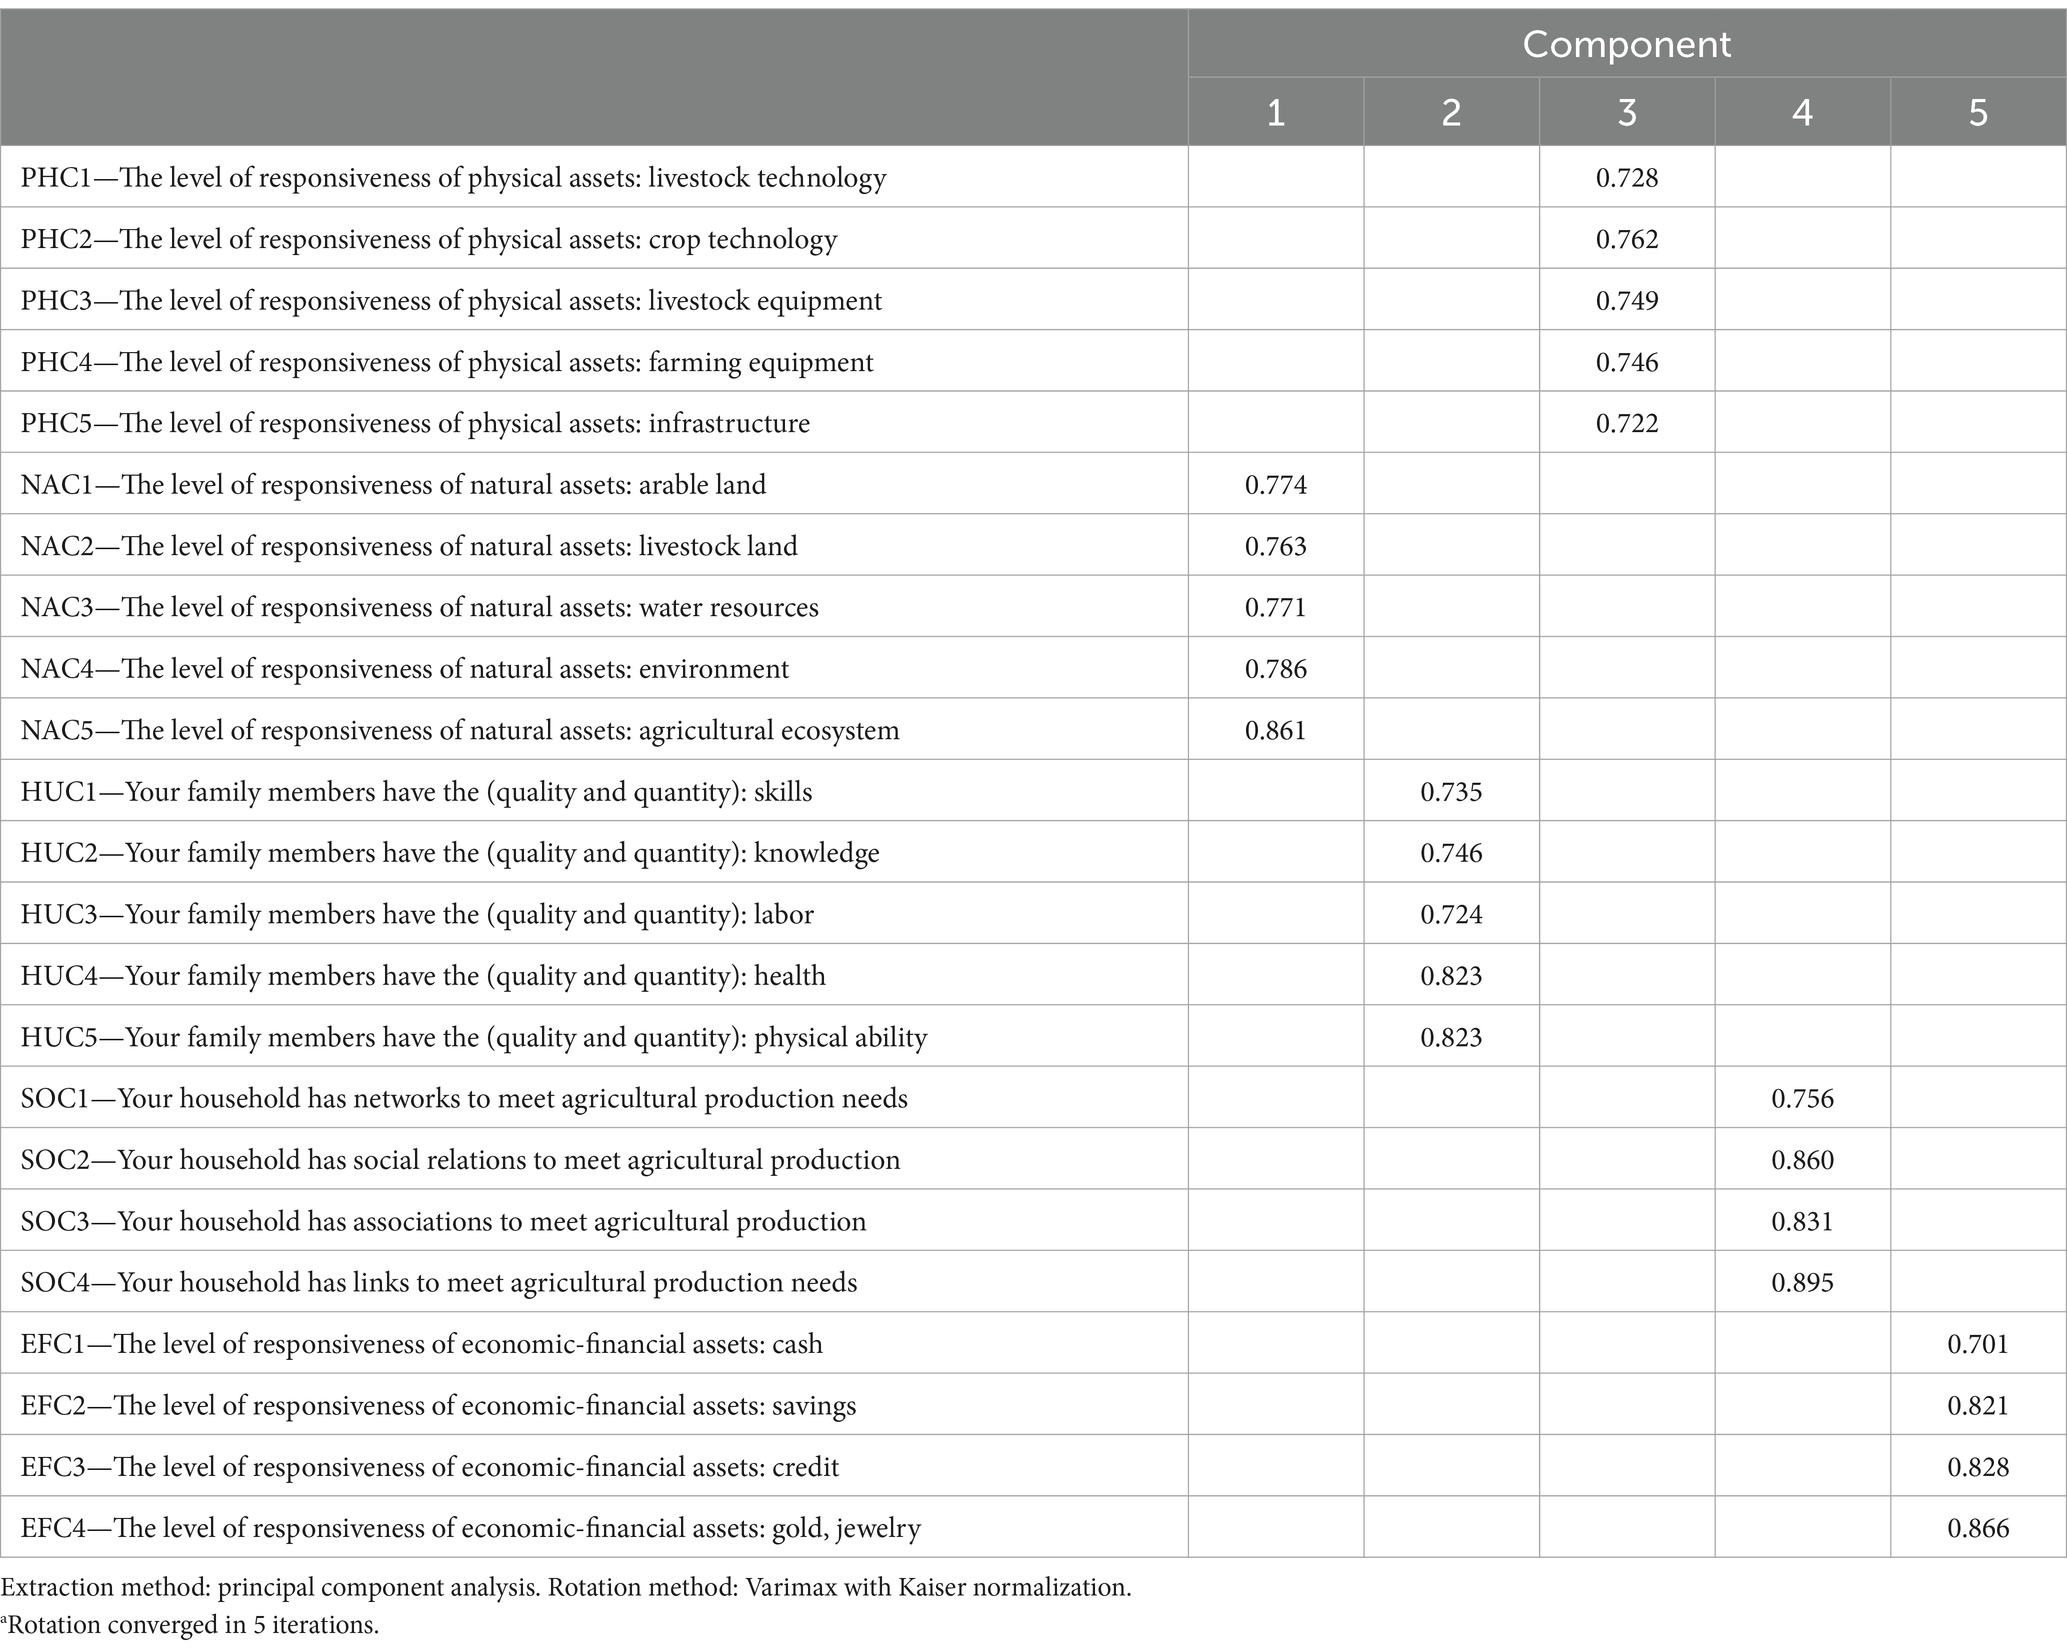
Table 2. Rotated component matrixa.
The EFA results in Table 2 show that the 23 independent variables were divided into five factors, which is consistent with the livelihood model of Morse et al. (2009) with five components affecting sustainable development. The factor loadings of all the variables were greater than 0.7; thus, the model represented over 70% of each variable.
5.2.2 Confirmatory factor analysis
To assess the general model fit, the following criteria were used: Chi-square (CMIN); Chi–Square adjusted to degrees of freedom (CMIN/df), Goodness of Fit Index (GFI), Tucker and Lewis Index (TLI), Comparative Fit Index (CFI), and Root Mean Square Error Approximation (RMSEA) index. According to Kettinger et al. (1995), the model is suitable in two situations: CMIN/df < 5 (with sample N > 200) and <3 (with sample size N < 200). In this study, the sample size was 294 > 200; therefore, the criteria of CMIN/df < 5; GFI, TLI, CFI > 0.9; RMSEA <0.08, and RMSEA <0.5 were considered very good. The CFA results for the fit of the model were as follows: Chi-Square/df = 2.962; GFI = 0.912; CFI = 0.918; TLI = 0.922; RMSEA = 0.08. Thus, the CFA model met the testing requirements.
To obtain a comprehensive picture of the scale’s reliability, the Composite Reliability (C.R.) and Average Variance Extracted (A.V.E.) were examined. According to Hair et al. (2010), if the C.R. is above 0.7 and A.V.E. exceeds 0.5, the scale is viewed as convergent, and the observed variable is not correlated with other observed variables in the same factor. The results in Table 3 suggest that the scale obtained from the quantitative examination was suitable for testing the established research hypotheses and model.
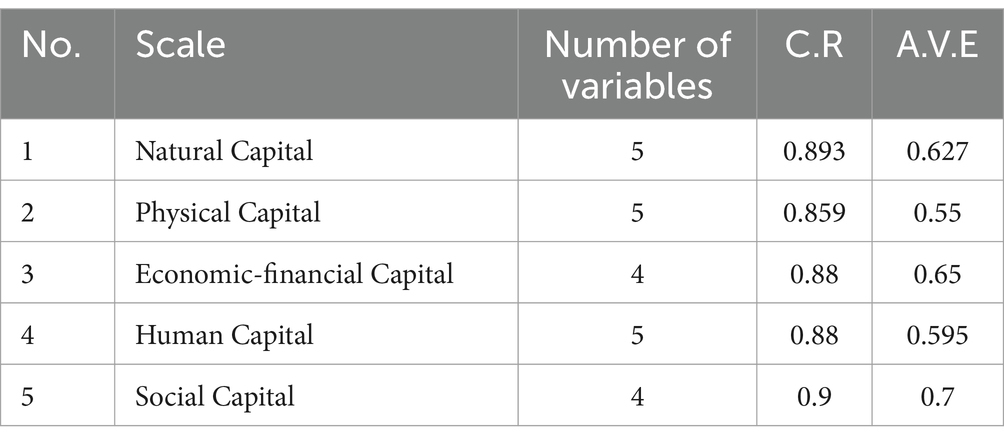
Table 3. Synthetic results of C.R and A.V.E of scales.
5.3 Structural equation modeling
The results in Figure 3 show that the SEM was completely consistent with the data. The SEM results are presented in Table 4. Figure 3 shows that farmers’ livelihood satisfaction depended more on income increase, food safety, reasonable compensation policies, and employment opportunities (weight 1), while improved living conditions and enjoying infrastructure welfare only had a weight of 0.3. The dependent factor, farmers’ livelihood satisfaction, was positively affected by five independent factors, as proposed by the theoretical model.

Figure 3. Structural equation modeling result.
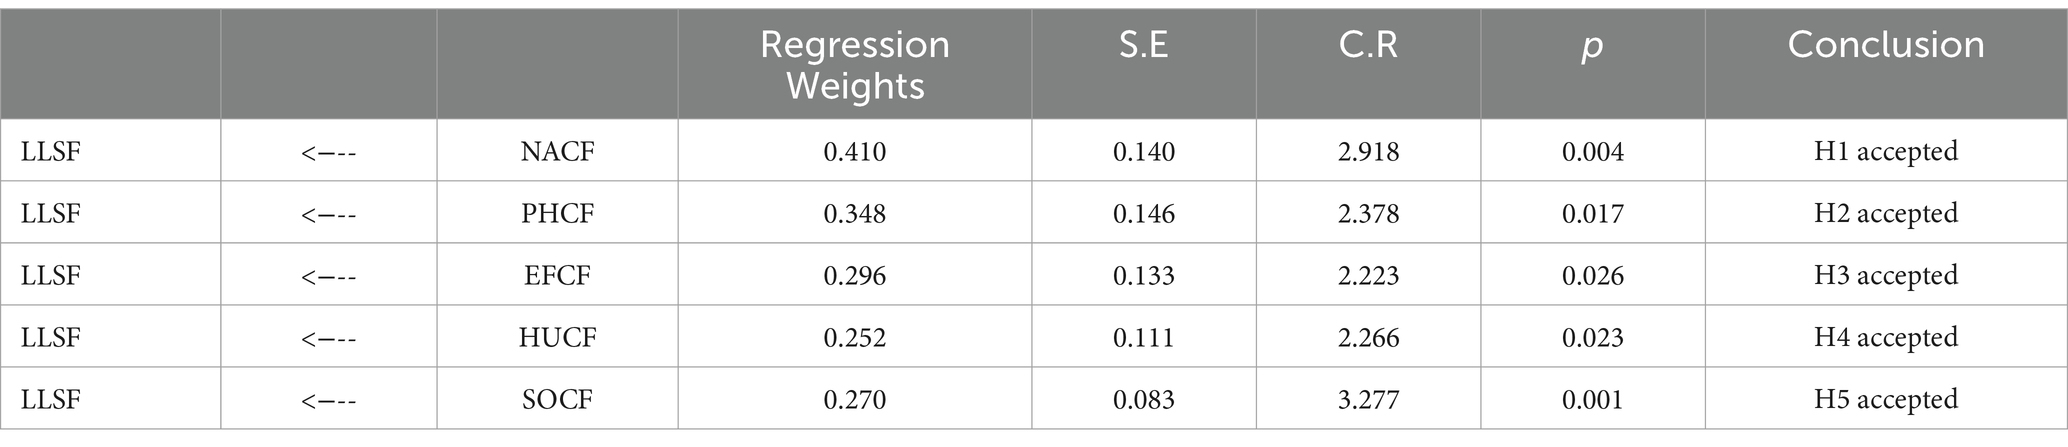
Table 4. Structural equation modeling results.
The SEM results in Table 4 show that all hypotheses (H1, H2, H3, H4, and H5) were accepted. H1 (Natural Capital) had the highest regression weight of 0.41, followed by H2 (Physical Capital) with a regression weight of 0.348, H3 (Economic-financial Capital) with a regression weight of 0.296, H4 (Human Capital) with the lowest regression weight of 0.252, and H5 (Social Capital) with a regression weight of 0.27. Thus, all five factors had varying degrees of impact on farmers’ livelihood satisfaction.
The regression weights are listed in Table 4 and shown in Figure 3. These results showed that all five independent factors had a linear causal effect on the dependent factor, farmers’ livelihood satisfaction. This relationship can be represented as a multiple regression equation.
(Natural Capital, NACF; Physical Capital, PHCF; Economic-financial Capital, EFCF; Human Capital, HUCF; Social Capital, SOCF; farmers’ livelihood satisfaction, LLSF)
5.4 Differences in livelihood capital satisfaction between ethnic groups
The results of the model comparison test between the Kinh ethnic group (majority) and ethnic minority groups (Cham, Ragley, and others) in Table 5 show that, with the hypothesis that the unconstrained model is correct, the two models had differences in the test parameters: measurement weights, structural weights, structural covariances, structural residuals, and measurement residuals (all P indexes are less than 5%). Thus, H6.0 was rejected and Hypothesis H6.1 was accepted; there was a difference between Kinh farmers and ethnic minority groups in the farmers’ livelihood satisfaction model. Thus, for these two groups, different solutions are required to improve farmers’ livelihood satisfaction. This content is analyzed in the Discussion section.
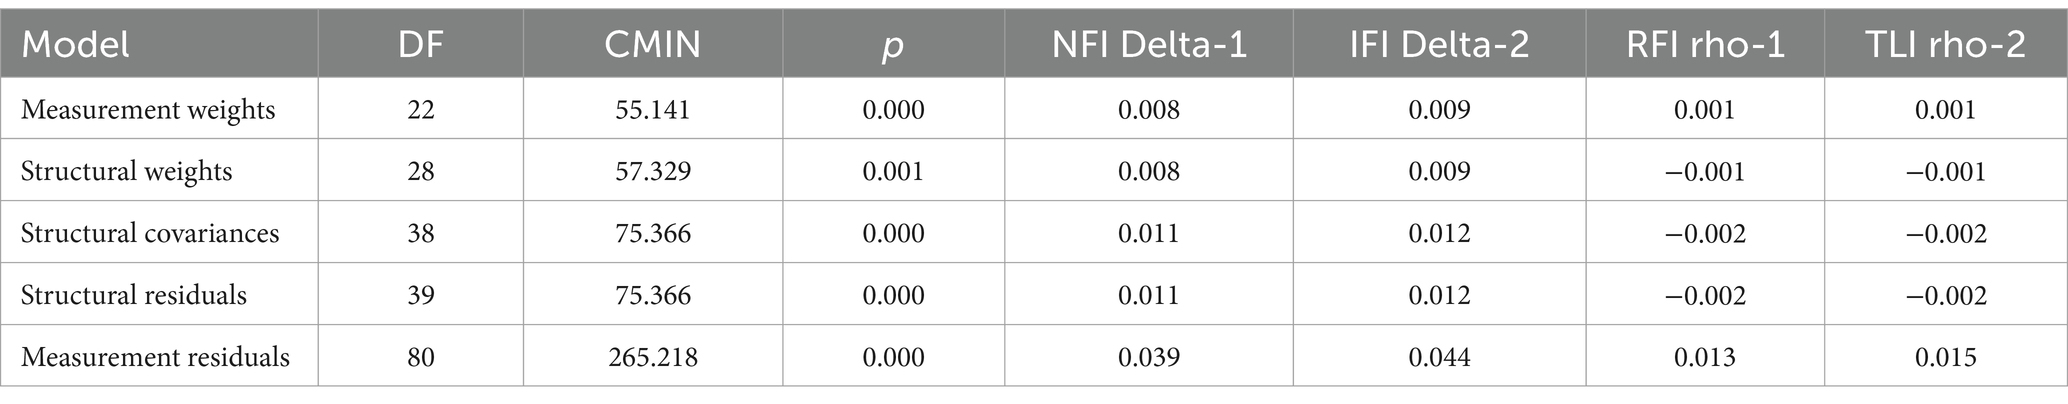
Table 5. Nested model comparisons.
Figures 4, 5 show the results of the SEM analysis of the Kinh ethnic group (majority) and ethnic minority groups (Cham, Ragley, and others). For the Kinh group, the factors affecting LLSF were quite even, with EFCF having the strongest impact (weight 0.44), followed by NACF (weight 0.36), PHCF (weight 0.34), SOCF (weight 0.33), and HUCF (weight 0.27).
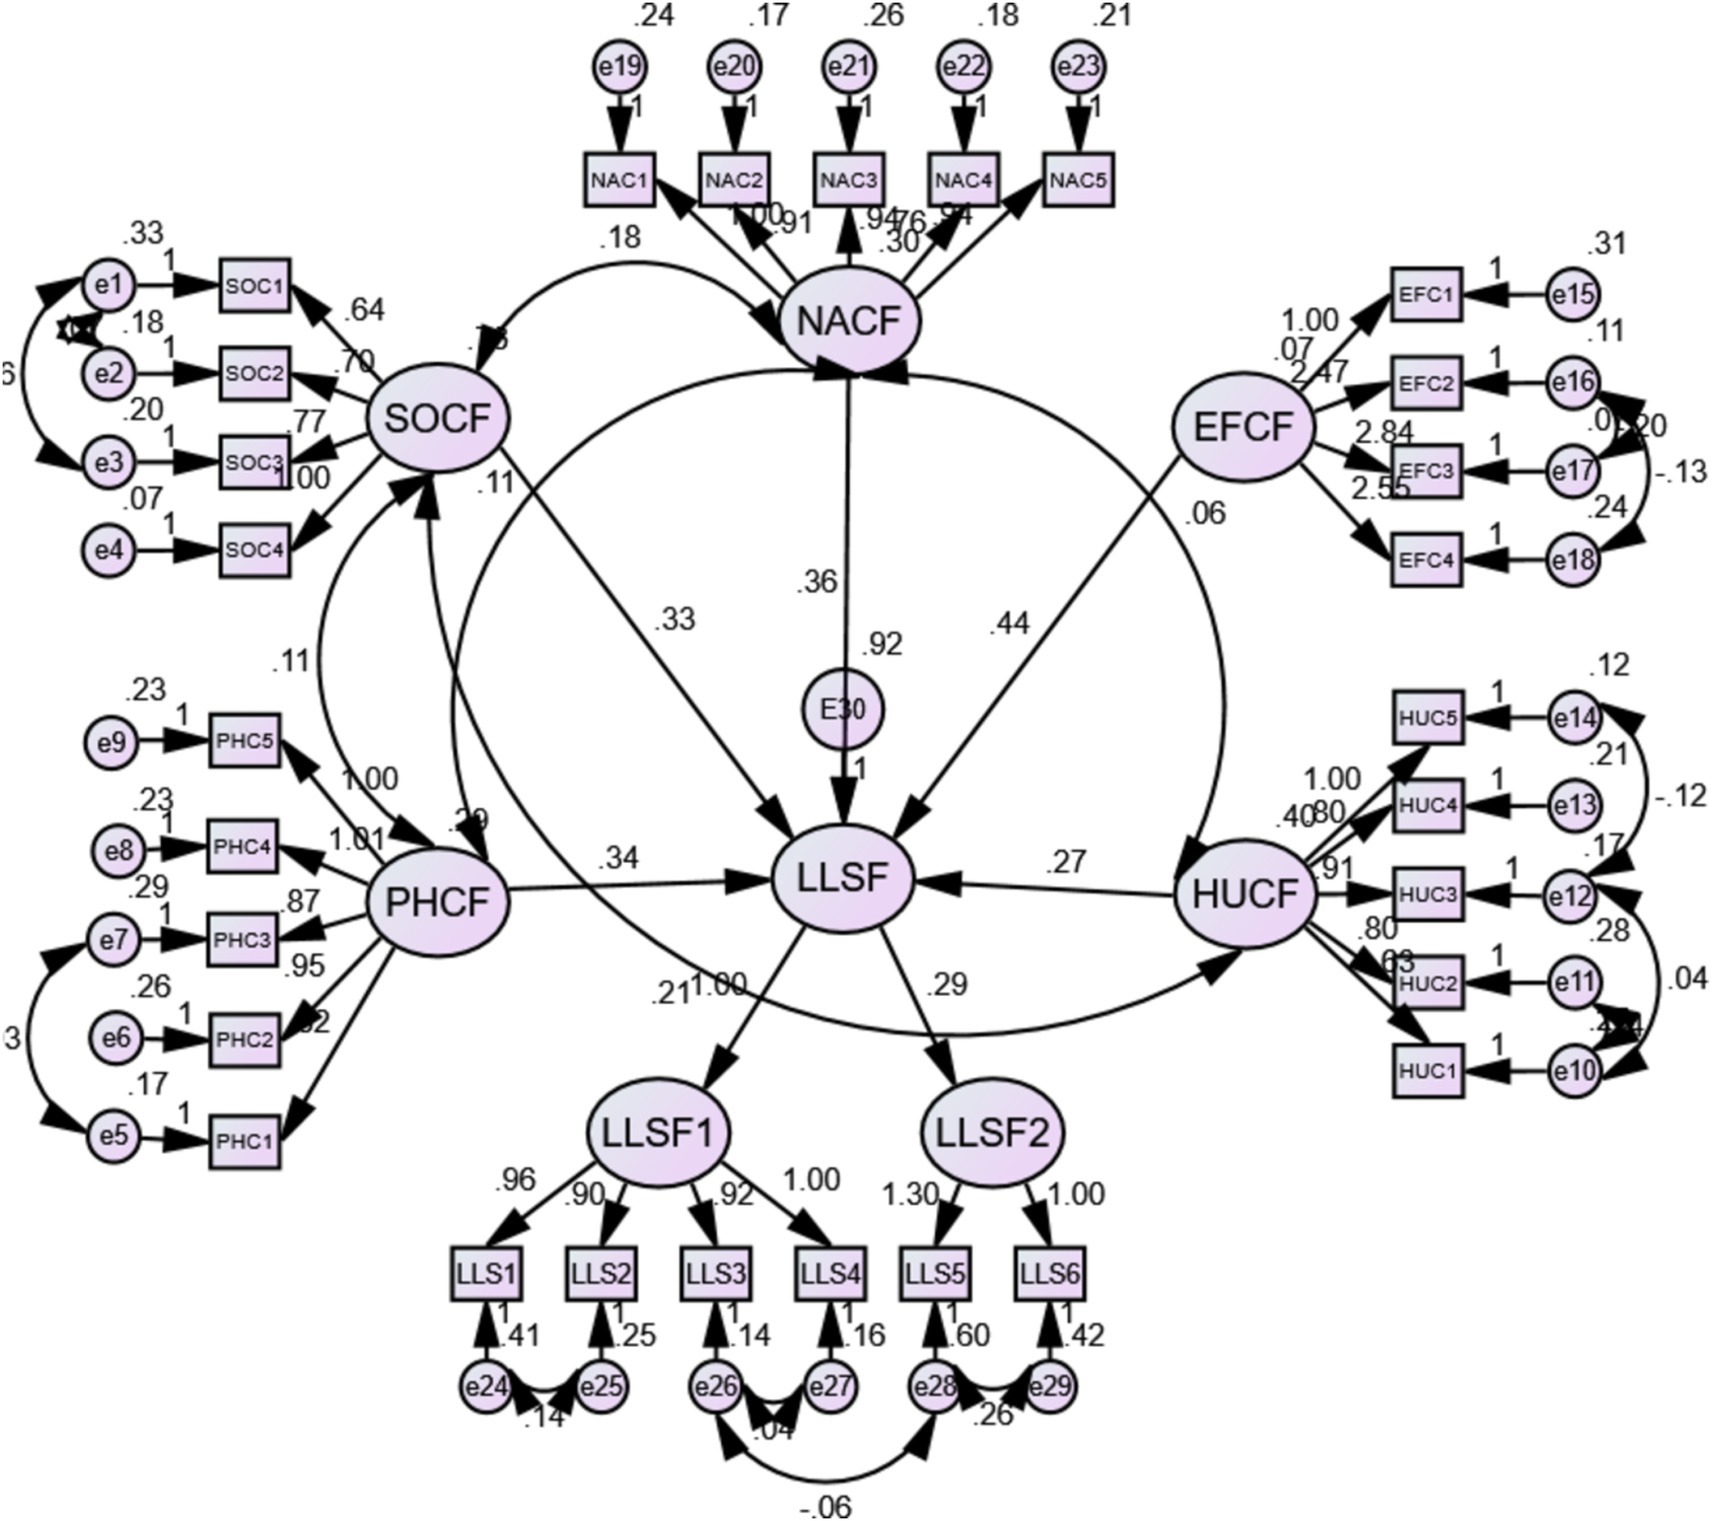
Figure 4. Kinh’s structural equation modeling.
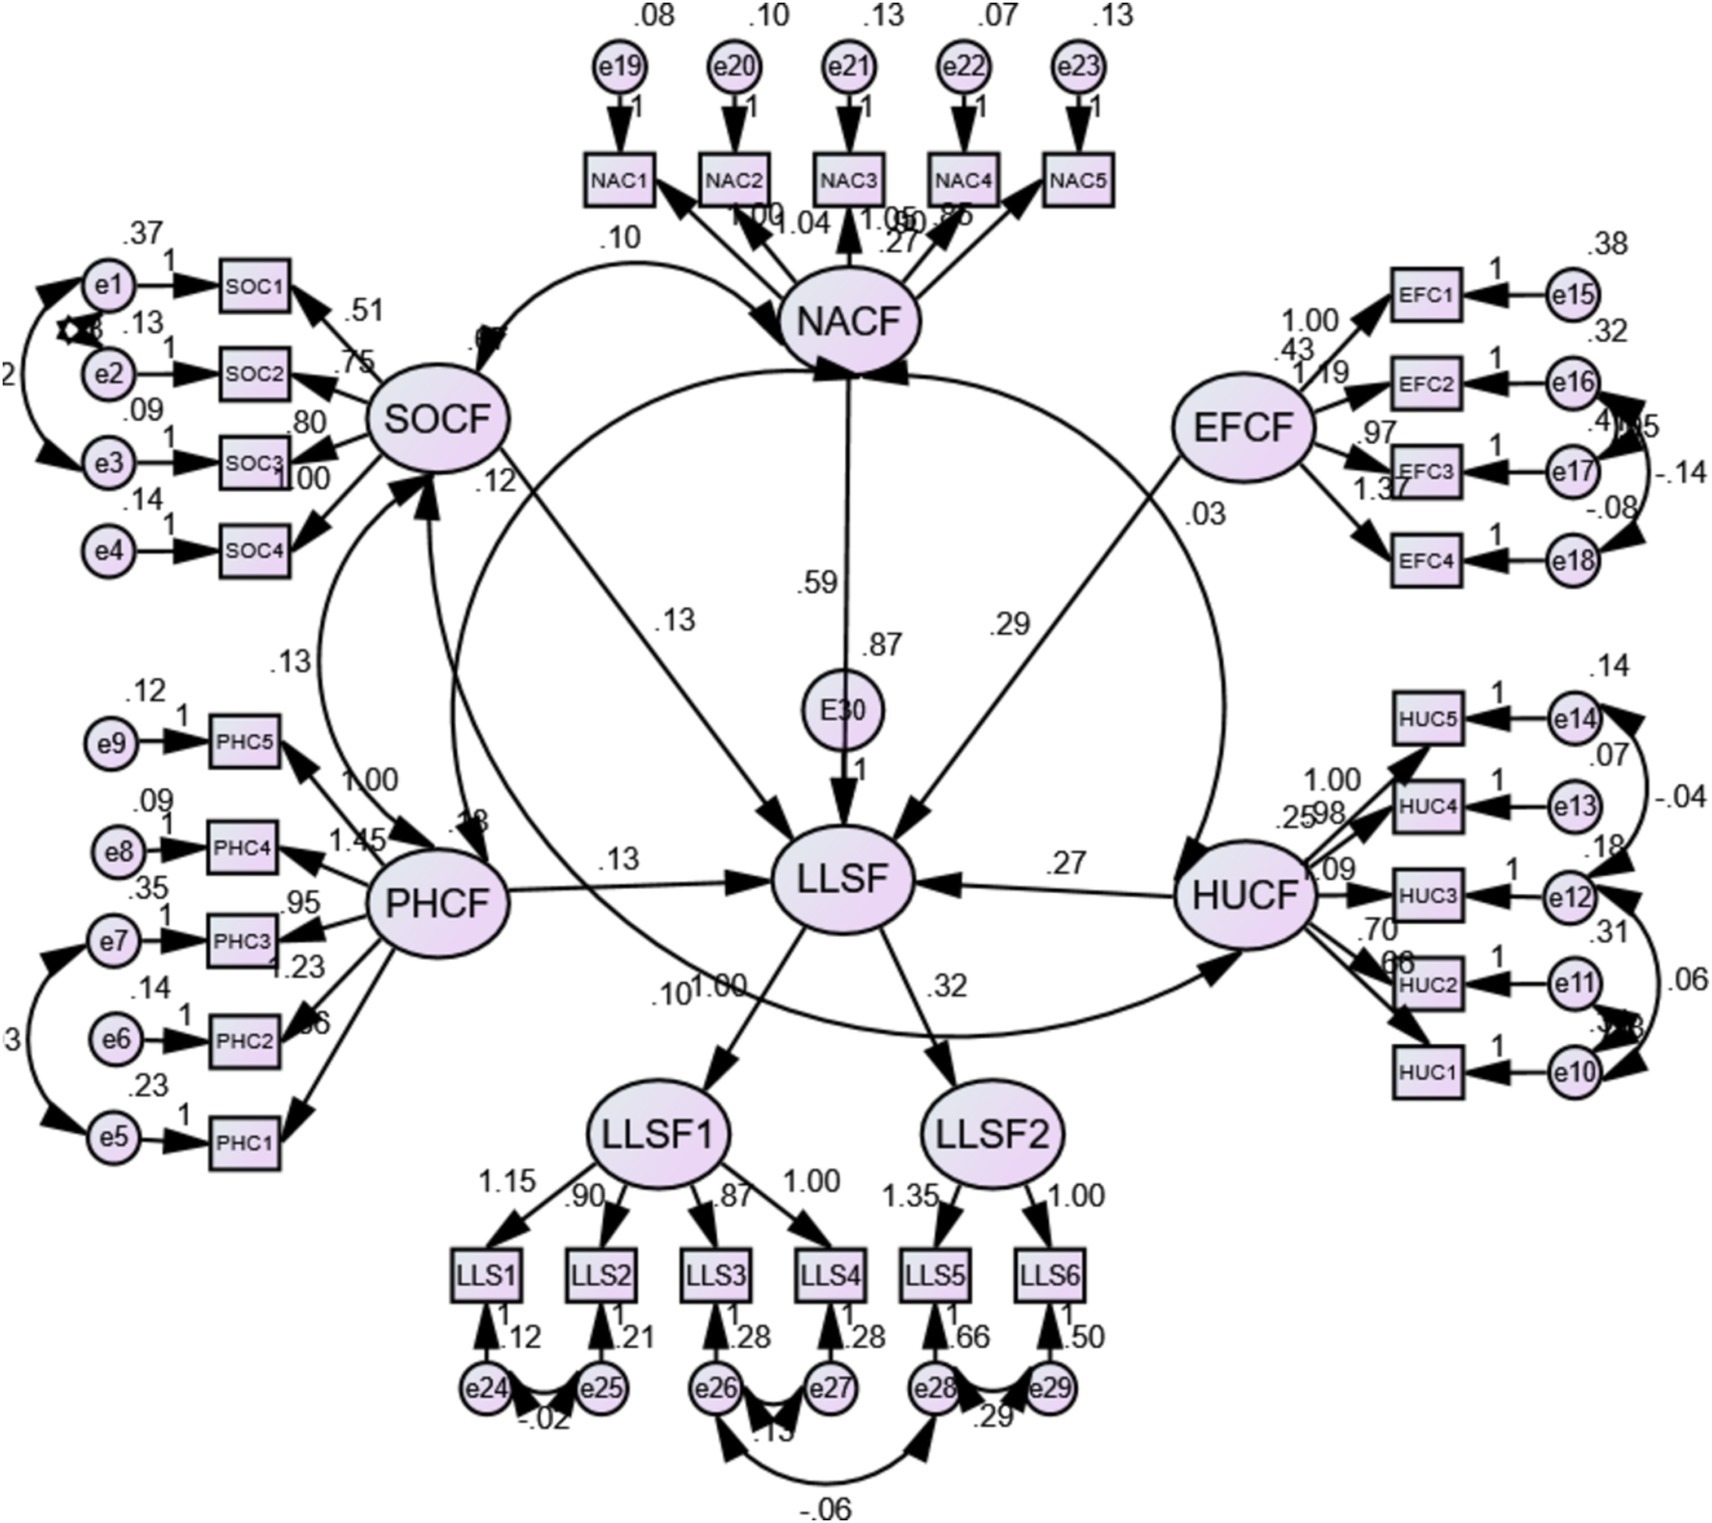
Figure 5. Ethnic minority group’s structural equation modeling.
From the results in Figure 4, we can write a multiple regression function consisting of five independent factors causally affecting the livelihood satisfaction of farmers of the majority Kinh ethnic group, as follows:
For the minority groups, there was a larger difference between factors affecting LLSF, in which the factor with the strongest impact was NACF (weight 0.59), the group of factors with medium impact was EFCF (weight 0.29) and HUCF (weight 0.27), and the group of factors with low impact was PHCF and SOCF (both weight 0.13, not statistically significant because p > 5%).
Similarly, from the results in Figure 5, we can establish a multiple regression function consisting of five independent factors causally affecting the farmers’ livelihood satisfaction of ethnic minority groups (shown below). The significance of these quantitative results is analyzed in the recommendations section.
6 Discussion, recommendations, and conclusion
6.1 Discussion
This study aimed to compare the difference in the level of livelihood satisfaction between the majority Kinh ethnic group and other ethnic minority groups, thereby building a sustainable livelihood model for the Ninh Thuan people and bringing a harmonious and sustainable combination between the development of renewable energy projects and people’s livelihoods. The findings are discussed according to the quantitative analysis results in Section 5.
The ungrouped research results illustrate that the strongest impact factor on farmers’ livelihood satisfaction was natural capital, with a regression weight of 0.41, mainly due to the lack of land for cultivation and livestock after they sell part of their land to renewable energy projects. Thus, it can be seen that the most important solution is to ensure an increase in the supply of agricultural land for farmers. This finding is similar to that of Palanca-Tan and Bayog (2021) and Hu et al. (2023). The results of the SEM model comparison analysis between the Kinh ethnic group (majority) and ethnic minority groups (Cham, Ragley, and others) showed that the second group had a very high regression weight (0.59) compared to the level of 0.36 of the first group. This proves that minority groups require more natural capital to develop their livelihoods, especially for agricultural land.
The second strongest factor was physical capital, with a regression weight of 0.35 (ungrouped SEM model), whose concerns are quite diverse in livestock technology, crop technology, livestock equipment, farming equipment, and infrastructure. Improving physical capital will help farmers improve their agricultural production levels and bring their products to the market more conveniently. This finding is similar to that reported by Hu et al. (2022). The results of the SEM model comparison analysis between the Kinh ethnic group (majority) and ethnic minority groups showed that the second group has the lowest regression weight (0.13) compared to the value of 0.34 of the first group. This shows that the ethnic minority group does not need much physical capital to develop their livelihoods (they are familiar with traditional farming and livestock and poultry farming methods), whereas the Kinh group has faster access to technology, science, and infrastructure to develop their livelihoods.
The third important factor was economic-financial capital, with a regression weight of 0.3 (ungrouped SEM model), whose main concerns are cash, savings, and credit that can be mobilized. Many families still have financial reserves after selling their land, and only a few farmers who change their livelihoods to industrial production, services, or large-scale agriculture need access to credit capital. This finding is similar to that reported by Hu et al. (2023). The results of the SEM model comparison analysis between the Kinh ethnic group (majority) and ethnic minority groups showed that the former had the highest regression weight (0.44) compared to 0.29 for the second group. This shows that the Kinh group needs a lot of economic and financial capital to develop their livelihoods (they need to invest a lot of capital to change their livelihoods and to produce and conduct business on a large scale), while the ethnic minority group does not need much of this resource, as they still cultivate and raise animals according to tradition.
The fourth important factor was social capital, with a regression weight of 0.27 (ungrouped SEM model), whose main concerns are networks, social relations, associations, and links that can be used to develop livelihoods. Building social capital factors for this group of farmers is believed to help them access relationships in agricultural production and commercialization, thereby improving the efficiency of these activities and making their livelihoods more sustainable. This finding is similar to that reported by Lu et al. (2014). The results of the SEM model comparison analysis between the Kinh ethnic group (majority) and ethnic minority groups showed that the first group had a high regression weight (0.33) compared to the lowest level of 0.13 of the second group. This shows that the Kinh group needs a lot of social capital to develop their livelihoods (they need many relationships and connections for large-scale production and business), while the minority group does not need much of this resource, as they still maintain a closed traditional social organization.
The least important factor was human capital, with a regression weight of 0.25 (ungrouped SEM model), whose main concerns are skills, knowledge, labor, health, and physical ability; these comments are subjective to farmers. Several other studies have shown that these factors help them gain better awareness and skills to develop sustainable livelihoods in the long term. This finding is similar to that of Lin (2018) and Boncompte and Paredes (2020). The results of the SEM model comparison analysis between the Kinh ethnic group (majority) and the ethnic minority groups (Cham, Ragley, and others) showed that the two groups had the same regression weight of 0.27.
6.2 Recommendations
The results of the structural model analysis in Figures 4, 5 show a difference between the majority Kinh group and the ethnic minority groups (Cham, Ragley, and others) in terms of factors affecting their livelihood satisfaction. The multiple linear regression function derived from the research results can be used by subjects as a basis for developing energy, economic, and social policies to better meet and satisfy the higher-than-desired livelihood needs of the two ethnic groups. The subjects participating in renewable energy projects in Ninh Thuan can be authorities at all levels, namely renewable energy investors, Vietnam’s electricity sector, and local political and social organizations.
The farmers’ livelihood satisfaction of the majority Kinh ethnic group was as follows: LLSF = 0.36 × NACF + 0.34 × PHCF + 0.44 × EFCF + 0.27 × HUCF + 0.33 × SOCF. This result shows that this group of people needs to build a harmonious livelihood strategy among the five sources of sustainable livelihoods (natural, physical, economic-financial, human, and social capital).
The farmers’ livelihood satisfaction of the ethnic minority groups (Cham, Ragley, and others) was as follows: LLSF = 0.59 × NACF + 0.29 × EFCF + 0.27 × HUCF. Thus, the current concerns of minority groups are natural, economic-financial, and human capital. Natural capital is the main concern, with factors of arable land, livestock land, water resources, the environment, and agricultural ecosystems.
6.3 Conclusion
Renewable energy projects also create opportunities for farmers in the area to continue their agricultural livelihoods by cooperating with these projects to continue farming and raising livestock and poultry on solar and wind farms. This requires that farmers be professionally trained to cultivate and raise livestock under solar panels and wind turbines, with requirements that do not damage or interrupt the power of the equipment. Renewable energy projects also need to realize that, in addition to receiving land rent, cooperation with farmers also produces sustainable livelihoods for farmers, opens up opportunities to collaborate with them in future projects, and contributes to sustainable development in the province. State and local management agencies also need to promote cooperation between farmers and renewable energy project owners to guarantee sustainable development in the area, ensuring sustainable livelihoods for households as well as business expansion. It is essential to boost the sharing of agricultural land sources, sharing and collaboration in the agricultural product supply chain, and application of advanced technologies in agriculture.
Furthermore, to bring about livelihood satisfaction for different groups of people, local government agencies need to clearly understand their needs and desires to develop policies and support tools suitable for each group in accordance with their specific characteristics of farming practices, natural and social conditions, financial resources, and technology.
Data availability statement
The datasets presented in this study can be found in online repositories. The names of the repository/repositories and accession number(s) can be found in the article/Supplementary material.
Ethics statement
The requirement of ethical approval was waived by the National Economics University where the author is currently working has not yet established this committee. The studies were conducted in accordance with the local legislation and institutional requirements. The participants provided their written informed consent to participate in this study.
Author contributions
NQ: Writing – review & editing, Writing – original draft, Visualization, Validation, Supervision, Software, Resources, Project administration, Methodology, Investigation, Funding acquisition, Formal analysis, Data curation, Conceptualization.
Funding
The author(s) declare that no financial support was received for the research, authorship, and/or publication of this article.
Conflict of interest
The author declares that the research was conducted in the absence of any commercial or financial relationships that could be construed as a potential conflict of interest.
Publisher’s note
All claims expressed in this article are solely those of the authors and do not necessarily represent those of their affiliated organizations, or those of the publisher, the editors and the reviewers. Any product that may be evaluated in this article, or claim that may be made by its manufacturer, is not guaranteed or endorsed by the publisher.
Supplementary material
The Supplementary material for this article can be found online at: https://www.frontiersin.org/articles/10.3389/fsufs.2024.1492400/full#supplementary-material
References
1319/QD-TTg (2023). Available at: https://vanban.chinhphu.vn/?pageid=27160&docid=208949 (Accessed January 2, 2024).
Abera, A., Yirgu, T., and Uncha, A. (2021). Determinants of rural livelihood diversification strategies among Chewaka resettlers’ communities of southwestern Ethiopia. Agric. Food Secur. 10:30 (2021). doi: 10.1186/s40066-021-00305-w
Asian Development Bank (ADB) (1998). Handbook on resettlement. Available at: https://www.adb.org/sites/default/files/institutional-document/32259/handbook-resettlement.pdf (Accessed July 13, 2024).
Awazi, N. P., and Quandt, A. (2021). Livelihood resilience to environmental changes in areas of Kenya and Cameroon: a comparative analysis. Clim. Chang. 165:33. doi: 10.1007/s10584-021-03073-5
Ayerst, S., Brandt, L., and Restuccia, D. (2020). Market constraints, misallocation, and productivity in Vietnam agriculture. Food Policy. 94. 101840. doi: 10.1016/j.foodpol.2020.101840
Boncompte, J. G., and Paredes, R. D. (2020). Human capital endowments and gender differences in subjective well-being in Chile. J. Happiness Stud. 2020, 241–269.
Chambers, R., and Conway, G. R. (1992). Sustainable rural livelihoods: Practical concepts for the 21st century, discussion paper 296. Brighton, UK: Institute of Development Studies.
Dat, T. T., Thu, V. T. H., and Toan, P. N. (2014). Vulnerability and adaptation of coastal livelihoods to the impacts of climate change: a case study in coastal districts of Nam Dinh, Vietnam. J. Econ. Dev. 16, 39–60.
DFID [Department For International Development] (2001), Sustainable livelihoods guidance sheets, DFID report. Available at: https://www.unscn.org/layout/modules/resources/files/Sustainable_livelihoods_guidance_sheets_methods.pdf (Accessed July 13, 2024).
Ghazali, S., Zibaei, M., and Azadi, H. (2023). Impact of livelihood strategies and capitals on rangeland sustainability and nomads’ poverty: a counterfactual analysis in Southwest Iran. Ecol. Econ. 206:107738. doi: 10.1016/j.ecolecon.2023.107738
GSO-General Statistics Office (2021). Statistical yearbook of Vietnam. Hanoi, Vietnam: Statistical Publishing House.
Hair, J. F., Black, W. C., Babin, B. J., Anderson, R. E., and Tatham, R. L. (2010). Multivariate data analysis. 7th Edn. New Jersey: Pearson Prentice Hall.
Hanstad, T., Nielsen, R., and Brown, T. (2004). Land and livelihoods – making land rights real for India’s rural poor. Rural Development Institute (RDI).
Hatcher, L. (1994). A step-by-step approach to using the SAS® system for factor analysis and structural equation modeling. Cary, NC: SAS Institute.
He, Y., and Ahmed, T. (2022). Farmers’ livelihood capital and its impact on sustainable livelihood strategies: evidence from the poverty-stricken areas of Southwest China. Sustain. For. 14:4955. doi: 10.3390/su14094955
Hu, G., Wang, J., Fahad, S., and Li, J. (2022). Influencing factors of farmers’ land transfer, subjective well-being, and participation in agri-environment schemes in environmentally fragile areas of China. Environ. Sci. Pollut. Res. 30, 4448–4461. doi: 10.1007/s11356-022-22537-4
Hu, J. I., Yao, J., and Xiong, C. (2023). A study on livelihood capital, social adaptation, and life satisfaction—empirical analysis based on ecological migration in the Kalajun world natural heritage site. Front. Environ. Sci. 11:1181923. doi: 10.3389/fenvs.2023.1181923
Huong, N.L. (2014). Rijksuniversiteit Groningen; farmers’ land tenure security in Vietnam and China: Legislative changes and challenges. Ph.D. Thesis, The University of Groningen, Groningen, The Netherlands.
Jani, V. (2022). “Resource management, livelihoods and ethnic minorities: the case of the Doma, northern Zimbabwe” in Livelihoods of ethnic minorities in rural Zimbabwe. eds. K. Helliker, P. Chadambuka, and J. Matanzima (Cham: Springer Geography. Springer).
Kettinger, W. J., Lee, C. C., and Lee, S. (1995). Global Measures of Information Services Quality: A Cross-National Study. Decision Sciences, 26, 569–588.
Khanal, R., Duan, Y., Ramsey, T.S., and Ali, S., Oo K.H, (2024). Impacts of livelihood assets on hydropower displaces’ livelihood strategies: insights from the Tanahu hydropower project in Nepal, Heliyon, Volume 10:e34485, doi: 10.1016/j.heliyon.2024.e34485
Kline, R. B. (2005). Principles and practice of structural equation modeling New York: Guilford Press.
Kotler, P. (1991). Marketing management: Analysis, planning, implementation, and control. 7th Edn. New Jersey: Prentice-Hall, 756.
Kumar, P., Kumar, P., and Garg, R. K. (2021). A study on farmers' satisfaction and happiness after the land sale for urban expansion in India. Land Use Policy 109:105603. doi: 10.1016/j.landusepol.2021.105603
Lin, N. (2018). Environmental research on the influencing factors of skill training willingness of the new era professional farmers in the central region of China. Ekoloji 2018, 1327–1336.
Li, W., Shuai, C., Shuai, Y., Cheng, X., Liu, Y., and Huang, F. (2020). How livelihood assets contribute to sustainable development of smallholder farmers. J. Int. Dev. 32, 408–429. doi: 10.1002/jid.3461
Lu, H., Zhao, X., Hai, Z., Hou, C., Zhang, F., and Liang, Z. (2014). Impact of social capital on farmers’ income: a case study in Zhangye City, Gannan Tibetan autonomous prefecture and Linxia Hui autonomous prefecture of Gansu, China. J. Desert Res. 2014, 610–616.
Mao, S., Qiu, S., Li, T., and Tang, M. (2020). Rural households’ livelihood strategy choice and livelihood diversity of main ethnic minorities in Chongqing, China. Sustainability 12:8166. doi: 10.3390/su12198166
Morse, S., McNamara, N., and Acholo, M. (2009). Sustainable livelihood approach: a critical analysis of theory and practice. Geographical paper 189; accessed on 10 July 2022.
Nguyen, H. Q., and Warr, P. (2020). Land consolidation as technical change: economic impacts in rural Vietnam. World Dev. 127:104750. doi: 10.1016/j.worlddev.2019.104750
Nguyen, P., Nguyen, D., Pham, L., and Dang, T. (2019). Livelihood of ethnic minorities and sustainable development of buffer zones: a case study of the Chu Yang sing National Park, the central highlands of Vietnam. Int. J. Sustain. Dev. 22:41. doi: 10.1504/IJSD.2019.10026462
Niu, L., Lu, C., and Sun, R. (2023). The impact of livelihood capital on subjective well-being of new professional farmers: evidence from China. Sustain. For. 15:11305. doi: 10.3390/su151411305
Olarewaju, T. (2020). “Ethnic poverty: causes, implications, and solutions” in No poverty. Encyclopedia of the UN sustainable development goals. eds. F. W. Leal, A. M. Azul, L. Brandli, S. A. Lange, P. G. Özuyar, and T. Wall (Cham: Springer).
Palanca-Tan, R., and Bayog, S. (2021). Livelihood and happiness in a resource (natural and cultural)-rich rural municipality in the Philippines. Southeast Asian Stud. 2021, 413–433. doi: 10.20495/seas.10.3_413
Paulo, Filipe (2005). The right to land a livelihood: The dynamics of land tenure systems in Conda, Amboim and Sumbe municipalities. Norwegian People’s Aid.
Pham, T. N., Kappas, M., and Faust, H. (2021). Impacts of agricultural land Acquisition for Urbanization on agricultural activities of affected households: a case study in Huong Thuy town, Thua Thien Hue Province, Vietnam. Sustainability 13:8559. doi: 10.3390/su13158559
Scoones, I. (1998). Sustainable rural livelihoods: A framework for analysis, working paper 72. Brighton, UK: Institute of Development Studies.
Statistical Yearbook of Vietnam (2023). Statistical publishing house. Available at: https://www.gso.gov.vn/wp-content/uploads/2024/06/NG-TONG-CUC-2023-Final.pdf (Accessed November 9, 2024).
Suu, N. V. (2021). Tác động của công nghiệp hóa và đô thị hóa đến sinh kế nông dân Việt Nam: Trường hợp một làng ven đô Hà Nội. Nhà xuất bản Đại học Quốc gia Hà Nội. Available at: https://www.researchgate.net/publication/352787254_Cong_nghiep_hoa_do_thi_hoa_va_bien_doi_sinh_ke_o_ven_do_Ha_Noi (Accessed July 9, 2024).
Tong, Q., Yuan, X., Zhang, L., Zhang, J., and Li, W. (2024). The impact of livelihood capitals on farmers’ adoption of climate-smart agriculture practices: evidence from rice production in the Jianghan plain, China. Clim. Risk Manag. 43:100583. doi: 10.1016/j.crm.2023.100583
Tran, P. T., Nguyen, T. Q., Huynh, C. V., Pham, T. H., and Schinkel, U. (2023). A nuanced analysis on livelihood resilience of Vietnamese upland households: an intersectional Lens of ethnicity and gender. Sustain. For. 15:3510. doi: 10.3390/su15043510
Truong, D. D. (2022). Farming households’ satisfaction with quality of agricultural extension services: a case study of Quang Binh Province, Vietnam. Front. Sustain. Food Syst. 5:779477. doi: 10.3389/fsufs.2021.779477
Vien, T.D. (2020). Nông Nghiệp Việt Nam: Những Vấn Ðề Tồn Tại (The Gaps in Vietnamese Agriculture). Available at: https://tiasang.com.vn/-quan-ly-khoa-hoc/Nong-nghiep-Viet-Nam-Nhung-van-de-ton-tai-26635 (Accessed July 9, 2024).
Walker, J., Mitchell, B., and Wismer, S. (2001). Livelihood strategy approach to community-based planning and assessment: a case study of Molas, Indonesia. Impact Assess. Proj. Apprais. 19, 297–309. doi: 10.3152/147154601781766925
Xiao, D., Niu, H., Fan, L., Zhao, S., and Yan, H. (2019). Farmers’ satisfaction and its influencing factors in the policy of economic compensation for cultivated land protection: a case study in Chengdu, China. Sustainability 11:5787. doi: 10.3390/su11205787
Keywords: renewable energy, livelihoods, farmer satisfaction, ethnic group, farmland
Citation: Quang NN (2025) Differences in livelihood satisfaction between ethnic groups after selling farmland for renewable energy power projects in Ninh Thuan province, Vietnam. Front. Sustain. Food Syst. 8:1492400. doi: 10.3389/fsufs.2024.1492400
Edited by:
Ademola Braimoh, World Bank Group, United StatesReviewed by:
Xiaozhong Li, Northeast Agricultural University, ChinaSamuel Ikendi, University of California Agriculture and Natural Resources, United States
Copyright © 2025 Quang. This is an open-access article distributed under the terms of the Creative Commons Attribution License (CC BY). The use, distribution or reproduction in other forums is permitted, provided the original author(s) and the copyright owner(s) are credited and that the original publication in this journal is cited, in accordance with accepted academic practice. No use, distribution or reproduction is permitted which does not comply with these terms.
*Correspondence: Nguyen Ngoc Quang, cW5uOUB5YWhvby5mcg==
†ORCID: Nguyen Ngoc Quang, orcid.org/0000-0003-4210-7175