- 1ICAR-Directorate of Onion and Garlic Research, Rajgurunagar, Pune, India
- 2ICAR-National Research Centre for Grapes, Pune, India
Outer papery peel of onion bulb is an inevitable bio-waste generated in the course of postharvest handling and processing. Onion peels are rich source of nutraceutically important polyphenolic compounds having many therapeutic potentials. In this study, we characterized onion peel extract (OPE) of eight differentially pigmented short-day onion varieties through ultra-high-performance liquid chromatography coupled with high-resolution single stage Orbitrap spectrometry and evaluated the antioxidant potential. A total of 49 phenolic compounds were identified in this study which include 33 anthocyanin, 8 flavanol, 4 flavones, and 1 each of pyranoanthocyanin, chalcone, phenolic acid, and ellagitannins. Anthocyanin was the most abundant polyphenolic compound followed by flavanol in all the varieties. Among anthocyanin, 10 cyanidin, 10 delphinidin, 4 peonidin, 4 petunidin, 3 pelargonidin, and 2 malvidin were identified. Cyanidin-3-(6-malonylglucoside), delphinidin, and delphinidin-3-galactoside were the predominant pigment in dark red varieties (BDR and BRJ), and its abundance suggests a key role in the differential pigmentation pattern of onion peel. Total phenol content (TPC) in peels ranged from 1738.21 to 1757.76 mg GAE/100 g DW in dark red onion, 1306.58 to 1646.73 mg GAE/100 g DW in red onion, and 78.77 to 85.5 mg GAE/100 g DW in white onion varieties. The mean total anthocyanin content was maximum (28.23 mg/100 g DW) in dark red varieties (BDR) and minimum (0.11 mg/100 g DW) in white variety (BSW). Total antioxidant activity ranged from 4.71 to 79.80 μmol/g DW, 22.71 to 286.7 μmol/g DW, and 8.72 to 156.89 μmol/g DW estimated through FRAP, ABTS, and DPPH methods, respectively. In all three methods, it was maximum in dark red var. BDR and minimum in white var. BSU.
1 Introduction
Onions are among the earliest domesticated vegetables in human history and possess several health benefits due to their unique bioactive compounds (Elattar et al., 2024). However, the inconvenience of peeling and cutting fresh onions has led to a growing demand for ready-to-use onion products, such as dehydrated onions and minimally processed options such as peeled or pre-cut onions (Gorrepati et al., 2014; Ahamad et al., 2024). Processing onions into various value-added products generates large amounts of bio-waste, primarily in the form of outer skins, peels, and basal and apical trimmings (Trigueros et al., 2024). Disposal of this waste is a major challenge for the industries as it has characteristic odor due to the presence of sulfur containing compounds (Chadorshabi et al., 2022). However, this waste can advantageously be used as a potential source for extraction of high-value secondary metabolites, development of functional/nutraceutical food, energy, and biogas production (Kumar et al., 2022; Stoica et al., 2022). Sagar et al. (2022) outline the methods for transforming onion waste into valuable biomolecules using a biorefinery approach to enhance the circular bioeconomy.
Onion skin extracts offer natural alternatives for preventing and treating diseases related to oxidative stress, microbial infections, or cancer (Bozinou et al., 2023). Onion peel extract (OPE) is reported to have antimicrobial (Sagar and Pareek, 2020a; Joković et al., 2024), antibacterial (Moosazad et al., 2019), antidiabetic (Jung et al., 2011; Vu et al., 2020), anti-obesity (Moon et al., 2013), anti-thrombotic (Lee et al., 2013), and anti-cancerous (Galavi et al., 2021) properties. OPE also decreases the level of total cholesterol, low-density lipoprotein, and atherogenic index (Kim et al., 2012). Onion peel extract is a promising component of future nutraceuticals and value-added products (Kim et al., 2013). Red onion skin can be used for producing value-added products as they are rich in bioactive compounds especially phenolics and flavonoids (Chadorshabi et al., 2022). Nutraceutical properties of onion peel have been augmented for the development of many value-added products such as wheat pasta (Michalak-Majewska et al., 2020), bread (Piechowiak et al., 2020), pizza (Sagar and Pareek, 2020b), and various meat products.
Onion peel contains wide array of polyphenolic compounds such as flavanols, anthocyanins, and tannins (Sharma et al., 2016; Suh et al., 1999). Ly et al. (2005) reported nine phenolic compounds in dry outer scales of onion (Allium cepa L.). The presence of ferulic, gallic, and protocatechuic acids, quercetin, and kaempferol was reported in extracts of red onion peel (Singh et al., 2009). Lee and Mitchell (2011) reported primary flavonoids in outer paper, first, and second layers of onion as quercetin 3,4-O-diglucoside, quercetin 3-O-glucoside, quercetin 4’-O-glucoside, isorhamnetin 4’-O-glucoside, and quercetin aglycone. Sagar et al. (2020) described the flavonoids, total phenols, and antioxidant properties of onion skin of 15 Indian cultivars. Anthocyanins are versatile natural pigment, widely described for nutraceutical properties associated with it. Anthocyanin-associated colors are mainly due to cationic flavylium ions (red), quinoidal bases (violet), and its colorless adducts (Frond et al., 2019). Onions with fascinating pigmentation patterns from dark red, yellow to white colors are globally produced. The abundance of phenolic compounds in the outer scales of onions is described to be associated not only with colors but also with many biochemical traits (Metrani et al., 2020). In general, the levels of flavanol are higher in yellow onions than red onions (Soininen et al., 2014). Sweet onion contains 2- to 3-fold higher isorhamnetin 4’-glucoside than red onion cultivars (Olsson et al., 2010). It has been reported that the antioxidant and anticancer properties of methanolic extracts from different parts (flesh and peel) of onion were significantly different in white, yellow, and red onion (Jeong et al., 2009). Sagar et al. (2021) studied the physicochemical and thermal characteristics of onion skin from 15 Indian cultivars for possible food applications and reported that the skin of cv. “NHRDF Red” was best source of protein, fiber, and minerals, suggesting its suitability for developing a food product. Although ample amount of literature reports the pharmacological and nutraceutical potential of onion skin, most of the study is limited to profiling of few known compounds. Moreover, scanty information is available regarding short-day cultivars of onion which is of higher preference under subtropical Indian conditions. Mass spectrometry-based detections are highly sensitive and selective for identification. Therefore, we did high-resolution UHPLC-Orbitrap-Mass Spectrometry-based characterization of phenolic compounds and established putative relation with differential pigmentation in OPE of eight distinctly pigmented short-day onion cultivars ranging from dark red to white.
2 Materials and methods
2.1 Plant material
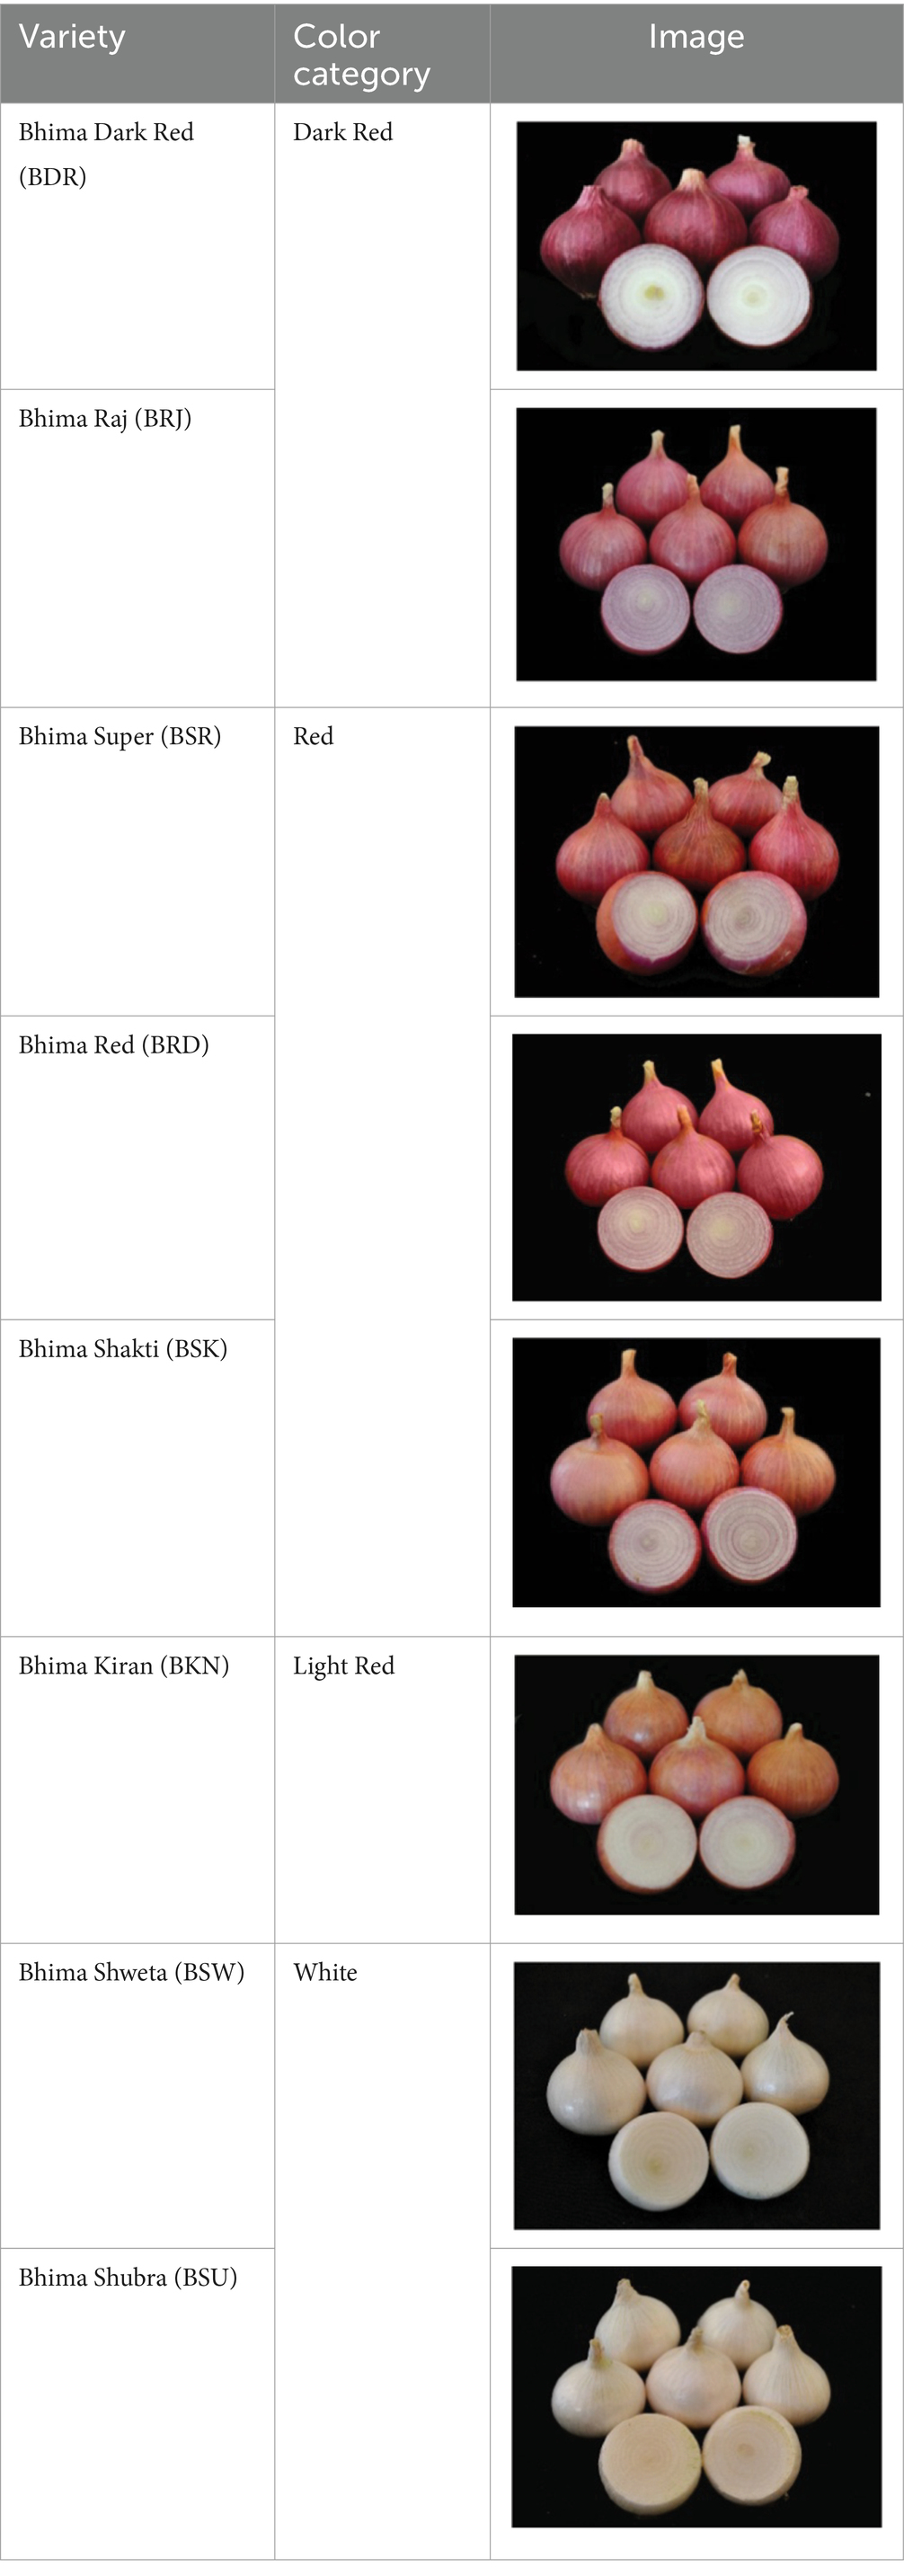
A field experiment was conducted during the winter season at the Indian Council of Agricultural Research–Directorate of Onion and Garlic Research (ICAR–DOGR) farm in Pune, Maharashtra, India. The site, located at 18.32° N and 73.51° E, is 645 m above sea level and has a tropical dry humid climate with an average annual precipitation of 820 mm. The soil at the site is clay loam, with low available nitrogen and medium soil organic carbon. The field experiment, designed as a completely randomized block design, included eight onion cultivars: Bhima Dark Red (BDR), Bhima Raj (BRJ), Bhima Super (BSR), Bhima Red (BRD), Bhima Shakti (BSK), Bhima Kiran (BKN), Bhima Shweta (BSW), and Bhima Shubra (BSU), each replicated three times (Table 1). Onion seeds were sown in the nursery in the second week of October. Organic manure was applied in the field at 5 t ha−1 before transplanting. On the day of transplanting, the pre-emergence herbicide oxyfluorfen was applied, followed by irrigation for weed control. Before transplanting, 100% of the required phosphorus, potassium, and sulfur and 20% of nitrogen were applied as basal fertilizers (10:26:26, muriate of potash, and bentonite sulfur). Forty-five-day-old seedlings were transplanted in the third week of December at 15 cm spacing between rows and 10 cm between plants, maintaining a plant density of 66 plants m2 in 16.8 m2 plots. The remaining 80% of nitrogen was applied through urea in 11 equal splits at 6-day intervals from 0 to 60 days after transplanting. Irrigation was provided via drip system, weeds were manually removed 45 days after transplanting, and other intercultural and plant protection practices followed ICAR-DOGR’s guidelines. Onion bulbs were harvested in the second week of April, once 50% of the plants had top fall. After a 3-day field curing, bulbs were separated from the foliage, leaving a 2.5 cm neck. Leaves were removed and cured in farm shade for 2 weeks. The outer two papery layers of onion were removed from bulb, dried in shade, and powdered using kitchen blender. One part was used for LC–MS characterization at National Referral Laboratory, ICAR-National Research Centre for Grapes, Pune, and the remaining sample were used for biochemical analysis.
2.2 Characterization of phenolic compounds
2.2.1 Sample preparation
Dried onion peel powder (2 g) was preliminary soaked in 10 mL of water for 30 min followed by extraction with 10 mL of acidified methanol by continuous vortexing. Followed by extraction, the vial was centrifuged at 10,000 rpm for 10 min; the supernatant was taken, diluted appropriately, and injected to UHPLC-Orbitrap MS for qualitative identification of anthocyanin and other major phenolic compounds.
2.2.2 LC–MS [UHPLC-Orbitrap MS] conditions
An Ultimate 3000-series Ultrahigh-Performance Liquid Chromatograph (UHPLC) hyphenated to a Q Exactive mass spectrometer (MS) (Thermo Fisher Scientific, Bremen, Germany) was used with an Ascentis Express C18 (100 × 2.1 mm, 2.7 μm) column (Supelco). The mobile phase comprised of (A): methanol: water (10:90) and (B): methanol: water (90:10) with 0.2% formic acid in both phases. The gradient program was 0–1 min/95% A, 1–5 min/95–55%A, 5–10 min/55–2% A, 10–14 min/2% A, 14–15 min/2–95% A, and 15–20 min/95% A, at 0.4 mL/min flow rate. A heated-electrospray ionization (H-ESI) source was used. The H-ESI parameters in positive polarity were as follows: sheath gas flow rate, 45; auxiliary gas flow rate, 8; sweep gas flow rate, 1; spray voltage, 3.50 kV; S-lens RF level, 50.0; capillary temperature, 320°C; S-lens RF level, 50.0; heater temperature, 300°C. The MS analysis was performed in full scan (70,000 full width at half maxima at m/z 200), followed by data-dependent MS/MS (ddMS2) at 17500 resolution (m/z 200) with stepped collision energy, operated at 18, 35, and 70 V maintaining the automatic gain control (AGC) target at 1e6.
2.2.3 Data processing
The LC–MS data files (n = 3, biological replications) were processed by the Trace finder software (version 3.3, Thermo Fisher Scientific). The automated data processing involved compound identifications by comparison with a database of anthocyanin, phenolic compounds, and their derivatives. This database comprised more than 235 compounds with compound specific information (molecular formula, adduct, monoisotopic molecular mass, and fragment mass) from various web-based resources (e.g., ChemSpider) and published research papers.
2.3 Determination of total anthocyanin content (TAC)
Total monomeric anthocyanin was determined based on the principle of pH-dependent structural changes from colored oxonium ion to colorless hemiketal forms (Lee et al., 2005) with some modifications suggested by Krithika et al. (2020). Each extract (200 μL) was diluted separately with 800 μL of 0.025 M potassium chloride buffer (pH 1.0) and 0.4 M sodium acetate buffer (pH 4.5) and incubated for 15 min in dark. Absorbance for each dilution was taken using SpectroStar Nano plate (BMG Labtech) at 520 and 700 nm against blank made of distilled water. Total anthocyanin content was expressed as cyanidin-3-glucoside equivalent per 100 gram of dry matter and calculated using the following equation:
where MW is the molecular weight of cynidin-3-glucoside (449.2 g mol−1), DF is the dilution factor (e.g., DF is 5 for an extract of 200 μL diluted to a final volume of 1,000 μL), ɛ is the molar extinction coefficient of cynidin-3-glucoside (26,900 LM−1 cm−1), T.E.V is the total extract volume, and W is the weight of sample (Lee et al., 2008).
2.4 Determination of total phenol content (TPC)
The total phenol content was estimated using Folin–Ciocalteu reagent followed by Singleton and Rossi (1965) with some modifications suggested by Ateeq et al. (2023). Sample extraction (100 μL) was added to 200 μL of 10% (v/v) F-C reagent and thoroughly vortexed. To the vortexed mixture, 800 μL of 700 mM Na2CO3 was added and incubated for 2 h at room temperature. The reaction mixture (200 μL) was transferred in 96-well microplate, and the absorbance was taken at 765 nm against 95% methanol as blank on a SpectroStar Nano plate (BMG Labtech). Gallic acid was used as standard (100–1,000 μg/mL) for the preparation of calibration curve (R2 = 0.9996), and the total phenol content was expressed as gallic acid equivalent (GAE) per 100 gram of onion peel.
2.5 Determination of total antioxidant activity (TAA)
Free radical scavenging assay was followed to assay the antioxidant activity of onion peel extract. The same extract was used for FRAP, DPPH, and ABTS assay.
2.5.1 Ferric reducing antioxidant power (FRAP) assay
Direct measurement of total antioxidant activity was estimated through FRAP assay which measures blue to purple color formed due to reduction of ferric tripyridyltriazine (FeIII-TPTZ) complex (Benzie and Strain, 1999) with some modifications suggested by Sagar et al. (2020). FRAP working reagent was prepared by mixing 300 mM acetate buffer, pH 3.6, 10 mm TPTZ in 40 mM HCl and 20 mM FeCl3.6H20 in a ratio of 10:1:1 (v/v/v). It was prepared freshly as per requirement. Reaction mixtures containing 3.0 mL of working FRAP reagent and 100 μL test sample or standard solution of Trolox were mixed, vortexed, and incubated for 6 min at room temperature. Absorbance at 593 nm was taken using SpectroStar Nano plate (BMG Labtech) against a reagent black and corrected by methanol as blank. Synthetic analog of Tocopherol (Trolox) was taken as standard, and the total antioxidant activity was expressed as μmol/g dry weight.
2.5.2 2,2-diphenyl-1-picrylhydrazyl (DPPH) assay
Antioxidant activity was determined using DPPH radical as per the methodology described by Stoica et al. (2022) with some modifications. DPPH solution (0.1 mM) was made with ethanol, and 3.9 mL of it was added to 100 μL of onion peel extract or standard and incubated for 30 min at room temperature before reading the absorbance at 593 nm against ethanol as a blank on a SpectroStar Nano plate (BMG Labtech). DPPH solution without antioxidant was kept as control. Trolox equivalent antioxidant capacity (TEAC) was calculated using Trolox at 100–1000 μM as reference standard and presented as μmol Trolox equivalent (TE)/g sample. Each sample/standard was read in triplicate.
2.5.3 2,2′-azinobis-(3-ethylbenzothiazoline-6-sulfonic acid (ABTS) assay
ABTS radical scavenging assay was estimated as per the method described by Re et al. (1999) and Sagar et al. (2020). ABTS radical was prepared by mixing 7 mM aqueous solution of ABTS diammonium salt with 2.45 mM potassium persulfate (K2S2O8) in a ratio of 1:1 (v/v) and incubated for 16 h in dark at room temperature. Fresh working solution was prepared by appropriate dilution of ABTS radical solution with ethanol till an absorbance of 0.700 ± 0.002 unit at 765 nm. A reaction mixture of 100 μL sample or standards and 3,900 μL of ABTS working solution were incubated for 6 min at room temperature before recording the spectrophotometric absorbance at 765 nm against 75% ethanol as blank. Trolox was used as reference standard at 100–1200 μM, and Trolox equivalent antioxidant capacity (TEAC) was expressed as μmol TE/g DW.
2.6 Statistical analysis
The results of TAC, TPC, FRAP, DPPH, and ABTS assay were presented as mean ± standard deviation of three replicates (biological replications). Significance of difference between samples was evaluated through analysis of variance (ANOVA) using SAS base 9.2 (Tukey’s test, p < 0.05). Multivariate analysis, that is, principal component analysis (PCA), cluster analysis, and correlation coefficients were carried out with JMP 9.0.0. Biplot between PCA 1 and PCA 2 was drawn using MS excel. Chemical structure was drawn on ChemDraw 19.1.
3 Results and discussion
3.1 LC–MS [UHPLC-Orbitrap MS] analysis
OPE of eight onion varieties was taken for high-resolution UHPLC-Orbitrap Mass Spectrometric analysis, and compound identification was performed against an in-house updated high-resolution accurate mass (HRAM) database, which was originally received from Thermo Fisher Scientific. The automated analyte identification and confirmation were based on the HRAM measurement of the precursor and its characteristic productions, each within ±5 ppm of mass error and retention time tolerance of ±0.1 min. Matching of the isotopic pattern (by >90%) was considered as an additional filter. For example, quercetin glucoside was identified based on the precursor ion (m/z = 465.1030) with a mass error of 0.5 ppm (as observed in MS spectra) (Figure 1). It was above the threshold intensity of 5,000. In addition, the detection of characteristic fragment (m/z = 303.0501) supported its identification (as observed in MS/MS spectra). We identified 49 polyphenolic compounds including 33 anthocyanin (Table 2, compounds 14–46), 8 flavanol (6–13), 4 flavones (1–4), and 1 each of pyranoanthocyanin (47), chalcone (5), phenolic acid (48), and ellagitannins (49). Recoveries of reference standard quercetin and pelargonidin-3-O-glucoside were used for relative quantification of identified compounds. Since reference standards of all compounds were not available, pelargonidin-3-O-glucoside was used for quantitation of all anthocyanin, and quercetin was used for quantitation of all flavonoids.
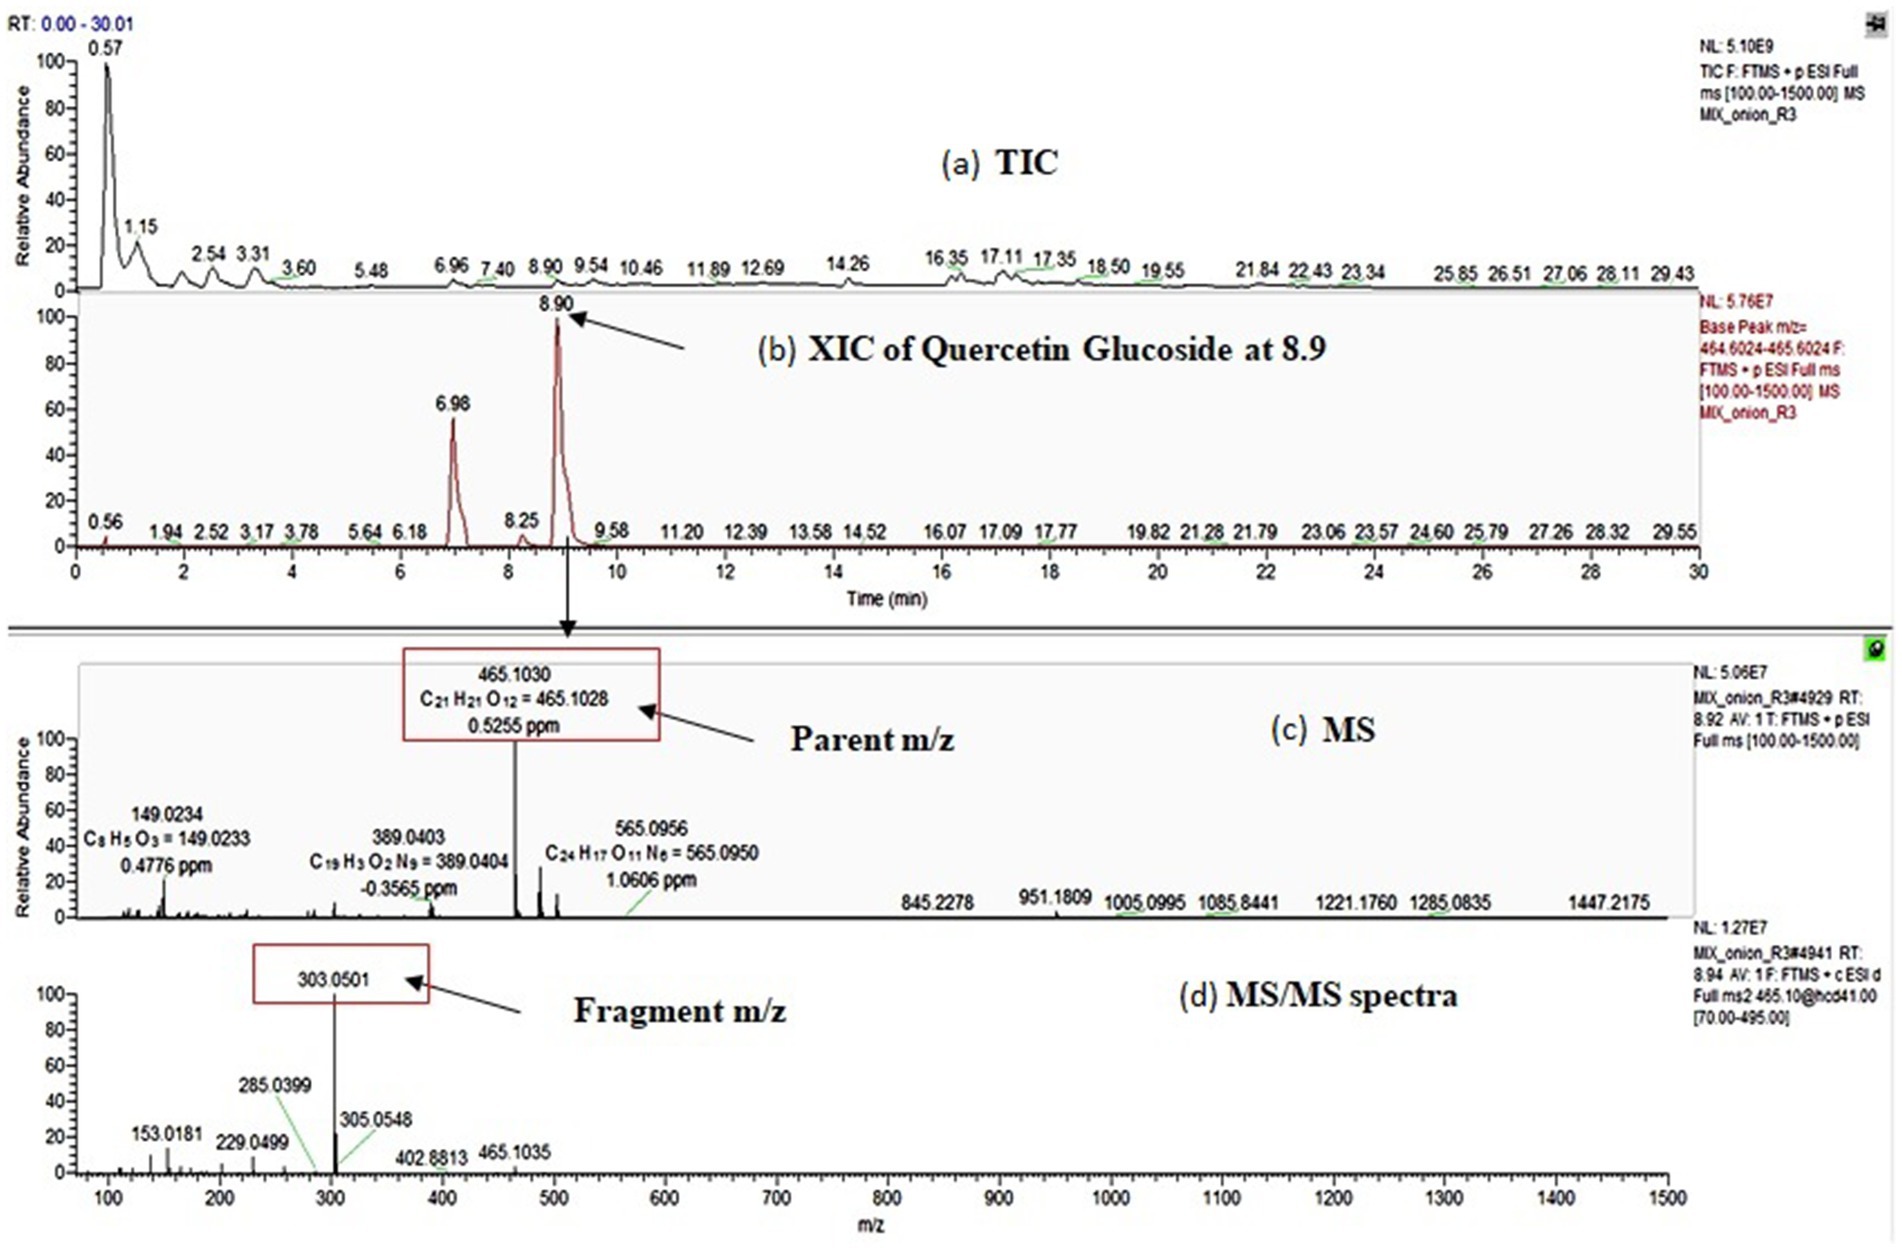
Figure 1. Identification of quercetin glucoside by UHPLC-Orbitrap MS; (a): total ion chromatogram (TIC) of the sample, (b): extracted ion chromatogram (XIC) of quercetin glucoside at RT-8.9 min, (c): MS spectra of quercetin glucoside and (d): MS/MS spectra of quercetin glucoside.
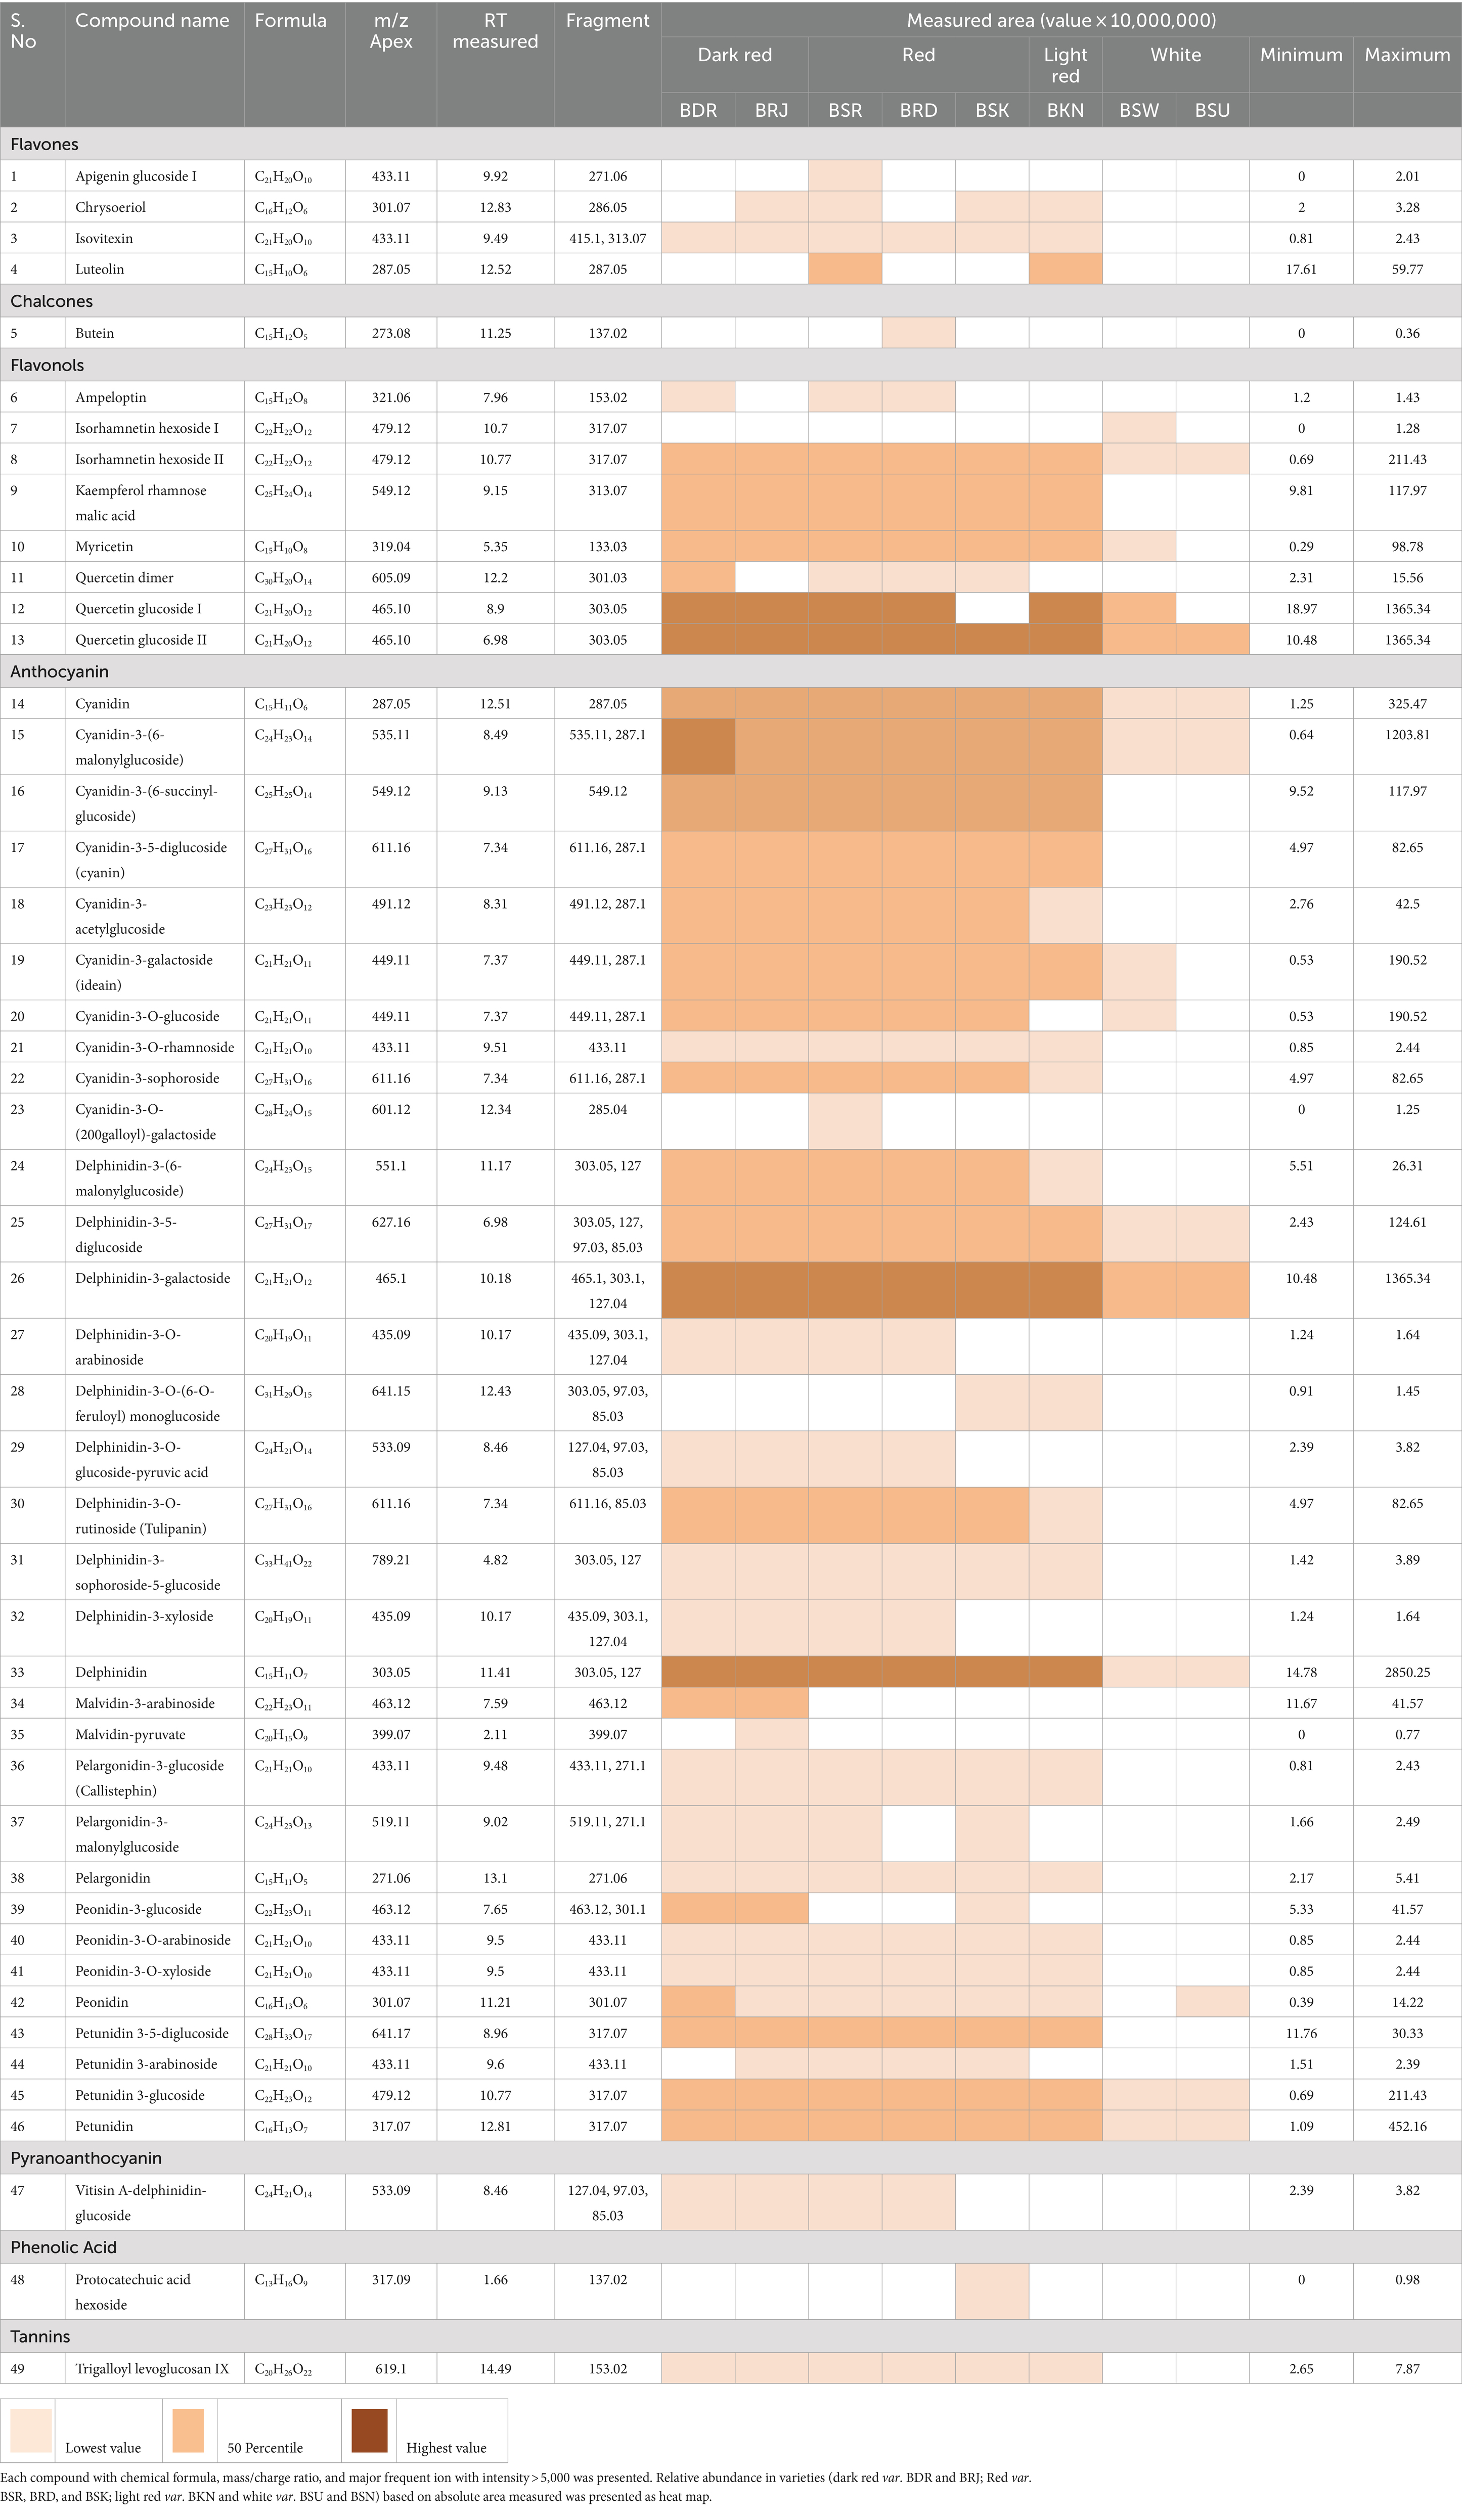
Table 2. LC–MS [UHPLC-Orbitrap MS] characterization profile of putative phenolic compounds identified in OPE of eight differentially pigmented onion varieties.
3.1.1 Flavanol
Flavanols are versatile class of flavonoid and characterized to have significant role in auxin transport and nodule development in legumes and provide protective interface against abiotic and biotic stress (Petrussa et al., 2013). Nutritionally, it has potential health benefits against cardiovascular disease, mutagenesis owing to its antioxidant properties (D’Andrea, 2015). As presented in Table 2, eight peaks were putatively identified as flavanol which include two isorhamnetin glycosides (Table 2, compounds 7–8), two quercetin glycosides (12–13), one quercetin dimer (11), one myricetin (10), one kaempferol glycosides (9), and one dihydromyricetin or ampeloptin (6). Quercetin glucoside appeared on two retention time (tR) 8.9 and 8.96 with baseline separation having same precursor ion m/z = 465.1 and fragment ion m/z = 303.05 which indicates that both compounds may exist in isomeric forms (Figure 1). Anthology suggests that quercetin exists in four mono-glycoside forms with a substitution at positions 4′ (quercetin 4′-glucoside) and 3′ (quercetin 3′-glucoside) in aromatic ring B and positions 3 (quercetin 3-glucoside) and 7 (quercetin 7-glucoside) of γ-benzopyrone ring (Kwak et al., 2017; Lee et al., 2012). Another flavonoid isorhamnetin glucoside also eluted at different (tR) 10.70 and 10.77 min. Having same elemental composition C22H22O12 with a molecular (M+) ion m/z = 479.12 and a characteristic fragment ion peak m/z = 317.07 suggest the isomeric presence of compound. Literature reports two forms of isorhamnetin glucoside having glucosyl substitution at 4’ Carbon (isorhamnetic 4′-glucoside) and at 3 position in flavanol skeleton (isorhamnetin 3-glucoside) (Bonaccorsi et al., 2005; Park and Lee, 1996). Kaempferol rhamnose malic acid was identified based on peak for molecular ion m/z = 549.12 and characteristic fragment ion m/z = 313.07. Myricetin and dihydromyricetin (ampleoptin) were also identified in onion peel extract. Taxifolin and their conjugated glycosides are reported in onion bulbs (Fossen et al., 1998), while there is limited information about the presence of dihydromyricetin in onion. Yang et al. (2020) reported dihydromyricetin 3-O-rhamnoside along with dihydroquercetin 3-O-rhamnoside in onion. Kaempferol was the only acylated flavanol identified. Quercetin, isorhamnetic, myricetin, kaempferol, and its conjugated glycosides are most abundant flavonols in onion (Rodríguez Galdón et al., 2008; Slimestad et al., 2007).
3.1.2 Anthocyanin
Similar to flavanol, 34 anthocyanin compounds (Table 2, compounds 14–46) were putatively identified based on molecular and product ion peak with less than 5 ppm mass error. For instance, delphinidin-3, 5-diglucoside (25) was eluted at 6.98 min and identified based on the characteristic fragment m/z = 303.05 (Figure 2). Cyanidin-3-(6-malonylglucoside) with elemental composition C24H23O14 (tR = 8.49 min) was identified based on observed parent molecular ion peak m/z = 535.11, and its identity was further confirmed by characteristic product ion m/z = 287.1 for cyanidin aglycone. In similar way, 34 anthocyanins which include 10 cyanidin (14–23), 10 delphinidin (24–33), 4 peonidin (39–42), 4 petunidin (43–46), 3 pelargonidin (36–38), and 2 malvidin (34–35) were identified in this study. Among all anthocyanins, six were acylated glycosides, five were aglycone, and three were doubly substituted (Table 2). We observed maximum of 30–33 anthocyanin glycosides in dark red and red onion varieties and minimum of 9–11 anthocyanin in white onion (BSU and BSW). Downes et al. (2009) reported ten anthocyanin glycosides of cyanidin and peonidin but did not found petunidin, pelargonidin, and malvidin. However, there is limited information regarding the presence of malvidin in onion. Petersson et al. (2008) reported malvidin-3-glucoside in red onion bulb (Petersson et al., 2008) and later by Yang et al. (2020). Vitisin A-delphinidin glucoside (47) is a pyranoanthocyanin conjugated with delphinidin glucoside which was also identified in onion peel extract. The presence of anthocyanin oligomers or pyranoanthocyanin has been reported in grapes, rose, and red onion (Fossen and Andersen, 2003; Santos-Buelga et al., 2014; Rentzsch et al., 2007).
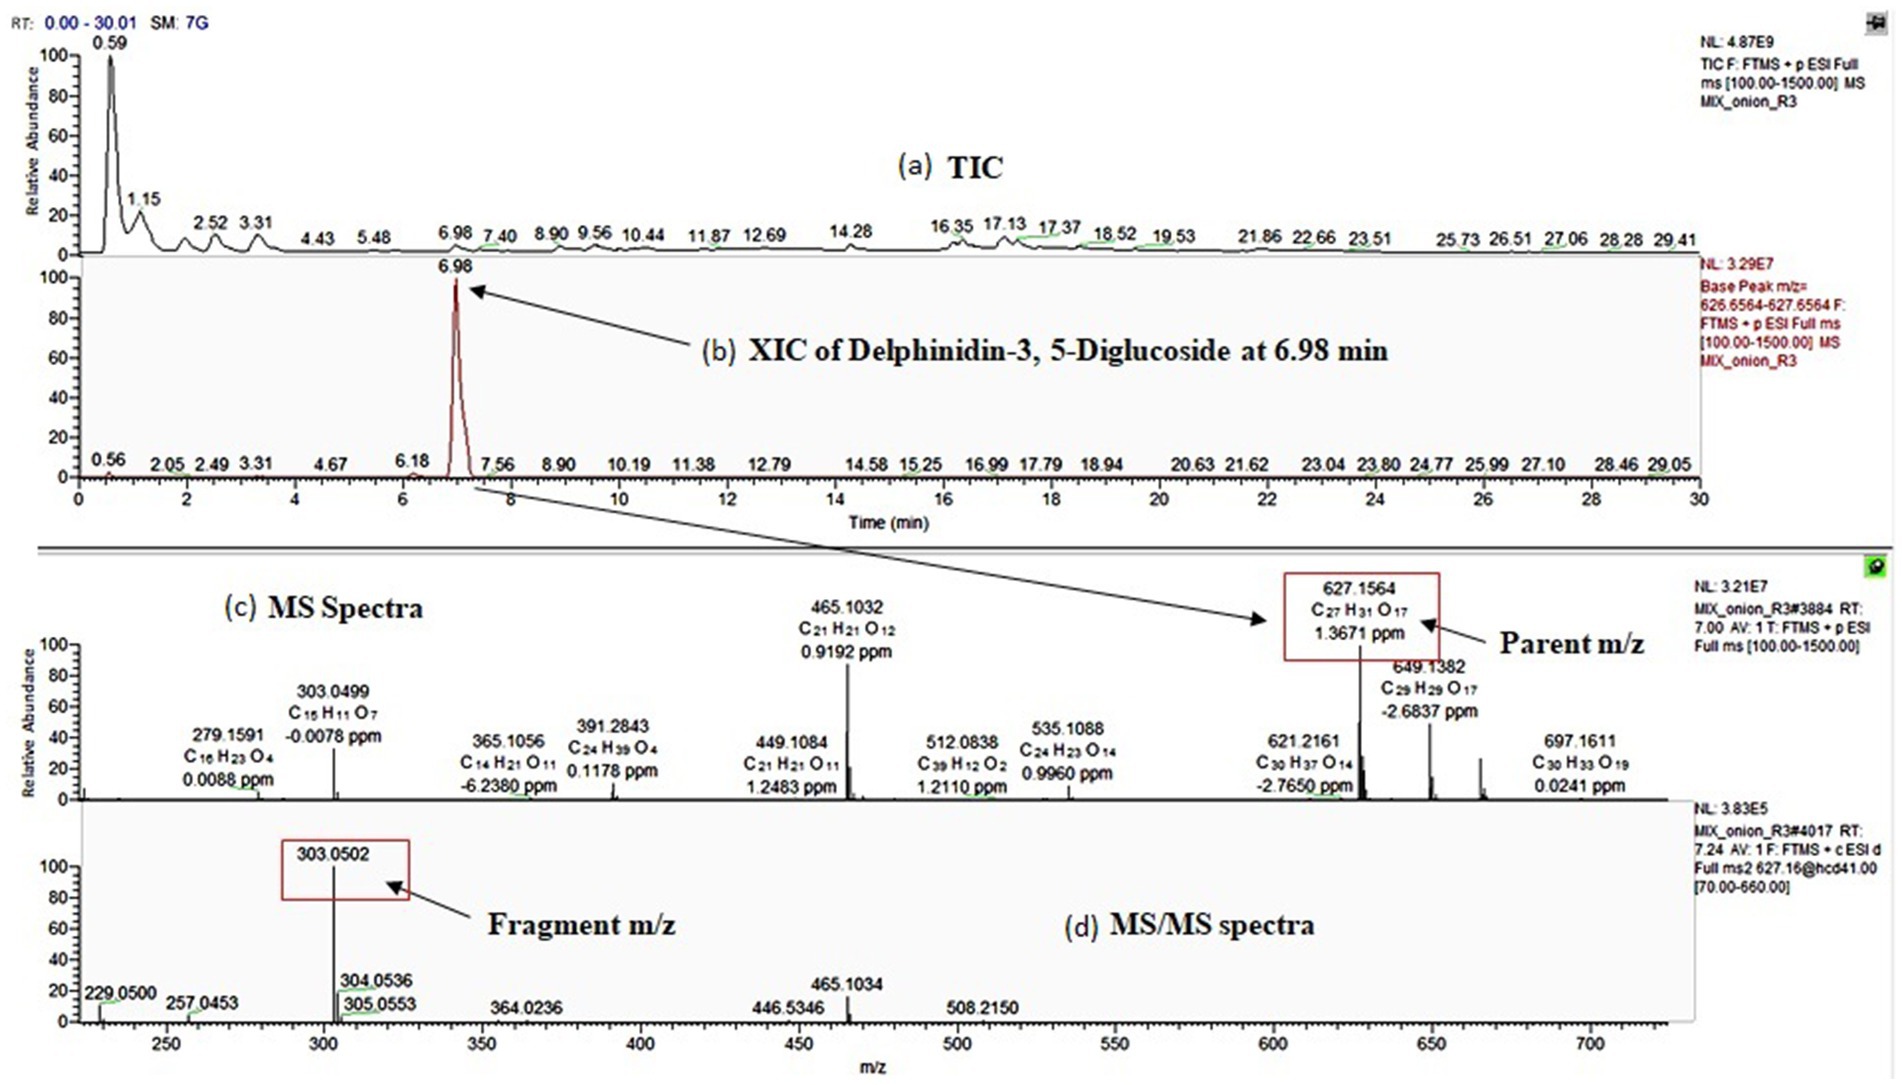
Figure 2. Identification of delphinidin-3, 5-diglucosideby UHPLC-Orbitrap MS analysis; (a): total ion chromatogram (TIC) of the sample, (b): extracted ion chromatogram (XIC) of delphinidin-3, 5-diglucoside at RT-6.98 min, (c): MS spectra of delphinidin-3, 5-diglucoside and (d): MS/MS spectra of delphinidin-3, 5-diglucoside.
3.1.3 Flavones and other compounds
Flavones (3-deoxyflavanol) are a class of flavonoids widely present in fruits and vegetables. Five flavones (1–4), apigenin, luteolin, chrysoeriol, and isovitexin were putatively identified from onion peel extract with low abundance. Low abundance of flavones in onion has been hypothesized (Kothari et al., 2020), but very few reports are available. Yang et al. (2020) reported apigenin 6-C-glucoside and luteolin 7-O-glucuronid in onion bulb. A degradation product of anthocyanin, protocatechuic acid hexoside, was also identified based on precursor ion peak m/z = 317.09 and characteristic fragment ion peak m/z = 137.02 (Ly et al., 2005). 2′,3,4,4′-tetrahydroxychalcone was also observed having a molecular ion (M+) m/z = 273.08 and characteristic fragment ion peak m/z = 137.02. Chalcones are abundant in bright yellow color onion (Schwinn et al., 2016). A hydrolysable tannin, trigalloyl levoglucosan, with a precursor m/z = 619.1 and fragment ion 153.02 was also identified in this study. It is levoglucosan acylated with gallic acid (3, 4, 5-Trihydroxybenzoic acid).
3.2 Relative distribution of polyphenolic compounds
The relative distribution of major classes of putatively identified polyphenolic compounds in differentially pigmented onion varieties is presented in Figure 3. Based on the absolute area response of the identified peak, it was noted that out of 49 identified phenolic compounds, maximum of 43 were detected in var. BSR which include nine flavanol, four flavones, and thirty anthocyanin glycosides. In white onion varieties BSU, only nine compounds were identified including five flavanol and eleven anthocyanin.
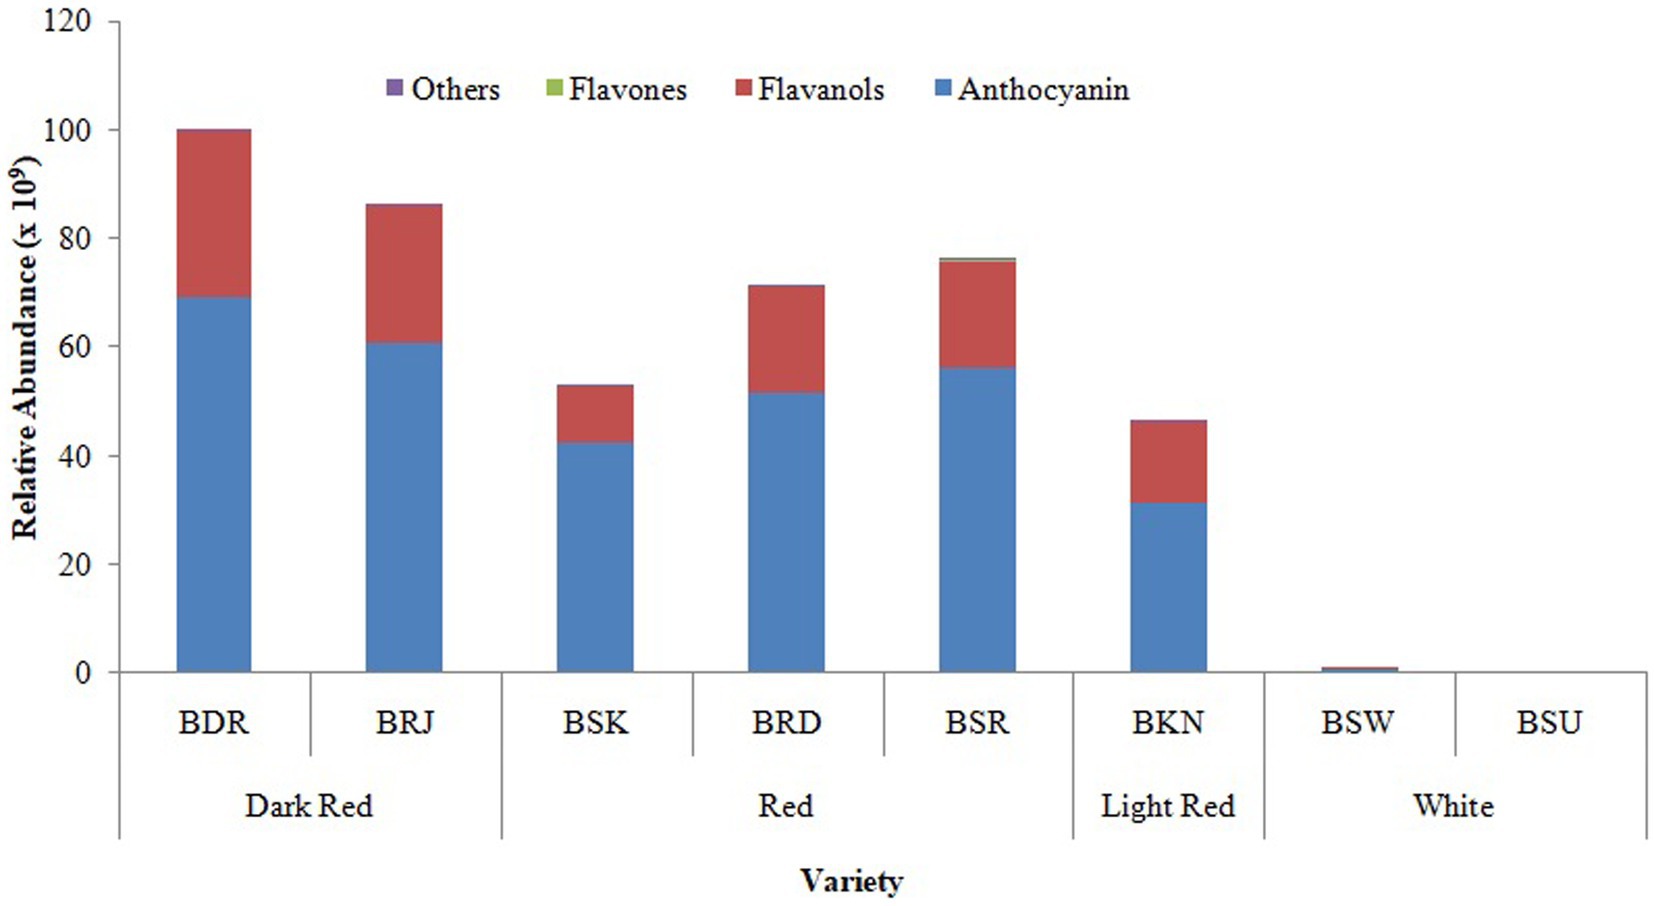
Figure 3. Relative distribution of classes of phenolic compounds in OPE of eight differentially pigmented onion varieties. Length of stacked bar indicates the sum of mean measured area (n = 3) of total compounds identified comprising of flavanol, anthocyanin, flavones, and other compounds.
Flavanols are hydrophilic compound with β-glycosidic linkages which makes it a most bioavailable antioxidant in human diet (Price and Rhodes, 1997). Onion bulbs are reported to have higher flavanol content than anthocyanin (Metrani et al., 2020; Khandagale and Gawande, 2019) and are reportedly only 10% of the total polyphenols (Rodrigues et al., 2017) in bulb. In onion peel extract (OPE) of differentially pigmented onion varieties, anthocyanin was the most abundant polyphenolic compounds than flavanol. Albishi et al. (2013) also reported higher flavonoid content in red onion skin than bulb. Inner scales of onion bulbs have lower flavonoid level than outer scales (Patil and Pike, 1995). Among flavanol, quercetin glucoside was most abundant flavanol observed across pigmented onion varieties followed by isorhamnetin, kaempferol, and myricetin. Glucose is the exclusive moieties in quercetin attached to 3, 7, or 4′ position of aglycone. Quercetin 4′-glucoside and quercetin 3,4′-glucosides are widely reported to be the most abundant flavanol in onion bulbs (Pucciarini et al., 2019). The abundance of all the flavanol was very low in white onion cultivars in comparison with others. Price and Rhodes (1997) also reported quercetin and its glycosides as most predominant flavanol, and it was higher in red onion varieties Red baron, Rose, and Rijnsburger than white variety albino (Price and Rhodes, 1997).
Flavones are 2-phenyl-1-benzopyran-4-one, having additional double bond between C2 and C3 of flavonoid skeleton and no hydroxyl group at C3 position. It is reported to have lower antioxidant potential and poor absorption in human intestine but has significant role in biotic defense against insect and microbes (Hostetler et al., 2017). In OPE of differentially pigmented varieties, flavone was most abundant in light red varieties (BSR), less abundant in red varieties, and absent in white onions. A chalcone, butein, was observed only in var. BRD and protocatechuic acid in var. BSK. Trigalloyl levoglucosan was observed in all red varieties but found absent in white varieties (Table 2).
Among anthocyanin, delphinidin was the most predominant class of anthocyanin followed by cyanidin > petunidin > peonidin > malvidin > pelargonidin in most of the cultivars (Figure 4). As presented in Table 3, relative abundance of cyanidin and its glycosides observed maximum in dark red var. BDR and BRJ and gradually lower level in red var. BSR, BRD, BSK, and light red var. BKN, while it was minimum in white var. BSU. Contrary of cyanidin, percentage abundance of delphinidin and its glycoside was observed minimum in dark red verities, slightly higher in red and light red var. and maximum in white onions. Relative abundance of cyanidin and delphinidin might be the key factor associated with differential pigmentation of onion bulb. Cyanidin glycosides were observed with most acylation followed by pelargonidin. Acylation is predominant in dark red and red onion cultivars than light red and white. Cyanidin-3-(6-malonylglucoside), delphinidin, and delphinidin-3-galactoside were the predominant pigment in dark red var. BDR and BRJ, and its abundance suggests a key role in differential pigmentation pattern. Downes et al. (2009) also reported predominant presence of cyanidin-3-(6-malonylglucoside) in dark red onion. Similar reports were made by Fossen et al. (1996) and Donner et al. (1997). Most abundant aglycone across all the varieties was delphinidin followed by petunidin and aglycone form of both are more abundant in colored cultivars than white. In cyanidin glycoside, aglycone form is more abundant in white than colored varieties. As presented in Figure 5, third carbon position in benzopyrylium ring was the most preferred substitution followed by fifth carbon position. Glucose (glc), galactose (gal), rhamnose (rham), sophoroside (soph), xylose (xyl), arabinose (ara), and rutinoside (rut) were the observed glycoside substitution, and among these, glucoside and galactoside were the most preferred.
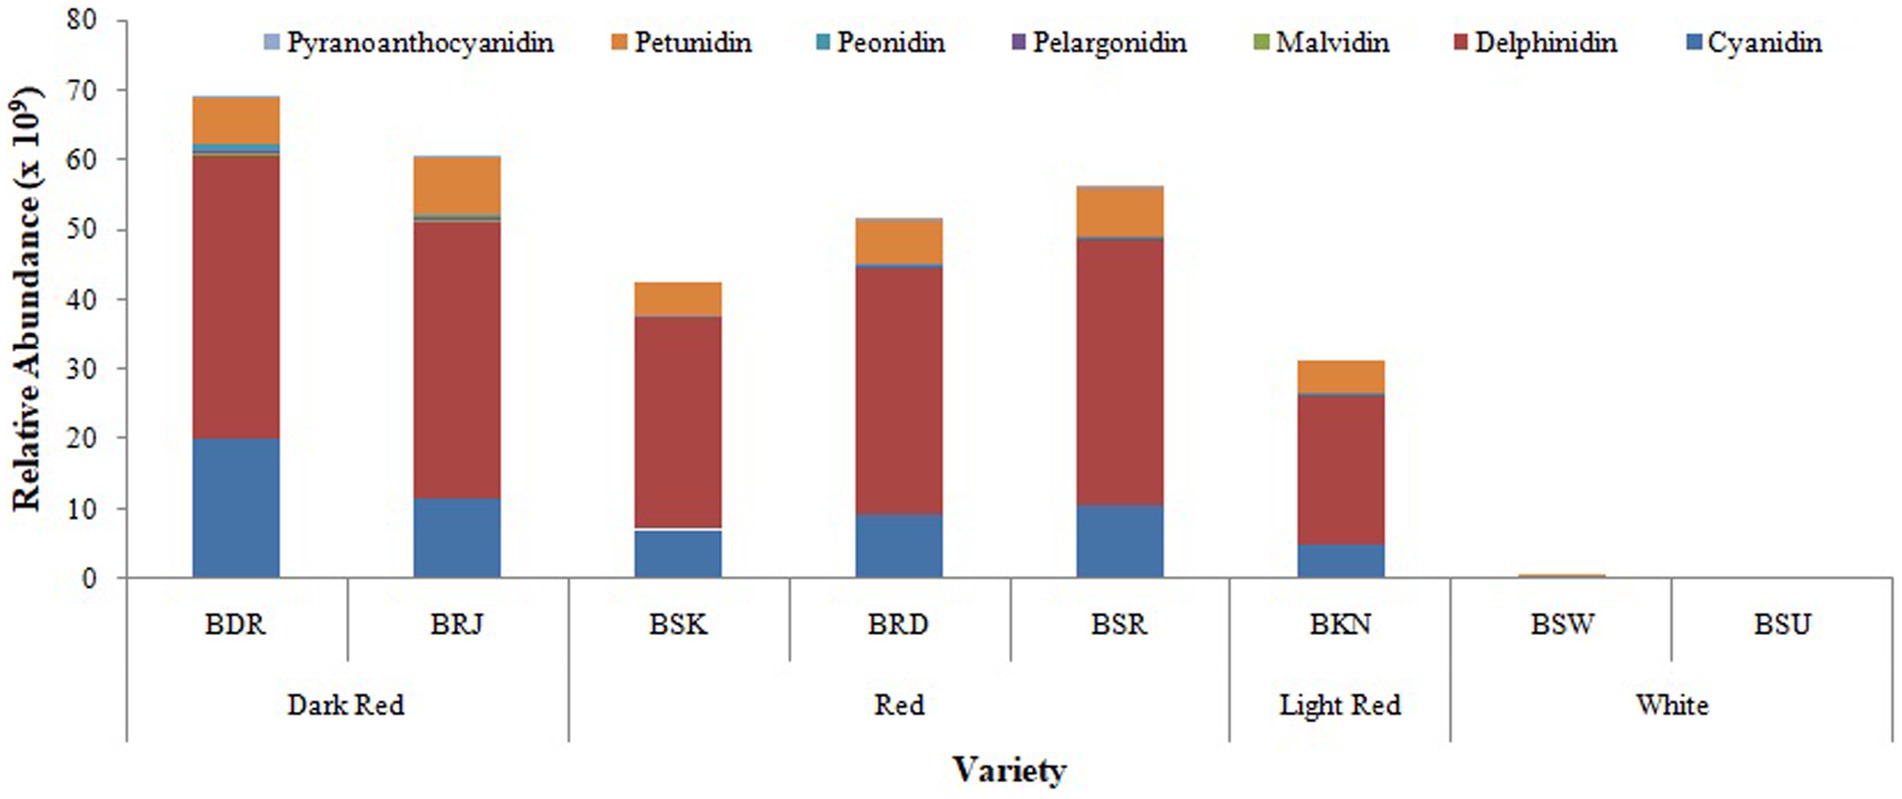
Figure 4. Relative distribution of classes of anthocyanin compounds in OPE of eight differentially pigmented onion varieties. Length of stacked bar indicates the sum of mean measured area (n = 3) of total compounds identified comprising of cyanidin, delphinidin, malvidin, pelargonidin, peonidin, and petunidin.
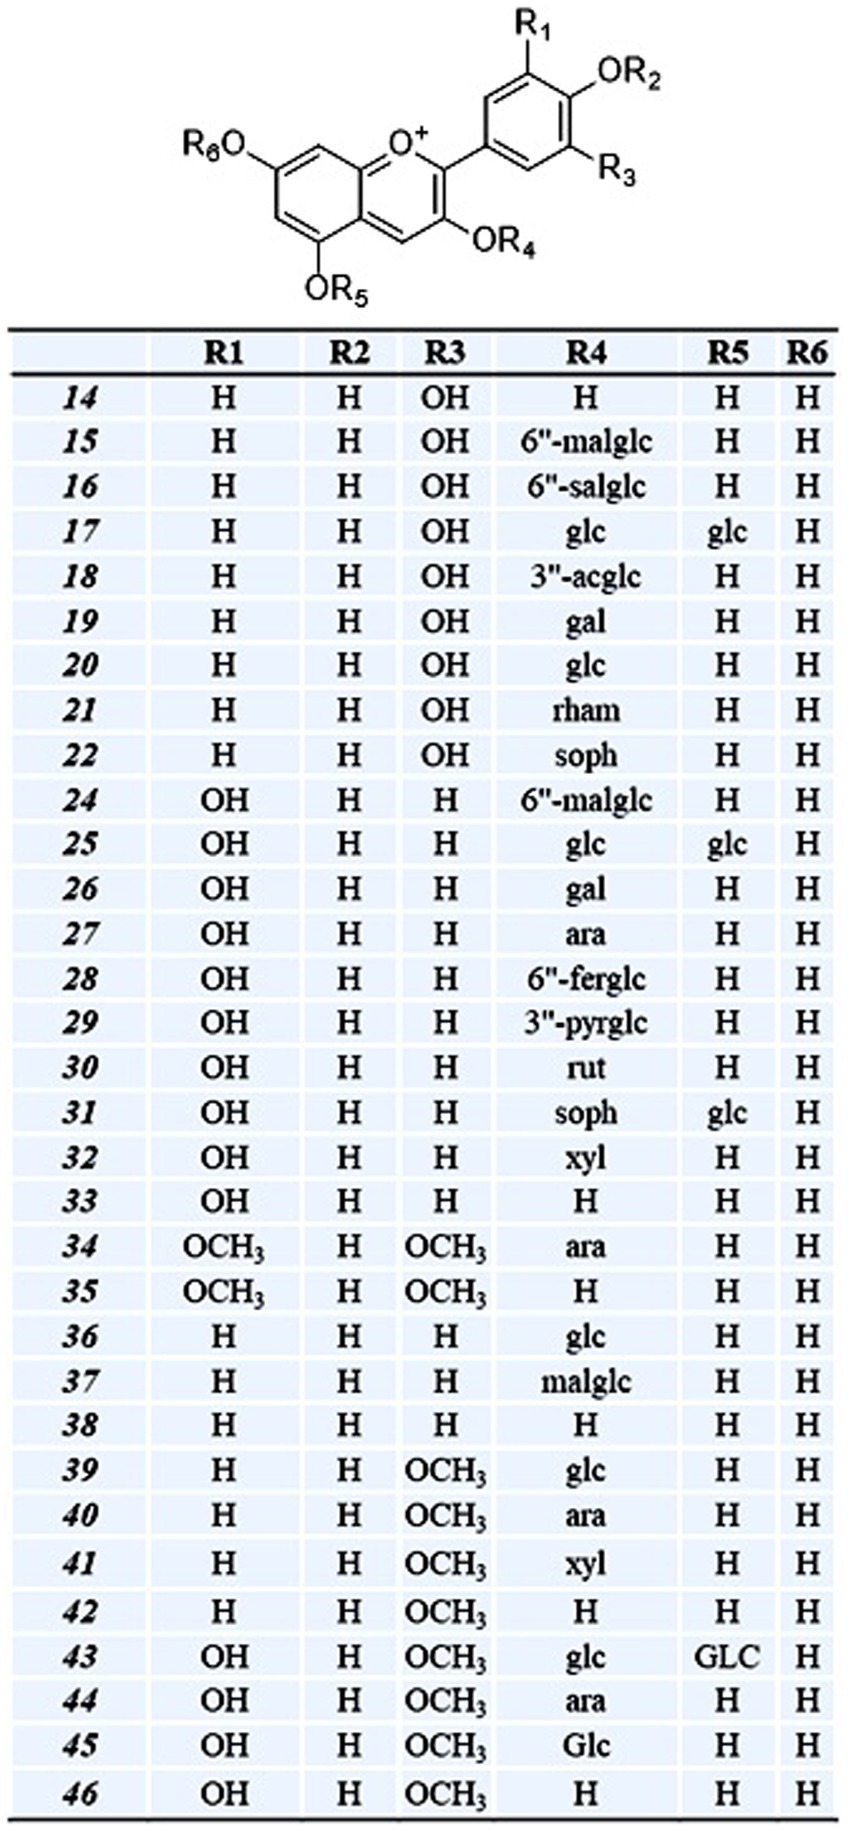
Figure 5. Class of putative anthocyanin compounds identified from the OPE of eight differentially pigmented onion varieties and its substitution pattern. Cyanidin (14–22); delphinidin (24–33); malvidin (34–35 ); pelargonidin (36–38); peonidin (39–42); petunidin (43–46). Compound numbering is as per Table 2. Abbreviation are as follows: mal-malonyl, sal-succinyl, fer-feruloyl, pyr-pyruvic acid, ac-acetyl, glc-glucose, gal-galactose, ara-arabinose, rham-rhamnose, soph-sophorose, xyl-xylose, rut-rutinose.
3.3 Principal component analysis (PCA) and cluster analysis
PCA was performed on the relative abundance data obtained for the putatively assigned anthocyanin compounds (14–47). Principal component score of eight varieties varying on PC1 (66.72%) and PC2 (14.75%) is presented in Figure 6. Eight distinctly pigmented varieties under investigation grouped in four groups. White varieties BSU and BSW grouped together having negative correlation with both PC1 and PC2. Varieties BSK, BRD, and BKN grouped together and showed very low variation with PC1 and considerable variation on PC2. Red var. BSR and dark red var. BRJ showed very positive correlation with PC1 and PC2. Dark red variety BRD showed very high positive correlation with PC1 and negative correlation with PC2. Examination of component pattern distribution (Supplementary Figure 1) on principle component axis revealed that substituted and acylated anthocyanin are strongly correlated with PC1 and show very less variation, whereas it is well distributed along PC2. Cyanidin (14–23) exhibited exclusive distribution on negative axis of PC2 and positive axis of PC1, whereas pelargonidin (36–38) on positive axis of PC1 and PC2. Among the five most abundant anthocyanin cyanidine-3-(6-malonylglucoside), delphinidin-3galactoside, delphinidin, petunidin 3-glucoside, and petunidin, all are positively correlated with PC2 except cyanidine-3-(6-malonylglucoside). This suggests that preceding four anthocyanin compounds might be the key determinant of red color var. BSR, BRJ, and BRD while cyanidine-3-(6-malonylglucoside) in dark red var. BDR.
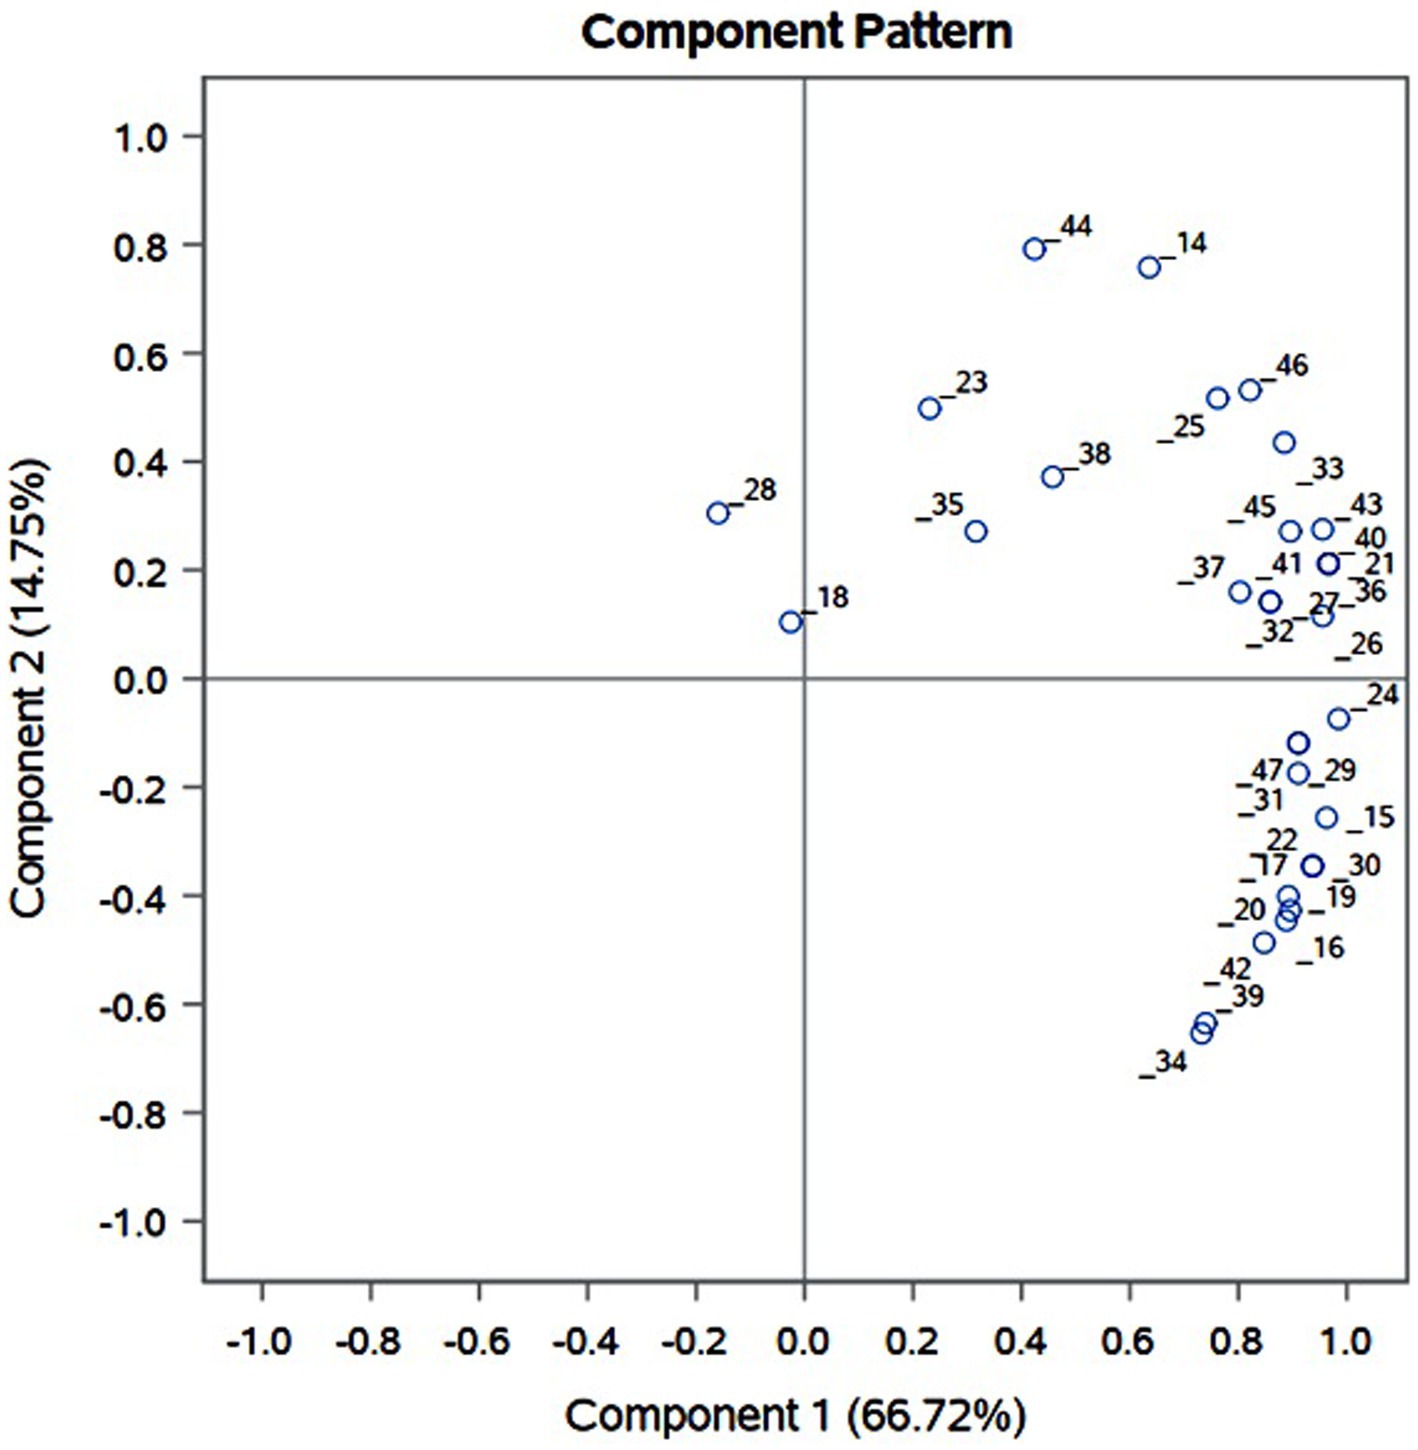
Figure 6. Principal component analysis (PCA) of anthocyanin compounds identified from OPE of differentially pigmented onion varieties, viz., Dark red var. BDR and BRJ; Red var. BSR, BRD, and BSK; Light red var. BKN; white var. BSU and BSW.
Varieties were well classified by cluster analysis supporting the color distribution pattern (Figure 7). At partial R square value 0.1, we observed two cluster, one with light red var. BKN and red var. BSK while other having red var. BSR and BRD and dark red var. BRJ. Both clades separate with dark red var. BDR at R square value of 2.8. White onion var. BSU and BSW formed a separated clade at R square value >0.4. PCA and cluster analysis revealed that red var. BSK and light red var. BKN have similar anthocyanin distribution pattern. Similarly, dark red var. BRJ exhibited similar distribution of anthocyanin that of red onion var. BSR and BRD.
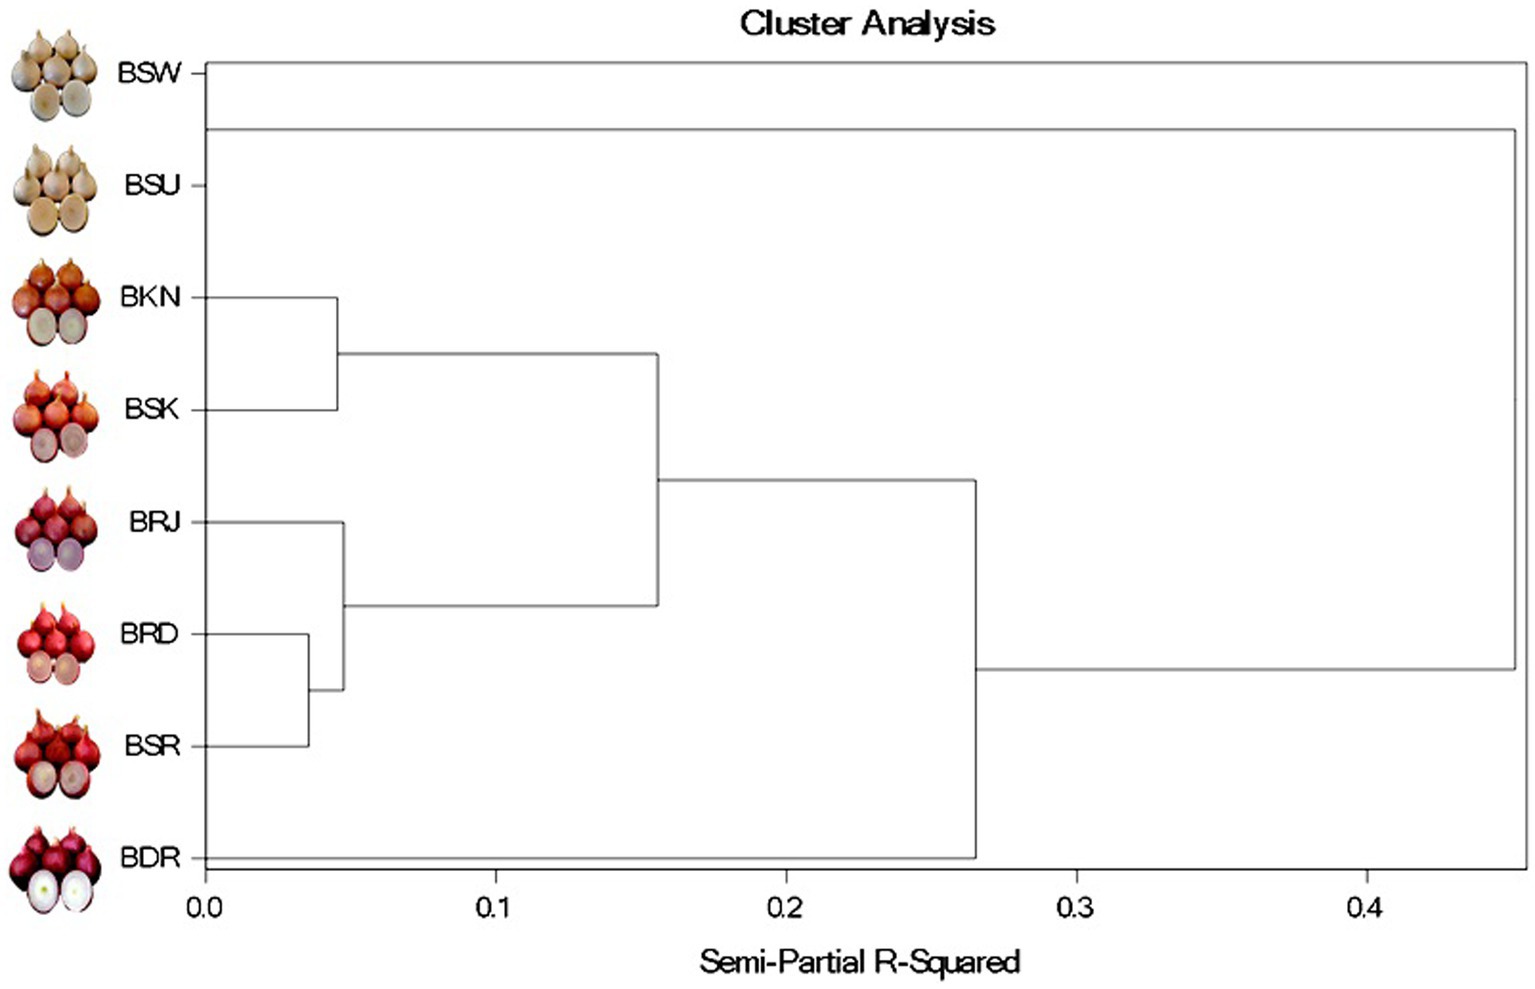
Figure 7. Cluster analysis of anthocyanin compounds identified from OPE of differentially pigmented onion varieties, viz., Dark red var. BDR and BRJ; Red var. BSR, BRD and BSK; Light red var. BKN; white var. BSU and BSW.
3.4 Total anthocyanin and total polyphenol contents
Anthocyanin is a subclass of flavonoid compounds imparting diverse color to onion bulbs and possess various nutraceutical properties. As presented in Table 4, the mean total anthocyanin content in dark red varieties was maximum followed by red, light red, and white varieties. Within the dark red varieties, the anthocyanin content in BDR (28.23 mg/100 g DW) was significantly high than BRJ (5.29 mg/100 g DW) with p ≤ 0.0001 level. Anthocyanin content was observed at par in red varieties BRD, BSK, and BSR and in light red var. BKN. In white varieties, very low level of anthocyanin was observed, and both were not significantly different. Anthocyanin content in dark red var. BDR is ~3–5 times higher than red onion var. and ~ 7–8 times higher than light red varieties. Zhang et al. (2016) reported range of 0.75 ± 0.40 mg/100 g FW anthocyanin content in white, 9.64 ± 0.30 mg/100 g FW in yellow, and 29.99 ± 1.19 mg/100 g FW in red onion. Albishi et al. (2013) also reported more anthocyanin content in onion peel extract (OPE) than bulb.
Total phenol content (TPC) in OPE ranged from 1738.21 to 1757.76 mg GAE/100 g DW in dark red onion, 1306.58 to 1646.73 mg GAE/100 g DW in red onion, and 78.77 to 85.5 mg GAE/100 g DW in white varieties. As presented in Table 4, TPC in all category of OPE extract was significantly different among each other with probability level at p ≤ 0.0001 level. Among red onion, TPC was maximum in var. BSR followed by var. BSK and BRD. Although OPE of light red onion BKN exhibited lower anthocyanin content than red onion, TPC was 1441.13 mg GAE/100 g DW which is higher than red onion var. BRD. High level of polyphenols in onion skin with similar range was reported in literature (Sagar and Pareek, 2020b; Lee et al., 2015; Sagar et al., 2020).
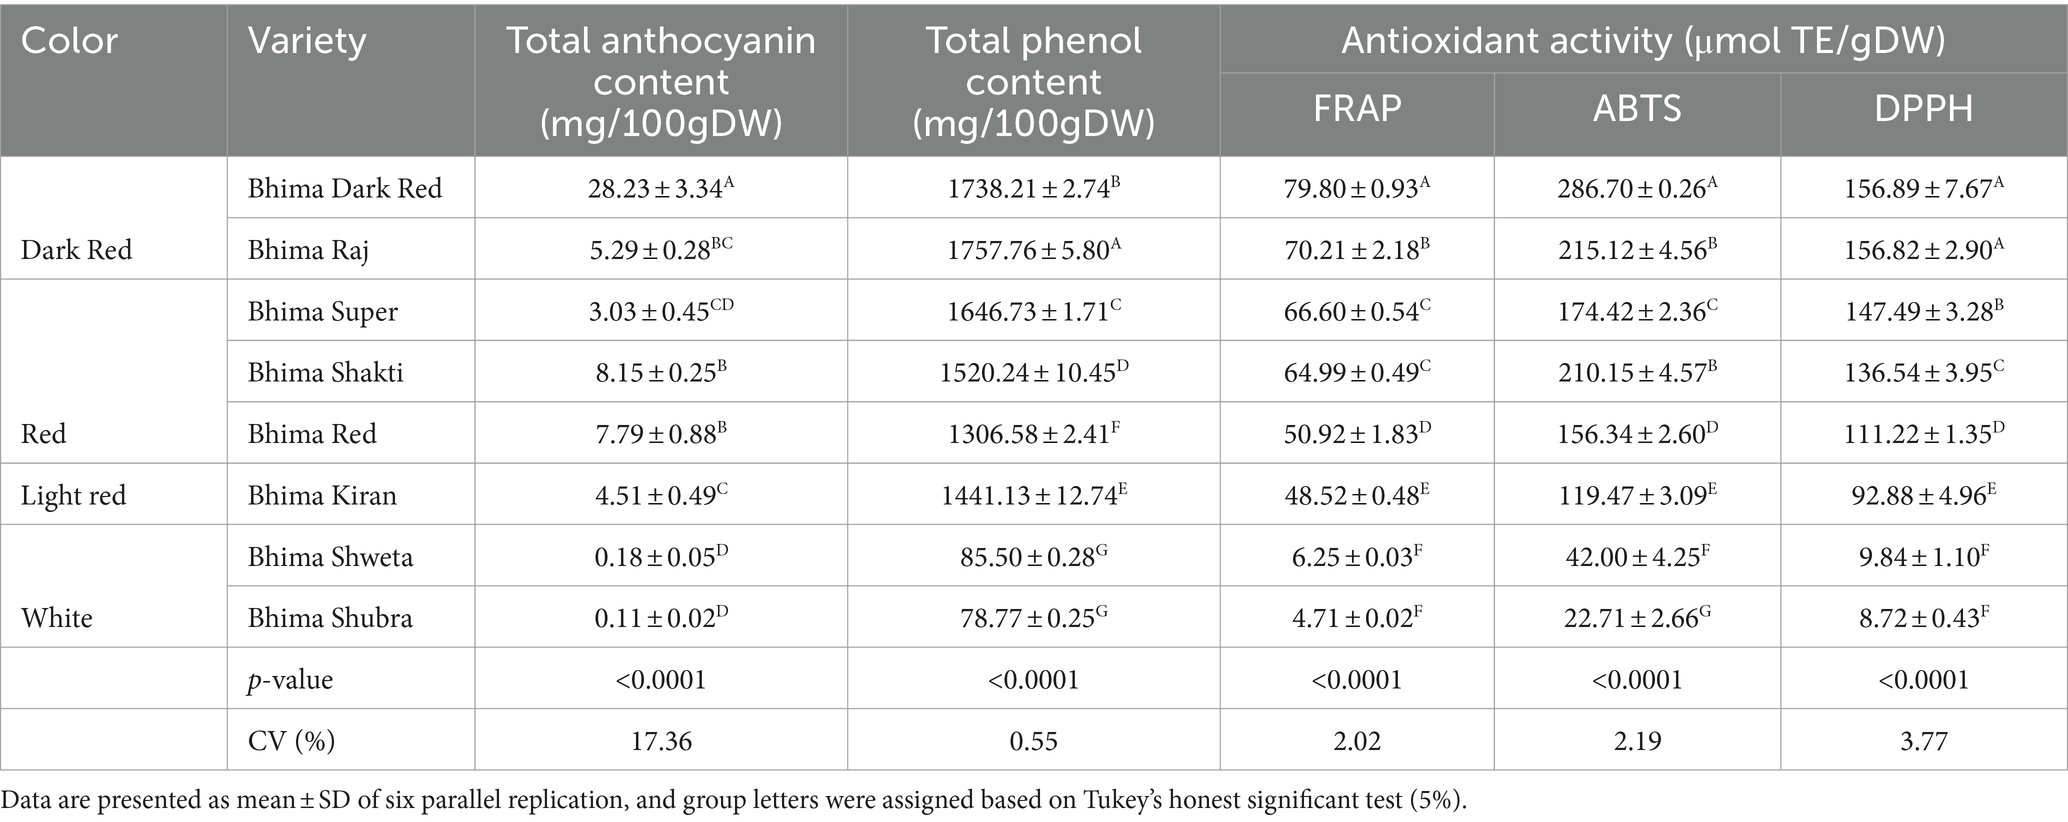
Table 4. Total phenol content (TPC), total anthocyanin content (TAC), and total antioxidant activity (TAA) in OPE of eight differentially pigmented onion varieties.
3.5 Total antioxidant activity
Antioxidant activity has been used widely to characterize various food matrix for the ability to scavenge or neutralize free radicals (Pyrzynska and Pękal, 2013). However, there is no single versatile method to determine antioxidant activity accurately. Here, we followed three methods, viz., FRAP, DPPH, and ABTS, to estimate total antioxidant activity (TAA). The results were compared with water-soluble tocopherol analog Trolox and expressed as micromole per gram. In all the three methods (FRAP, ABTS, and DPPH), the mean antioxidant activity was more in dark red varieties followed by light red and white varieties. The antioxidant activity ranged from 4.71 to 79.80 μmol/g DW, 22.71 to 286.7 μmol/g DW, and 8.72 to 156.89 μmol/g DW in FRAP, ABTS, and DPPH methods, respectively. Total antioxidant activity was maximum in dark red variety BDR and minimum in white variety BSU. Among dark red varieties, BDR showed significantly high antioxidant activity than BRJ in all the three methods (Table 4). In red varieties, the antioxidant activity by FRAP method showed the significantly high value in BSR and significantly low in BRD. BSR and BSK showed similar level of antioxidant activity. All the three red varieties (BSR, BSK, and BRD) were significantly different for ABTS and DPPH activities with maximum in BSR (DPPH method) and BSK (ABTS method). In both the methods (ABTS and DPPH), minimum was found in BRD variety. Within the white varieties, no significant difference was observed in BSW and BSU for FRAP and DPPH. However, significantly high antioxidant value was observed in BSW (42 μmol/g DW) compared to BSU (22.71 μmol/g DW) in ABTS method owing to the better level of polyphenol content.
In all the methods, dark red varieties exhibited highest antioxidant activity, and white varieties had lowest which is evident from the corresponding anthocyanin and polyphenol content. To investigate the profound factor contributing to antioxidant activity of onion peel extract, we performed a correlation analysis among total phenols, total anthocyanin, and three antioxidant methods. As presented in Figure 8, the coefficient of correlation (R2) of antioxidant activity was more in all three methods for TPC than anthocyanin content (TAC). The coefficient of correlation (R2) for TAA and TPC ranged from 0.8105 to 0.9637, while it was considerably low with TAC (0.3271–0.6211). Lee et al. (2015) also observed poor correlation of total antioxidant capacity and anthocyanin content in white, yellow, and red onion. Zhang et al. (2016) reported high correlation between total polyphenols and antioxidant activity, but contrary to our finding, they also reported highly positive correlation between total anthocyanin content and total antioxidant content. In bulb of two red onion varieties, a strong correlation between total flavanol content and antioxidant activity was also observed but reported a poor correlation between total phenol and anthocyanin (Metrani et al., 2020).

Figure 8. Correlation of total antioxidant activity (TAC) of OPE of eight differentially pigmented onion varieties with (a) total anthocyanin content (TAC) and (b) total phenol content (TPC). Total antioxidant activity was determined through three methods, viz., FRAP (●); ABTS (▲); DPPH (♦).
4 Conclusion
Onion peels of red and dark red onions are very rich source of polyphenolic compounds having nutraceutical potential. Present study putatively identified 49 polyphenolic compounds from outer papery peel of eight distinctly pigmented onion varieties. Identified phenolic compounds comprised of 33 anthocyanin, 13 flavanol, 4 flavones, and 1 each of pyranoanthocyanin, chalcone, phenolic acid, and tannin. Anthocyanin was the most abundant compound followed by flavanol. Quercetin and its glycosides were the predominant flavanol, whereas cyanidin, delphinidin, and its glycosides were predominant anthocyanin. Acylated anthocyanin was predominant in dark red and red onion varieties. Cyanidin-3-(6-malonylglucoside), delphinidin, and delphinidin-3-galactoside were the predominant pigment in dark red var. BDR and BRJ, and its abundance suggests a key role in differential pigmentation pattern. Antioxidant activity showed strong association with total polyphenol content, whereas very low association was observed with total anthocyanin content. PCA and cluster analysis grouped red var. BSK with light red var. BKN and dark red var. BRJ with red var. BSR and BRD. This research suggests that utilizing onion peel extracts could enhance the development of functional foods and dietary supplements, promoting sustainability and health benefits. Furthermore, there is a need for quantitative profiling of nutraceutically important polyphenolics from peels of widely processed onion varieties and to develop efficient extraction process as well as associated product for harnessing wealth potential of this emerging bio-waste.
Data availability statement
The original contributions presented in the study are included in the article/Supplementary material, further inquiries can be directed to the corresponding authors.
Author contributions
KG: Conceptualization, Data curation, Formal analysis, Funding acquisition, Investigation, Methodology, Project administration, Resources, Supervision, Validation, Visualization, Writing – original draft, Writing – review & editing. AK: Data curation, Formal analysis, Methodology, Validation, Visualization, Writing – original draft, Writing – review & editing. TA: Data curation, Formal analysis, Methodology, Writing – original draft, Writing – review & editing. ZK: Formal analysis, Methodology, Writing – original draft, Writing – review & editing. PS: Formal analysis, Methodology, Writing – original draft, Writing – review & editing. SA: Data curation, Formal analysis, Visualization, Writing – original draft, Writing – review & editing. TA: Methodology, Resources, Visualization, Writing – original draft, Writing – review & editing. VY: Writing – original draft, Writing – review & editing. VM: Resources, Writing – original draft, Writing – review & editing. MS: Funding acquisition, Resources, Supervision, Writing – original draft, Writing – review & editing.
Funding
The author(s) declare that no financial support was received for the research, authorship, and/or publication of this article.
Acknowledgments
The authors are thankful to the Director ICAR-Directorate of Onion and Garlic Research, Pune, Maharashtra, India, for providing funds. The present study is a part of in-house project, Reference code “HORTDOGRSIL201800600086.” The authors further thank the support and help received from National Referral Laboratory, ICAR-National Research Centre for Grapes, Pune. We also gratefully acknowledge the editors and reviewers for their valuable suggestions and comments.
Conflict of interest
The authors declare that the research was conducted in the absence of any commercial or financial relationships that could be construed as a potential conflict of interest.
Publisher’s note
All claims expressed in this article are solely those of the authors and do not necessarily represent those of their affiliated organizations, or those of the publisher, the editors and the reviewers. Any product that may be evaluated in this article, or claim that may be made by its manufacturer, is not guaranteed or endorsed by the publisher.
Supplementary material
The Supplementary material for this article can be found online at: https://www.frontiersin.org/articles/10.3389/fsufs.2024.1469635/full#supplementary-material
SUPPLEMENTARY FIGURE 1 | Distribution of putatively identified anthocyanin compounds along the axis of principal component 1 (PC1) and principal component 2 (PC2) is shown in Supplementary File. Substituted and acylated anthocyanins are strongly correlated with PC1 and show very less variation, whereas it is well distributed along PC2.
References
Ahamad, S., Sagar, V. R., Asrey, R., Islam, S., Tomar, B. S., Vinod, B. R., et al. (2024). Nutritional retention and browning minimisation in dehydrated onion slices through potassium metabisulphite and sodium chloride pre-treatments. Int. J. Food Sci. Technol. 59, 5794–5805. doi: 10.1111/ijfs.17334
Albishi, T., John, J. A., Al-Khalifa, A. S., and Shahidi, F. (2013). Antioxidative phenolic constituents of skins of onion varieties and their activities. J. Funct. Foods 5, 1191–1203. doi: 10.1016/j.jff.2013.04.002
Ateeq, H., Shabir Ahmad, R., Imran, M., Afzaal, M., and Asif Shah, M. (2023). Valorization and structural characterization of onion peel powder for the development of functional bread. Int. J. Food Prop. 26, 2553–2562. doi: 10.1080/10942912.2023.2250573
Benzie, I. F., and Strain, J. J. (1999). Ferric reducing/antioxidant power assay: direct measure of total antioxidant activity of biological fluids and modified version for simultaneous measurement of total antioxidant power and ascorbic acid concentration. Methods Enzymol. 299, 15–27. doi: 10.1016/S0076-6879(99)99005-5
Bonaccorsi, P., Caristi, C., Gargiulli, C., and Leuzzi, U. (2005). Flavonol glucoside profile of southern Italian red onion (Allium cepa L.). J. Agric. Food Chem. 53, 2733–2740. doi: 10.1021/jf048152r
Bozinou, E., Pappas, I. S., Patergiannakis, I. S., Chatzimitakos, T., Palaiogiannis, D., Athanasiadis, V., et al. (2023). Evaluation of antioxidant, antimicrobial, and anticancer properties of onion skin extracts. Sustain. For. 15:11599. doi: 10.3390/su151511599
Chadorshabi, S., Hallaj-Nezhadi, S., and Ghasempour, Z. (2022). Red onion skin active ingredients, extraction and biological properties for functional food applications. Food Chem. 386:132737. doi: 10.1016/j.foodchem.2022.132737
D’Andrea, G. (2015). Quercetin: A flavonol with multifaceted therapeutic applications? Fitoterapia 106, 256–271. doi: 10.1016/j.fitote.2015.09.018
Donner, H., Gao, L., and Mazza, G. (1997). Separation and characterization of simple and malonylated anthocyanins in red onions, Allium cepa L. Food Res. Int. 30, 637–643. doi: 10.1016/S0963-9969(98)00011-8
Downes, K., Chope, G. A., and Terry, L. A. (2009). Effect of curing at different temperatures on biochemical composition of onion (Allium cepa L.) skin from three freshly cured and cold stored UK-grown onion cultivars. Postharvest Biol. Technol. 54, 80–86. doi: 10.1016/j.postharvbio.2009.05.005
Elattar, M. M., Darwish, R. S., Hammoda, H. M., and Dawood, H. M. (2024). An ethnopharmacological, phytochemical, and pharmacological overview of onion (Allium cepa L.). J. Ethnopharmacol. 324:117779. doi: 10.1016/j.jep.2024.117779
Fossen, T., and Andersen, Ø. M. (2003). Anthocyanins from red onion, Allium cepa, with novel aglycone. Phytochemistry 62, 1217–1220. doi: 10.1016/S0031-9422(02)00746-X
Fossen, T., Andersen, Ø. M., Øvstedal, D. O., Pedersen, A. T., and Raknes, Å. (1996). Characteristic anthocyanin pattern from onions and other Allium spp. J. Food Sci. 61, 703–706. doi: 10.1111/j.1365-2621.1996.tb12185.x
Fossen, T., Pedersen, A. T., and Andersen, Ø. M. (1998). Flavonoids from red onion (Allium cepa). Phytochemistry 47, 281–285. doi: 10.1016/S0031-9422(97)00423-8
Frond, A. D., Iuhas, C. I., Stirbu, I., Leopold, L., Socaci, S., Andreea, S., et al. (2019). Phytochemical characterization of five edible purple-reddish vegetables: anthocyanins, flavonoids, and phenolic acid derivatives. Molecules 24:1536. doi: 10.3390/molecules24081536
Galavi, A., Hosseinzadeh, H., and Razavi, B. M. (2021). The effects of Allium cepa L. (onion) and its active constituents on metabolic syndrome: a review. Iran. J. Basic Med. Sci. 24, 3–16. doi: 10.22038/ijbms.2020.46956.10843
Gorrepati, K., Murkute, A., and Gopal, J. (2014). Value added products from onion. Process. Food Ind., 16–18.
Hostetler, G. L., Ralston, R. A., and Schwartz, S. J. (2017). Flavones: food sources, bioavailability, metabolism, and bioactivity. Adv. Nutr. An Int. Rev. J. 8, 423–435. doi: 10.3945/an.116.012948
Jeong, C. H., Heo, H. J., Choi, S. G., and Shim, K. H. (2009). Antioxidant and anticancer properties of methanolic extracts from different parts of white, yellow, and red onion. Food Sci. Biotechnol. 18, 108–112.
Joković, N., Matejić, J., Zvezdanović, J., Stojanović-Radić, Z., Stanković, N., Mihajilov-Krstev, T., et al. (2024). Onion peel as a potential source of antioxidants and antimicrobial agents. Agronomy 14:453. doi: 10.3390/agronomy14030453
Jung, J. Y., Lim, Y., Moon, M. S., Kim, J. Y., and Kwon, O. (2011). Onion peel extracts ameliorate hyperglycemia and insulin resistance in high fat diet/streptozotocin-induced diabetic rats. Nutr. Metab. 8, 1–8. doi: 10.1186/1743-7075-8-18
Khandagale, K., and Gawande, S. (2019). Genetics of bulb colour variation and flavonoids in onion. J. Hortic. Sci. Biotechnol. 94, 522–532. doi: 10.1080/14620316.2018.1543558
Kim, J., Kim, J. S., and Park, E. (2013). Cytotoxic and anti-inflammatory effects of onion peel extract on lipopolysaccharide stimulated human colon carcinoma cells. Food Chem. Toxicol. 62, 199–204. doi: 10.1016/j.fct.2013.08.045
Kim, O. Y., Lee, S. M., Do, H., Moon, J., Lee, K. H., Cha, Y. J., et al. (2012). Influence of quercetin-rich onion peel extracts on adipokine expression in the visceral adipose tissue of rats. Phyther. Res. 26, 432–437. doi: 10.1002/ptr.3570
Kothari, D., Lee, W. D., and Kim, S. K. (2020). Allium flavonols: health benefits, molecular targets, and bioavailability. Antioxidants 9:888. doi: 10.3390/antiox9090888
Krithika, J. S., Sathiyasree, B., Theodore, B. E., and Chithiraikannu, R. (2020). Optimization of extraction parameters and stabilization of anthocyanin from onion peel. Crit. Rev. Food Sci. Nutr. 62, 2560–2567. doi: 10.1080/10408398.2020.1856772
Kumar, M., Barbhai, M. D., Hasan, M., Dhumal, S., Singh, S., Pandiselvam, R., et al. (2022). Onion (Allium cepa L.) peel: A review on the extraction of bioactive compounds, its antioxidant potential, and its application as a functional food ingredient. J. Food Sci. 87, 4289–4311. doi: 10.1111/1750-3841.16297
Kwak, J. H., Seo, J. M., Kim, N. H., Arasu, M. V., Kim, S., Yoon, M. K., et al. (2017). Variation of quercetin glycoside derivatives in three onion (Allium cepa L.) varieties. Saudi J. Biol. Sci. 24, 1387–1391. doi: 10.1016/j.sjbs.2016.05.014
Lee, J., Durst, R. W., and Wrolstad, R. E.Collaborators (2005). Determination of total monomeric anthocyanin pigment content of fruit juices, beverages, natural colorants, and wines by the pH differential method: collaborative study. J. AOAC Int. 88, 1269–1278. doi: 10.1093/jaoac/88.5.1269
Lee, J. H., Lee, S. J., Park, S., Jeong, S. W., Kim, C. Y., Jin, J. S., et al. (2012). Determination of flavonoid level variation in onion (Allium cepa L.) infected by Fusarium oxysporum using liquid chromatography–tandem mass spectrometry. Food Chem. 133, 1653–1657. doi: 10.1016/j.foodchem.2012.02.063
Lee, J., and Mitchell, A. E. (2011). Quercetin and isorhamnetin glycosides in onion (Allium cepa L.): varietal comparison, physical distribution, coproduct evaluation, and long-term storage stability. J. Agric. Food Chem. 59, 857–863. doi: 10.1021/jf1033587
Lee, S. M., Moon, J., Chung, J. H., Cha, Y. J., and Shin, M. J. (2013). Effect of quercetin-rich onion peel extracts on arterial thrombosis in rats. Food Chem. Toxicol. 57, 99–105. doi: 10.1016/j.fct.2013.03.008
Lee, E. J., Patil, B. S., and Yoo, K. S. (2015). Antioxidants of 15 onions with white, yellow, and red colors and their relationship with pungency, anthocyanin, and quercetin. LWT Food Sci. Technol. 63, 108–114. doi: 10.1016/j.lwt.2015.03.028
Lee, J., Rennaker, C., and Wrolstad, R. E. (2008). Correlation of two anthocyanin quantification methods: HPLC and spectrophotometric methods. Food Chem. 110, 782–786. doi: 10.1016/j.foodchem.2008.03.010
Ly, T. N., Hazama, C., Shimoyamada, M., Ando, H., Kato, K., and Yamauchi, R. (2005). Antioxidative compounds from the outer scales of onion. J. Agric. Food Chem. 53, 8183–8189. doi: 10.1021/jf051264d
Metrani, R., Singh, J., Acharya, P., K Jayaprakasha, G., and S Patil, B. (2020). Comparative metabolomics profiling of polyphenols, nutrients and antioxidant activities of two red onion (Allium cepa L.) cultivars. Plan. Theory 9:1077. doi: 10.3390/plants9091077
Michalak-Majewska, M., Teterycz, D., Muszyński, S., Radzki, W., and Sykut-Domańska, E. (2020). Influence of onion skin powder on nutritional and quality attributes of wheat pasta. PLoS One 15:e0227942. doi: 10.1371/journal.pone.0227942
Moon, J., Do, H. J., Kim, O. Y., and Shin, M. J. (2013). Antiobesity effects of quercetin-rich onion peel extract on the differentiation of 3T3-L1 preadipocytes and the adipogenesis in high fat-fed rats. Food Chem. Toxicol. 58, 347–354. doi: 10.1016/j.fct.2013.05.006
Moosazad, S., Ghajarbeigi, P., Mahmoudi, R., Shahsavari, S., Vahidi, R., and Soltani, A. (2019). Antibacterial and antioxidant properties of colorant extracted from red onion skin. J. Chem. Heal. Risks. 9, 235–243. doi: 10.22034/jchr.2019.668188
Olsson, M. E., Gustavsson, K. E., and Vagen, I. M. (2010). Quercetin and isorhamnetin in sweet and red cultivars of onion (Allium cepa L.) at harvest, after field curing, heat treatment, and storage. J. Agric. Food Chem. 58, 2323–2330. doi: 10.1021/jf9027014
Park, Y. K., and Lee, C. Y. (1996). Identification of isorhamnetin 4 ‘-glucoside in onions. J. Agric. Food Chem. 44, 34–36. doi: 10.1021/jf950310e
Patil, B. S., and Pike, L. M. (1995). Distribution of quercetin content in different rings of various coloured onion (Allium cepa L.) cultivars. J. Hortic. Sci. 70, 643–650. doi: 10.1080/14620316.1995.11515338
Petersson, E. V., Puerta, A., Bergquist, J., and Turner, C. (2008). Analysis of anthocyanins in red onion using capillary electrophoresis-time of flight-mass spectrometry. Electrophoresis 29, 2723–2730. doi: 10.1002/elps.200700692
Petrussa, E., Braidot, E., Zancani, M., Peresson, C., Bertolini, A., Patui, S., et al. (2013). Plant flavonoids—biosynthesis, transport and involvement in stress responses. Int. J. Mol. Sci. 14, 14950–14973. doi: 10.3390/ijms140714950
Piechowiak, T., Grzelak-Błaszczyk, K., Bonikowski, R., and Balawejder, M. (2020). Optimization of extraction process of antioxidant compounds from yellow onion skin and their use in functional bread production. LWT 117:108614. doi: 10.1016/j.lwt.2019.108614
Price, K. R., and Rhodes, M. J. C. (1997). Analysis of the major flavonol glycosides present in four varieties of onion (Allium cepa) and changes in composition resulting from autolysis. J. Sci. Food Agric. 74, 331–339. doi: 10.1002/(SICI)1097-0010(199707)74:3<331::AID-JSFA806>3.0.CO;2-C
Pucciarini, L., Ianni, F., Petesse, V., Pellati, F., Brighenti, V., Volpi, C., et al. (2019). Onion (Allium cepa L.) skin: a rich resource of biomolecules for the sustainable production of colored biofunctional textiles. Molecules 24:634. doi: 10.3390/molecules24030634
Pyrzynska, K., and Pękal, A. (2013). Application of free radical diphenylpicrylhydrazyl (DPPH) to estimate the antioxidant capacity of food samples. Anal. Methods 5, 4288–4295. doi: 10.1039/c3ay40367j
Re, R., Pellegrini, N., Proteggente, A., Pannala, A., Yang, M., and Rice-Evans, C. (1999). Antioxidant activity applying an improved ABTS radical cation decolorization assay. Free Radic. Biol. Med. 26, 1231–1237. doi: 10.1016/S0891-5849(98)00315-3
Rentzsch, M., Schwarz, M., and Winterhalter, P. (2007). Pyranoanthocyanins–an overview on structures, occurrence, and pathways of formation. Trends Food Sci. Technol. 18, 526–534. doi: 10.1016/j.tifs.2007.04.014
Rodrigues, A. S., Almeida, D. P., Simal-Gándara, J., and Pérez-Gregorio, M. R. (2017). Onions: a source of flavonoids. Flavonoids: from biosynthesis hum health. Intech 23:439. doi: 10.5772/intechopen.69896
Rodríguez Galdón, B., Rodríguez Rodríguez, E. M., and Díaz Romero, C. (2008). Flavonoids in onion cultivars (Allium cepa L.). J. Food Sci. 73, C599–C605. doi: 10.1111/j.1750-3841.2008.00903.x
Sagar, N. A., Khar, A., Vikas,, Tarafdar, A., and Pareek, S. (2021). Physicochemical and thermal characteristics of onion skin from fifteen Indian cultivars for possible food applications. J. Food Qual. 2021, 1–11. doi: 10.1155/2021/7178618
Sagar, N. A., Kumar, Y., Singh, R., Nickhil, C., Kumar, D., Sharma, P., et al. (2022). Onion waste based-biorefinery for sustainable generation of value-added products. Bioresour. Technol. 362:127870. doi: 10.1016/j.biortech.2022.127870
Sagar, N. A., and Pareek, S. (2020a). Antimicrobial assessment of polyphenolic extracts from onion (Allium cepa L.) skin of fifteen cultivars by sonication-assisted extraction method. Heliyon 6:e05478. doi: 10.1016/j.heliyon.2020.e05478
Sagar, N. A., and Pareek, S. (2020b). Dough rheology, antioxidants, textural, physicochemical characteristics, and sensory quality of pizza base enriched with onion (Allium cepa L.) skin powder. Sci. Rep. 10:18669. doi: 10.1038/s41598-020-75793-0
Sagar, N. A., Pareek, S., and Gonzalez-Aguilar, G. A. (2020). Quantification of flavonoids, total phenols and antioxidant properties of onion skin: a comparative study of fifteen Indian cultivars. J. Food Sci. Technol. 57, 2423–2432. doi: 10.1007/s13197-020-04277-w
Santos-Buelga, C., Mateus, N., and De Freitas, V. (2014). Anthocyanins. Plant pigments and beyond. J. Agric. Food Chem. 62, 6879–6884. doi: 10.1021/jf501950s
Schwinn, K. E., Ngo, H., Kenel, F., Brummell, D. A., Albert, N. W., McCallum, J. A., et al. (2016). The onion (Allium cepa L.) R2R3-MYB gene MYB1 regulates anthocyanin biosynthesis. Front. Plant Sci. 7:1865. doi: 10.3389/fpls.2016.01865
Sharma, K., Mahato, N., Nile, S. H., Lee, E. T., and Lee, Y. R. (2016). Economical and environmentally-friendly approaches for usage of onion (Allium cepa L.) waste. Food Funct. 7, 3354–3369. doi: 10.1039/c6fo00251j
Singh, B. N., Singh, B. R., Singh, R. L., Prakash, D., Singh, D. P., Sarma, B. K., et al. (2009). Polyphenolics from various extracts/fractions of red onion (Allium cepa) peel with potent antioxidant and antimutagenic activities. Food Chem. Toxicol. 47, 1161–1167. doi: 10.1016/j.fct.2009.02.004.19425188
Singleton, V. L., and Rossi, J. A. (1965). Colorimetry of total phenolics with phosphomolybdic-phosphotungstic acid reagents. Am. J. Enol. Vinic. 16, 144–158. doi: 10.5344/ajev.1965.16.3.144
Slimestad, R., Fossen, T., and Vågen, I. M. (2007). Onions: a source of unique dietary flavonoids. J. Agric. Food Chem. 55, 10067–10080. doi: 10.1021/jf0712503
Soininen, T. H., Jukarainen, N., Auriola, S. O., Julkunen-Tiitto, R., Karjalainen, R., and Vepsäläinen, J. J. (2014). Quantitative metabolite profiling of edible onion species by NMR and HPLC–MS. Food Chem. 165, 499–505. doi: 10.1016/j.foodchem.2014.05.132
Stoica, F., Constantin, O. E., Stănciuc, N., Aprodu, I., Bahrim, G. E., and Râpeanu, G. (2022). Optimization of the parameters influencing the antioxidant activity and concentration of anthocyanins extracted from red onion skins using a central composite design. Inventions 7:89. doi: 10.3390/inventions7040089
Suh, H. J., Lee, J. M., Cho, J. S., Kim, Y. S., and Chung, S. H. (1999). Radical scavenging compounds in onion skin. Food Res. Int. 32, 659–664. doi: 10.1016/S0963-9969(99)00141-6
Trigueros, E., Benito-Román, Ó., Oliveira, A. P., Videira, R. A., Andrade, P. B., Sanz, M. T., et al. (2024). Onion (Allium cepa L.) skin waste valorization: unveiling the phenolic profile and biological potential for the creation of bioactive agents through subcritical water extraction. Antioxidants 13:205. doi: 10.3390/antiox13020205
Vu, N. K., Kim, C. S., Ha, M. T., Ngo, Q. M. T., Park, S. E., Kwon, H., et al. (2020). Antioxidant and antidiabetic activities of flavonoid derivatives from the outer skins of Allium cepa L. J. Agric. Food Chem. 68, 8797–8811. doi: 10.1021/acs.jafc.0c02122
Yang, D., Dunshea, F. R., and Suleria, H. A. (2020). LC-ESI-QTOF/MS characterization of Australian herb and spices (garlic, ginger, and onion) and potential antioxidant activity. Food Process. Preserv. 44:e14497. doi: 10.1111/jfpp.14497
Keywords: antioxidant, anthocyanin, flavonoids, onion peel extract, quercetin
Citation: Gorrepati K, Kumar A, Ahammed Shabeer TP, Khan Z, Satpute P, Anandhan S, Arunachalam T, Yalamalle VR, Mahajan V and Singh M (2024) Characterization and evaluation of antioxidant potential of onion peel extract of eight differentially pigmented short-day onion (Allium cepa L.) varieties. Front. Sustain. Food Syst. 8:1469635. doi: 10.3389/fsufs.2024.1469635
Edited by:
Muzaffar Hasan, Central Institute of Agricultural Engineering (ICAR), IndiaReviewed by:
Stefanos G. Kostas, Aristotle University of Thessaloniki, GreeceSandrina A. Heleno, Polytechnic Institute of Bragança (IPB), Portugal
Copyright © 2024 Gorrepati, Kumar, Ahammed Shabeer, Khan, Satpute, Anandhan, Arunachalam, Yalamalle, Mahajan and Singh. This is an open-access article distributed under the terms of the Creative Commons Attribution License (CC BY). The use, distribution or reproduction in other forums is permitted, provided the original author(s) and the copyright owner(s) are credited and that the original publication in this journal is cited, in accordance with accepted academic practice. No use, distribution or reproduction is permitted which does not comply with these terms.
*Correspondence: Kalyani Gorrepati, a2FseWFuaWdvcnJlcGF0aUBnbWFpbC5jb20=; Ashok Kumar, YXNob2thbnVyYWpAZ21haWwuY29t
†These authors have contributed equally to this work
 Kalyani Gorrepati
 Ashok Kumar
 T. P. Ahammed Shabeer2
 Sivalingam Anandhan
 Thangasamy Arunachalam
 Vishwanath Rohidas Yalamalle
 Vijay Mahajan