 Rupinder Sahota1*
 Jaswant S. Khokhar2
 Aakash Deep3,4
 Katherine P. Adams3
 Arindam Das5
 E. Louise Ander2,6
 Edward J. M. Joy1,7*†
- 1Department of Population Health, London School of Hygiene & Tropical Medicine, London, United Kingdom
- 2School of Biosciences, University of Nottingham, Sutton Bonington, United Kingdom
- 3Department of Nutrition, Institute for Global Nutrition, University of California, Davis, Davis, CA, United States
- 4Independent Consultant for University of California, Davis, MAPS India, New Delhi, India
- 5Institute of Health Management Research, IIHMR University, Jaipur, India
- 6British Geological Survey, Keyworth, United Kingdom
- 7Rothamsted Research, Harpenden, United Kingdom
Stakeholders in decision-making roles require that data are available, accessible and useable to ensure evidence-informed design, implementation and evaluation of programs and policies to alleviate micronutrient deficiencies in India. This study determined the typical uses, data sources, priority and unmet needs, common challenges, and aspirations of key Indian food system stakeholders in relation to usage and interpretation of publicly available micronutrient data from health, nutrition, agriculture, and program domains. A qualitative, descriptive study was conducted, with purposive sampling of stakeholders from state and national-level government, development agencies, non-governmental organisations, research institutes, private organisations, and academia. Data were generated through focus group discussions and semi-structured key informant interviews. Themes and sub-themes were identified using framework analysis with a deductive approach. Stakeholders emphasized the pressing need for consolidated, harmonized district-level data from health, nutrition, and agriculture sources to better understand the causes and sources of variation in micronutrient deficiencies, and to inform decision-making on supplementation and fortification program planning, and policy evaluation. Biomarker data, nutrition dashboards and food consumption data were most used; data on food composition, program cost, and soil/crop micronutrient composition were not typically used, despite their relevance. A need for district-level data with further geographical and temporal (including seasonal) disaggregation, with improved accessibility was also identified. Current challenges include limited district-level data, outdated surveys, and data accessibility, while there is demand for customisable tools that integrate varied datasets, reflecting a shared vision for evidence-based decision-making and policy formulation.
Introduction
Micronutrient deficiencies (MNDs) remain a public health challenge in India towards attainment of the Sustainable Development Goal (SDG) 2 (Gonmei and Toteja, 2018; Kumssa et al., 2015; Muthayya et al., 2013; Akhtar et al., 2013; Pradyumna et al., 2021; Vijayaraghavan, 2002; Swaminathan et al., 2013). Typical Indian diets, based on grains and pulses, are high in phytates and low in meat, resulting in low bioavailability of micronutrients like iron, zinc, and vitamin A (Akhtar et al., 2011; Arlappa et al., 2011a; Arlappa, 2023; Menon et al., 2011). The negative health effects of MNDs also damage the country’s economy (Akhtar et al., 2013; Pathak et al., 2004; Laxmaiah et al., 2013; Kotecha, 2008). The MN status varies geographically (Laxmaiah et al., 2013; Chakraborty et al., 2018; Gupta et al., 2017; Kapil et al., 2017) and recent sub-national data on micronutrient biomarkers and dietary supplies indicate an unequal distribution of MNs based on location and for different demographic groups (Hemalatha et al., 2020). Variation in MN status may result from dietary patterns, crop quality as affected by soil and climate factors, agricultural practices and water, sanitation and health factors (Singh et al., 2009; Shukla et al., 2019; Shukla and Tiwari, 2014).
Thus, sub-national data, including from environment, agriculture, nutrition and health domains, may be used to ensure that policies and programs aimed at addressing MNDs are effective and equitable (Venkatesh et al., 2021). Furthermore, these decisions are not standalone and require coordination of many actors and actions across the food system (Herens et al., 2022; Pingali et al., 2019; Ramadas et al., 2020; Nair et al., 2016). Decisions made by stakeholders in government bodies, research institutions, healthcare, development agencies, non-governmental organisations and the private sector across nutrition, health and agriculture domains, ultimately shape the landscape of policies and programs related to MNDs and their alleviation (Pradyumna et al., 2021; Kadiyala et al., 2014; Van den Bold et al., 2015). The ability to work across sectors and domains is important, to ensure integrated decision-making for addressing public health nutrition challenges (Pradyumna et al., 2021; Brouwer et al., 2020; Ruben et al., 2019), including for example the influence of spatial, environmental and agricultural factors on nutrition outcomes (Belay et al., 2022; Vasu et al., 2017).
The Indian public sector has invested substantial resources in agriculture and nutrition surveys and data systems, including the Comprehensive National Nutrition Survey (CNNS), Household Consumption and Expenditure Survey (HCES), and the National Nutrition Monitoring Bureau (NNMB) urban and rural rounds (Rathi et al., 2018; Vavyahare and Deshmukh, 2018). However, it is not clear whether stakeholders’ needs are currently met in terms of their ability to effectively use these data to inform policy and program decisions aimed at alleviating micronutrient deficiencies. Despite limited research on micronutrient data use, previous studies in India and other countries have identified challenges related to data availability, access, integration, analysis, and decision-making, emphasizing the need for further efforts to understand how stakeholders at national and subnational levels access and utilize such data (Buckland et al., 2020). Understanding stakeholders’ data needs is crucial for ensuring that micronutrient (MN) data can be used effectively in program and policy design and to track the outcomes of MND alleviation programs, ultimately leading to improved MN status and progress towards achieving the SDGs (Brown et al., 2021).
The aim of this research is to explore the experiences, perspectives and needs of Indian food systems stakeholders in relation to the availability, accessibility and useability of data, information systems and dashboards pertaining to population micronutrient nutrition, including the challenges they currently face and the aspirations they hold. Geographic focus was determined by the scope of the funding to the Micronutrient Action Policy Support (MAPS) project, with focus at the national level and subnational levels in Bihar, Odisha, and Uttar Pradesh (UP). The study seeks to use this articulation of currently unmet needs to guide further investments in data generation and provisioning, to inform evidence-based food system policies and interventions to alleviate micronutrient deficiencies.
Materials and methods
Study design and setting
We conducted a descriptive qualitative study with stakeholders at the national level (based in offices in New Delhi and Hyderabad) and in three states of India: Uttar Pradesh, Bihar, and Odisha (Figure 1).
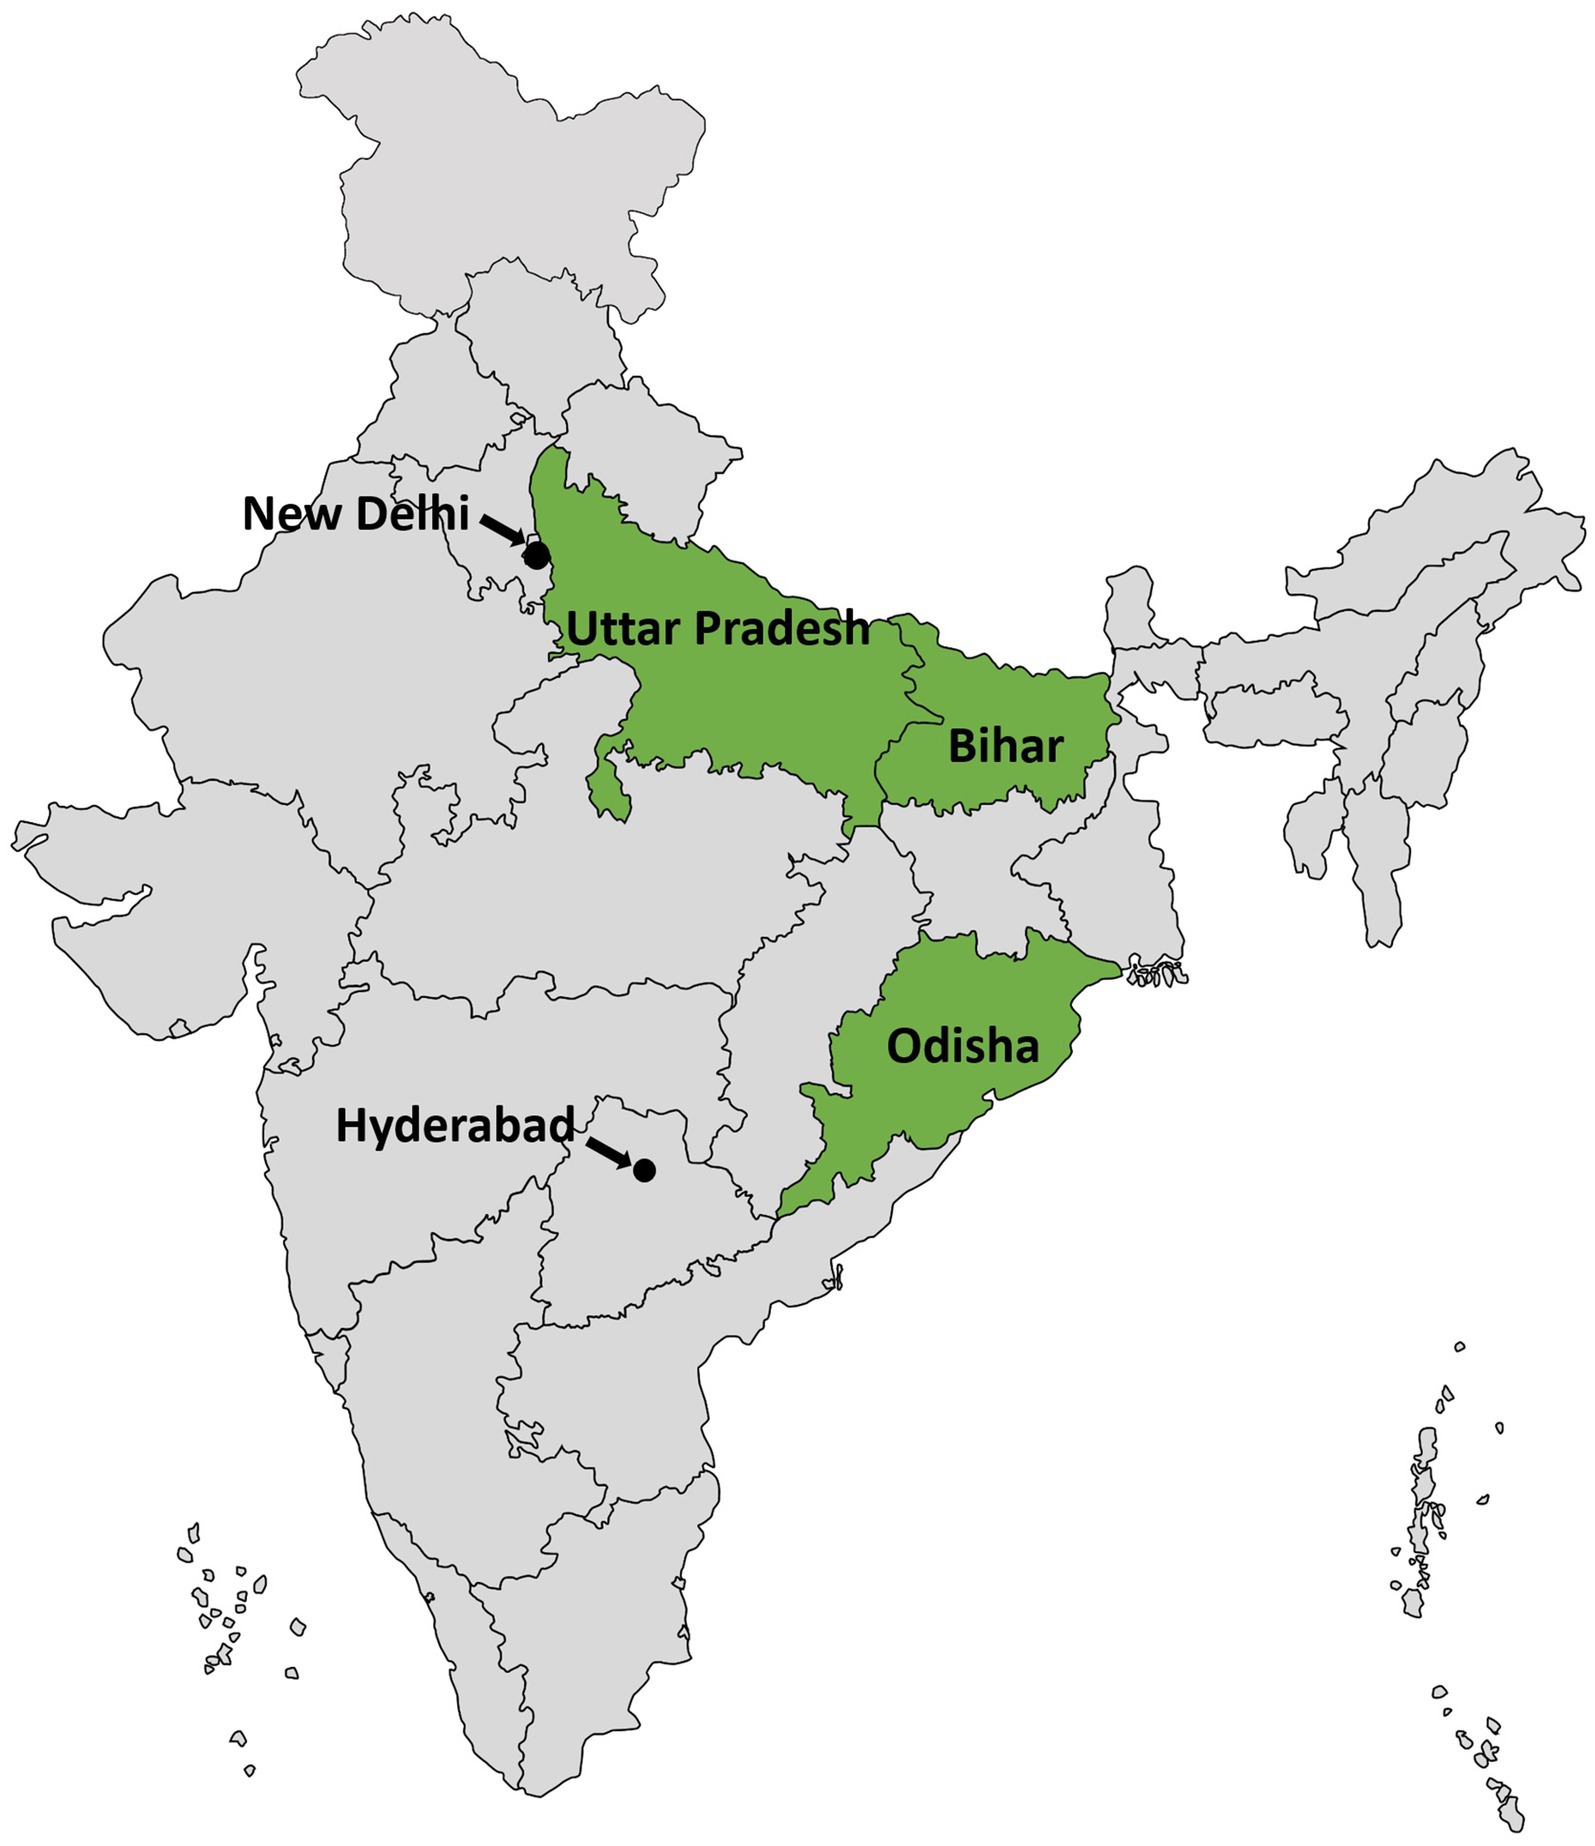
Figure 1. Study sites.
We utilized a deductive approach, based on a premise that greater use of evidence in micronutrient policy and program decisions would arise from improved access and useability of existing datasets from across environment, agriculture, nutrition, and health domains. Data and insights were generated through in-depth interviews (IDIs; n = 10) and focus group discussion (FGD; n = 12) conducted in June and July 2022. While an early version of the MAPS tool with limited functionality (html) was available at that time, this was not shared with the participants in advance of discussions in order not to influence their discussions and responses to our questions.
Study participants
The study participants comprised of stakeholders with decision making responsibilities or with involvement in research related to micronutrients in food systems at the national level in India and in the states of Uttar Pradesh, Bihar, and Odisha. We also included stakeholders working in policy formulation, strategic planning, macro implementation, and monitoring and evaluation of micronutrient/food system landscapes at national level or state headquarters. Stakeholders working exclusively in other states and those conducting micro-implementation at the field level were excluded. Stakeholders who were not willing or able to provide consent for participation in the research were also excluded.
Participants were purposively selected from government offices, International Non-Governmental Organisations (INGOs), development agencies, private organisations, academia/research organisations and donors. Appointment was taken in advance as per their availability and interviews were conducted at their workplace during working hours. FGD was conducted in New Delhi at a central location that maximised accessibility and convenience for the target participants.
Sampling
Purposive and snowball sampling was used to draw the sample across the study sites and to ensure that varied stakeholder perspectives were captured. For the FGD, the sample was drawn mostly from the national level and for the IDIs, participants from the national level along with the three states – Bihar, Odisha and Uttar Pradesh were selected. Participants were identified via existing professional networks of the researchers, and were approached during consultative meetings and via email, with a project information leaflet, alongside the invitation to participate and an information sheet about participation.
Sample size
The anticipated sample size for FGD was 5–6 participants, the sample size however increased to 12 with the inclusion of stakeholders of health, nutrition, agricultural and economics background. As the setting for the FGD was fairly large, in a relaxed environment and along with the FGD moderator there were two assistant moderators, 12 participants were a manageable number for the FGD. We met our anticipated sample of 9–11 participants for IDIs and interviewed 10 participants both at the national and the state level. The sampling framework is presented in Table 1.
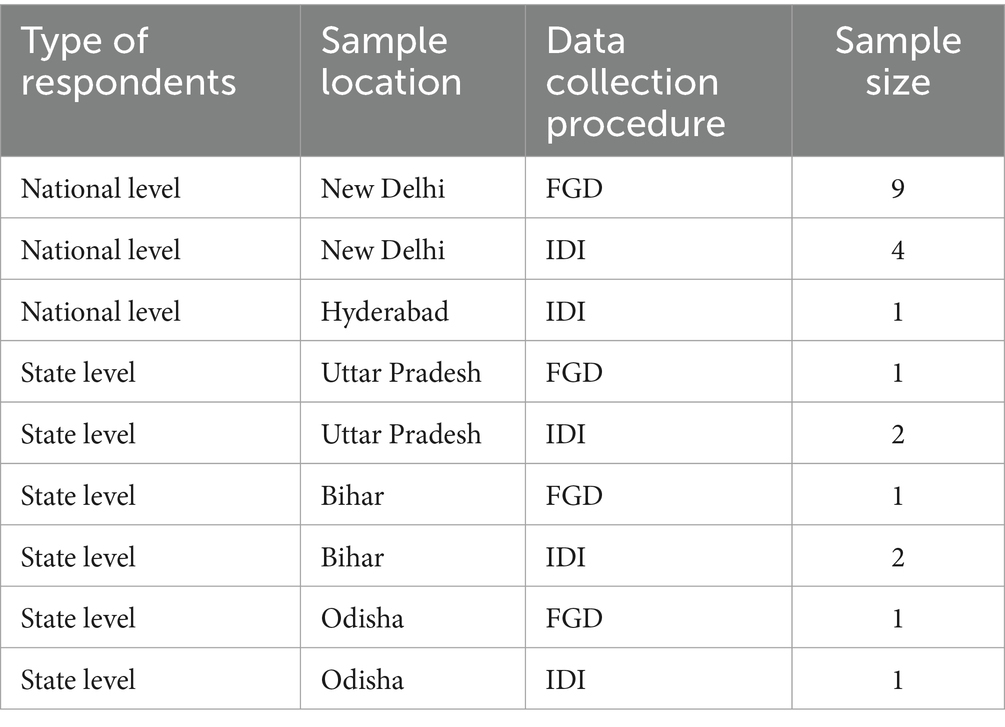
Table 1. Sampling framework.
Data collection procedure
In-depth interviews: An open-ended semi structured interview schedule (Supplementary material S1) was used to capture the required information, and face-to-face interviews were conducted by the research team. The interview schedule comprised of broad questions based on pre-selected themes which included role and use of MN data, MN data sources, unmet needs, requirements and aspirations. The interviews were recorded, and notes were taken.
Focus group discussions: An FGD guide (Supplementary material S2) was utilized to ensure that the discussion remained focused around the pre-selected themes. The guiding questions in the FGD guide were carefully derived from the IDI schedule to ensure alignment, enabling the FGDs to explore same themes in a collective context while capturing diverse viewpoints and group dynamics. This approach ensured consistency between the two methods while enriching the depth of our qualitative data. The guide comprised of introductory, guiding and concluding questions which were left open-ended to encourage rich discussion and a free flow of ideas. The first author moderated the FGD, with the support of the study researchers JK and AD. The discussions were recorded, and comprehensive notes were also taken during the session.
The pre-selected themes pertained to role of the stakeholder, use of micronutrient data regarding the need, frequency of use and relevance in decision making, the different data sources that were used, their usability, applicability, availability, accessibility, challenges, and issues. Questions about the unmet needs around the type of data sources required, the level of data, visualisations, interface were incorporated. Finally, the use of cost data, data for projections, forecasting and evaluations was included. The IDIs lasted for 45 min approximately and the FGD took 70 min. Data was collected from June to July 2022.
Data analysis
Word-by-word transcription of the IDIs and FGD was done by the first author by listening to recordings and consulting field notes, followed by familiarization with data by reading, re-reading the verbatim and carefully making notes. Deductive approach with framework analysis as the technique was adopted for analyzing the qualitative findings since the intent was to add relevant inputs to the specific objectives. Framework analysis is better adapted to research specific questions, a limited time frame, a pre-designed sample and a priori issues (Srivastava and Thomson, 2009). Microsoft Excel was employed as the primary tool for organizing and coding the data.
An explanatory framework based on the research question was developed in Microsoft Excel, followed by the identification of additional emerging themes (Clarke and Braun, 2017), concepts and issues which were exhaustive, relevant to research objectives, reflecting the purpose of study and broadly based on the schedule. The next step was the thematic coding. Codes are tags or labels used for assigning units of meaning (Miles and Huberman, 1994). This was followed by summarization and charting. The charted framework made it easier to compare data from various themes and individuals, enabling the discovery of trends and variances. Sub-themes were generated wherein grouping of similar codes was done which were broadly part of the identified themes. Further, data was mapped and interpreted to uncover connections between themes and sub-themes, and commonalities were recognized. Finally, quotes were identified and allocated to different themes. To ensure reliability, the data were independently analysed by study researcher J.K. This process confirmed that the findings accurately reflected participants experiences and were free from assumptions or bias (Creswell and Miller, 2000). The consolidated criteria for reporting qualitative research (COREQ) checklist guidelines were followed throughout (Tong et al., 2007) (Supplementary material S3).
Ethical considerations
Ethical approval was obtained from the Observational Research Ethics Committee, London School of Hygiene & Tropical Medicine (study reference: 27572 dated 27.06.2022) and from the Sigma Institutional Ethical Review Board, New Delhi, India (study reference: 10006/IRB/22-23 dated 22.06.2022). Participants were informed about the study and its objectives, the voluntary nature of participation, anonymity, privacy, withdrawal, and non-participation.
A study information sheet about the landscaping study and an introduction to MAPS (Supplementary material S4) was provided to participants and participants were invited to ask questions and clarifications. Written consent forms were not taken from the participants for this study, because several potential participants indicated that they were not allowed to sign any documents that linked to their work without the permission of their managers. The researchers felt that verbal informed consent was more appropriate, and this was discussed with and approved by the relevant ethics committees. A record of participants’ consent was maintained, including their details, the version of the information sheet provided, the date and time consent was obtained, and the identity of the person who obtained consent.
Results
One FGD and 10 IDIs were conducted, with a total of 22 participants largely comprising of government officials, private agencies, development agencies and INGO participants, and four academic/researcher participants. Following coding and analysis, six main themes and 19 sub-themes emerged (Figure 2).
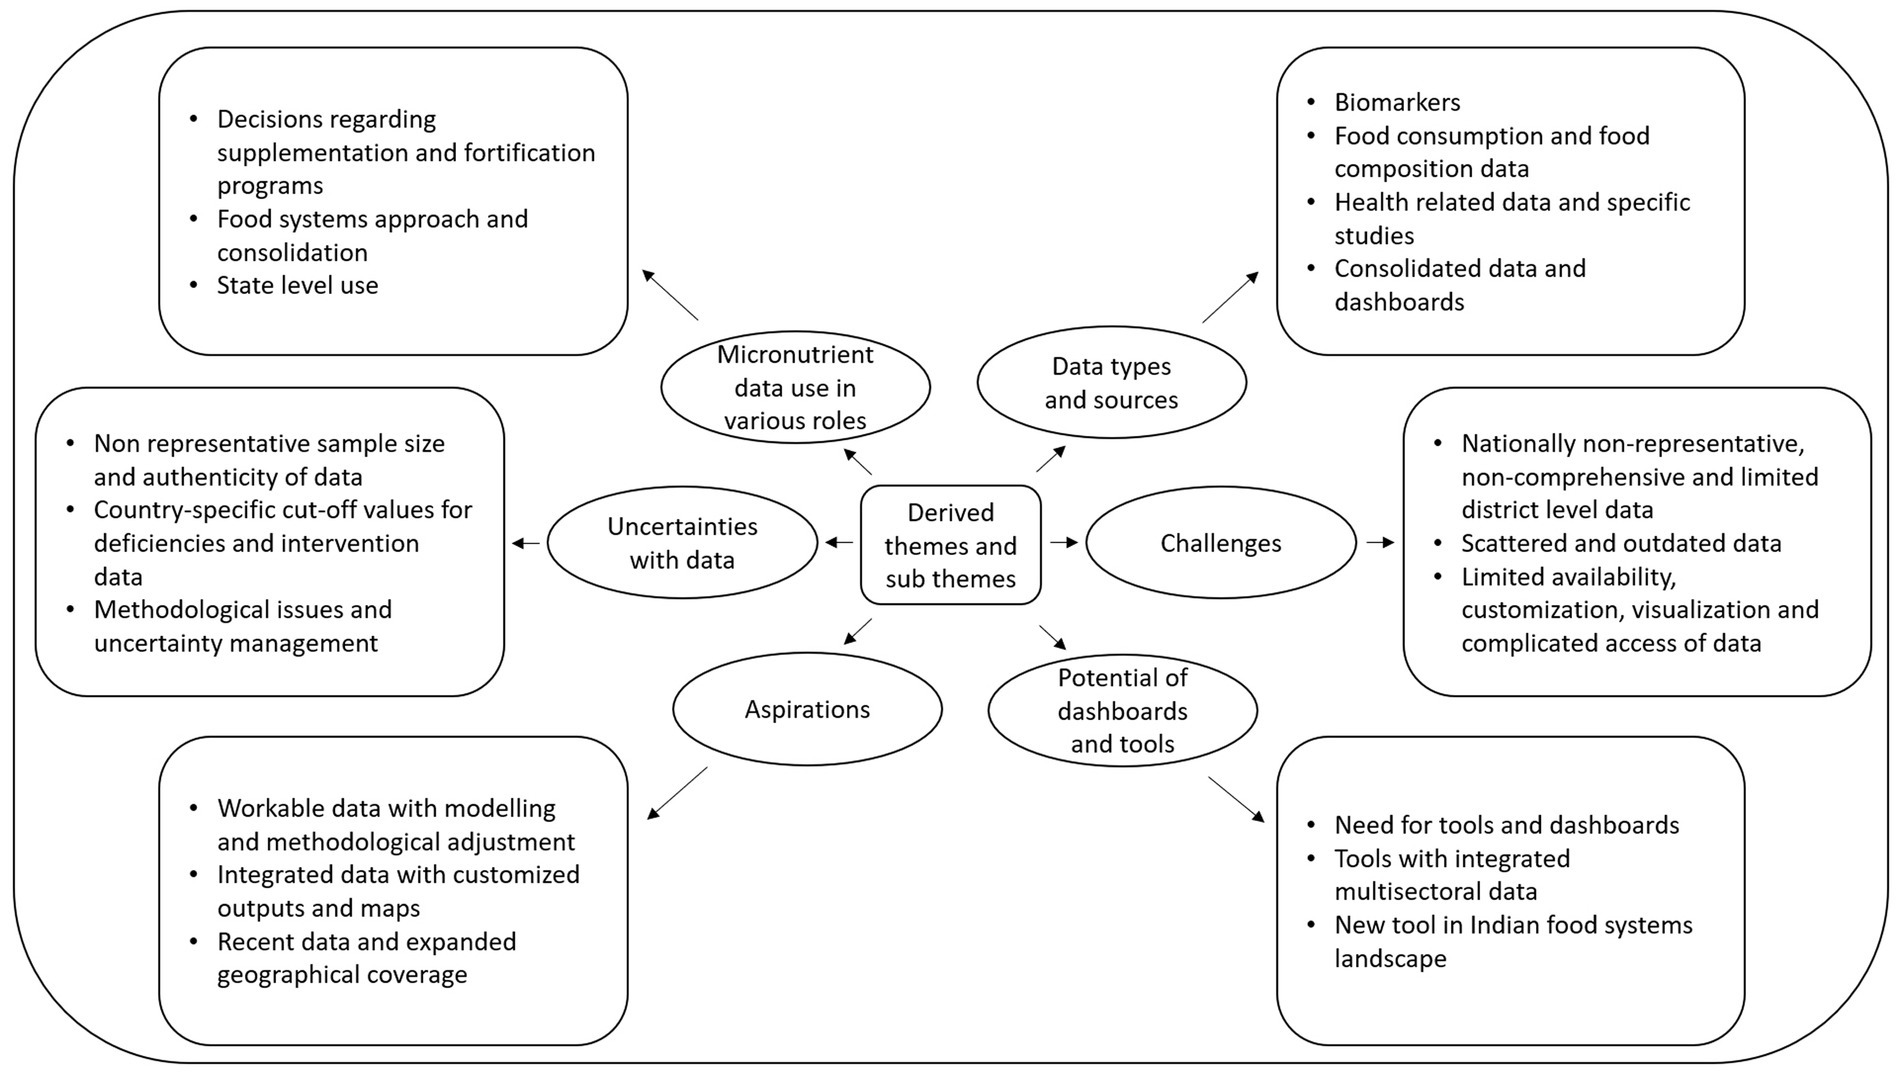
Figure 2. Derived themes (in ovals) and sub themes (in rectangles).
Theme 1. Micronutrient data use in various roles
Sub-theme 1.1. Decisions regarding supplementation and fortification programs
Diverse stakeholders within the Indian food systems landscape used micronutrient data in program and policy decisions for addressing malnutrition and MNDs. While acknowledging the significance of micronutrient data in their respective roles, these stakeholders had distinct perspectives and motivations for leveraging micronutrient data. A stakeholder who held a pivotal position in the Ministry of Health, Government of India, used it for implementing various micronutrient supplementation programs and assessing geographical differences in the prevalence of MNDs:
“One reason why we look at micronutrient deficiencies is to assess the initiation, continuation, or suspension of programs around iron-folic acid supplementation, zinc supplementation, vitamin A supplementation, vitamin D supplementation and more specifically to ascertain geographical variations” [IDI 3, Ex. Govt. official].
Development agency representatives working on fortification, used data for program evaluation, implementation, and developing technical papers/presentations on micronutrient deficiencies prevalence and food intake. A representative of the nodal research agency for nutrition stated that as a technical advisory body to the government of India they considered micronutrient data very crucial for policy, including formulation of the food basket and fortification.
“We have also recently submitted an analysis on adequacy and inadequacy of micronutrients, based on which the government will fix the fortificants, and will assess how much fortification is required. Additionally, we need to design a nutrition food basket for children and that we need to take into consideration micronutrient deficiency in that area and how much additional micronutrients we can put in that food basket so that it will bridge the Recommended Dietary Allowance gap” [IDI 4, Research and academia].
Sub-theme 1.2. Food systems approach, consolidation, and advocacy
A food systems approach was followed by stakeholders from INGOs and development agencies working at the national and state level. They tapped data for advocacy, planning, implementation and scaling up of nutrition programs:
“We work across programs catering to health and nutrition interventions. Across our programs, we use the food systems approach, work on food fortification, and therefore utilize a lot of micronutrient and population related data” [IDI 1, Development agency].
A representative from an NGO heading the nutrition department considered micronutrient data essential for informing and designing nutrition programs, especially amid challenges such as global food price inflation and disruptions in food supply chains due to COVID:
“Food in both macro and micronutrients are the core essential part of nutrition and health interventions. So, before we design our multisectoral programs, we need to look at the data and put that context in our mind before we recommend anything” [IDI 7, INGO participant].
Other experts of different government organisations, development agencies and INGOs stressed the importance of micronutrient data for guiding policy decisions:
“If we do not look at micronutrient data, we cannot do advocacy, the policy makers will say why strengthen micronutrient status when it is not having any health effects” [FGD 8, INGO participant].
A representative from a private consulting firm emphasized using data for advocacy, facilitating transition from food security to nutrition security:
“So, when we say nutrition security, we have to bring in the aspect of micronutrient deficiency, we have to sensitize them, we have to prime them [policy makers]. And how do we do that? We utilize the micronutrient data” [FGD 3, Private organisation].
Sub-theme 1.3. State level use
At the state level, the data was mainly used to address iron deficiency anaemia. Data was also explored to update policies related to Social Security Net Programs (SSNPs), state-specific supplementation programs, devise training programs for community health workers on diet diversity and diet promotion, make decisions about foods to include in complementary feeding, to improve coverage of interventions and to strengthen multisectoral strategies.
A state development agency representative asserted that micronutrient data was crucial for policy advocacy, which enabled district planning:
“Mostly all focus is on state level because we do not have the bandwidth or the funding support to do district level programming, but our focus heavily depends on the working with state machinery, doing evidence-based policy advocacy to have a system in place, hence we use existing micronutrient data” [IDI 2, Development agency].
Theme 2. Data types and sources
The different data sources used by stakeholders varied as per the purpose of data use. Many times, stakeholders used two data sources in parallel to answer a specific question. Details of the different data types and sources are provided in Table 2.
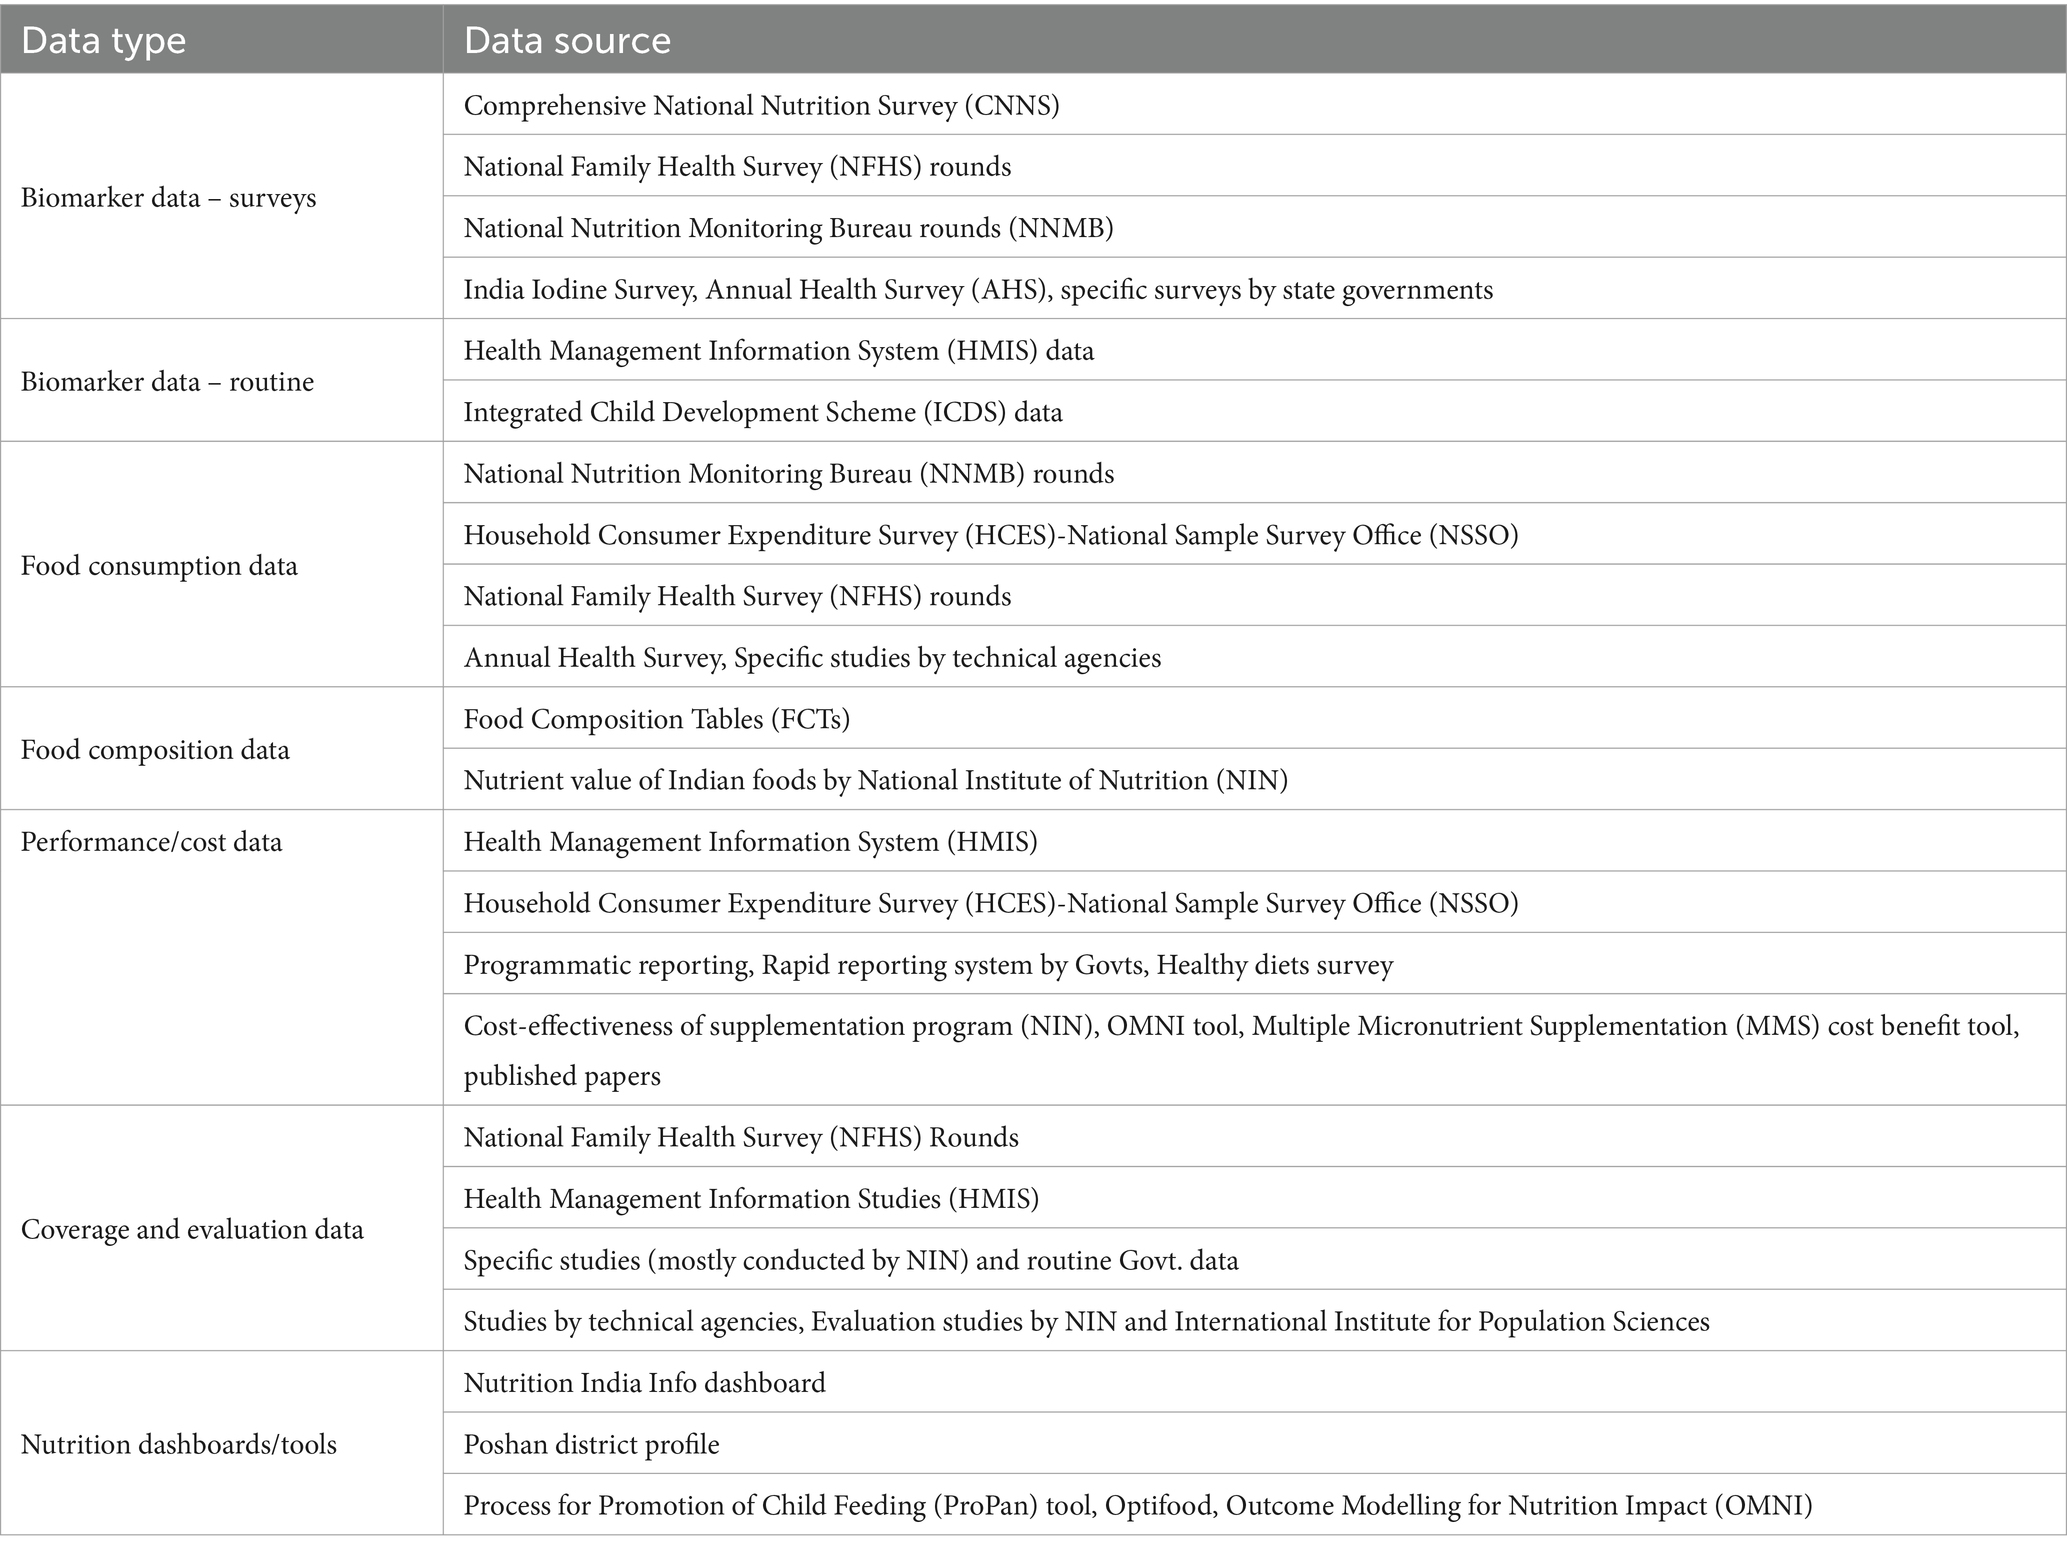
Table 2. Data types and sources used in Indian food systems.
Sub-theme 2.1. Biomarkers
The Comprehensive National Nutrition Survey (CNNS) was the primary data source for biomarkers of nutritional status. Other sources mentioned were the National Family Health Survey (NFHS) rounds and the Annual Health Survey (AHS). The CNNS was mainly used for in-depth micronutrient data.
“NFHS does not give much picture on the micronutrient deficiency part; for that I prefer looking at CNNS that has iron deficiency, ferritin, vit D, zinc, folate and B12 deficiency” [FGD 8, INGO participant].
Similarly, a development agency representative said:
“That’s a good data set to look at, more so because the data is available on other biomarkers not just limited to anaemia prevalence, you have serum vitamin B12, folic acid and serum retinol etc. So those are interesting data sets to look at” [FGD 8, INGO participant].
NFHS also had its own relevance and was especially used by development agencies working on fortification while communicating with government stakeholders.
“Rather than doing a baseline the Government said, ‘why do not you look at the NFHS 5 data for anaemia?’, because for them the most important indicator is anaemia, and they would want to show an impact on anaemia vis-a-vis fortified rice” [IDI 8, Development agency].
State level officials had high acceptance of NFHS data and their own collected data.
“We mostly look at iron data and prevalence of anaemia. We find NFHS to be useful, we also look at certain rapid surveys conducted by the department” [IDI 6, Govt. official].
Sub-theme 2.2. Food consumption and food composition data
There were two prominent sources of food consumption data: the diet and nutritional status surveys of the National Nutrition Monitoring Bureau (NNMB) conducted by the National Institute of Nutrition (NIN), Hyderabad, India, and the Household Consumption Expenditure Survey (HCES) by the National Sample Survey Office (NSSO). The relevance of NNMB was highlighted by a research body:
“NNMB only has the dietary data that has been collected on 24 h recall method and so is robust” [IDI 4, Research and academia].
However, the NSSO was also credited as giving a holistic view by a development agency representative:
“In terms of wanting to understand what’s the total consumption of a food item per month, the variation between rural/urban and the quantum of consumption—yes, we do use NSSO data. So, it’s basically to have a broader picture” [IDI 8, Development agency].
Food composition tables were also looked at mainly by the food standards agencies and nodal research agency for setting and revising standards, formulating food baskets, devising recipes of nutrition rich food.
“Yes definitely, only through FCT you will get the nutrient levels. Level of proteins, vitamins, minerals, proxy indicators of consumption for different age groups and different people” [FGD 6, Govt. official].
Sub-theme 2.3. Health related data and specific studies
There was a particular interest in looking at health-related data and routine health information systems while designing programs in food systems as was highlighted by a stakeholder from government and development agency:
“I also look at district level household survey, demographic and health survey to include health indicators as well” [FGD 12, Govt. official].
“Routine data—HMIS should be there for monitoring of nutrition programs, to see the coverage, how many people are working? Health data from health ministry from Department of Women and Child Department is available” [IDI 1, Development agency].
Many organisations were conducting their specific studies which were more in depth and tailored to their programmatic objectives. These pertained to studies on cost effectiveness, performance evaluations and projections. However, the organisations were not enthusiastic about continuously conducting these small-scale studies:
“We are not doing such blood biochemistry and blood biomarker testing anymore, because it involves ethical approval and lot of paraphernalia” [IDI 7, INGO participant].
Sub-theme 2.4. Consolidated data and dashboards
There was a significant interest in dashboards and tools as was expressed by a stakeholder at state level:
“Nutrition Info India by UNICEF and district profile by IFPRI are my two most sought-after sources. Poshan IFPRI, they have a state and district profile” [IDI 1, Development agency].
Another noteworthy finding was the consideration of intersectoral data alongside food, agriculture, and nutrition data:
“Along with NFHS data, some agriculture data from ministry, rainfall data is easily available on websites that we easily access” [FGD 1, Research and academia].
Theme 3. Challenges with existing data sources
Sub-theme 3.1. Nationally non-representative, non-comprehensive and limited district level data
Biomarker and food consumption data had restricted scope with limited disaggregation at the district and sub-district level and geographic coverage. The consequence of limited district level data was that it hampered evidence-based decisions.
“The challenge with CNNS data is that it has state level representation, scope should be expanded geographically to have more data at district and sub district level data” [IDI 10, Govt. official].
“I think when it comes to the advocacy or the utilization of data, the biggest challenge per se on daily basis is the level at which we want data in India, which is not present- at least till the district level” [FGD 10, INGO participant].
“Rounds of NNMB were only in 10 states, 16 urban cities. So, that is why it is not representative for the entire country” [IDI 5, Private organisation].
The coverage of a limited set of demographic groups, limited data elements and the absence of details emerged as a common challenge for many stakeholders while making policy decisions.
“CNNS data is circumstantial, it only covers a population from 1 year to teenagers. NFHS gives you data only on anaemia, and some data on intake of iron rich and vitamin A rich foods” [FGD 4, Research and academia].
“We usually refer to NFHS and it does mention what is the deficiency, but it does not specify which deficiency for example anaemia is there, but it does not specify which anaemia- aplastic anaemia, sickle cell anaemia or iron deficiency anaemia. So, what intervention we should take? Should we fortify with iron or other vitamins? And so that is the big challenge in front of us” [FGD 9, Govt. official].
Sub-theme 3.2. Scattered and outdated data
Scattered and outdated data was another challenge voiced by many stakeholders.
“With the difference in terrain of the country and the population size, we have data in silo or dated data” [FGD 2, Development agency].
As similar data elements were scattered in different surveys, stakeholders were often confused about which source should be used.
“I do not know if we should use CNNS or NFHS for anaemia prevalence and similarly whether to use NNMB or NNS data for dietary consumption” [IDI 7, INGO participant].
Outdated food consumption data also emerged as a challenge and was highlighted by many stakeholders.
“Food consumption data that we regularly use is the NNMB data, which was released way back in 2011–12, so it is fairly dated” [FGD 6, Govt. official].
“Dietary data is something that is grossly lacking but then NIN has taken it up so they have started the dietary surveys so they are in the process of completing it, so that should be out soon because there is decadal gap in that data as of now” [IDI 4, Research and academia].
Sub-theme 3.3. Limited availability, customization, visualization, and complicated access of data
The availability and access of the data was another concern raised by stakeholders, mostly related to the food consumption and food expenditure data. Additionally, considerable difficulty was faced while extracting and navigating through data.
“The data on nutrition and dietary intake from the National Institute of Nutrition are not available in the public domain” [IDI 1, Development agency].
“NSSO is the most difficult to use – not sure which is the latest NSSO report pertaining to nutrition” [IDI 9, INGO participant].
“There is a proper process of extracting NSSO data which a layman or even for the statistician for the first time it is a challenge to get the NSSO data in the analytical framework of what you want to do, there’s a lot of merging required” [FGD 6, Govt. official].
Some stakeholders were vocal about the availability of large quantities of unusable data and the non-availability of raw data, and the absence of customisations and visualisations.
“You really need to sift through tonnes of data to sort of get to what you want. Usable form is not easily available” [IDI 2, Development agency].
“We do not have raw data, we rely on reports, readymade reports which have been tailored by different agencies, these reports do not explain statistical methods and points of estimates in detail” [FGD 11, Govt. official].
The main difficulty that we face is that report is simply about the number, they will just provide you the table, there are no visualisations” [FGD 3, Private organisation].
Theme 4. Uncertainties with data
Sub-theme 4.1. Unrepresentative samples and authenticity of data
Sample selection and size were stated as a major reason of uncertainty by various stakeholders at national level, highlighting the issue of a small sample drawn for a fairly large state:
“I feel CNNS was a non-representative sample. Uncertainty does kick in when we have state specific data, and in some states the districts are as big as states” [FGD 8, INGO participant].
The uncertainty was also prevalent at the state level:
“CNNS report is useful however it is not very reliable as the sample size is very small and states are not very happy with it” [IDI 6, Govt. official].
Government officials questioned the authenticity of data and were particular about the format in which data was presented as was stated by a technical specialist:
“While you were nudging senior government officials to work towards a particular public health goal, it needs data. So, is the data authentic? What kind of data do we have? What kind of data we are presenting? That plays a very critical role” [FGD 3, Private organisation].
Sub-theme 4.2. Country-specific cut-off values for deficiencies and intervention data
Some technical experts were of the view that it is preferable to have cut-off values indicating deficiencies that are specific for the Indian context.
“Also, you know some expert groups say that it’s perhaps not the right cut offs used in assessing the deficiencies. Even in anaemia we need India based cut offs, we are calling ourselves an anaemic country for nothing. Our cut off should be low but people in tropical countries need to carry less oxygen so less Haemoglobin is enough” [IDI 3, Ex. govt. official].
FCTs presented a typical type of uncertainty as explained by a stakeholder of a public department:
“I feel uncertain with FCT, the latest one. For single food they have values for like ten varieties of maybe brinjals. While collecting food consumption data, which type of brinjal a respondent is consuming we do not know. In fact, the respondent also does not know that which variety is taken and there is wide variation in the varieties” [FGD 7, Govt. official].
Mostly data was used in a very limited capacity for projections of future nutrient availability and assessing performance of interventions. Those who used data projections were vocal about the associated uncertainties.
“I am wary about projections for subnational level, data extrapolation cannot be done as we need a lot of data points from different states, it’s not easy” [FGD 1, Research and academia].
“Clinical surveillance of micronutrient deficiencies is challenging due to non-specific clinical parameters and related data, and thus we do not know how our program has performed” [FGD 8, INGO participant].
Different times of data/sample collection for surveys led to the seasonality issue which was mentioned as another cause of uncertainty by a statistician working with the government.
“In terms of micronutrient data, the trends per se between the surveys is a very cumbersome job. What particular month, what particular state the data is collected it should match as well, otherwise seasonality will play a role” [IDI 9, INGO participant].
Sub-theme 4.3. Methodological issues and uncertainty management
Methodological differences in different surveys were clearly highlighted as a source of uncertainty which prevented comparability for similar data elements.
“Definitely the different data sources, the methodology used is different, the method for estimation is different. So, all these things we have to consider and have to fix some norms- exclusion norms, inclusion norms in data. We have to see what is available, analysable, and can be compiled” [FGD 4, Research and academia].
“We cannot simply see estimates of two surveys for an indicator and say this is right and this is wrong because methods at the backend are different” [FGD 10, INGO participant].
The lack of technical rigour in different surveys was a cause of concern.
“Most of the food consumption surveys do not use the 24 h recall factor, that is not the right method of measuring the micronutrient intake” [IDI 9, INGO participant].
Another cause of uncertainty was that some of the datasets were fairly old.
“Uncertainty in the data from a perspective that some of this data sets are dated long back but otherwise I really do not think there is any uncertainty in the data” [IDI 3, Ex. govt. official].
Addressing uncertainties was a daunting task expressed by stakeholders who were technical experts and had statistical backgrounds.
“There are uncertainties in data which require corrections, But the problem is corrections are very tedious things and then lot of assumption is required, lot of background data is needed which is not available” [FGD 6, Govt. agency].
“But then correction factor is not an easy and the right way, it’s just basically a consolation of what you are not able to achieve it” [FGD 10, INGO participant].
Theme 5. Aspirations
Sub-theme 5.1. Workable data with modelling and methodological adjustment
A consensus view from the FGD was:
“We need workable data!”
Food systems stakeholders in India had varied requirements from data which ranged from getting access to raw data to having analysed, merged and statistically corrected data depending on the role they played and their specific needs.
“In general, we have difficulty in seeing data, if it is in the form of analysed results and suggests interventions, it looks more certain and easier for use” [IDI 10, Govt. official].
“As a public stakeholder we want data in a processed and visual form so that we can take ready insights from it” [FGD 7, Govt. official].
“While revising standards we need raw data of biomarkers and FCTs, so there should be a portal where specific request can be shared with people who have collected the data and have the access to raw data and have the capacity to produce what is required by the policymakers” [FGD 9, Govt. official].
There was a requirement of modelling of data from different sources and need to see trends in specific locations.
“We should have modelling data of nutrition practices and food consumption pattern, mineral content of the soil. Trends should be seen in geographical area” [FGD 3, Private organisation].
Having a robust methodology was emphasized by development agencies and research institutes along with the need for projection data:
“We need a methodological adjustment which can be used further and not going back to the old version again with one biomarker study, so that we can compare the data and arrive at a decision” [IDI 1, Development agency].
“There should be one robust methodology, say for example NFHS is the largest sample size, it is a very methodical data set which is globally compatible” [FGD 4, Research and academia].
The need for data on future projections was explained as follows:
“I have still not really looked at projection data till now, but it would be really interesting to have a look at projection data, then you can plan your programs” [IDI 5, Private organisation].
Sub-theme 5.2. Integrated data with customised outputs and maps
Integrated data from different sectors and sources emerged out as a major need of many stakeholders both at the state and national level. This included agriculture, nutrition, health with collation of data sources and layering.
“We would be happy to have more holistic data, linking different data sets from different departments and from different ecosystems is very important for us” [IDI 6, Govt. official].
“To combat micronutrient deficiencies requires varied types of interventions, one of them is about multisectoral agriculture interventions, look at behaviour change communication, look at fortification, supplementations, we need all these data sets together” [FGD 1, Research and academia].
“Then of course comes the regional soil surfaces, that what sort of soil is there?” [FGD 2, Development agency].
“Data should comprehensively assist in addressing issues, for example—for anaemia there should be provision of looking at blood biomarkers, food consumption habits and agriculture data simultaneously to get the real picture” [IDI 3, Ex. Govt. official].
“Micronutrient data is very critical from both agricultural/soil perspective and from human health perspective, we have been at the interface of it and it’s very critical to have right kind of data at right point in time, which is you know at healthy disposal of different stakeholders” [FGD 10, INGO participant].
Customised, user-friendly data outputs, visualisations and maps were desired by almost all the stakeholders.
“So, there should be some forum where a request can be made- this level of data is required, in this format and in this visualization and at the backend this can be provided” [FGD 6, Govt. official].
“How best you can present the data in a user-friendly way has merit all the time” [IDI 8, Development agency].
Requirement of geographical maps was expressed by a development agency representative.
“All the data that makes sense from a micronutrient anaemia deficiency perspective could be at one place, so a map of India showing all the districts and then showing the data sets if available for that district, so basically a kind of a map which can show data disaggregated till the sub-district level” [FGD 10, INGO participant].
A stakeholder concluded the conversation as follows:
“At the end of the day the consumer, people like us they should not be fatigued by data and information and should not be confused” [IDI 8, Development agency].
Sub-theme 5.3. Recent data and expanded geographical coverage
Stakeholders aspired to see expanded data with inclusion of more geographies which would be representative of different scales.
“You must have factual data of different geographical regions to make your representation” [IDI 10, Govt. official].
“For MNDs, we cannot find a single source, we need to rely on smaller studies – needing data for national and subnational scales” [FGD 5, Research and academia].
Recent data for food consumption was an explicit need along with requirement of real time data and shorter gaps between concurrent micronutrient and food consumption surveys.
“A lot of the data that we have now in terms of food intake is very dated so that’s an area we hope would be addressed soon by the government” [IDI 2, Development agency].
“Real time data is required for proper implementation of programs” [IDI 6, Govt. official].
“There should be less gaps between concurrent micronutrient and food consumption surveys” [IDI 5, Private organisation].
Theme 6. Potential of dashboards and tools
There were various types of tools used by the stakeholders. These included tools like Optima Nutrition Learning Tool was used by government for budget allocation across nutrition programs and had a geospatial component added to it (Orientation-Workshop-on-OPTIMA-Nutrition, 2019; Scott et al., 2020). Tools and dashboards like Optifood, Farmers’ Portal, Soil fertility maps, Nutrition Atlas, Nutrition India Info, ProPAN and POSHAN dashboard were also used by stakeholders at the state level (Houghton et al., 2020; Monterrosa et al., 2020; Gandhi and Johnson, 2018; Joshi et al., 2021; Mendu et al., 2019; Purakayastha et al., 2019; Daelmans et al., 2013).
Sub-theme 6.1. Need for tools and dashboards
Explicit need was noted for tools and dashboards at the state and national level with both compiled and analysed data and raw workable data for specific needs.
“Basically, we need a ready tool which would save our time as at the state level we do not do extensive data analysis but look at ready analysis and interpretation” [IDI 6, Govt. official].
“We do not have raw data, we rely on reports, readymade reports which have been tailored by different agencies, we want workable data” [FGD 6, Govt. official].
Interestingly, performance of interventions was assessed through tools available for use.
“I find tools useful, sometimes I have used impact and cost tools like the Lives Saved Tool, OMNI and Multiple Micronutrient Supplementation cost–benefit tool for assessing the performance of interventions” [IDI 9, INGO participant].
Extensive cost data, effectiveness modelling, and projections were lacking, and hence many stakeholders mentioned that they were looking for cost data in future dashboards:
“Economic data is crucial for decision-making, especially in the absence of clear health outcomes. We sometimes have cost-effectiveness analysis and cost–benefit analysis, but we wish we had some tool where we could have analysed specific costs related to nutrition interventions” [IDI 1, Development agency].
Sub-theme 6.2. Tools with integrated multisectoral data
Stakeholders expressed incorporation of layered data – especially intersectoral data – in a dashboard so that there is one-shop stop for all kinds of food systems data.
“A comprehensive dashboard is required which should have both nutrition sensitive and specific data and should have centralised monitoring. Data should come from ICDS, education, agriculture, public health department, food supply department and rural development dept” [IDI 6, Govt. official].
“We require both type of datasets together, a dashboard with NFHS /CNNS data as well as data for some interventions like biofortified varieties and some horticulture crops in particular regions,” “If a tool could have agricultural perspective, then probably we have more realistic data” [FGD 5, Research and academia].
Sub-theme 6.3. Potential of new tool in Indian food systems landscape
Conditions were raised about adding a new tool to the scenario like ensuring the existing dashboards were analysed.
“First review what all different data dashboards are already available and then do a proper gap analysis of those sources and those platforms and then if you come up with your idea that how best you can complement or add different nuances to it, it will be good” [IDI 8, Development agency].
Despite having many dashboards and tools, stakeholders were still keen on a dashboard/tool which could address the challenges, fulfil their specific needs and be inclusive.
“Irrespective of there are dashboards, multi data sources available, you can always innovate that space and you can make it more meaningful and helpful for the community” [IDI 7, INGO participant].
“I would be happy to see granular data, but in our current scheme of things as a consulting firm, we would be happy to have a more holistic data” [FGD 3, Private organisation].
Discussion
Primary findings
Data availability
Indian food system stakeholders reported the availability of scattered micronutrient data present in different surveys and information systems pertaining to biomarkers, food consumption and food expenditure, and food composition tables. While certain stakeholders perceived a paucity of data, others contended that the existing data was deemed sufficient for making informed decisions. Although large scale population-based surveys existed yet there was paucity of specific micronutrient indicators and data elements to address MNDs. Nationally representative data was available, however a comprehensive consolidation of district-level trends for micronutrient data remains lacking. Concerns regarding the geographical and demographic coverage of surveys was prevalent especially with biomarker, dietary consumption and expenditure surveys. We also observed limited availability of cost data and predominantly available in a non-disaggregated form.
Data accessibility
Large scale population-based surveys were available in the public domain and hence were accessible. Specific micronutrient data sources exist in silos resulting in parallel operation of family health and nutrition surveys alongside surveys related to agriculture, income, and consumption, each facilitated by different national entities and intergovernmental organisations leading to limited exchange and sharing of raw data. A challenge to integrate these data to get holistic perspectives existed, e.g., importance of soil fertility and nutrient availability as an underlying cause of malnutrition. Data sets pertaining to dietary consumption and expenditure had complicated access especially with metadata and there was confusion regarding the latest versions. Clear demand for data visualisations and customisation existed calling for accessibility of raw data.
Data useability
Micronutrient data is used for varied purposes ranging for making informed decisions on supplementation, fortification, scaling up programs, formulating food standards and dietary guidelines to technical support, advocacy, and policy decisions. While numerous nationwide surveys exist, such as NFHS, NSSO, CNNS, NNMB, and District Level Household and Facility Survey (DLHS), and data are available to assess and estimate nutritional/micronutrient status across different regions of India, stakeholders face challenges in utilizing these data due to lack of capacity to conduct data processing steps including statistical corrections and adjustments based on sampling and methodology. There was a demand for open-access, transparent guidance on data processing—e.g., annotated R scripts and option to include their own data to the existing analysis. This could reduce barriers to data use and unnecessary duplication of effort. Stakeholders also identified that different study designs and diverse analyses across studies leads to challenges in comparability, such as variations in anaemia. The presence of outdated data is a notable concern leading to limited use of dietary consumption and expenditure data and hence stakeholders relying on specific studies. The utilization of various existing data dashboards within the food systems landscape in India, showcased the potential of layering different data sources from various sectors within a single tool.
Comparison with previous studies
Our study reports perspectives of Indian food systems stakeholders working to identify and alleviate micronutrient deficiencies, regarding the types of data they use, the purposes of their use, challenges they face, and aspirations regarding future data uses. Our study has revealed crucial aspects, such as the availability of micronutrient data within the Indian context. We highlight the availability of large scale surveys, yet there is still a need for specific micronutrient data to address MNDs as identified in previous studies (Venkatesh et al., 2021; Buckland et al., 2020). Our findings align with prior research and a systematic review on micronutrient deficiency in India, highlighting the fragmented nature of data across various surveys and the limited efforts to consolidate it, particularly at the district level (Gonmei and Toteja, 2018; Hemalatha et al., 2020; Venkatesh et al., 2021).
Consistent with global and south Asian studies, the increasing quantity of relevant household data and metrics remain siloed by sector posing challenges in integrating datasets across domains, particularly in the context of agriculture-nutrition, restricting opportunities for collaboration and learning (Van den Bold et al., 2015; Pingali and Ricketts, 2014). We highlighted the significance of coordinating and sharing data among different sectors and states, a theme consistently emphasized in previous studies (Herens et al., 2022; Ruben et al., 2019). Our findings reinforce the value of data ecosystems that enable micronutrient status to be explored in a food systems context (Herens et al., 2022) and highlights the interconnectedness of micronutrients, agriculture, nutrition, and health, aligning with assertions made by other authors who explicitly discuss these linkages and emphasize that alterations in agriculture and crop production systems impact micronutrient malnutrition (Pingali et al., 2019; Ramadas et al., 2020; Jatav et al., 2020; Welch and Welch, 2001).
Our study is consistent with the observation that nationally representative micronutrient data is currently inadequate to meet the various demands of stakeholders working to address micronutrient deficiencies at state or district level (Pathak et al., 2004; Chakraborty et al., 2018; Kapil et al., 2017; Arlappa et al., 2011b). We identified the significance of district-level data, a need emphasized under the National Nutrition Mission, acknowledging the importance of district-level actions (Hemalatha et al., 2020). We agree that a geospatial approach is valuable for accessing sub-district level data, as demonstrated in previous studies (Hemalatha et al., 2020; Bora, 2022), but also assert that customised outputs, such as maps, are essential. Limited capacity to conduct data processing, statistical adjustments and corrections, and the absence of appropriate sampling methods and sample size emerged as one of the main challenges raised by stakeholders and aligns with previous findings (Swaminathan et al., 2013; Venkatesh et al., 2021; Meenakshi and Ray, 1999). Findings revealed that multiple surveys using diverse sampling methods make it challenging to assess the burden and causes of micronutrient deficiencies (MNDs), consistent with previous research on child malnutrition in India. Furthermore, integrating data sets from these surveys is not straightforward due to differences in sampling design, sample size criteria, and non-sampling errors (Meenakshi and Ray, 1999).
Policy relevance
Improvements to the data ecosystem could support greater use of data for informed policy and program decisions for alleviating MNDs, among a wide range of data users. This is likely to lead to more effective use of resources. Availability of data that are representative at national level and sub-national levels, stratified by subpopulations, would support efforts to evaluate current strategies and prioritize areas for future interventions, including to develop more robust and age-appropriate recommendations (Venkatesh et al., 2021; Tang et al., 2022). Enhancements to the data ecosystem including ensuring inter-operability would enable data mining and modelling approaches, which can support the generation of evidence-based, targeted recommendations and guide interventions (Joshi et al., 2021; Sendhil et al., 2020). The call for evidence at different levels is reiterated, recognizing that, despite district-level data being available in NFHS and HCES, ensuring comparability between surveys remains a challenge (Kurian, 2016). Comprehensive data on costs of interventions and programs is widely unavailable in the public domain and is a pressing need of food system stakeholders (Kapur and Shukla, 2021).
Addressing MNDs is an important challenge as India seeks to achieve nutrition security (Sendhil et al., 2020). The national data landscape contains information from agriculture, food system and nutrition domains from a wide variety of sources – including multiple national surveys, state surveys, program monitoring and evaluation, and health system data (Pingali et al., 2019). Additionally, there have been initiatives to consolidate data through systematic reviews, aiming to extract conclusions and evidence to inform future actions and policy support (Alae-Carew et al., 2019). Tools like the government-led “Nutrition Atlas” draw on multiple nutrition datasets and offer visualization capabilities, including mapping and plotting of pertinent public health nutrition statistics in India (Mendu et al., 2019). There is, however, a need for integration of data from across sectors to support well-informed and joined-up policy making. Platforms are required that allow users to bring their own data, and enable users to interact with these data for designing and evaluating various intervention strategies with regard to their costs and effectiveness. Such efforts may be supported via India’s National Data Governance Policy, which is due to be launched soon (National Data Governance Framework Policy, 2022). The policy includes the creation of a national Data Management Office who will coordinate data management strategies and practices across government, including through data quality and metadata standards, dataset access platforms, and capacity development initiatives to enhance data literacy and skills among government officials. There are clear opportunities here to ensure that data related to micronutrients in agriculture, food systems and nutrition are inter-operable, including through adoption of standardised metadata schema such as AgMES and use of ontologies such as the Compositional Dietary Nutrition Ontology (CDNO), the Environment Ontology and the Food On Ontology (Andrés-Hernández et al., 2022; Agricultural Metadata Element Set (AgMES), 2010; Buttigieg et al., 2016; Dooley et al., 2018). Widespread use of such practices could enable data integration and seamless queries by an Application Programming Interface, supporting efforts to model and display data from multiple domains and sources.
Strengths and limitations
A strength of the study is the inclusion of stakeholders from a variety of sectors of the Indian food system, including those working at various administrative levels. The study captured varied voices and the qualitative approach generated a deep understanding of their challenges, aspirations and unmet needs with regards to using data to inform decisions to alleviate micronutrient deficiencies. Although we did have multiple participants from the national level, yet a limitation of the study is the limited geographic coverage of the sample of state-level policy and program roles, whereby we focused on three states. Future studies could explore a wider set of states across the country and/or include participants with district-level roles.
Conclusion
In India, multiple datasets across agriculture, food system and nutrition domains could be used to inform strategies to tackle micronutrient deficiencies. However, inherent challenges impede their effective use for policy and program stakeholders, including issues such as lack of common data and metadata standards, issues with study and survey design, outdated data, and lack of data platforms that support users to bring their own data, customise data, and visualise data.
There is a pressing need for integrated, layered, and consolidated data from diverse sources and sectors which is cleaned, corrected, adjusted and available, including at the district level. This comprehensive data would be instrumental for advocacy, planning, program implementation, technical support, and policy formulation to address micronutrient deficiencies. With the availability of large-scale datasets related to micronutrient biomarkers, food consumption, composition, expenditure, and agricultural production and management, there is significant potential in the Indian food systems for utilizing these to guide informed decisions for micronutrient programs and policies. Additional investments to enhance the availability, accessibility, and usability of these datasets would likely support more evidence-based decision-making incorporating agriculture-nutrition data, projections of nutrient availability and cost, effectiveness and cost-effectiveness modelling.
Data availability statement
The raw data supporting the conclusions of this article will be made available by the authors, without undue reservation.
Ethics statement
The studies involving humans were approved by Observational Research Ethics Committee, London School of Hygiene & Tropical Medicine (study reference: 27572 dated 27.06.2022) Sigma Institutional Ethical Review Board, New Delhi, India (study reference: 10006/IRB/22-23 dated 22.06.2022). The studies were conducted in accordance with the local legislation and institutional requirements. The Ethics Committee/Institutional Review Board waived the requirement of written informed consent for participation from the participants because this is a qualitative study investigating professional opinions. Written consent forms were not taken from the participant for this study, because several potential participants indicated that they were not allowed to sign any documents that linked to their work without the permission of their managers. The researchers felt that verbal informed consent was more appropriate, and this was discussed with and approved by the relevant ethics committees. A record of participants’ consent was maintained.
Author contributions
RS: Conceptualization, Data curation, Formal analysis, Investigation, Methodology, Visualization, Writing – original draft, Writing – review & editing, Software. JSK: Data curation, Formal analysis, Investigation, Validation, Writing – review & editing. AaD: Data curation, Validation, Writing – review & editing. KPA: Project administration, Resources, Supervision, Validation, Writing – review & editing. ArD: Methodology, Validation, Writing – review & editing, Investigation. ELA: Conceptualization, Funding acquisition, Methodology, Project administration, Resources, Supervision, Validation, Writing – review & editing. EJMJ: Conceptualization, Methodology, Project administration, Resources, Supervision, Validation, Visualization, Writing – review & editing, Investigation.
Funding
The author(s) declare that financial support was received for the research, authorship, and/or publication of this article. This work was supported, in whole by the Bill & Melinda Gates Foundation [INV-002855]. Under the grant conditions of the Foundation, a Creative Commons Attribution 4.0 Generic License has already been assigned to the Author Accepted Manuscript version that might arise from this submission. Rothamsted Research receives strategic funding from the Biotechnology and Biological Sciences Research Council of the United Kingdom (BBSRC). We acknowledge support from the Growing Health Institute Strategic Program [BB/X010953/1; BBS/E/RH/230003C].
Acknowledgments
We acknowledge contributions from Martin R. Broadley, Rothamsted Research, in project funding acquisition and developing project and study objectives. We acknowledge the efforts and contributions of all the study participants.
Conflict of interest
The authors declare that the research was conducted in the absence of any commercial or financial relationships that could be construed as a potential conflict of interest.
Publisher’s note
All claims expressed in this article are solely those of the authors and do not necessarily represent those of their affiliated organizations, or those of the publisher, the editors and the reviewers. Any product that may be evaluated in this article, or claim that may be made by its manufacturer, is not guaranteed or endorsed by the publisher.
Supplementary material
The Supplementary material for this article can be found online at: https://www.frontiersin.org/articles/10.3389/fsufs.2024.1469126/full#supplementary-material
Data sheet 1 | Supplementary Material 1 Interview Schedule.
Data sheet 2 | Supplementary Material 2 FGD Guide.
Data sheet 3 | Supplementary Material 3 COREQ checklist.
Data sheet 4 | Supplementary Material 4 MAPS Project Information.
References
Agricultural Metadata Element Set (AgMES) | AIMS. Rome: Food and agriculture Organization of the United Nations. (2010). Available at: https://aims.fao.org/standards/agmes (accessed Dec 10, 2024)
Akhtar, S., Anjum, F. M., and Anjum, M. A. (2011). Micronutrient fortification of wheat flour: recent development and strategies. Food Res. Int. 44, 652–659. doi: 10.1016/j.foodres.2010.12.033
Akhtar, S., Ismail, T., Atukorala, S., and Arlappa, N. (2013). Micronutrient deficiencies in South Asia – current status and strategies. Trends Food Sci. Technol. 31, 55–62. doi: 10.1016/j.tifs.2013.02.005
Alae-Carew, C., Bird, F. A., Choudhury, S., Harris, F., Aleksandrowicz, L., Milner, J., et al. (2019). Future diets in India: a systematic review of food consumption projection studies. Glob. Food Secur. 23, 182–190. doi: 10.1016/j.gfs.2019.05.006
Andrés-Hernández, L., Blumberg, K., Walls, R. L., Dooley, D., Mauleon, R., Lange, M., et al. (2022). Establishing a common nutritional vocabulary – from food production to diet. Front. Nutr. 9:928837. doi: 10.3389/fnut.2022.928837
Arlappa, N. (2023). Vitamin a supplementation policy: a shift from universal to geographical targeted approach in India considered detrimental to health and nutritional status of under 5 years children. Eur. J. Clin. Nutr. 77, 1–6. doi: 10.1038/s41430-022-01122-5
Arlappa, N., Balakrishna, N., Laxmaiah, A., Raghu, P., Vikas Rao, V., Madhavan Nair, K., et al. (2011a). Prevalence of vitamin a deficiency and its determinants among the rural pre-school children of Madhya Pradesh, India. Ann. Hum. Biol. 38, 131–136. doi: 10.3109/03014460.2010.498794
Arlappa, N., Laxmaiah, A., Balakrishna, N., Harikumar, R., Kodavanti, M. R., Gal Reddy, C., et al. (2011b). Micronutrient deficiency disorders among the rural children of West Bengal, India. Ann. Hum. Biol. 38, 281–289. doi: 10.3109/03014460.2010.536572
Belay, A., Gashu, D., Joy, E. J. M., Lark, M. R., Chagumaira, C., Zerfu, D., et al. (2022). Mineral micronutrient status and spatial distribution among the Ethiopian population. Br. J. Nutr. 128, 2170–2180. doi: 10.1017/S0007114522000319
Bora, K. (2022). Vitamin a supplementation among 9-59 month old children in India: geospatial perspectives and implications for targeted coverage. BMJ Glob. Health 7:e007972. doi: 10.1136/bmjgh-2021-007972
Brouwer, I. D., McDermott, J., and Ruben, R. (2020). Food systems everywhere: improving relevance in practice. Glob. Food Secur. 26:100398. doi: 10.1016/j.gfs.2020.100398
Brown, K. H., Moore, S. E., Hess, S. Y., McDonald, C. M., Jones, K. S., Meadows, S. R., et al. (2021). Increasing the availability and utilization of reliable data on population micronutrient (MN) status globally: the MN data generation initiative. Am. J. Clin. Nutr. 114, 862–870. doi: 10.1093/ajcn/nqab173
Buckland, A. J., Thorne-Lyman, A. L., Aung, T., King, S. E., Manorat, R., Becker, L., et al. (2020). Nutrition data use and needs: findings from an online survey of global nutrition stakeholders. J. Glob. Health 10:020403. doi: 10.7189/jogh.10.020403
Buttigieg, P. L., Pafilis, E., Lewis, S. E., Schildhauer, M. P., Walls, R. L., and Mungall, C. J. (2016). The environment ontology in 2016: bridging domains with increased scope, semantic density, and interoperation. J. Biomed. Seman. 7, 1–2. doi: 10.1186/s13326-016-0097-6
Chakraborty, S., Chopra, M., Mani, K., Giri, A. K., Banerjee, P., Sahni, N. S., et al. (2018). Prevalence of vitamin B12 deficiency in healthy Indian school-going adolescents from rural and urban localities and its relationship with various anthropometric indices: a cross-sectional study. J. Hum. Nutr. Diet. 31, 513–522. doi: 10.1111/jhn.12541
Clarke, V., and Braun, V. (2017). Thematic analysis. J. Posit. Psychol. 12, 297–298. doi: 10.1080/17439760.2016.1262613
Creswell, J. W., and Miller, D. L. (2000). Determining validity in qualitative inquiry. Theory Pract. 39, 124–130. doi: 10.1207/s15430421tip3903_2
Daelmans, B., Ferguson, E., Lutter, C. K., Singh, N., Pachón, H., Creed-Kanashiro, H., et al. (2013). Designing appropriate complementary feeding recommendations: tools for programmatic action. Matern. Child Nutr. 9, 116–130. doi: 10.1111/mcn.12083
Dooley, D. M., Griffiths, E. J., Gosal, G. S., Buttigieg, P. L., Hoehndorf, R., Lange, M. C., et al. (2018). FoodOn: a harmonized food ontology to increase global food traceability, quality control and data integration. Npj Sci. Food 2:23. doi: 10.1038/s41538-018-0032-6
Gandhi, V. P., and Johnson, N. (2018). A study of Kisan call Centres (KCC), Kisan knowledge management system (KKMS), farmers portal, and M-Kisan portal in Gujarat. Available at: https://mkisan.gov.in/Alpha/aboutkcc.aspx (accessed July 17, 2024).
Gonmei, Z., and Toteja, G. S. (2018). Micronutrient status of Indian population. Indian J. Med. Res. 148, 511–521. doi: 10.4103/ijmr.IJMR_1768_18
Gupta, A., Kapil, U., Ramakrishnan, L., Pandey, R. M., and Yadav, C. P. (2017). Prevalence of vitamin B12 and folate deficiency in school children residing at high altitude regions in India. Indian J. Pediatr. 84, 289–293. doi: 10.1007/s12098-017-2291-7
Hemalatha, R., Pandey, A., Kinyoki, D., Ramji, S., Lodha, R., Kumar, G. A., et al. (2020). Mapping of variations in child stunting, wasting and underweight within the states of India: the global burden of disease study 2000–2017. EClinicalMedicine 22:100317. doi: 10.1016/j.eclinm.2020.100317
Herens, M. C., Pittore, K. H., and Oosterveer, P. J. M. (2022). Transforming food systems: multi-stakeholder platforms driven by consumer concerns and public demands. Glob. Food Secur. 32:100592. doi: 10.1016/j.gfs.2021.100592
Houghton, L. A., McIntosh, D. R., Trilok-Kumar, G., Haszard, J. J., and Gibson, R. S. (2020). Suboptimal feeding and caring practices among young Indian children ages 12 to 24 mo living in the slums of New Delhi. Nutrition 69:110553. doi: 10.1016/j.nut.2019.110553
Jatav, H. S., Sharma, L. D., Sadhukhan, R., Singh, S. K., Singh, S., Rajput, V. D., et al. (2020). An overview of micronutrients: prospects and implication in crop production is included in the book. Plant micronutrients: Deficiency and toxicity management. eds. A. Tariq and K. R. Hakeem (Cham: Springer International Publishing), 1–30.
Joshi, A., Gaba, A., Thakur, S., and Grover, A. (2021). Need and importance of nutrition informatics in India: a perspective. Nutrients 13:1836. doi: 10.3390/nu13061836
Kadiyala, S., Harris, J., Headey, D., Yosef, S., and Gillespie, S. (2014). Agriculture and nutrition in India: mapping evidence to pathways. Ann. N. Y. Acad. Sci. 1331, 43–56. doi: 10.1111/nyas.12477
Kapil, U., Pandey, R. M., Goswami, R., Sharma, B., Sharma, N., Ramakrishnan, L., et al. (2017). Prevalence of vitamin D deficiency and associated risk factors among children residing at high altitude in Shimla district, Himachal Pradesh, India. Indian J. Endocrinol. Metab. 21, 178–183. doi: 10.4103/2230-8210.196031
Kapur, A., and Shukla, R. (2021). Public finance management and data availability for nutrition financing in India. BMJ glob. Health 6:e004705. doi: 10.1136/bmjgh-2020-004705
Kotecha, P. V. (2008). Micronutrient malnutrition in India: let us say “no” to it now. Indian J. Community Med. 33, 9–10. doi: 10.4103/0970-0218.39235
Kumssa, D. B., Joy, E. J. M., Ander, E. L., Watts, M. J., Young, S. D., Walker, S., et al. (2015). Dietary calcium and zinc deficiency risks are decreasing but remain prevalent. Sci. Rep. 5:10974. doi: 10.1038/srep10974
Kurian, O. C. (2016). Overcoming data challenges in tracking India’s health and nutrition targets, vol. 29. New Delhi, India: ORF Occasional Paper, 104.
Laxmaiah, A., Arlappa, N., Balakrishna, N., Mallikarjuna Rao, K., Galreddy, C., Kumar, S., et al. (2013). Prevalence and determinants of micronutrient deficiencies among rural children of eight states in India. Ann. Nutr. Metab. 62, 231–241. doi: 10.1159/000348674
Meenakshi, J. V., and Ray, R. (1999). Regional differences in India’s food expenditure pattern: a complete demand systems approach. J. Int. Dev. 11, 47–74. doi: 10.1002/(SICI)1099-1328(199901/02)11:1<47::AID-JID549>3.0.CO;2-Y
Mendu, V., Perugu, S., Munikumar, M., Rajeswari, B., Ray, M., and Pyne, S. (2019). Nutrition atlas of ICMR-National Institute of nutrition: an informatics platform on nutrition in India. Stat. Appl. 7, 209–219.
Menon, K. C., Skeaff, S. A., Thomson, C. D., Gray, A. R., Ferguson, E. L., Zodpey, S., et al. (2011). Concurrent micronutrient deficiencies are prevalent in nonpregnant rural and tribal women from Central India. Nutrition 27, 496–502. doi: 10.1016/j.nut.2010.02.012
Miles, M. B., and Huberman, A. M. (1994). Qualitative data analysis: an expanded sourcebook. Thousand Oaks, California, United States of America: SAGE, 358.
Monterrosa, E., Sadhu, G., Mangal, D., Rani, V., Bandhu, A., Singh, R., et al. (2020). Food-based recommendations:improving dietary intakes among pregnant and lactating women in Rajasthan, India. Sight Life 22, 62–68. Available at: sightandlife.org
Muthayya, S., Rah, J. H., Sugimoto, J. D., Roos, F. F., Kraemer, K., and Black, R. E. (2013). The global hidden hunger indices and maps: an advocacy tool for action. PLoS One 8:e67860. doi: 10.1371/journal.pone.0067860
Nair, M. K., Augustine, L. F., and Konapur, A. (2016). Food-based interventions to modify diet quality and diversity to address multiple micronutrient deficiency. Front. Public Health 3:3. doi: 10.3389/fpubh.2015.00277
National Data Governance Framework Policy. New Delhi: Ministry of Electronics and Information Technology, Government of India. (2022). Available at: https://www.meity.gov.in/writereaddata/files/National-Data-Governance-Framework-Policy.pdf (accessed Dec 10, 2024).
Orientation-Workshop-on-OPTIMA-Nutrition. (2019). Available at: https://documents1.worldbank.org/curated/en/637881590069941940/pdf/Orientation-Workshop-on-OPTIMA-Nutrition.pdf (Accessed July 4,2024).
Pathak, P., Kapil, U., Kapoor, S. K., Saxena, R., Kumar, A., Gupta, N., et al. (2004). Prevalence of multiple micronutrient deficiencies amongst pregnant women in a rural area of Haryana. Indian J. Pediatr. 71, 1007–1014. doi: 10.1007/BF02828117
Pingali, P., Aiyar, A., Abraham, M., and Rahman, A. (2019). Indian food systems towards 2050: Challenges and opportunities. Transforming food systems for a rising India. Cham: Springer International Publishing, 1–14.
Pingali, P. L., and Ricketts, K. D. (2014). Mainstreaming nutrition metrics in household surveys—toward a multidisciplinary convergence of data systems. Ann. N. Y. Acad. Sci. 1331, 249–257. doi: 10.1111/nyas.12597
Pradyumna, A., Mishra, A., Utzinger, J., and Winkler, M. S. (2021). Health in food systems policies in India: a document review. Int. J. Health Policy Manag. 11, 1158–1171. doi: 10.34172/ijhpm.2021.18
Purakayastha, T. J., Pathak, H., Kumari, S., Biswas, S., Chakrabarty, B., Padaria, R. N., et al. (2019). Soil health card development for efficient soil management in Haryana, India. Soil Tillage Res. 191, 294–305. doi: 10.1016/j.still.2018.12.024
Ramadas, S., Vellaichamy, S., Ramasundaram, P., Kumar, A., and Singh, S. (2020). 13 – biofortification for enhancing nutritional outcomes and policy imperatives. Wheat and Barley Grain Biofortification. Cambridge, United Kingdom: Woodhead Publishing, 309–327.
Rathi, K., Kamboj, P., Bansal, P. G., and Toteja, G. S. (2018). A review of selected nutrition & health surveys in India. Indian J. Med. Res. 148, 596–611. doi: 10.4103/ijmr.IJMR_1808_18
Ruben, R., Verhagen, J., and Plaisier, C. (2019). The challenge of food systems research: what difference does it make? Sustain. For. 11:171. doi: 10.3390/su11010171
Scott, N., Delport, D., Hainsworth, S., Pearson, R., Morgan, C., Huang, S., et al. (2020). Ending malnutrition in all its forms requires scaling up proven nutrition interventions and much more: a 129-country analysis. BMC Med. 18:356. doi: 10.1186/s12916-020-01786-5
Sendhil, R., Kiran Kumara, T. M., Ramasundaram, P., Sinha, M., and Kharkwal, S. (2020). Nutrition status in India: dynamics and determinants. Glob. Food Secur. 26:100455. doi: 10.1016/j.gfs.2020.100455
Shukla, A., Behera, S. K., Satyanarayana, T., and Majumdar, K. (2019). Importance of micronutrients in Indian agriculture. Better Crops South Asia 11, 6–10.
Shukla, A. K., and Tiwari, P. K. (2014). Micronutrients deficiencies Vis-a-Vis food and nutritional security of India. Indian J. Fert. 10, 94–112.
Singh, M. V., Narwal, R. P., Br, G., Patel, K. P., and Sadana, U. S. (2009). Changing scenario of micronutrient deficiencies in India during four decades and its impact on crop responses and nutritional health of human and animals, 21 Available at: https://escholarship.org/uc/item/7g5667d9 (Accessed June 19, 2024).
Srivastava, A., and Thomson, S. B. (2009). Framework analysis: A qualitative methodology for applied policy research. New Delhi, India: Rochester, NY.
Swaminathan, S., Edward, B. S., and Kurpad, A. V. (2013). Micronutrient deficiency and cognitive and physical performance in Indian children. Eur. J. Clin. Nutr. 67, 467–474. doi: 10.1038/ejcn.2013.14
Tang, K., Adams, K. P., Ferguson, E. L., Woldt, M., Kalimbira, A. A., Likoswe, B., et al. (2022). Modeling food fortification contributions to micronutrient requirements in Malawi using household consumption and expenditure surveys. Ann. N. Y. Acad. Sci. 1508, 105–122. doi: 10.1111/nyas.14697
Tong, A., Sainsbury, P., and Craig, J. (2007). Consolidated criteria for reporting qualitative research (COREQ): a 32-item checklist for interviews and focus groups. Int. J. Qual. Health Care 19, 349–357. doi: 10.1093/intqhc/mzm042
Van den Bold, M., Kohli, N., Gillespie, S., Zuberi, S., Rajeesh, S., and Chakraborty, B. (2015). Is there an enabling environment for nutrition-sensitive agriculture in South Asia? Stakeholder perspectives from India, Bangladesh, and Pakistan. Food Nutr. Bull. 36, 231–247. doi: 10.1177/0379572115587494
Vasu, D., Singh, S. K., Sahu, N., Tiwary, P., Chandran, P., Duraisami, V. P., et al. (2017). Assessment of spatial variability of soil properties using geospatial techniques for farm level nutrient management. Soil Tillage Res. 169, 25–34. doi: 10.1016/j.still.2017.01.006
Vavyahare, S., and Deshmukh, M. (2018). An analysis of consumption expenditure in India. Eur. Acad. Res. 10, 5275–5282.
Venkatesh, U., Sharma, A., Ananthan, V. A., Subbiah, P., and Durga, R. (2021). Micronutrient’s deficiency in India: a systematic review and meta-analysis. J. Nutr. Sci. 10:e110. doi: 10.1017/jns.2021.102
Vijayaraghavan, K. (2002). Control of micronutrient deficiencies in India: obstacles and strategies. Nutr. Rev. 60, S73–S76. doi: 10.1301/00296640260130786
Keywords: India, food system stakeholders, micronutrient data, nutrition data, agriculture data, dashboards, qualitative, evidence-based decisions
Citation: Sahota R, Khokhar JS, Deep A, Adams KP, Das A, Ander EL and Joy EJM (2025) “We need workable micronutrient data!”: a qualitative study assessing the need for integrated micronutrient data to support evidence-based decisions by Indian food system stakeholders. Front. Sustain. Food Syst. 8:1469126. doi: 10.3389/fsufs.2024.1469126
Edited by:
Vikash Kumar, Central Inland Fisheries Research Institute (ICAR), IndiaReviewed by:
Ebrahim Jahanshiri, Crops For the Future UK, United KingdomSoumya Prasad Panda, Central Inland Fisheries Research Institute (ICAR), India
Copyright © 2025 Sahota, Khokhar, Deep, Adams, Das, Ander and Joy. This is an open-access article distributed under the terms of the Creative Commons Attribution License (CC BY). The use, distribution or reproduction in other forums is permitted, provided the original author(s) and the copyright owner(s) are credited and that the original publication in this journal is cited, in accordance with accepted academic practice. No use, distribution or reproduction is permitted which does not comply with these terms.
*Correspondence: Rupinder Sahota, cnVwaW5kZXIuc2Fob3RhQGxzaHRtLmFjLnVr; Edward J. M. Joy, ZWR3YXJkLmpveUBsc2h0bS5hYy51aw==
†ORCID: Edward J. M. Joy, https://orcid.org/0000-0002-0106-866X