 Mahdieh Sheikh
 Hajar Shekarchizadeh*†
- Department of Food Science and Technology, College of Agriculture, Isfahan University of Technology, Isfahan, Iran
Introduction: Accurate and simple detection of pesticide residue amounts in food and crops is crucial for human health protection, food safety, environmental impact, trade, and consumer confidence.
Methods: Consequently, a colorimetric indicator based on copper nanoparticles (CuNPs) was developed for the detection of chlorpyrifos in this study.
Results: The prepared CuNPs-based colorimetric indicator exhibited color changes from black to green or blue in the presence of chlorpyrifos, visible to the naked eye and without the need for special equipment. An intriguing feature of this indicator was that its color turned blue for chlorpyrifos amounts below the maximum residue limit (MRL) and green for amounts exceeding the MRL. The complex formation of CuNPs with chlorpyrifos via the Cu-S bond, confirmed by FTIR, XPS, and XRD analysis, was responsible for the color change. Subsequently, the structure of CuNPs transitioned from a clustered to an aggregated state, as evident in the TEM images. The selectivity of the synthesized indicator against four other pesticides (glyphosate, malathion, diazinon, and imidacloprid) was investigated, revealing high selectivity against chlorpyrifos. Finally, the performance of the synthesized indicator was validated using real samples, demonstrating its high accuracy and sensitivity.
Conclusion: In summary, the prepared indicator represents a promising method for simple, cost-effective, accurate, and highly selective detection of chlorpyrifos.
1 Introduction
Researchers have announced that the world’s population will grow exponentially until 2050, reaching 7.9 billion people. Consequently, the food crisis is one of the challenges we face due to increased food demand. Any chemical or biological substance used to repel, destroy, or control pests or regulate plant growth is described as a pesticide. Pesticides play a crucial role in addressing food crises by aiding in the production of healthy and essential food (Dahiri et al., 2021; Huang et al., 2022; Rakshit et al., 2020). Annually, approximately 2 million tons of pesticides are used, with Europe and Asia being the largest consumers of these products. Among the six mail groups of pesticides (Organophosphorus (OPs), Carbamate, Organochlorine (OC), Pyrethroid, Sulfonylurea, Glyphosate (GLY)), organophosphorus pesticides (OPs) are the most commonly used and consumed group (Fu et al., 2022; Gyanjyoti et al., 2022; Rani et al., 2017).
OPs are phosphoric acid esters with a central phosphorus (P) atom, a phosphoryl group, two phosphorus-bound lipophilic groups, and a phosphorus-bound side group (usually a halide) in their structure. Among the pesticides in this group, we can mention paraxone, chlorpyrifos, malathion, phorate, glyphosate, and methyl parathion. Pesticides are typically soluble in water and disperse in the environment through dissolution and evaporation. Some pesticides remaining on crops and agricultural lands can infiltrate underground water during rainfall. The consumption of these contaminated waters and products by humans leads to poisoning (Fu et al., 2022; Huang et al., 2022; Sidhu et al., 2019). OPs have irreversible effects, with neurotoxicity being the most significant. Disrupting the cholinergic mechanism increases the risk of Alzheimer’s and Parkinson’s diseases, while affecting normal brain development raises the risk of autism. Organophosphates also impact the synthesis and secretion of endocrine hormones, such as those produced by the liver and kidneys, leading to lipid peroxidation, cell membrane integrity destruction, and nephrotoxic effects. Other side effects of OPs include nausea, dizziness, headache, neurological disorders, abortion, preterm birth, gene mutations, cancer, and death (Fu et al., 2022; Issaka et al., 2023; Osaili et al., 2022). Therefore, it is essential to measure the maximum amount of pesticide residue on or inside food, commonly referred to as the maximum residue limit (MRL). While chromatography and spectroscopy have traditionally been used for detecting pesticide residues, their high cost, time-consuming nature, and dependence on skilled personnel have led to the adaption of less expensive methods with simpler operations, such as sensors.
Optical sensors are a low-cost, fast, and straightforward method for the sensitive detection of pesticides. In optical sensors based on colorimetry, also known as indicators, the output data can be observed with the naked eye, eliminating the need for additional devices and equipment- this feature is their most important advantage. With the advancement of nanotechnology, gold, silver, and copper plasmonic nanoparticles have been employed to create optical indicators. The unique optical properties of metal nanoparticles significantly enhance their UV–Vis spectra. These materials exhibit noticeable color changes when they aggregate or grow, making them suitable for intuitive and visual detection. The color changes in optical indicators based on nanoparticles stem from the transition of nanoparticles from a dispersed state to an aggregated state (Huang et al., 2022; Yan et al., 2018). Decreasing the distance between nanoparticles leads to aggregation and surface plasmon coupling, resulting in observable color shifts. Plasmonic properties, particularly localized surface plasmon resonance (LSPR), depend on interactions between nanoparticles and the target analyte. Additionally, the size of the particles influences the SPR peaks. Smaller particle sizes increase the bandwidth of plasmon resonance, thereby enhancing the quantum efficiency of photoluminescence (Dang et al., 2011; Yeshchenko et al., 2014; Zhao and Li, 2020). Furthermore, the high surface-to-volume ratio in metal plasmonic nanoparticles makes the LSPR frequency sensitive to changes in the refractive index of the surrounding medium. Overall, any environmental alteration affects the LSPR frequency, ultimately leading to color changes in colorimetry (Dissanayake et al., 2019; Mehta et al., 2022).
Chlorpyrifos, O,O-diethyl O-(6,5,3-trichloro-2-pyridyl) phosphorothioate, belongs to the class of organophosphorus pesticides. This pesticide is commonly used to control pests, including insects and worms. According to the FDA, the permissible daily consumption limit for chlorpyrifos is 0.01 mg/kg of body weight, and exceeding this limit can lead to poisoning (Dissanayake et al., 2019; Dar et al., 2022; Lisha and Pradeep, 2009; Shikha et al., 2021). Therefore, detecting chlorpyrifos residues in food products is crucial. As mentioned before, nanoparticle-based indicators are employed for pesticide residue detection. When nanoparticles are present in the environment, chlorpyrifos binds to their surface via its sulfur (S) or oxygen (O) atom. Displacement of attached groups or ligands on the nanoparticle surface by pesticides alters the surface charge, resulting in changes in LSPR of plasmonic nanoparticles, leading to observable color shifts. Gold nanoparticles have been widely studied for this purpose. In Liu et al. (2022) used gold nanoparticles along with an aptamer to detect chlorpyrifos. The chlorpyrifos-aptamer complex destabilized the gold nanoparticles, causing aggregation and a color change from red to blue. Lisha and Pradeep (2009) further improved the color change by using sodium sulfate to enhance nanoparticle aggregation in the presence of chlorpyrifos. They attributed aggregation to the absorption of cationic species on the nanoparticle surface. In addition to gold nanoparticles, Chadha et al. (2022) employed silver nanoparticles stabilized with γ-cyclodextrin to detect chlorpyrifos. Aggregation of nanoparticles occurred due to strong binding between nanoparticles and the phosphorothioate and aromatic amine groups of chlorpyrifos. Consequently, the silver-γ-cyclodextrin solution changed from light yellow to green, and the gold-γ-cyclodextrin solution changed from wine red to blue. While the previously described methods exhibited high sensitivity and did not necessitate complex devices or equipment, their reliance on gold or silver nanoparticles rendered the prepared indicators cost-prohibitive. Additionally, the use of ligands introduced additional process steps and increased overall costs. In our study, we explored an alternative approach by utilizing copper nanoparticles without any additional ligands. Our goal was to retain the advantages of previous methods and create a simpler and more affordable indicator.
The objective of this study was to design a colorimetric indicator for detecting chlorpyrifos. While previous research widely employed gold and silver nanoparticles for this purpose, copper nanoparticles (CuNPs) offer a more cost-effective alternative. CuNPs are non-toxic, highly reactive, and boast a favorable surface-to-volume ratio (Al-Hakkani, 2020; Mehta et al., 2022). Notably, the CuNPs used in our research lack ligands or additional compounds, streamlining the synthesis process and reducing costs. After synthesizing CuNPs, we explored their interaction with varying chlorpyrifos concentrations, considering functional groups, surface charge, morphological properties, visual observations, colorimetry, and selectivity in the presence of other pesticides. Our designed indicator successfully detected chlorpyrifos in the environment through visual color changes alone. An intriguing feature was its ability to determine the MRL. By exhibiting distinct colors in response to different chlorpyrifos concentrations, the indicator indicated whether the levels exceeded or fell below the MRL for safe consumption. Our cost-effective, straightforward indicator not only detects chlorpyrifos in samples and crops but also assesses product safety and health acceptability. Its on-site usability without specialized equipment makes it valuable for farmers. To our knowledge, this work represents the first ligand-free copper nanoparticle-based indicator for visually and device-free detecting chlorpyrifos pesticide.
2 Materials and methods
2.1 Materials
The cucumber was procured from a local market in Isfahan, Iran. Copper nitrate [Cu(NO3)2.3H2O], cetyltrimethylammonium bromide (CTAB) [C19H42BrN], hydrazine hydrate [N2H4.H2O], and ethanol were purchased from Sigma (London, United Kingdom). Sulfuric acid was purchased from Merck KGaA Co., Ltd. (Darmstadt, Germany). Chlorpyrifos, malathion, and glyphosate were purchased from Sepahan Gol Shimi Company, diazinon from Kimiagohar Khak, and imidacloprid from Ariashimi.
2.2 Synthesis of copper nanoparticles (CuNPs)
Copper nanoparticles were prepared following the method of Teymouri and Shekarchizadeh (2022) with a slight modification. At first, 4 mL of 0.1 M copper nitrate solution was mixed with 5 mL of a 1% w/w CTAB solution (used as a stabilizer). To prevent nanoparticle oxidation, the container was filled with neutral nitrogen gas before sealing the lid. The mixture was then heated with stirring at 80°C for 5 min. Next, 2 mL of hydrazine hydrate was added, and heating continued for an additional 45 min. After cooling, the resulting CuNPs solution served as a colorimetric indicator for detecting chlorpyrifos.
2.3 Quantum yield of CuNPs
The efficiency of converting absorbed light into emitted light is called quantum yield. To determine the quantum yield of copper nanoparticles (indexed as ‘x’), quinine sulfate (which is dissolved in an H2SO4 aqueous solution with a concentration of 0.1 M and has a quantum yield of 0.54) was used. Quinine sulfate served as the reference substance (indexed as ‘Std’), and the absorption value of the samples was recorded at a wavelength of 300 nm. According to Equation 1, the quantum yield of CuNPs was calculated, where QY, I, ɳ, and A represent the quantum yield, integrated fluorescence emission intensity, the refractive index of the solvent, and absorption, respectively (Sadjadi, 2021; Wu et al., 2018).
2.4 Preparation of colorimetric indicator based on CuNPs to detect chlorpyrifos
Different concentrations of chlorpyrifos (ranging from 5.66 to 5.66 × 10⁻¹¹ ppm) were prepared using ethanol as the solvent. Next, 0.6 mL of chlorpyrifos was mixed with 1 mL of the CuNPs solution. After allowing it to rest for 20 min at room temperature, the upper phase of the solution, containing free nanoparticles, was removed. The precipitated phase was then dried at room temperature to investigate the effect of chlorpyrifos addition on CuNPs.
2.5 Characterization of colorimetric indicator based on CuNPs
2.5.1 Chemical analysis
Fourier transform infrared spectroscopy (FTIR) (Jasco, FT\IR6300, Japan) was used to identify the chemical structure and functional groups, confirming the synthesis of CuNPs and investigating the interactions between nanoparticles and chlorpyrifos (CuNPs-Chlorpyrifos). The samples were placed in the FTIR device, and their spectra were recorded in the wavenumber range of 350–4,000 cm−1 with a resolution of 4 cm−1. Finally, the results were analyzed using OriginPro software (version 2019b).
The X-ray photoelectron spectrometer (XPS) (Specs, Slexps, Germany) was used to determine the bond type and chemical composition of CuNPs and CuNPs-Chlorpyrifos complex. After assessing the chemical condition of the surface, the results were analyzed with CasaXPS2316PR1 software, and the peaks related to the elements were identified.
2.5.2 Zeta potential
The surface charge of CuNPs and CuNPs-Chlorpyrifos complex was assessed using a zeta potential measurement device (Horiba, SZ-100, Japan). Understanding the nature and magnitude of surface charge is crucial for determining nanoparticle stability and aggregation (Rafique et al., 2017).
2.5.3 Morphology and crystalline structure
A transmission electron microscope (TEM) (Leo912, AB, Germany) was utilized to investigate the size and shape of CuNPs and CuNPs-Chlorpyrifos complex. The particle size was determined using ImageJ software, and the particle size distribution diagram was created.
An X-ray diffraction (XRD) spectrometer (ASENWARE, AW-XDM300, China) was used to describe and determine the crystalline structure of both CuNPs and CuNPs-Chlorpyrifos complex. The reflected beam was measured using radiation from a copper anticathode with a wavelength of CuKα = 1.54184 Å. The XRD scan covered a range of 2θ = 10–90°, with a step size of 0.05, a step time of 1 s, a current of 30 mA, and a voltage of 40 kV.
2.5.4 Color response of colorimetric indicator
One of the most significant features of the synthesized CuNPs was their visible color changes after interacting with chlorpyrifos. The color of the precipitated CuNPs-Chlorpyrifos complex, which was dried at room temperature, shifted from black to green or blue, easily recognized by the naked eye. The color parameters (L*, a*, and b*) of CuNPs and CuNPs-Chlorpyrifos complex were determined using a colorimeter (Nippon Denshoku, ZE6000, Japan). Finally, the total color difference (ΔE) was calculated using Equation 2 (Teymouri and Shekarchizadeh, 2022).
where, L0*, a0*, and b0* represent the color factor values of CuNPs, and L*, a* and b* represent the color factor values of CuNPs-Chlorpyrifos complex.
2.5.5 Selectivity against chlorpyrifos
To assess the selectivity of the synthesized indicator against chlorpyrifos, the visual observations and color changes of CuNPs were conducted in the presence of five pesticides, including chlorpyrifos, malathion, glyphosate, diazinon, and imidacloprid. 0.6 mL of each pesticide was added to the CuNPs solution. After allowing the precipitated CuNPs-chlorpyrifos complex to remain at room temperature for 20 min, it was separated and examined its color changes.
2.6 Real sample
To validate chlorpyrifos detection using the CuNPs indicator, the method of Qi et al. (2020) was employed with a slight modification. Cucumbers with the skin were homogenized, and the resulting solution rested overnight in the refrigerator. Subsequently, the supernatant solution was separated using a refrigerated centrifuge (Hermle labortechnik, Z36HK, Germany) for 10 min at a temperature of 15°C and a speed of 5,000 rpm. Next, 0.6 mL of diluted real sample solution (diluted 500 times with water) and 0.6 mL of chlorpyrifos pesticide were added to the synthesized CuNPs, allowing them to rest for 20 min. As a control, a sample containing CuNPs and cucumber without chlorpyrifos was also prepared. Finally, the color parameters were recorded after observing the visual color change with the naked eye.
2.7 Statistical analysis
We conducted an analysis of variance (ANOVA) followed by Fisher’s least significant difference (LSD) test at a significance level of p < 0.05. These statistical analyses were performed using SAS v.9. All experiments were replicated three times, and the results are reported as the mean ± standard deviation.
3 Results and discussion
3.1 Characteristics of CuNPs
In this research, CuNPs were synthesized using the chemical reduction method. During the synthesis, hydrazine hydrate and CTAB acted as reducing and stabilizing agents. Upon adding the hydrazine hydrate solution, the blue color of the solution changed to black. Since N2H4 served as the electron source of the reaction, this color change indicated the production of CuNPs. Dang et al. (2011) also synthesized black copper nanoparticles using a chemical reduction method, employing ascorbic acid as the reducing agent and BH4 as an electron source.
The quantum y ield of CuNPs was 20%. In a study by Momeni et al. (2017), copper nanoparticles were synthesized using copper sulfate and ascorbic acid via the chemical reduction method. They reported a quantum yield of 1.6% for particles with an average diameter of 10 nm. As mentioned earlier, the quantum yield tends to increase as particle size decreases. Therefore, the higher quantum yield observed in our prepared CuNPs is likely attributed to their smaller particle size, as determined from the TEM results.
3.2 Characterization of colorimetric indicator based on CuNPs
3.2.1 Chemical analysis
Figure 1 displays the FTIR spectra of CuNPs and the CuNPs-Chlorpyrifos complex. The absorption bands at 3402 cm−1 and 3,287 cm−1 correspond to OH stretching vibrations and stretching vibrations between OH and NH groups, respectively. The absorption bands in the range of 2,800–2,900 cm−1 and around 1,000 cm−1 indicate C-H asymmetric stretching and C-O-C vibrations, respectively. The presence of carbon in the compounds is attributed to CTAB. H-O-H bending, C=O stretching vibrations, and C-N axial deformation are associated with absorption bands at 1718 cm−1, 1,595, cm−1 and 1,424 cm−1, respectively (Haldorai and Shim, 2013; Joseph et al., 2016; Lewisoscar et al., 2015). The absorption band at 720 cm−1 signifies the Cu-Br bond, indicating that CTAB has covered the CuNPs and contributed to their stability (Ghoto et al., 2019). The stretching vibration of Cu-O at 620 cm−1 (Ethiraj and Kang, 2012) decreased after adding chlorpyrifos. Additionally, a new band at 1343 cm−1, indicative of the Cu-S bond (Wu et al., 2012), emerged upon chlorpyrifos addition. This observation confirms the reaction between chlorpyrifos and CuNPs, resulting in the formation of the CuNPs-Chlorpyrifos complex.

Figure 1. FTIR of CuNPS and CuNPs-Chlorpyrifos.
The overall XPS spectra of CuNPs and the CuNPs-Chlorpyrifos complex are shown in Figures 2A,B to determine the bonding type and chemical composition of the nanoparticles. These spectra reveal corresponding bond energies associated with five elements. Specifically, the bond energy of 68.45 eV (Br3d) indicates the presence of a bromine element and the formation of CuBr2 bonds (Vasquez et al., 1989), signifying proper coating of CuNPs with CTAB. Moving on to specific elements, Figures 3C–E display the spectra for oxygen (O1s), carbon (C1s), and copper (Cu2p), respectively. In CuNPs, bond energies of 285.6 eV and 531.45 eV correspond to C-O bonds and OH, O, O2, and CO bonds, respectively. Conversely, in CuNPs-chlorpyrifos, bond energies of 287.55 eV and 533.88 eV indicate C=O bonds and hydrated oxides, absorbed O2, and C=O functionalities (Tiba et al., 2023; Yang et al., 2010, 2022). The Cu2p spectra exhibit a strong Cu2p3/2 peak (binding energies of 932.85 eV in CuNPs and 935.95 eV in CuNPs-chlorpyrifos) and a weaker Cu2p1/2 peak (binding energies of 952.05 eV in CuNPs and 955.75 eV in CuNPs-Chlorpyrifos). Notably, during the reaction of chlorpyrifos with CuNPs, Cu2O, CuO, and Cu-Cu bonds transform into CuS, confirming nanoparticle aggregation and the formation of the CuNPs-Chlorpyrifos complex (Borgohain et al., 2024; Sadale et al., 2022; Wan et al., 2012). Additionally, the presence of sulfur (bond energy of 226 eV (S2s)) in the CuNPs-Chlorpyrifos spectrum further supports the reaction between CuNPs and chlorpyrifos (Helal et al., 2021). Overall, the XPS results confirms the findings from FTIR analysis.
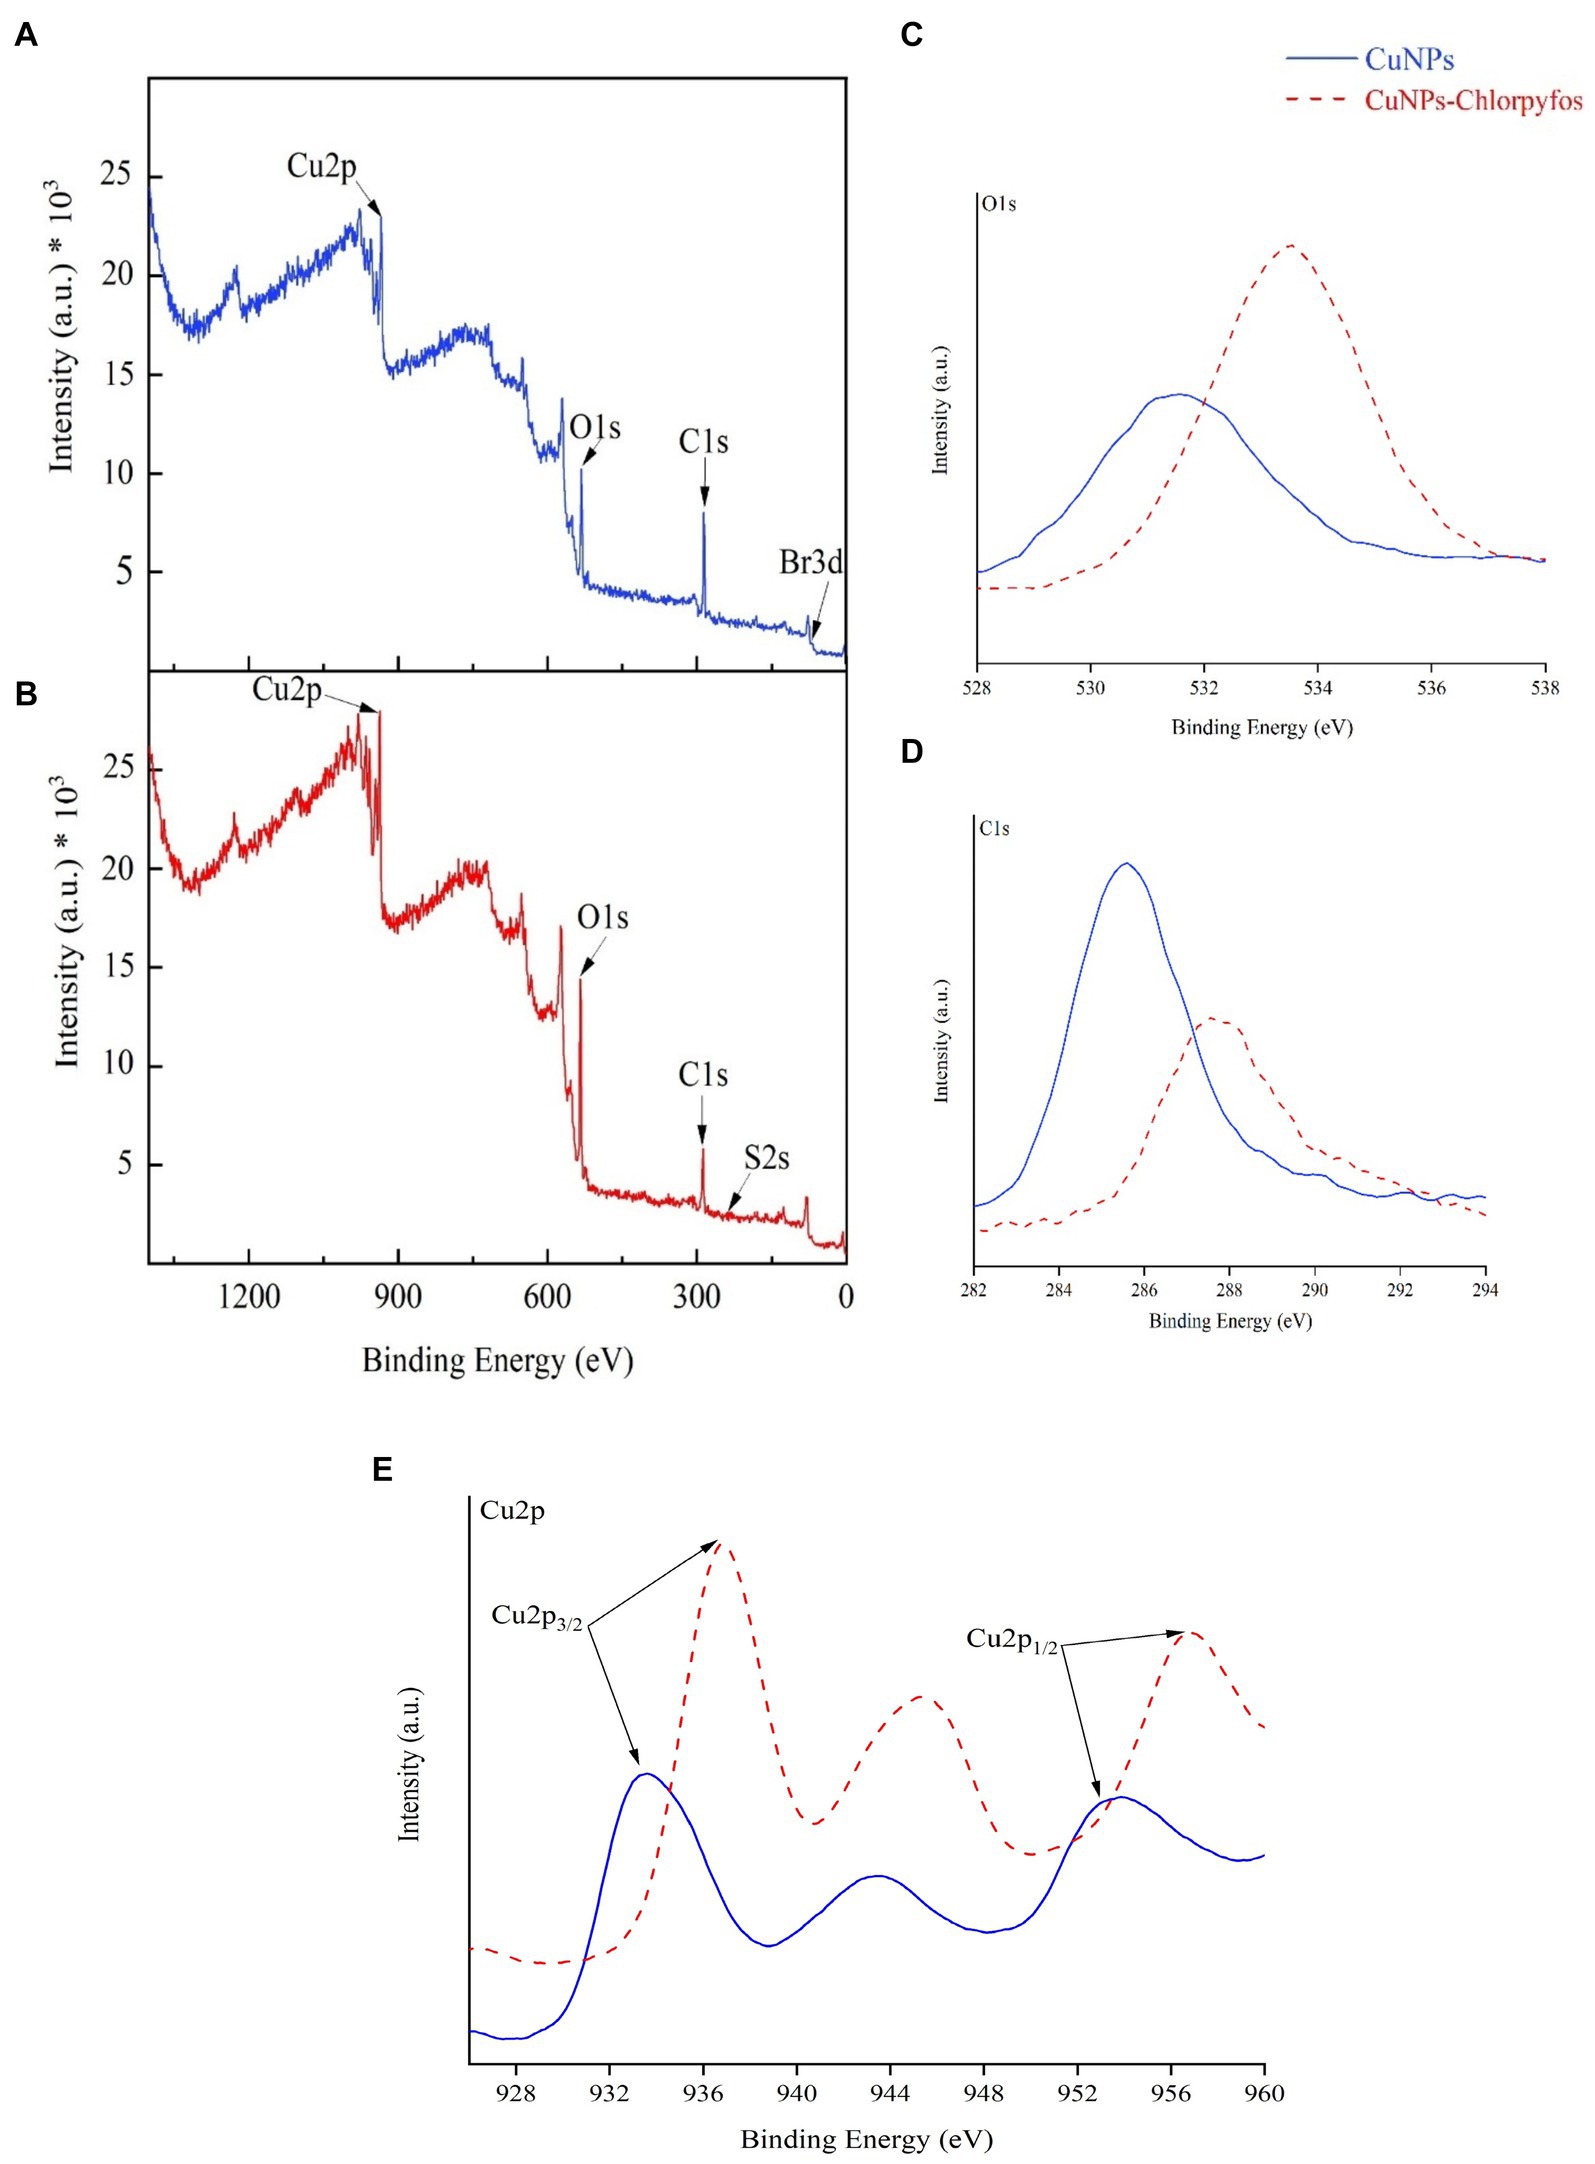
Figure 2. General XPS spectra of CuNPs (A) and CuNPs-Chlorpyrifos (B) and broad spectra of O1s (C), C1s (D), and Cu2p (E) of CuNPs and CuNPs-Chlorpyrifos.
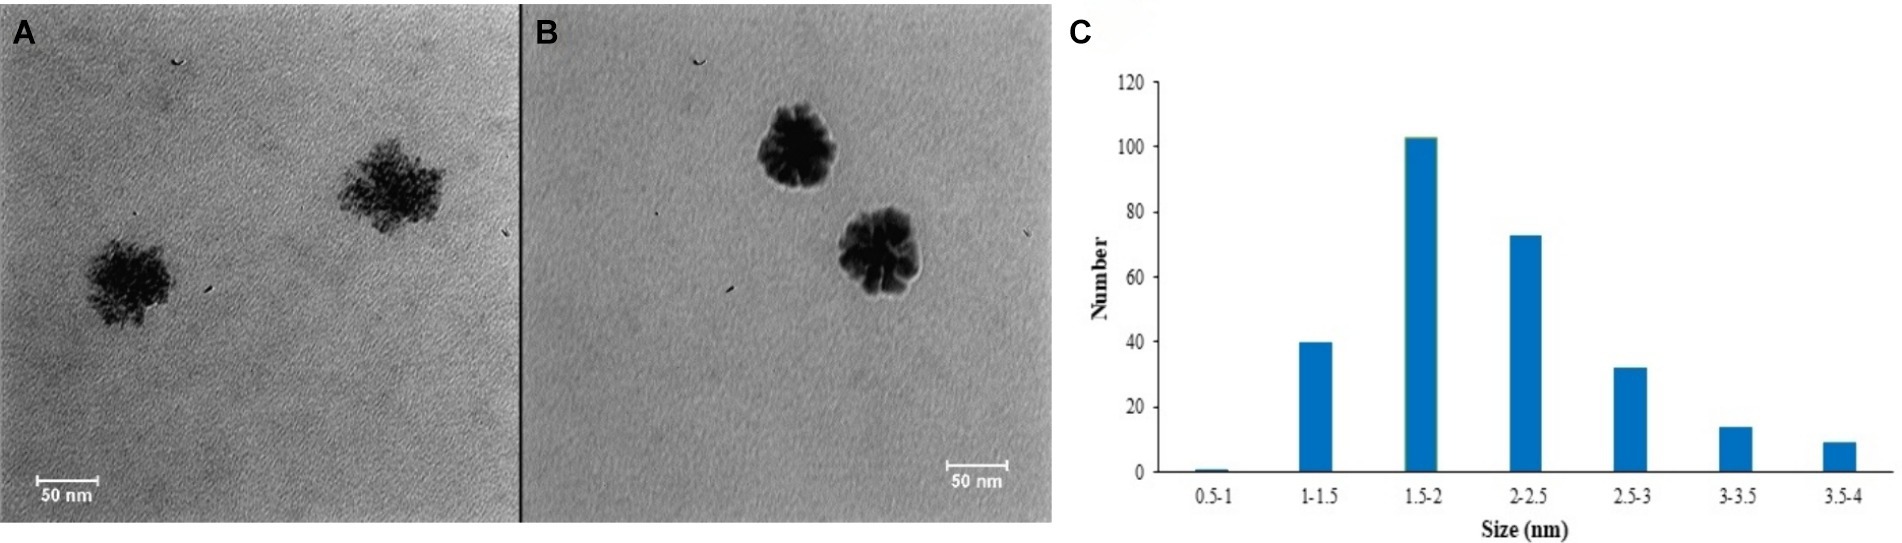
Figure 3. TEM images of CuNPs (A) and CuNPs-Chlorpyrifos (B) and CuNPs particle size distribution diagram (C).
3.2.2 Zeta potential
The electrical potential around the particles is known as zeta potential, which plays a crucial role in system stability. The average zeta potential was +32.5 ± 1.6 mV for CuNPs and + 26.85 ± 0.17 mV for the CuNPs-Chlorpyrifos complex. The presence of a stabilizing agent (CTAB) on the nanoparticle surface resulted in a positive surface charge for CuNPs. A high positive charge (greater than 30 mV) contributes to nanoparticle stability and prevents aggregation. However, upon adding chlorpyrifos, the zeta potential decreased. Sulfur compounds associated with chlorpyrifos include a negative charge on its surface. Consequently, the interaction between the negative charge of chlorpyrifos and the positive charge of CuNPs led to a decrease in zeta potential and the subsequent aggregation of the CuNPs-Chlorpyrifos complex (Teymouri and Shekarchizadeh, 2022; Tran et al., 2023). Teymouri and Shekarchizadeh (2022) synthesized CuNPs with a zeta potential of +12 mV. They stated that this positive charge on the nanoparticle surface prevented aggregation over an extended period (90 days). Additionally, modifying the synthesis steps by excluding sodium hydroxide resulted in smaller and more stable nanoparticles, characterized by a zeta potential exceeding +30.
3.2.3 Morphology and crystalline structure
Figures 3A,C display the TEM image and particle size distribution diagram of CuNPs. In Figure 3A, the clustered structure of CuNPs, confirms the successful synthesis of nanoparticles, with an average size of 2 nm. Suresh et al. (2016) noted that CuNPs exhibit a cluster-like structure, with particle sizes ranging from 1 to 40 nm. Reducing particle size enhances electron scattering on the surface, leading to increased plasmon resonance bandwidth in particles smaller than 20 nm. Additionally, the expanded surface enhances reactivity (Dang et al., 2011). Figure 3B shows nanoparticle aggregation after adding chlorpyrifos to CuNPs. This aggregation results from the formation of Cu-S bonds, leading to the creation of the CuNPs-Chlorpyrifos complex. Anh et al. (2021) utilized CuNPs for thiram pesticides detection and attributed the observed aggregation to the presence of pesticides in the environment.
The XRD patterns of CuNPs and the CuNPs-Chlorpyrifos complex are shown in Figures 4A,B, respectively. The diffraction peaks of CuNPs are located at 2θ values of 14.15°, 22.8°, 29.2°, 34.2°, 43.35°, 50.5°, and 74.1°corresponding to (110), (002), (110), (140), (111), (200), and (220) crystallographic planes. The peaks at 43.35° (111), 50.5° (200) and 74.1° (220) confirm the CuNPs synthesis. Kumar et al. (2013) investigated XRD patterns of copper nanoparticles and copper oxide nanoparticles, revealing that all CuNPs diffraction peaks align with the obtained XRD pattern. Interestingly, only one diffraction peak (29.2°) corresponds to copper oxide nanoparticles in the same pattern. Therefore, considering the absence of other peaks indicative of Cu2O, we confidently assert that the synthesized nanoparticles are indeed copper nanoparticles. The presence of the 22.8° (002) peak can be attributed to the carbon structures of CTAB (Liu et al., 2010, 2012). The diffraction peaks of CuNPs-Chlorpyrifos are located at 2θ values of 35.45° and 38.6°, corresponding to the (002) and (111) crystallographic planes. The peak at 38.6° (111) specifically indicates Cu2S (He et al., 2020), providing strong evidence for the reaction between CuNPs with chlorpyrifos, resulting in the formation of the CuNPs-Chlorpyrifos complex through the Cu-S bond.

Figure 4. XRD patterns of CuNPs (A) and CuNPs-Chlorpyrifos (B).
3.2.4 Color response of colorimetric indicator
The color changes of the indicator based on CuNPs to detect chlorpyrifos were investigated at different chlorpyrifos concentrations. Table 1 presents the data for L*, a*, and b* parameters of the indicator after the reaction with chlorpyrifos. The results showed a significant difference between the color parameters of CuNPs and the CuNPs-Chlorpyrifos complex. While the color parameter changes of the CuNPs-based indicator were significant at high concentrations of chlorpyrifos, the changes in color parameters became more limited, and the device could not detect color differences at very low concentrations of chlorpyrifos in the environment. As mentioned before, adding chlorpyrifos to the environment leads to nanoparticle aggregation and the formation of the Cu-Chlorpyrifos complex through the Cu-S bond. Consequently, visible color changes occured, discernible to the naked eye. Figure 5A shows the appearance changes of the synthesized indicator at different concentrations of chlorpyrifos. Initially, CuNPs were black. However, upon adding chlorpyrifos, the visible color shifted to green or blue, depending on the chlorpyrifos concentration (Figure 6). The higher the chlorpyrifos concentration in the environment, the more CuNPs participate in the reaction, reducing the free CuNPs content. Therefore, the reaction medium became clearer as chlorpyrifos concentration increased. An important point was the distinct color changes observed in the CuNPs-based indicator: two different colors (blue and green) apeared at different chlorpyrifos concentration ranges. These color transitions aligned well with the maximum residue limit (MRL) of chlorpyrifos (0.01 ppm). The dashed line in Figure 5A separates these two color groups. The blue color was observed at chlorpyrifos concentrations lower than the MRL, while the green color appeared at concentrations exceeding the MRL. In other words, the prepared CuNPs-based indicator not only detected the presence of the chlorpyrifos pesticide at different concentrations through visible color changes but also distinguished whether the pesticide amount exceeded the MRL. These two ranges were also evident in ΔE results (Table 1), where ΔE decreased below the MRL concentration and increased above it. Figure 5B depicts the color changes of the synthesized indicator at both the highest and lowest chlorpyrifos concentrations. The CuNPs indicator remained black at 5.66 × 10⁻¹¹ ppm chlorpyrifos, with no observable color change. Therefore, the lowest concentration of chlorpyrifos detectable by the naked eye using this synthesized indicator was 5.66 × 10⁻¹⁰ ppm. Considering that this color change occured at such extremely low concentrations of chlorpyrifos, it can be claimed that the prepared indicator exhibited remarkable efficiency.
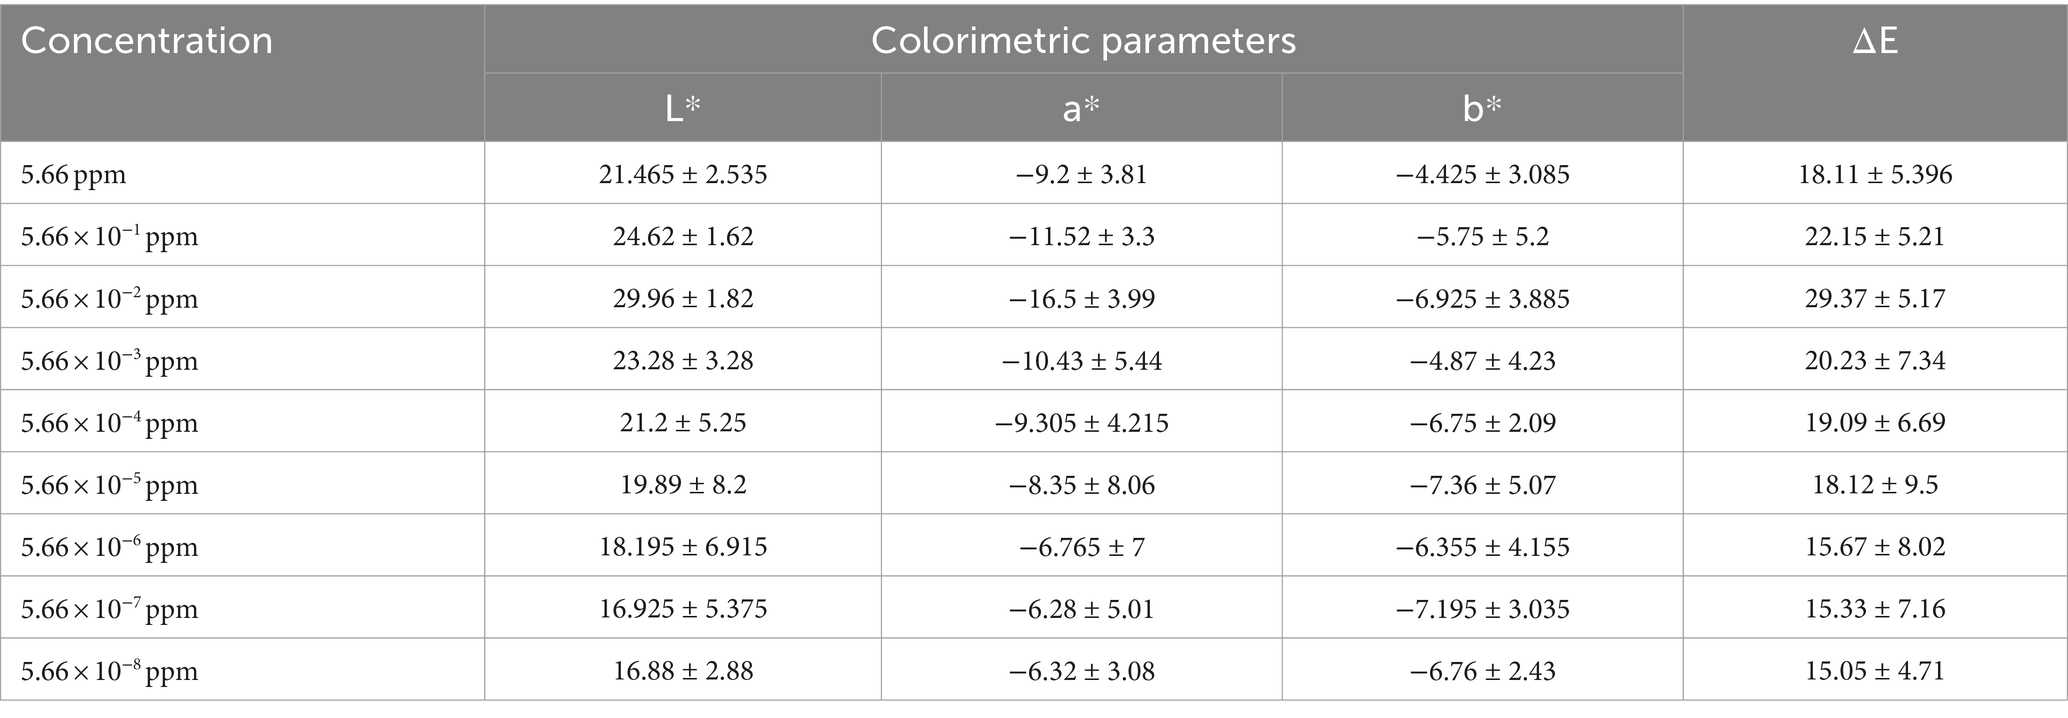
Table 1. Color parameters of CuNPs-based indicator against different concentrations of chlorpyrifos.
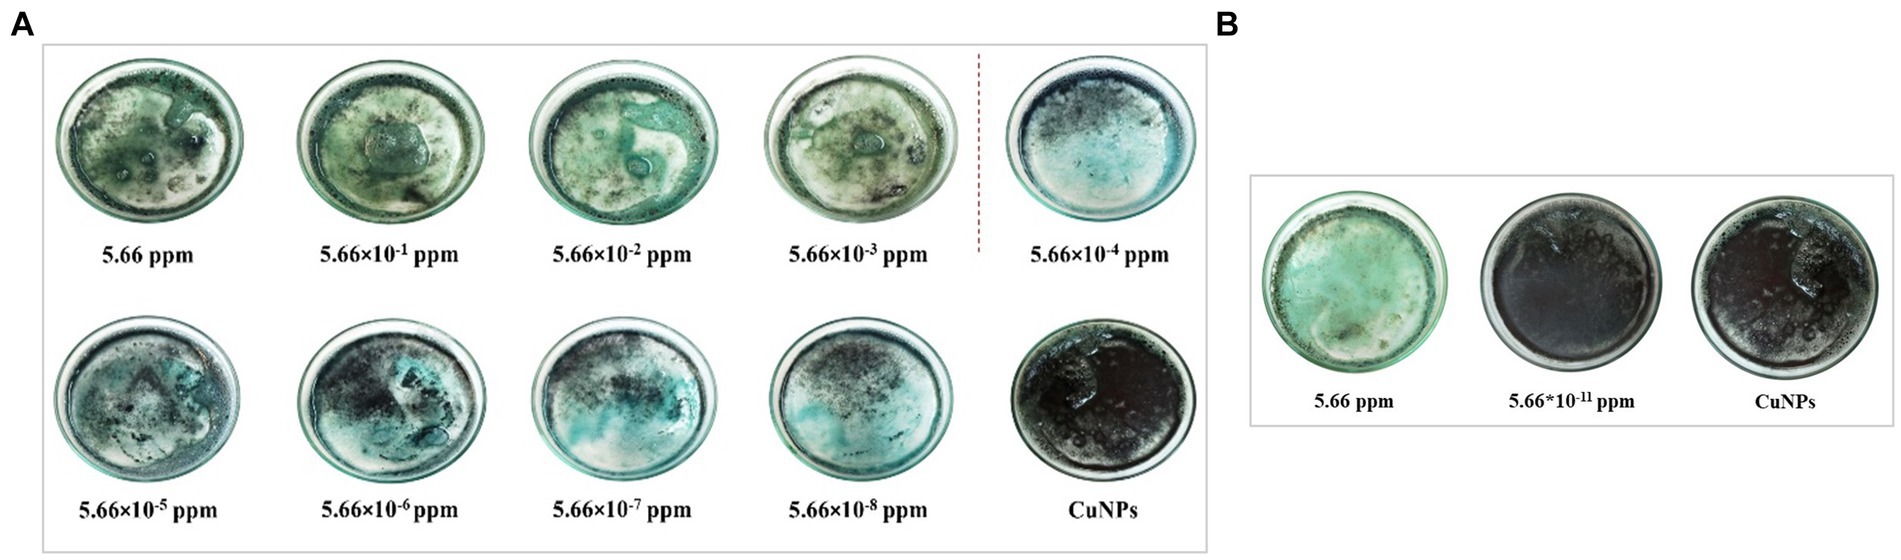
Figure 5. Color changes of CuNPs-based indicator against different concentrations of chlorpyrifos (A) and color of the indicator against the highest and lowest concentrations of chlorpyrifos (B).
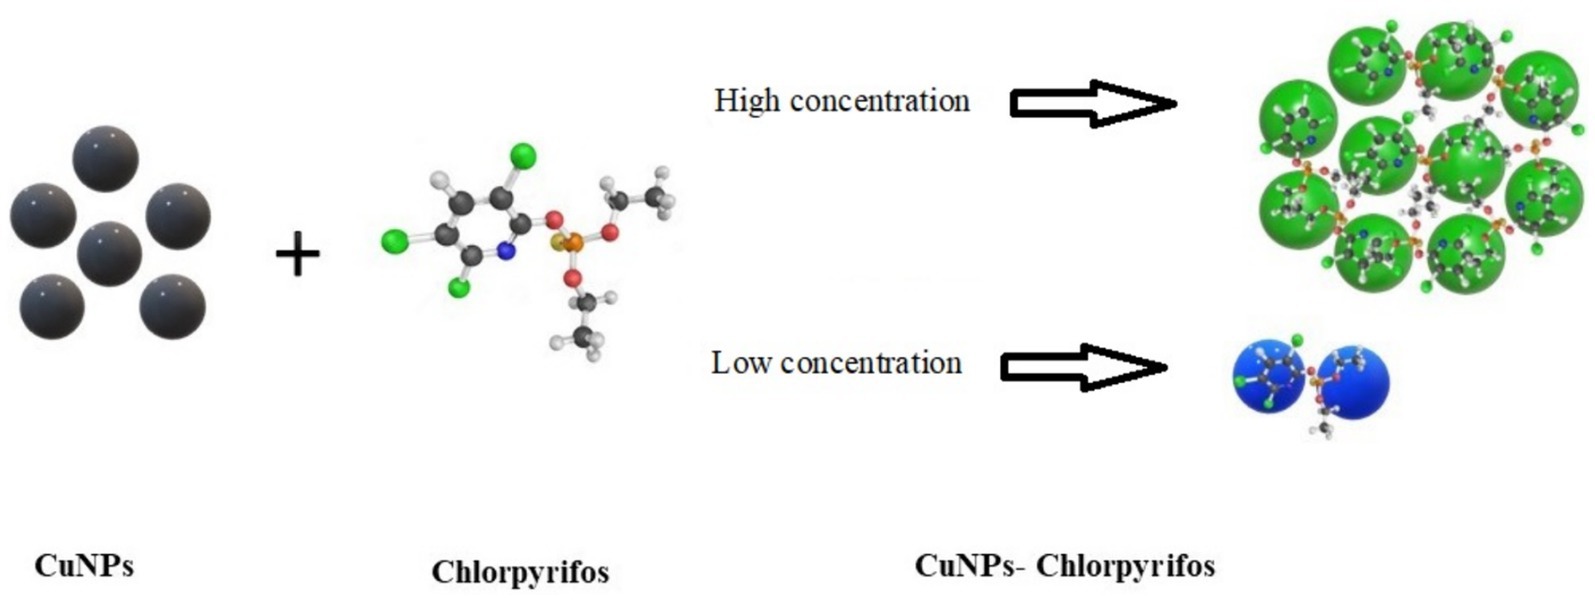
Figure 6. Schematic of the interaction between chlorpyrifos and CuNPs.
3.2.5 Selectivity against chlorpyrifos
To investigate the response of the synthesized CuNPs-based indicator to other pesticides and determine its selectivity, the color of CuNPs-based indicator was recorded after adding five pesticides, including chlorpyrifos, glyphosate, malathion, diazinon, and imidacloprid (as shown in Figure 7). The results revealed that imidacloprid and diazinon did not significantlt alter the color of CuNPs; the indicator remained black. However, the color of CuNPs changed to blue in the presence of glyphosate and malathion. Notably, these color changes occurred at high concentrations of these two pesticides. In contrast, the CuNPs-based indicator exhibited blue color at low chlorpyrifos concentrations and green color at high chlorpyrifos concentrations. Therefore, the visual observations confirm the selectivity of the synthesized indicator’s response. It appears that the simultaneous presence of two elements—chlorine and copper—in the structure of chlorpyrifos pesticide causes its distinct color change. When chlorpyrifos is added to CuNPs, each νC–Cl bond in chlorpyrifos donates a pair of electrons to the copper ions on the nanoparticle surface, resulting in coordinate bond formation. Subsequently, the copper ions on the CuNPs surface react with sulfur from the chlorpyrifos, leading to the formation of CuS and the aggregation of CuNPs. This intense nanoparticle aggregation manifests as a green color. Notably, this specific mechanism is absent in other pesticides, which explains why they do not exhibit a green color. On the other hand, when malathion or glyphosate is added, a blue color emerges due to a distinct reaction mechanism. However, the intensity of aggregation in this case is low, resulting in the observed blue color. Therefore, we recommend that when using this indicator, if the environment turns blue, do additional tests to make sure that there are no other pesticides in the environment.
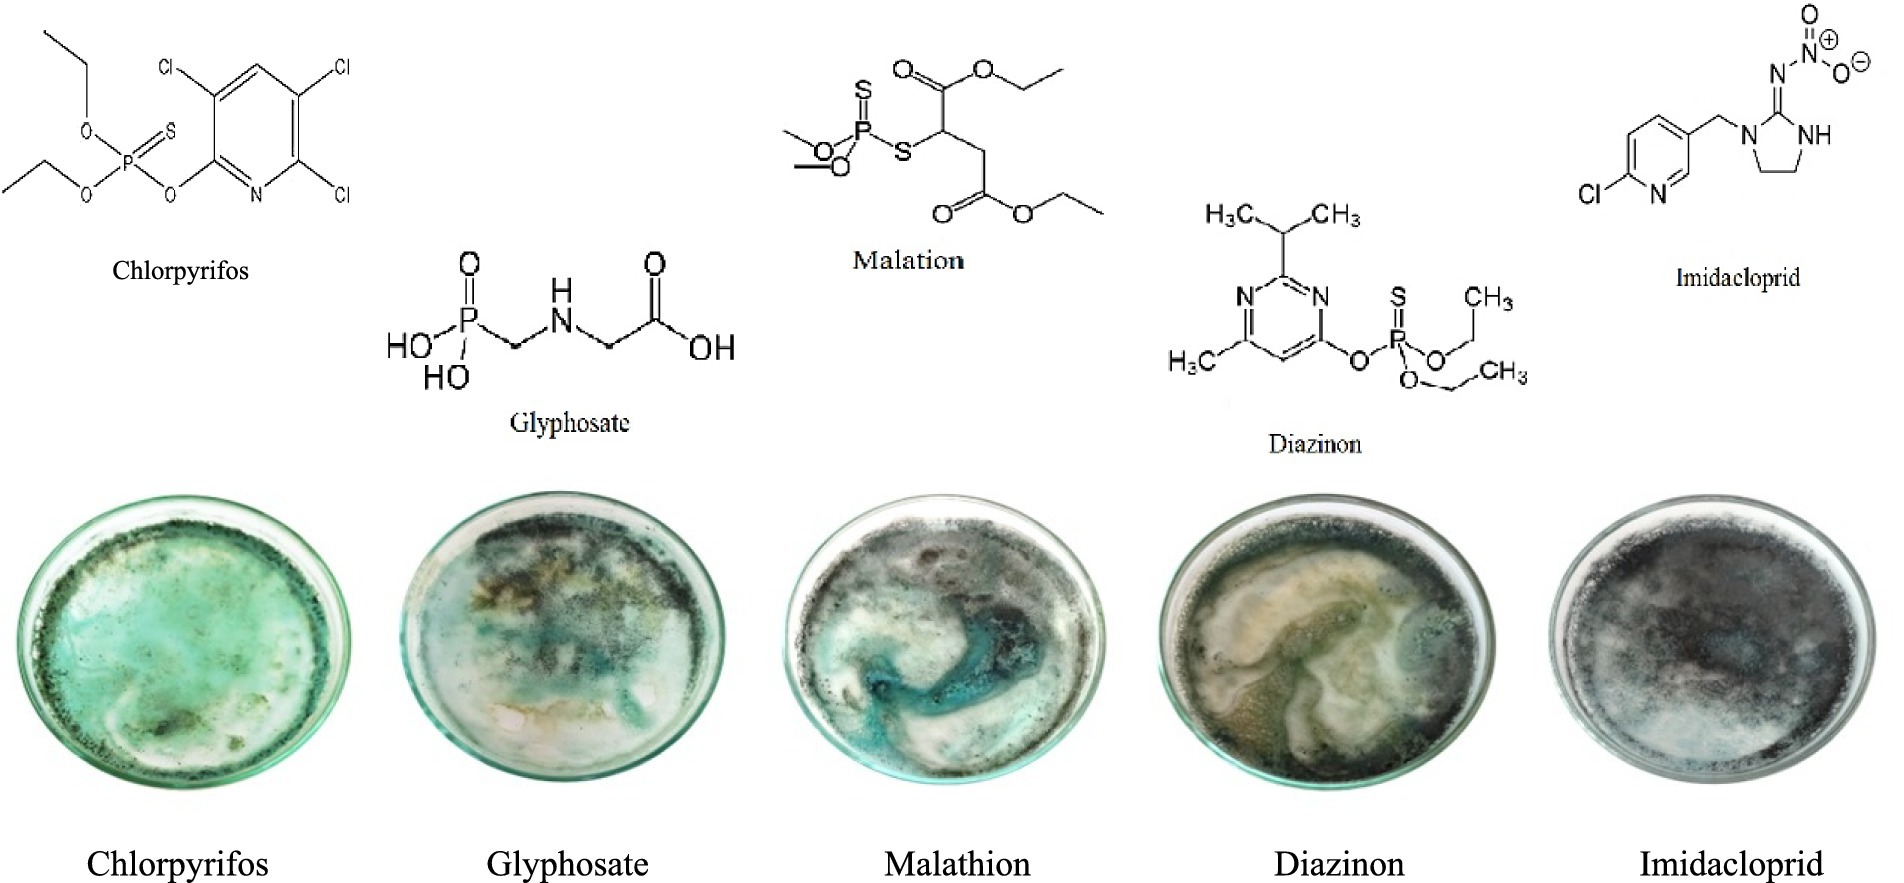
Figure 7. Color changes of CuNPs-based indicator against different pesticides.
3.3 Detection of chlorpyrifos in real sample
The response of the CuNPs-based indicator against different concentrations of chlorpyrifos was investigated in cucumber (C) to check the efficiency of the prepared colorimetric indicator in detecting chlorpyrifos in a real sample. Table 2 shows the L*, a*, and b* parameters and ΔE of the CuNPs-based indicator after adding real samples containing different chlorpyrifos concentrations. Results show that the indicator could effectively detect the presence of chlorpyrifos pesticide in the real sample and caused significant color changes. Furthermore, these color changes were visible to the naked eye, as shown in Figure 8A. Adding cucumber water to the CuNPs changed the black color to yellow. This change is most likely due to the replacement of the ligands on the surface of nanoparticles with other compounds (Xylia et al., 2022). However, when chlorpyrifos was present, the indicator acted against chlorpyrifos as before because it is likely that chlorpyrifos forms a strong bond with nanoparticles in the environment. According to Figure 8, the indicator exhibited a blue color in low concentrations and turned green in high concentrations of chlorpyrifos. The boundary between these two ranges is depicted in the figure with a dashed line. The green color indicates that the chlorpyrifos amount in the sample exceeded the MRL, rendering the product unreliable in terms of safety and health. Remarkably, the color changes observed in the CuNPs-based indicator against different chlorpyrifos concentrations in the real sample mirrored its response in water. This suggests that the presence of the real sample in the environment did not impact the indicator’s performance. Additionally, the presence of various compounds in the real sample did not interfere with the indicator’s response. In summary, the synthesized colorimetric indicator effectively identifies and detects chlorpyrifos in various products.
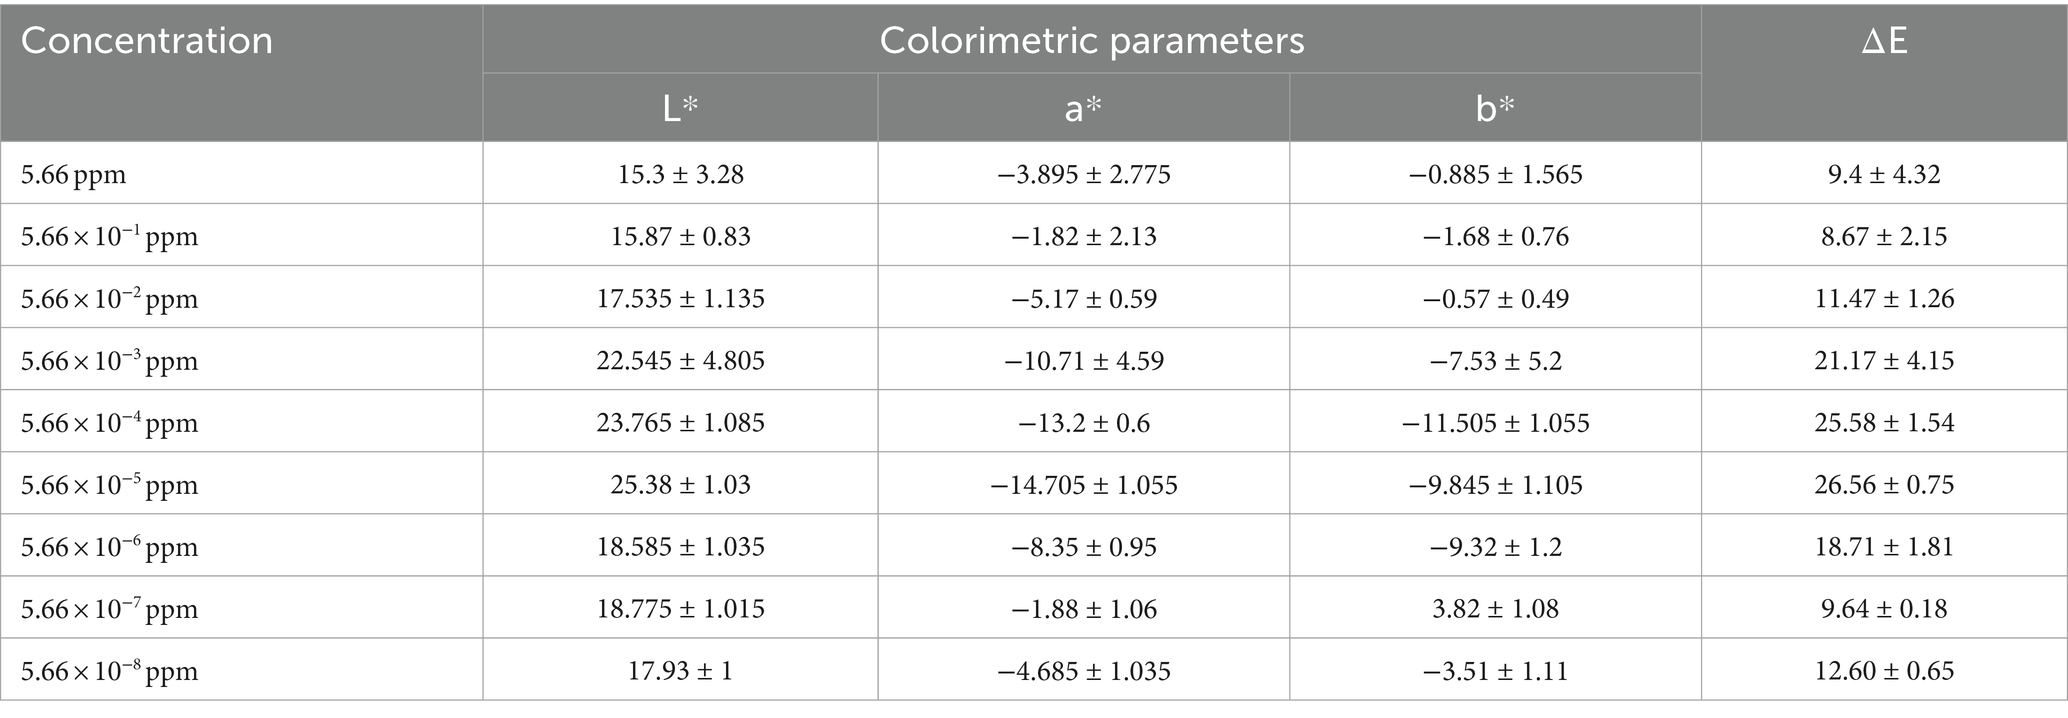
Table 2. Color parameters of CuNPs-based indicator against different concentrations of chlorpyrifos in real sample.
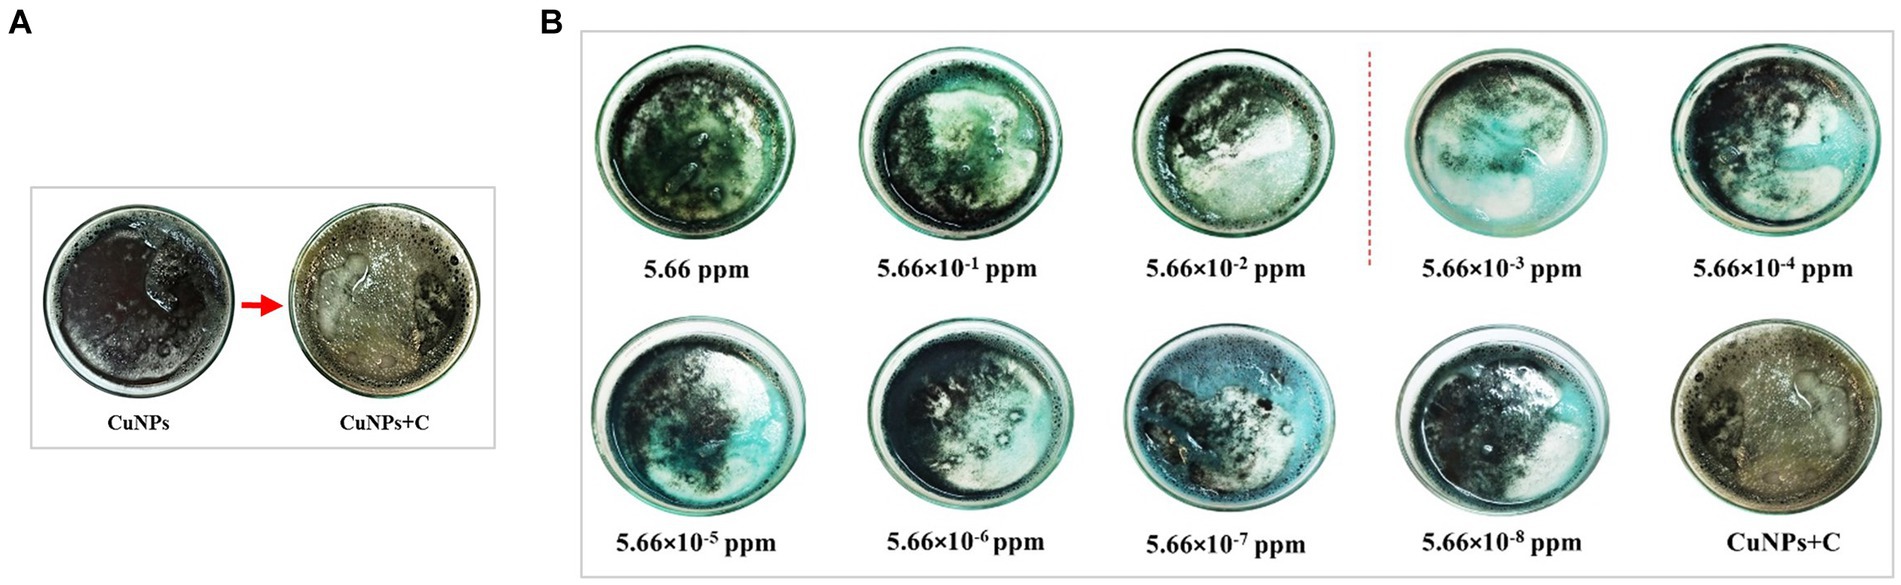
Figure 8. Color changes of CuNPs-based indicator after adding cucumber (A) and after adding different concentrations of chlorpyrifos (B).
4 Conclusion
In this research, a colorimetric indicator based on copper nanoparticles was prepared using the chemical reduction method to detect chlorpyrifos with the naked eye. The indicator’s strategy relied on copper’s ability to bind with sulfur compounds. Confirmation of Cu-S formation through FTIR, XPS, and XRD spectra, along with a reduction in zeta potential value and structural changes observed in TEM images after the reaction of nanoparticles with chlorpyrifos, indicated the formation of a Cu-Chlorpyrifos complex. The colorimetric index ΔE exhibited a strong correlation with visual observations. In the presence of chlorpyrifos, the indicator’s color changed from blue to green. Notably, the minimum detectable concentration of chlorpyrifos by this indicator was 5.66 × 10⁻¹⁰ ppm. Furthermore, successful application of the indicator to real samples allowed for quick assessment. When the environment’s color shifted to blue, it signaled that the product met safety and health standards. Overall, the synthesized colorimetric indicator offers advantages such as naked-eye detection, sensitivity, and ease of synthesis, making it a valuable method for chlorpyrifos detection.
Data availability statement
The original contributions presented in the study are included in the article/supplementary material, further inquiries can be directed to the corresponding author.
Author contributions
HS: Conceptualization, Investigation, Methodology, Supervision, Validation, Writing – review & editing. MS: Data curation, Formal analysis, Methodology, Software, Writing – original draft.
Funding
The author(s) declare that no financial support was received for the research, authorship, and/or publication of this article.
Acknowledgments
We are grateful to the Isfahan University of Technology (IUT) Research Council for financial support. We are grateful for the cooperation of Gol Shimi Sepahan Company in preparing the required pesticides.
Conflict of interest
The authors declare that the research was conducted in the absence of any commercial or financial relationships that could be construed as a potential conflict of interest.
Publisher’s note
All claims expressed in this article are solely those of the authors and do not necessarily represent those of their affiliated organizations, or those of the publisher, the editors and the reviewers. Any product that may be evaluated in this article, or claim that may be made by its manufacturer, is not guaranteed or endorsed by the publisher.
References
Al-Hakkani, M. F. (2020). Biogenic copper nanoparticles and their applications: a review. SN Appl. Sci. 2:505. doi: 10.1007/s42452-020-2279-1
Anh, N. T., Dinh, N. X., Van Tuan, H., Thuan, T. H., Tung, L. M., Le, V. P., et al. (2021). Cost-effective tween 80-capped copper nanoparticles for ultrasensitive colorimetric detection of thiram pesticide in environmental water samples. J. Nanomater. 2021, 1–10. doi: 10.1155/2021/5513401
Borgohain, X., Chowdhury, R., Bhuyan, K., and Rashid, M. H. (2024). Remediation of groundwater fluoride using Cu2O nanostructures as an efficient adsorbent. J. Water Process Eng. 61:105195. doi: 10.1016/j.jwpe.2024.105195
Chadha, R., Das, A., Lobo, J., Meenu, V. O., Paul, A., Ballal, A., et al. (2022). γ-Cyclodextrin capped silver and gold nanoparticles as colorimetric and Raman sensor for detecting traces of pesticide “Chlorpyrifos” in fruits and vegetables. Colloids Surf. A Physicochem. Eng. Asp. 641:128558. doi: 10.1016/j.colsurfa.2022.128558
Dahiri, B., Martín-Reina, J., Carbonero-Aguilar, P., Aguilera-Velázquez, J. R., Bautista, J., and Moreno, I. (2021). Impact of pesticide exposure among rural and urban female population. An overview. Int. J. Environ. Res. Public Health 18:9907. doi: 10.3390/ijerph18189907
Dang, T. M. D., Le, T. T. T., Fribourg-Blanc, E., and Dang, M. C. (2011). Synthesis and optical properties of copper nanoparticles prepared by a chemical reduction method. Adv. Nat. Sci. 2:015009. doi: 10.1088/2043-6262/2/1/015009
Dar, M. A., Baba, Z. A., and Kaushik, G. (2022). A review on phorate persistence, toxicity and remediation by bacterial communities. Pedosphere 32, 171–183. doi: 10.1016/S1002-0160(21)60043-7
Dissanayake, N. M., Arachchilage, J. S., Samuels, T. A., and Obare, S. O. (2019). Highly sensitive plasmonic metal nanoparticle-based sensors for the detection of organophosphorus pesticides. Talanta 200, 218–227. doi: 10.1016/j.talanta.2019.03.042
Ethiraj, A. S., and Kang, D. J. (2012). Synthesis and characterization of CuO nanowires by a simple wet chemical method. Nanoscale Res. Lett. 7:70. doi: 10.1186/1556-276X-7-70
Fu, H., Tan, P., Wang, R., Li, S., Liu, H., Yang, Y., et al. (2022). Advances in organophosphorus pesticides pollution: current status and challenges in ecotoxicological, sustainable agriculture, and degradation strategies. J. Hazard. Mater. 424:127494. doi: 10.1016/j.jhazmat.2021.127494
Ghoto, S. A., Khuhawar, M. Y., Jahangir, T. M., and Mangi, J. U. D. (2019). Applications of copper nanoparticles for colorimetric detection of dithiocarbamate pesticides. J. Nanostructure Chem. 9, 77–93. doi: 10.1007/s40097-019-0299-4
Gyanjyoti, A., Guleria, P., Awasthi, A., Singh, K., and Kumar, V. (2022). Recent advancement in fluorescent materials for optical sensing of pesticides. Mater. Today Commun. 34:105193. doi: 10.1016/j.mtcomm.2022.105193
Haldorai, Y., and Shim, J.-J. (2013). Multifunctional chitosan-copper oxide hybrid material: photocatalytic and antibacterial activities. Int. J. Photoenergy 2013:245646. doi: 10.1155/2013/245646
He, X., Hu, Y., Tian, H., Li, Z., Huang, P., Jiang, J., et al. (2020). In-situ growth of flexible 3D hollow tubular Cu2S nanorods on cu foam for high electrochemical performance supercapacitor. J. Mater. 6, 192–199. doi: 10.1016/j.jmat.2020.01.005
Helal, A., Harraz, F. A., and Ismail, A. A. (2021). One-step synthesis of heterojunction Cr2O3 nanoparticles decorated Bi2S3 nanorods with enhanced photocatalytic activity for mineralization of organic pollutants. J. Photochem. Photobiol. A 419:113468. doi: 10.1016/j.jphotochem.2021.113468
Huang, Y., Zhai, J., Liu, L., Shang, Z., Zhang, X., Huang, H., et al. (2022). Recent developments on nanomaterial probes for detection of pesticide residues: a review. Anal. Chim. Acta 1215:339974. doi: 10.1016/j.aca.2022.339974
Issaka, E., Wariboko, M. A., Johnson, N., and Nyame-Do Aniagyei, O. (2023). Advanced visual sensing techniques for on-site detection of pesticide residue in water environments. Heliyon 9:e13986. doi: 10.1016/j.heliyon.2023.e13986
Joseph, A. T., Prakash, P., and Narvi, S. S. (2016). Phytofabrication and characterization of copper nanoparticles using Allium sativum and its antibacterial activity. Int. J. Eng. Sci. Technol. 4, 463–472.
Kumar, A., Saxena, A., De, A., Shankar, R., and Mozumdar, S. (2013). Facile synthesis of size-tunable copper and copper oxide nanoparticles using reverse microemulsions. RSC Adv. 3, 5015–5021. doi: 10.1039/C3RA23455J
Lewisoscar, F., Mubarakali, D., Nithya, C., Priyanka, R., Gopinath, V., Alharbi, N. S., et al. (2015). One pot synthesis and anti-biofilm potential of copper nanoparticles (CuNPs) against clinical strains of Pseudomonas aeruginosa. Biofouling 31, 379–391. doi: 10.1080/08927014.2015.1048686
Lisha, K. P., and Pradeep, T. (2009). Enhanced visual detection of pesticides using gold nanoparticles. J. Environ. Sci. Health B 44, 697–705. doi: 10.1080/03601230903163814
Liu, X.-Y., Huang, M., Ma, H.-L., Zhang, Z.-Q., Gao, J.-M., Zhu, Y.-L., et al. (2010). Preparation of a carbon-based solid acid catalyst by sulfonating activated carbon in a chemical reduction process. Molecules 15, 7188–7196. doi: 10.3390/molecules15107188
Liu, Y., Li, T., Yang, G., Deng, Y., Mou, X., and He, N. (2022). A simple AuNPs-based colorimetric aptasensor for chlorpyrifos detection. Chin. Chem. Lett. 33, 1913–1916. doi: 10.1016/j.cclet.2021.11.025
Liu, Y., Thibodeaux, D., Gamble, G., Bauer, P., and Vanderveer, D. (2012). Simple XRD algorithm for direct determination of cotton crystallinity. Proceedings of SPIE - The International Society for Optical Engineering.
Mehta, V. N., Ghinaiya, N., Rohit, J. V., Singhal, R. K., Basu, H., and Kailasa, S. K. (2022). Ligand chemistry of gold, silver and copper nanoparticles for visual read-out assay of pesticides: a review. Trends Analyt. Chem. 153:116607. doi: 10.1016/j.trac.2022.116607
Momeni, S., Ahmadi, R., Safavi, A., and Nabipour, I. (2017). Blue-emitting copper nanoparticles as a fluorescent probe for detection of cyanide ions. Talanta 175, 514–521. doi: 10.1016/j.talanta.2017.07.056
Osaili, T. M., Al-Natour, M. Q., Al-Abboodi, A. R., Alkarasneh, A. Y., El Darra, N., Khazaal, S., et al. (2022). Detection and risk associated with organochlorine, organophosphorus, pyrethroid and carbamate pesticide residues in chicken muscle and organ meats in Jordan. Food Control 144:109355. doi: 10.1016/j.foodcont.2022.109355
Qi, Y., Chen, Y., Xiu, F.-R., and Hou, J. (2020). An aptamer-based colorimetric sensing of acetamiprid in environmental samples: convenience, sensitivity and practicability. Sens. Actuators B Chem. 304:127359. doi: 10.1016/j.snb.2019.127359
Rafique, M., Shaikh, A. J., Rasheed, R., Tahir, M. B., Bakhat, H. F., Rafique, M. S., et al. (2017). A review on synthesis, characterization and applications of copper nanoparticles using green method. Nano 12:1750043. doi: 10.1142/S1793292017500436
Rakshit, A., Singh, H. B., Singh, A. K., Singh, U. S., and Fraceto, L. (2020). New Frontiers in stress Management for Durable Agriculture. Germany, Springer Singapore: Berlin/Heidelberg.
Rani, M., Shanker, U., and Jassal, V. (2017). Recent strategies for removal and degradation of persistent & toxic organochlorine pesticides using nanoparticles: a review. J. Environ. Manag. 190, 208–222. doi: 10.1016/j.jenvman.2016.12.068
Sadale, S. B., Patil, S. B., Teli, A. M., Masegi, H., and Noda, K. (2022). Effect of deposition potential and annealing on performance of electrodeposited copper oxide thin films for supercapacitor application. Solid State Sci. 123:106780. doi: 10.1016/j.solidstatesciences.2021.106780
Sadjadi, S. (2021). “The utility of carbon dots for photocatalysis” in Emerging carbon materials for catalysis. ed. S. Sadjadi (Iran: Elsevier).
Shikha, S., Dureja, S., Sapra, R., Babu, J., Haridas, V., and Pattanayek, S. K. (2021). Interaction of borohydride stabilized silver nanoparticles with sulfur-containing organophosphates. RSC Adv. 11, 32286–32294. doi: 10.1039/D1RA06911J
Sidhu, G. K., Singh, S., Kumar, V., Dhanjal, D. S., Datta, S., and Singh, J. (2019). Toxicity, monitoring and biodegradation of organophosphate pesticides: a review. Crit. Rev. Environ. Sci. Technol. 49, 1135–1187. doi: 10.1080/10643389.2019.1565554
Suresh, Y., Annapurna, S., Bhikshamaiah, G., and Singh, A. (2016). Green luminescent copper nanoparticles. IOP Conf. Ser.: Mater. Sci. Eng. 149:012187. doi: 10.1088/1757-899X/149/1/012187
Teymouri, Z., and Shekarchizadeh, H. (2022). A colorimetric indicator based on copper nanoparticles for volatile sulfur compounds to monitor fish spoilage in intelligent packaging. Food Packag. Shelf Life 33:100884. doi: 10.1016/j.fpsl.2022.100884
Tiba, D. Y., Name, L. L., Landers, R., and Canevari, T. C. (2023). Copper oxide nanostructures with nanoneedles shape obtained by direct reaction with nitrogen-doped carbon quantum dots: development of an electrochemical sensor to glyphosate. J. Mater. Sci. 58, 12569–12583. doi: 10.1007/s10853-023-08827-3
Tran, N. B., Nguyen, Q. K., Vu, T. V., Hoang, A. Q., Pham, T. D., Pham, D. T., et al. (2023). Polycation-stabilized PDADMAC-gold nanoparticles as a highly sensitive colorimetric sensor for the detection of the chlorpyrifos pesticide. Colloid Polym. Sci. 301, 239–250. doi: 10.1007/s00396-023-05058-5
Vasquez, R., Foote, M., and Hunt, B. (1989). Reaction of nonaqueous halogen solutions with YBa2Cu3O7− x. J. Appl. Phys. 66, 4866–4877. doi: 10.1063/1.343805
Wan, T., Qian, H., Zhou, Z., Gong, S., Hu, X., and Feng, B. (2012). Suppressive mechanism of the passivator irgamet 39 on the corrosion of copper conductors in transformers. IEEE Trans. Dielectr. Electr. Insul. 19, 454–459. doi: 10.1109/TDEI.2012.6180238
Wu, D.-Z., Fan, X.-M., Ke, T., Jia, D., and Liu, H.-R. (2012). Fabrication and photocatalytic properties of Cu2S/T-ZnOw heterostructures via simple polyol process. Trans. Nonferrous Met. Soc. China 22, 1620–1628. doi: 10.1016/S1003-6326(11)61365-4
Wu, X., Wu, L., Cao, X., Li, Y., Liu, A., and Liu, S. (2018). Nitrogen-doped carbon quantum dots for fluorescence detection of cu 2+ and electrochemical monitoring of bisphenol A. RSC Adv. 8, 20000–20006. doi: 10.1039/C8RA03180K
Xylia, P., Chrysargyris, A., Shahwar, D., Ahmed, Z. F., and Tzortzakis, N. (2022). Application of rosemary and eucalyptus essential oils on the preservation of cucumber fruit. Horticulturae 8:774. doi: 10.3390/horticulturae8090774
Yan, X., Li, H., and Su, X. (2018). Review of optical sensors for pesticides. Trends Analyt. Chem. 103, 1–20. doi: 10.1016/j.trac.2018.03.004
Yang, L., Ravdel, B., and Lucht, B. L. (2010). Electrolyte reactions with the surface of high voltage LiNi0. 5Mn1. 5O4 cathodes for lithium-ion batteries. Electrochem. Solid-State Lett. 13, A95–A97. doi: 10.1149/1.3428515
Yang, L., Ren, X., Zhang, Y., and Chen, Z. (2022). One-pot preparation of poly (triazine imide) with intercalation of cu ions: a heterogeneous catalyst for peroxymonosulfate activation to degradate organic pollutants under sunlight. Inorg. Chem. Commun. 145:109965. doi: 10.1016/j.inoche.2022.109965
Yeshchenko, O. A., Bondarchuk, I. S., Losytskyy, M. Y., and Alexeenko, A. A. (2014). Temperature dependence of photoluminescence from silver nanoparticles. Plasmonics 9, 93–101. doi: 10.1007/s11468-013-9601-3
Keywords: colorimetric indicator, chlorpyrifos, Cu-S bond, copper, nanoparticles
Citation: Sheikh M and Shekarchizadeh H (2024) Visual detection of chlorpyrifos pesticide residues in foodstuffs using a colorimetric indicator based on copper nanoparticles. Front. Sustain. Food Syst. 8:1454082. doi: 10.3389/fsufs.2024.1454082
Edited by:
Debabandya Mohapatra, Indian Council of Agricultural Research (ICAR), IndiaReviewed by:
Vaibhavkumar Mehta, Navsari Agricultural University, IndiaLuciano Gebler, Brazilian Agricultural Research Corporation (EMBRAPA), Brazil
Copyright © 2024 Sheikh and Shekarchizadeh. This is an open-access article distributed under the terms of the Creative Commons Attribution License (CC BY). The use, distribution or reproduction in other forums is permitted, provided the original author(s) and the copyright owner(s) are credited and that the original publication in this journal is cited, in accordance with accepted academic practice. No use, distribution or reproduction is permitted which does not comply with these terms.
*Correspondence: Hajar Shekarchizadeh, U2hla2FyY2hpemFkZWhAaXV0LmFjLmly
†ORCID: Hajar Shekarchizadeh, "https://orcid.org/0000-0001-5402-2414