 Oznur Oztuna Taner
- Scientific and Technological Application and Research Center, Aksaray University, Aksaray, Türkiye
This study provides a comprehensive analysis of the thermal and exergy characteristics of a dairy plant that produces yoghurt. This study aims to perform a comprehensive analysis of the thermal and exergy aspects of a dairy facility that produces yoghurt. This study also seeks to improve the accuracy of the results by evaluating the reliability of the energy and production data. A comprehensive analysis of energy and exergy is utilized to enhance the yoghurt production process. Moreover, the Grassmann-Sankey diagram is employed to produce a map of energy density. The process’s energy and exergy efficiencies were assessed by taking into account the enhancements and alterations made in addition to the existing implementations. Analysis of the yoghurt production process revealed that the total energy input was 113.9 [kW], the total energy output was 72.05 kW as well and the energy efficiency was 63.3%. The exergy input and output for the yoghurt production process were calculated to be 48.95 [kW] and 29.77 [kW], and the exergy efficiency was determined to be 60.8%. This study is expected to promote the growth of livestock and agriculture in the energy sector, and is forecasted to act as a catalyst for future research. This study, which is the first of its kind in the region and is expected to stimulate further research, reveals that improving energy efficiency and conservation in the production of yoghurt products enhances the factory’s overall energy efficiency.
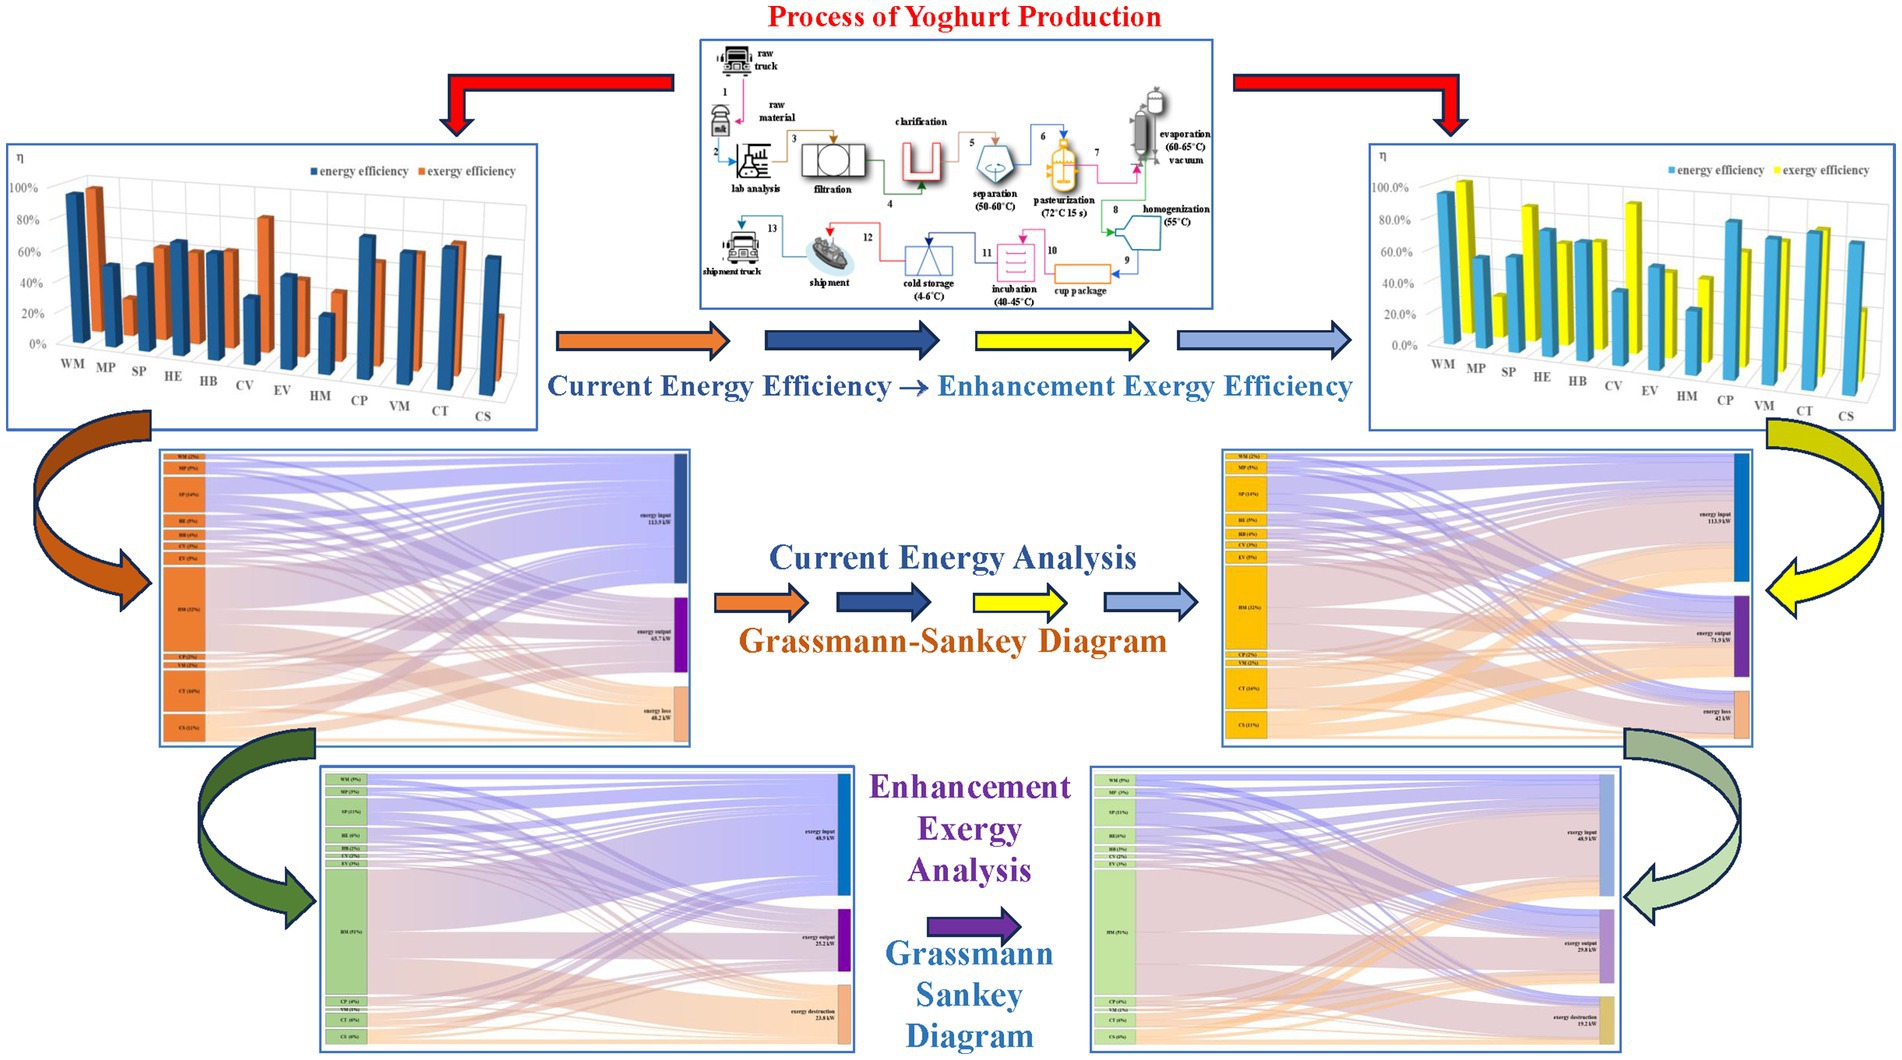
Graphical Abstract.
1 Introduction
Dairy plants exhibit a correlation between their total production volume and the amount of energy used in their energy analysis. Energy quantities were deducted from the production and energy data, and the factory efficiency and exergy analysis are presented. Evaluating the energy consumption in relation to the mass of dairy products is crucial. Moreover, the exergy amounts, efficiencies, and potential energy savings of the factory were determined. Heat transfer and electrical energy usage are significant factors in the production of raw milk. The exergy efficiency was determined by applying the second law of thermodynamics. The profitability of the milk factory and its products can be assessed by subtracting exergy expenses. This study stands out from recent research because of the extensive inclusion of dairy products. Numerous studies have been conducted in the recent years. Alternative forms of energy are likely to support green energy, as they will serve as a model for future research in this field.
Studies in the literature have focused on exergy and thermal analysis of milk and dairy product production processes. Within this broad scope, various studies have focused on the additional facilities found in milk and dairy products. A summary of these studies in the literature can be described as follows:
Saucedo-Velázquez et al. (2023) focused on designing a refrigeration system for milk storage. Utilizing a pre-existing well as a geothermal heat source was suggested for running an absorption chiller. The proposal underwent an economic analysis and was compared with solar and conventional systems. Kaviani et al. (2022) employed pinch technology to enhance energy efficiency in milk powder production. The preferred situation and modeling assumptions were also included. Singh et al. (2021) examined the significant thermal and electrical energy usage by conducting energy, exergy, and life cycle assessments for a thorough powder production analysis. They also evaluated exergy efficiency, specific exergy destruction, and specific exergy enhancement potential.
Ahammed et al. (2018) emphasized the analysis of simultaneous pasteurization and cooling of milk in a dairy plant using various configurations of internal heat exchangers in the flow line, along with a regenerative milk heat exchanger for heat recovery. Bergamini et al. (2021) demonstrated that the bridging framework is a robust tool that offers valuable insights for analysts when making decisions related to retrofitting process operations and heat exchanger grids in a powdered milk plant. Mojarab Soufiyan and Aghbashlo (2017) observed that the steam generator was the main contributor to the specific exergy destruction of pasteurized yoghurt drink production, followed by sub-zero refrigeration, milk reception, pasteurization, and standardization lines. The current study has the capacity to substantially enhance the sustainability and productivity of dairy processing facilities. The study unequivocally showed that exergy analysis is effective in identifying irreversibility and losses in dairy processing plants and in enhancing their thermodynamic performance.
Oliveira et al. (2021) suggested that bio-circular strategies could alleviate environmental pressure in the dairy sector by enhancing production and consumption practices. Several studies have evaluated dairy systems using individual methods that fail to encompass all sustainability viewpoints. The analysis involves life cycle assessment to pinpoint critical areas and suggest practical enhancements for the specific case study being examined. Two points were identified to analyze economics and efficiency. Technological advancements have resulted in minimal emissions and decreased adverse effects on the environment (Oliveira et al., 2021). Some studies suggest that incorporating solar energy as an auxiliary power source in milk production can significantly enhance energy efficiency (Esen et al., 2007; Khan et al., 2022a,b; Jafaryani Jokandan et al., 2015; Ranjan and Kaushik, 2014; Vutukuru et al., 2019).
Shokouhifar et al. (2024) emphasized the diverse methodologies employed in addressing the issue of yoghurt production through exergy analysis. The primary objective was to reduce the overall exergy consumption across the supply chain, taking into account the expenses related to maintaining product quality. To evaluate the quality of raw materials at the factory and ensure the quality of products at distribution centers (Shokouhifar et al., 2024). Husnain et al. (2022) conducted an energy and exergy based thermal analysis of a solar assisted yoghurt processing unit. This unit is capable of performing both heating and cooling processes in a single container. The system comprised a circular fermentation chamber linked to a hot water storage tank, along with an evacuated tube collector and a pillow plate at the chamber’s base for cooling via a photovoltaic-powered refrigeration unit. The study provides valuable insights for developing optimization strategies based on the energy distribution and losses across different components of the system (Husnain et al., 2022).
This study also addresses the energy-intensive evaporation process in milk production, aiming to enhance efficiency and reduce negative environmental impacts. Azzaro-Pantel et al. (2022) investigated the evaporation process during milk production. Both the economic and design aspects of food processes are becoming increasingly important for achieving sustainability in the food industry. The milk evaporation process, known for its high energy consumption in the milk production industry, has significant potential for improvement through the integration of cost and life cycle analyses (Azzaro-Pantel et al., 2022). The life cycle assessment method developed by Queiroz et al. (2020) can aid this study by enabling the comparison of various scenarios related to biomass. The life cycle approach can be used to assess the energy and exergy levels in milk and dairy production (Huysveld et al., 2015). When producing milk and dairy products, advancements in innovative processes can be effectively achieved by considering energy, exergy, thermal, electric, and environmental factors (Aghaei and Saray, 2021; Başaran et al., 2021; Başaran et al., 2023; Bühler et al., 2018; Mehrabadi and Boyaghchi, 2019; Mojarab Soufiyan et al., 2017; Oliveira et al., 2022; Singh et al., 2019a; Sorgüven and Özilgen, 2012; Yildirim and Genc, 2017). This study enhanced energy consumption, production values, and plant efficiency by analyzing data accuracy, reliability, and conducting SPPS analysis on plant data. Exergy and thermal analyses were performed on these data. Raw material and exergy calculations were performed, starting from the plant inlet. This study introduced the exergy efficiency and thermal analysis of a plant involved in milk and dairy product production as a new aspect. The exergy efficiency calculation focused on energy conservation.
2 Materials and methods
An evaluation of the dairy factory production process was conducted, beginning with the intake of raw materials and concluding with packaging, storage, and shipping. To compute using thermodynamics, methods have been developed using precise data on energy usage, energy effectiveness, and milk and product output. The Cappadocia dairy factory produces yoghurt, butter, ayran, white, cheddar, curd, and tulum cheeses. This study observed the energy and exergy conditions in the yoghurt process, which is the most produced yoghurt in the factory. The milk and dairy product production department utilizes a large amount of energy and controls humidity. Fluid mechanics control the fluid flow in milk and byproduct piping systems between vessels and heaters. The tube boiler and piping are premium stainless steels. Dairy factories process raw milk in steps. These steps include separation, pasteurization, cooling, calcium chloride addition, starter culture introduction, the clot technique, pre-maturation, fermentation, portioning, the brine technique, packaging, storage, ripening, and shipping. Milk and its byproducts vary by product, and are linked to energy-intensive machinery. This study presents energy-efficient instances by exploring various optimizations through case studies [Nathaphan and Therdyothin, 2023; The Union of Chambers and Commodity Exchanges of Turkey (UCCET): Industry Directorate, 2023].
As shown in Figure 1, yoghurt products are initiated by acquiring raw milk, which undergoes laboratory analyses to assess its quality. In the dairy product factory, 13 process steps were demonstrated for the production of yoghurt. The milk was then purified using filtration and precipitation to remove contaminants. Milk standardized by separation was pasteurized at 72 [°C] for 15 [s], contingent on the fat level of the outcome (fat types). The milk is then processed in an evaporator to regulate the dry matter content by removing excess water under vacuum at 60–65 [oC]. The milk was homogenized, placed in containers, and incubated at 42–45 [°C] with yoghurt culture. Yogurt is ultimately moved to refrigerated storage and then delivered to the consumer (Guyot and Kulozik, 2011).
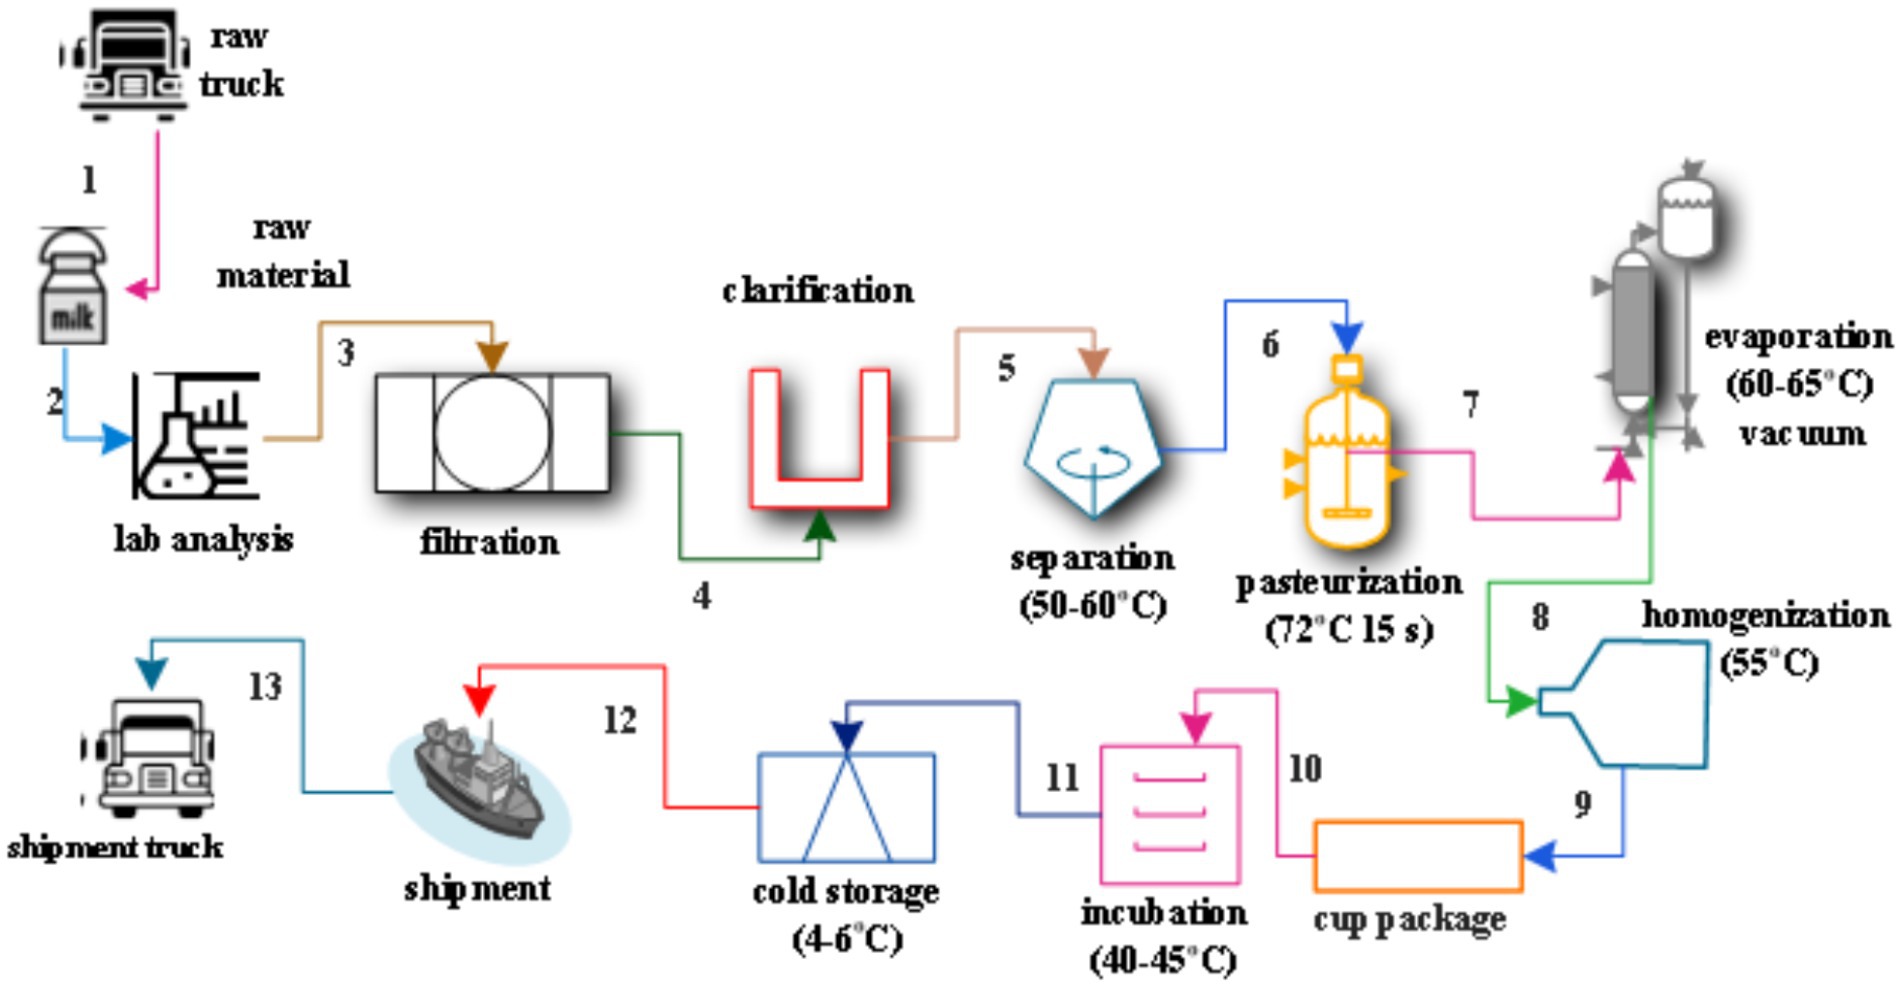
Figure 1. Process flow diagram of yoghurt products by drawing engineering symbol (Bicenler Dairy Factory process).
Another study explored how heating ovine (sheep) milk at various temperatures affects the composition and taste of yoghurt. The study discovered that subjecting yoghurt to lower temperatures led to increased levels of specific proteins and improved preservation of the milk’s functional and nutritional qualities (Zamberlin et al., 2010). Several studies have analyzed how different milk processing methods affect yoghurt characteristics. Preheating milk at 85, 90, or 95°C for 20 min with ropy starter cultures resulted in shorter fermentation times and improved functional properties when compared to non-ropy starter cultures (Lorenzen et al., 2003). Various ratios of goat and sheep milk blends have been identified as appropriate for producing high-quality yoghurt (Stelios and Emmanuel, 2004).
There are limited energy and exergy analyses in the literature on the production of milk and milk products. This study addresses the deficiency and uncovers the exergy cost and reveals the profitability of the factory through the application of thermal and exergy analysis of the yoghurt process. Data reliability and uncertainty analyses of the measuring devices and other process parameters were also established through statistical analysis.
2.1 Analysis of the energy and exergy of the process
To evaluate the effectiveness of milk and product processing, it is crucial to formulate the thermodynamic equations necessary to conduct the energy and exergy analyses of the entire facility. Thirteen process steps served as inputs and outputs for yoghurt production in the dairy factory. Each process was schematically modeled based on mass balance. Thus, these procedures can be represented as a sequential diagram for evaluating the exergy analysis of the facility, as depicted from Figures 2–5.
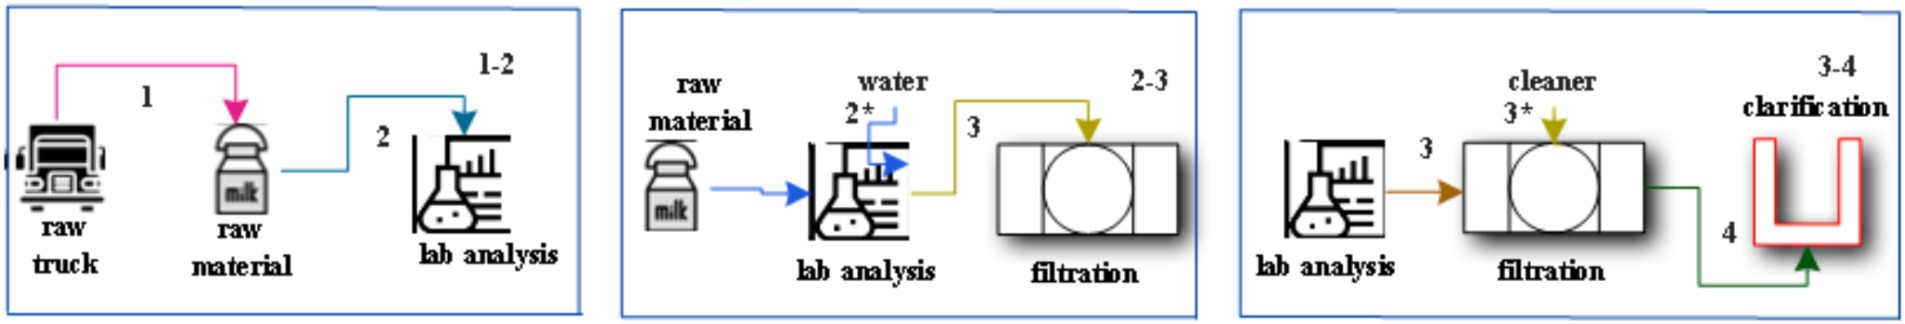
Figure 2. Process of the raw material-lab analysis (1–2), the raw material-filtration (2–3), and the lab analysis-clarification (3–4) for the factory.
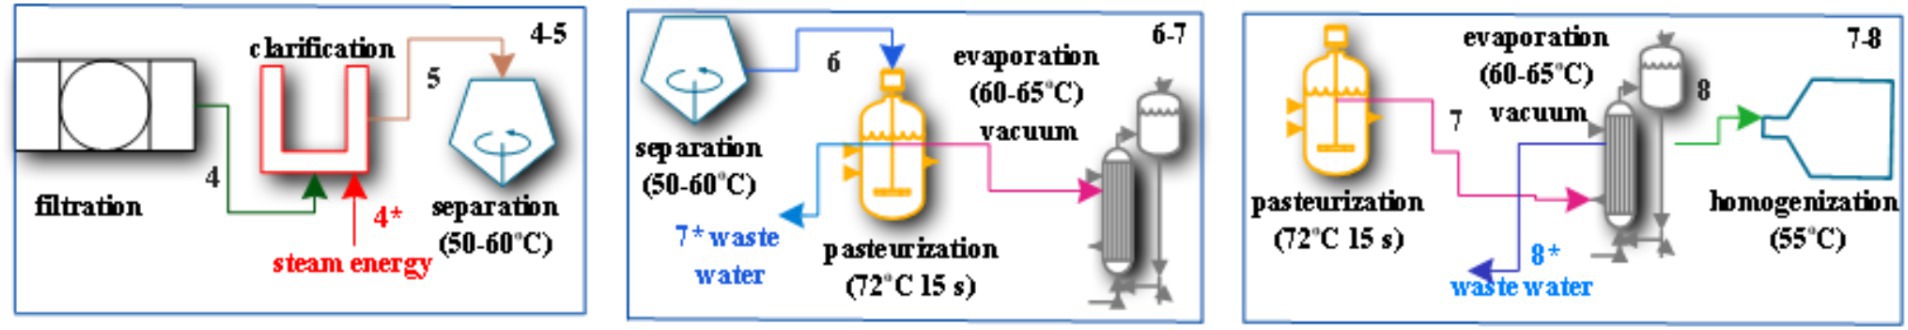
Figure 3. Process of the filtration-separation (4–5), the separation-evaporation (6–7), and the pasteurization-homogenization (7–8) for the factory.
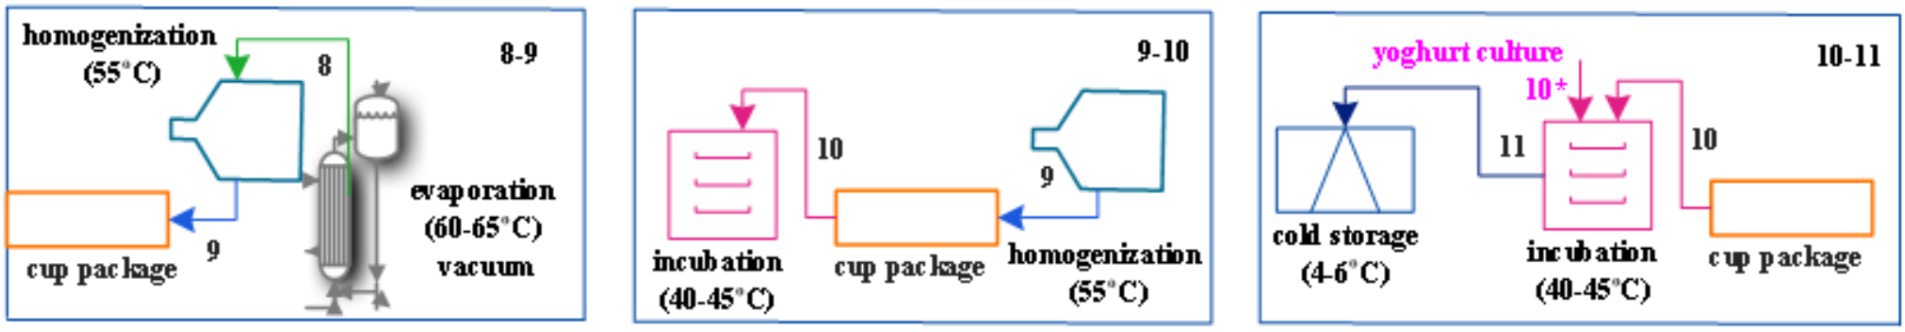
Figure 4. Process of the evaporation-cup package (8–9), the homogenization-incubation (9–10), and the cup package-cold storage (10–11) for the factory.
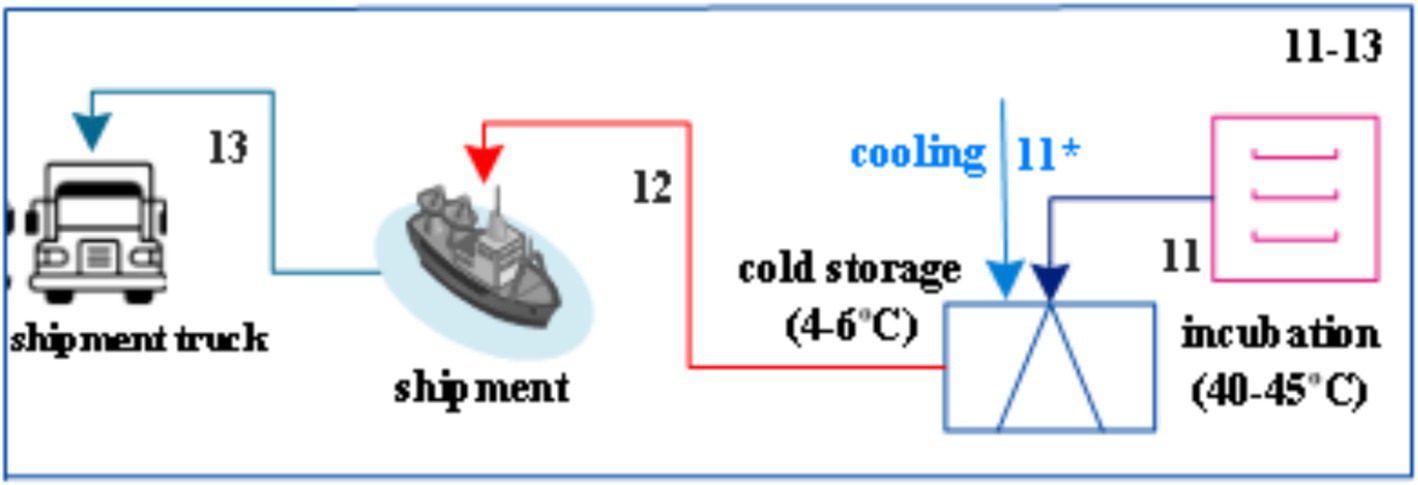
Figure 5. Process of the incubation-cold storage (11–12), and the cold storage-shipment (12–13) for the factory.
Figure 2 indicates the process of raw material, lab analysis, filtration, and clarification from processes 1 to 4. In addition, the lab analysis utilizes water for the analysis of milk in process 2*, as the cleaner can be applied to the filtration process 3* of the filter apparatus.
Figure 3 illustrates the sequential steps of filtration, clarification, separation, evaporation, pasteurization, homogenization, and clarification in processes 4–8. In addition, the clarification process requires steam for the clarification of milk in process 4*, as the wastewater is disposed of in the evaporation process 8*.
Figure 4 emphasizes the processes of evaporation, homogenization, cup packaging, incubation, and cold storage from process 8 to process 11. During the incubation phase, the final step involved the addition of yoghurt culture (process 10*).
Figure 5 shows the processes of incubation, cold storage, and shipment from process 11 to process 13. Following the incubation process, yoghurt was cooled in cold storage. This was achieved using cooling techniques. Finally, yoghurt is transported by truck, marking the last step in the production of yoghurt products.
Yoghurt production stages and processes (1–13) were constructed and analyzed prior to thermodynamic calculations. Prior to performing calculations utilizing thermodynamic equations, certain assumptions were made regarding a yoghurt factory, as follows (Başaran et al., 2021; Cengel et al., 2019; Jafaryani Jokandan et al., 2015; Mojarab Soufiyan and Aghbashlo, 2017; Wang, 2009); (i) The whole plant and its parts are in a dead state condition, (ii) The boiler assumes that the combustion gases entering and exiting are ideal gas mixtures, (iii) The combustion of natural gas in the steam generation system is considered a total chemical reaction, (iv) The steady-state temperature was considered to be 25°C, while the pressure was implicit at 1 atm, (v) The kinetic and potential energy magnitudes of the total energy and exergy are disregarded, and (vi) The change in ambient temperature was disregarded.
The energy and exergy efficiencies of the factory yoghurt production process were determined by applying the principles of the first and second laws of thermodynamics, based on the assumptions provided above. The analysis of mass balance and energy conservation equations is conducted (Başaran et al., 2021; Cengel et al., 2019; Jafaryani Jokandan et al., 2015; Mojarab Soufiyan and Aghbashlo, 2017; Wang, 2009).
The dead state is typically defined by the conditions of 25 [°C] temperature and 1 [atm] pressure. Mass conservation in the control volume is maintained when the quantity of the input mass is equivalent to the quantity of the output mass. The mass balance equation is formulated as follows (Aghbashlo et al., 2013; Başaran et al., 2021; Cengel et al., 2019; Jafaryani Jokandan et al., 2015; Mojarab Soufiyan and Aghbashlo, 2017; Wang, 2009):
The first law of thermodynamics states that the left side of the equation represents the rate at which work, mass, heat, and energy are transferred, whereas the right side represents the change in internal, kinetic, and potential energies. The system is adiabatic owing to its continuous-flow open system and efficient insulation. Both the work and heat transfer are zero because no work is performed and the system is adiabatic. The energy balance is given by Equations 2–4 (Aghbashlo et al., 2013; Başaran et al., 2021; Cengel et al., 2019; Wang, 2009).
The energy input and output can be determined using Equations 5, 6 as follows (Aghbashlo et al., 2013; Başaran et al., 2021; Cengel et al., 2019; Wang, 2009):
The study of the exergy losses that flow into and out of the control volume allows for the determination of the exergy loss of the system. Initially, the exergy inputs and outputs were computed. The potential and kinetic energies were disregarded because of their insignificance. The general exergy is established based on the control volume scheme outlined in Equation 7 as follows (Aghbashlo et al., 2013; Başaran et al., 2021; Cengel et al., 2019; Wang, 2009):
The exergy input and output can be obtained using Equations 8, 9 as follows (Aghbashlo et al., 2013; Başaran et al., 2021; Cengel et al., 2019; Wang, 2009):
The exergy loss (irreversibility) in adiabatic processes can be assessed by comparing the exergy input and output differences, which indicate the absence of work. The exergy loss is demonstrated in Equation 10 as follows (Aghbashlo et al., 2013; Başaran et al., 2021; Cengel et al., 2019; Wang, 2009):
Net energy flow and exergy equations were employed in all the process simulations. The flow exergy equations for air and steam are specified in Equation 11 as follows (Başaran et al., 2021; Cengel et al., 2019; Jafaryani Jokandan et al., 2015; Mojarab Soufiyan and Aghbashlo, 2017; Wang, 2009):
Therefore, the specific enthalpy (h), entropy (s), and exergy (φ) can be represented by Equations 12–14 as follows (Aghbashlo et al., 2013; Başaran et al., 2021; Cengel et al., 2019; Wang, 2009):
Energy and exergy analyses were conducted using data from each part of the manufacturing process to assess the efficiencies of the 1st and 2nd Laws of Thermodynamics. The definitions of energy and exergy efficiencies are provided in Equation 15, 16 as follows (Aghbashlo et al., 2013; Başaran et al., 2021; Cengel et al., 2019; Wang, 2009):
2.2 Analysis of thermal and electrical energy processes
The total energy consumption was determined by measuring the amount of thermal and electrical energy employed by the machinery and equipment during the factory process. Moreover, the process involves collecting data and measurements from the factory, which includes estimating the thermal and electrical energy consumption of all the machinery and equipment. This study analyzed and assessed the thermal and electrical energy utilization of each specific yoghurt production process within a factory. The homogenizer, yoghurt packaging machine, cooling tank, cold store, separation device, heat exchanger, and evaporator machine supply thermal and electrical energy to the machinery and equipment. Electrical and thermal energy are utilized in various components of the yoghurt production process, including process tanks, heating boilers, cooking boilers, compressors, vacuum machine cooling units, weighing machines, churning machines, and yoghurt filling machines.
The total power () of the processes involving electric energy was computed using Equation 17–20 as described below (Aghbashlo et al., 2013; Başaran et al., 2021; Cengel et al., 2019; Wang, 2009):
The energy efficiency () can be applied according to the 1st Law of Thermodynamics, which is computed from Equations 21–24 (Aghbashlo et al., 2013; Başaran et al., 2021; Cengel et al., 2019; Wang, 2009):
The energy efficiency, denoted as can be assessed by applying the principles of the 1st Law of Thermodynamics. The numerical values for are based on Equation 21–24 as mentioned as follows (Aghbashlo et al., 2013; Başaran et al., 2021; Cengel et al., 2019; Wang, 2009):
Furthermore, this study includes a scrutiny of the energy and exergy of the yoghurt production process as well as an analysis of the thermal and energy usage in the factory. The thermal and electrical energy results were provided based on the data and measurements.
2.3 Uncertainty analysis of production data and equipment
Uncertainty analysis, which indicates the precision of the measured data, is useful for the analysis of production data and tools (Öztuna Taner, 2023; Beck et al., 2023; Rajendran and Han, 2023; Jing et al., 2022; Zhang et al., 2022; Siddique et al., 2023; Zheng et al., 2022; Tan and Zhang, 2018; Li et al., 2019). To enhance confidence in the data analysis, it was imperative to conduct an uncertainty analysis of the gathered measurements. The provided Equation 25 demonstrates the level of uncertainty in both the systematic and predictive components of the data, as indicated as follows (Öztuna Taner, 2023; Rajendran and Han, 2023; Jing et al., 2022; Li et al., 2019).
Furthermore, uncertainty analysis can be utilized to derive an analytical equation for the error in energy measurement. The uncertainty analysis method outlines the expected outcomes or proposes a data strategy based on Equation 26–28 (Bobovnik and Kutin, 2023; Figliola and Beasley, 2015; Öztuna Taner, 2023). To illustrate, if the margin of error in a measurement of 100 is ±1, the relative uncertainty is (1/100) × 100 = 1%. Equation 29 provides the proportion of uncertainty in the experimental results, as follows (Rajpoot et al., 2024):
Table 1 contains a sensor that functions as a direct-current power source with the ability to adjust the voltage and regulate the current. Additionally, it includes a flow meter, a pressure meter, and a type-T thermocouple. The level of uncertainty in relation to other measurements is determined by the accuracy and precision of the data and readings. The relative sense uncertainty was obtained for a DC power source with adjustable voltage and current regulation measured as (voltage) − (current), a flow meter measured as (mass flow), a pressure meter measured as (pressure), and a type T thermocouple measured as (temperature). These values agree with the results of the uncertainty analysis.
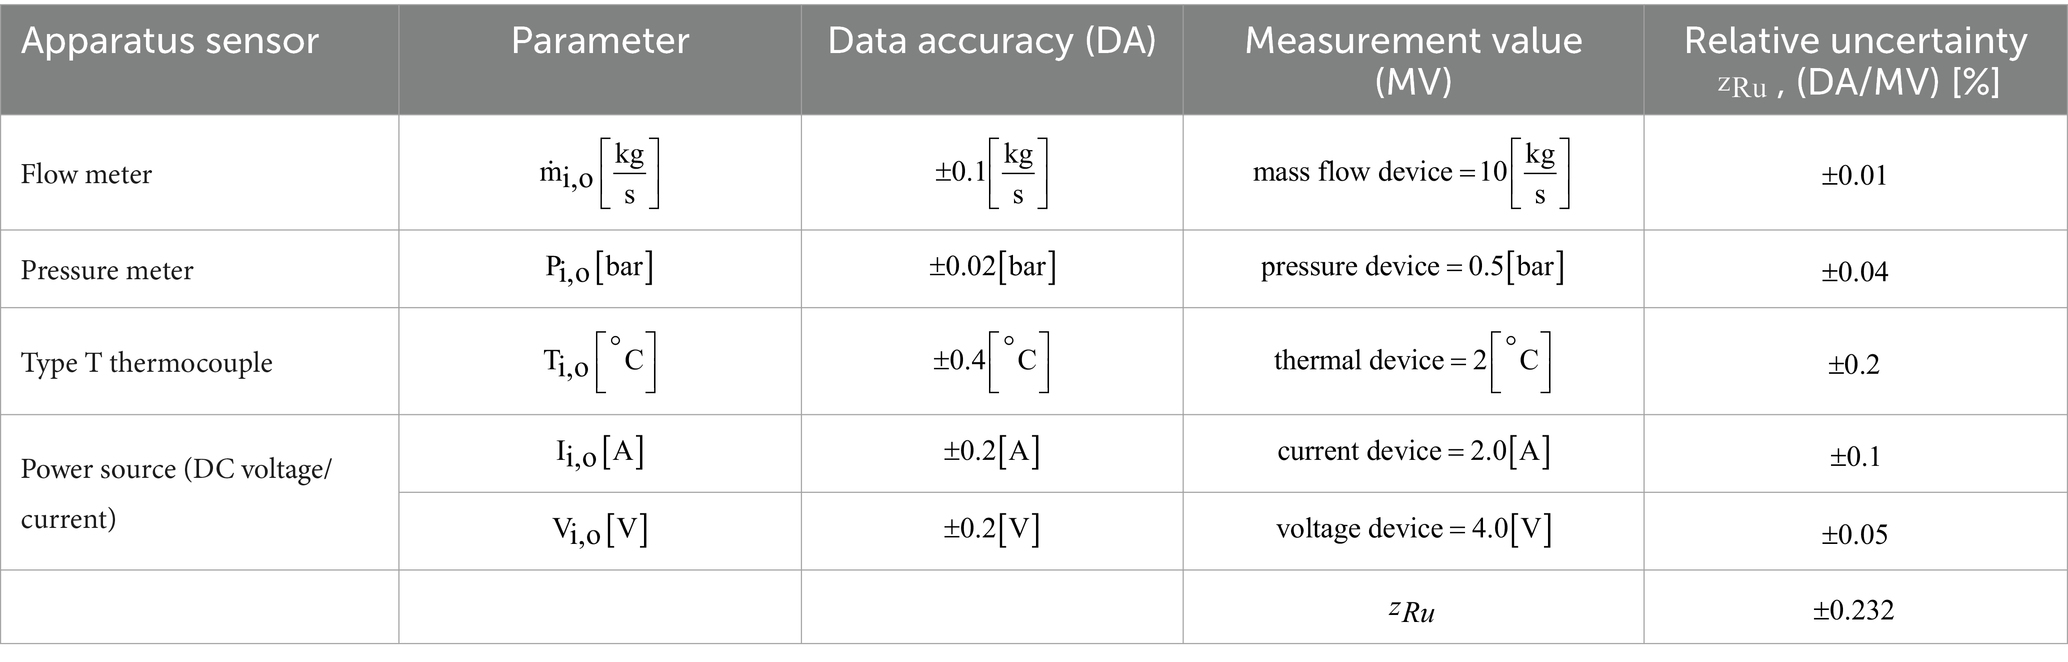
Table 1. Assessment of experimental apparatus’s relative error and result uncertainty.
Table 1 displays the equipment sensor functioning as a direct current (DC) power supply that can adjust both voltage and current. The current accuracy was measured at 2.0 A, whereas the voltage precision was measured at 4.0 [V]. The relative uncertainty was calculated by dividing the data accuracy by the measured value. The voltage value has a relative error of ±0.05, whereas the current value has a relative uncertainty of ±0.10. The apparatus sensor is a type T thermocouple that measures temperature with an accuracy of ±0.4 [°C]. The internal thermal device measured 2°C, the heat-insulating wall device measured 4°C, the electricity inside the tool design measured 1°C, and the electricity wall design measured 1°C. The devices had a relative uncertainty ranging from ±0.1 to 0.2, whereas the designs had a relative uncertainty of ±0.4. The uncertainty study was based on an experiment that quantitatively assessed numerous components. An overall reliability of 99.99% was achieved by assessing the uncertainties of the four main analytical parameters. The proportional uncertainty was estimated to be ±0.232, which is a fixed value.
2.4 Energy and exergy data for the statistical analysis
Furthermore, to ensure the dependability and precision of the data in the study, a statistical method was employed to conduct an uncertainty analysis of the measuring devices and an accuracy analysis of the factory process data. Statistical analyses were performed using ANOVA. A p value less than 0.05 was considered to have statistical significance (p < 0.05). Data were analyzed and evaluated using SPSS 28.0 and Minitab 21.4.2 software. This study confirmed the dependability and mathematical representation of the scenario data through statistical methods applied to the collected and generated data (see Appendix A2).
2.5 Process analysis of yoghurt production and equations
The exergy analysis of the yoghurt process was performed according to the process steps (Figures 2–5). Depending on the parameters, thermodynamic equations are derived from the data to provide mass balance and energy analyses as well as exergy analysis equations.
Table 2 indicates that the processes of raw material-laboratory analysis (1–2), raw material-filtration (2–3), and laboratory analysis-clarification (3–4) can be used to calculate the mass balance of processes 1–4. When calculating the mass balance of filtration, clarification, separation, evaporation, pasteurization, homogenization, and clarification from processes 4 to 8, the filtration–filtration-separation (4–5), separation-evaporation (6–7), and pasteurization-homogenization (7–8) can be considered. By considering the mass balance of the evaporation, homogenization, cup packing, incubation, and cold storage processes from processes 8 to 11, the processes of evaporation-cup packing (8–9), homogenization-incubation (9–10), and cup packing-cold storage (10–11). The mass balance of the incubation, cold storage, and shipping processes from processes 11 to 13 can also determine the incubation-cold storage (11–12) and cold storage-shipping (12–13) processes.
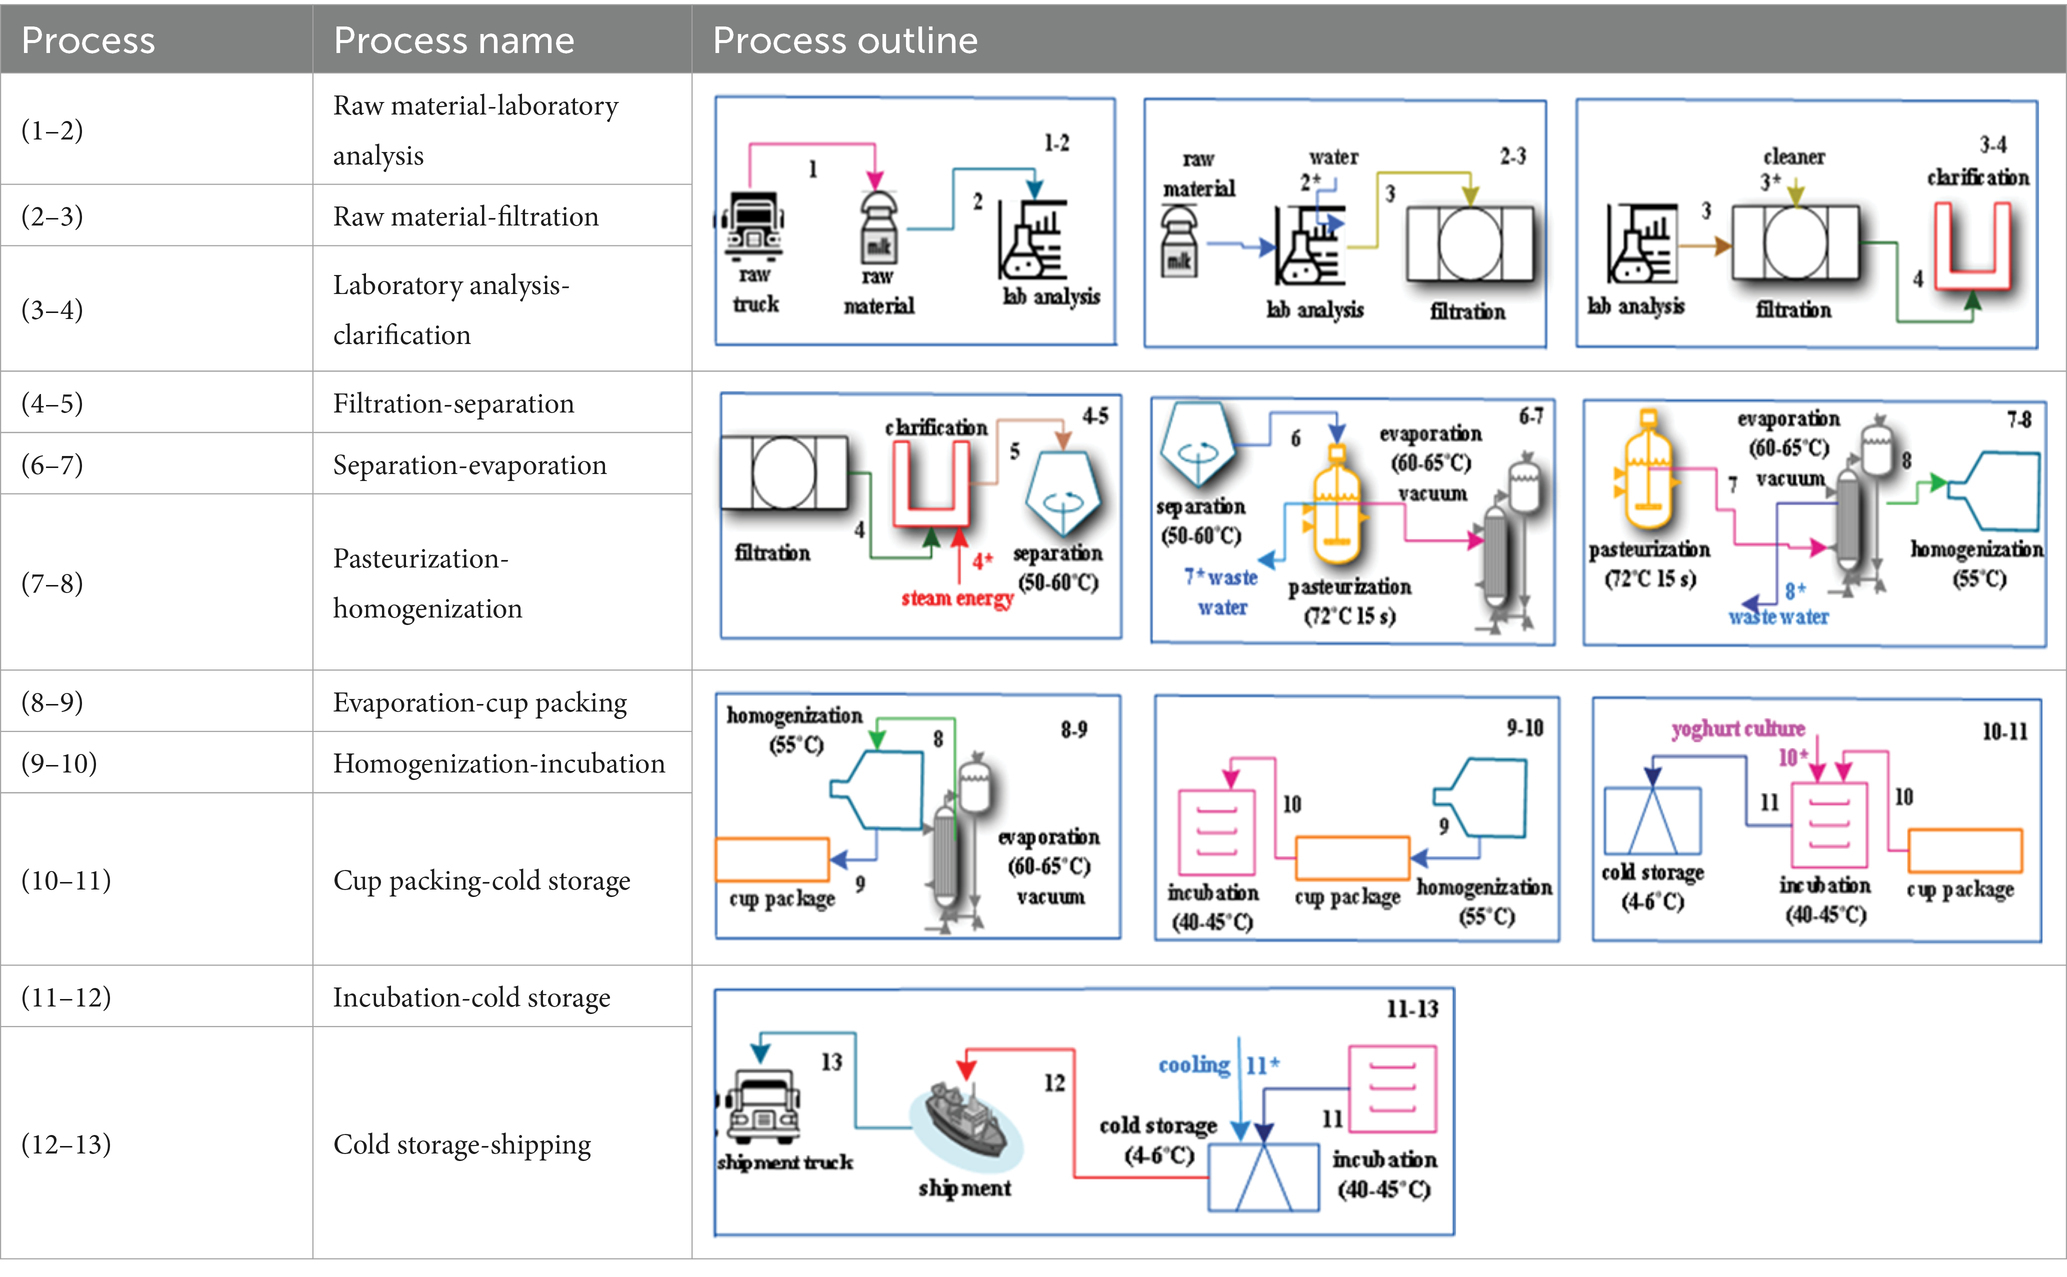
Table 2. Equations for energy and exergy in mass balance of yoghurt process.
Table 3 shows the raw material-laboratory analysis (1–2), filtration (2–3), and laboratory analysis-clarification (3–4) can be determined by thermodynamic equations. An analysis can be conducted on the energy and exergy of the processes involved in filtration, clarification, separation, evaporation, pasteurization, homogenization, and clarification from processes 4 to 8. The energy and exergy analyses of 8–11 can be categorized into three stages: evaporation-cup packing (8–9), homogenization-incubation (9–10), and cup packing-cold storage (10–11). The energy and exergy analyses of the incubation-cold storage (11–12) and cold storage-shipping (12–13) processes cover processes 11–13.
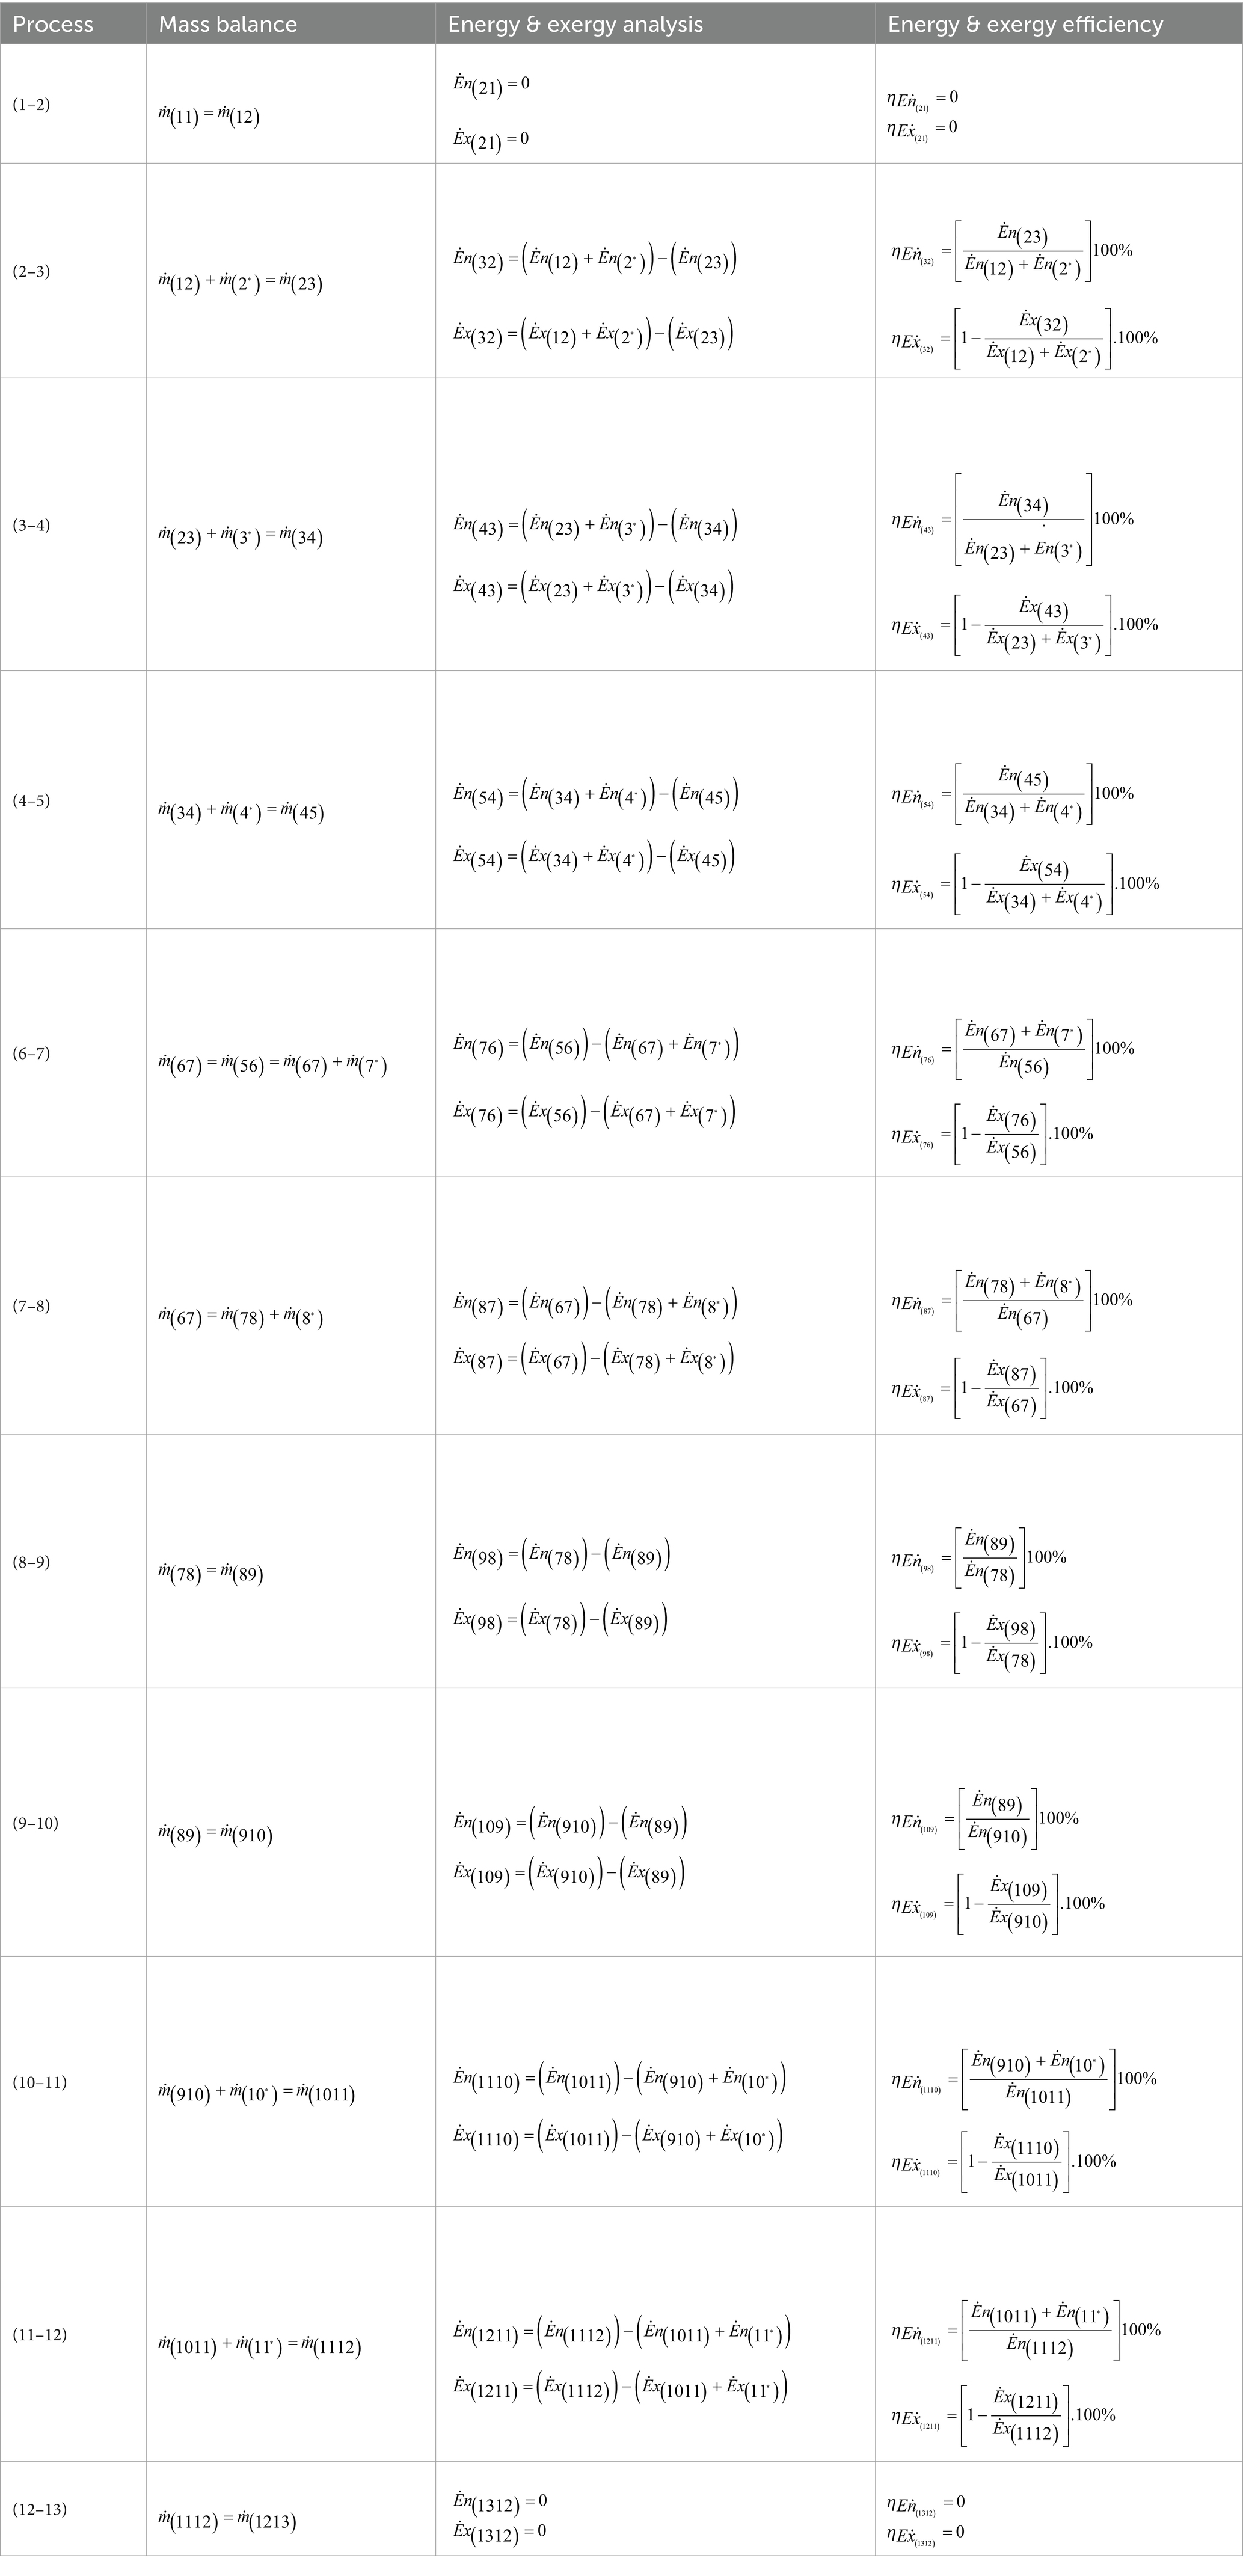
Table 3. Equations for energy and exergy analyses of the yoghurt production process in the factory.
Energy and exergy analysis equations were employed to evaluate all processes in the yoghurt production process flow diagrams, which were applied to establish mass and energy balances. By leveraging the data, scenarios were generated, and improvements were identified for the dairy factory through data computation.
3 Results and discussion
The total production in dairy and product factories influences the overall utilization of energy. Thermodynamic modeling was used to analyze the thermal efficiency of the dairy industry in this study (Heydari et al., 2021; Öztuna Taner, 2023). Dairy operations utilize thermal energy (Öztuna Taner, 2023; Solanki and Pal, 2021). An analysis was conducted to assess the factory’s energy utilization efficiency by examining statistical data on energy production and consumption at the plant. This study was conducted to analyze the relationship between energy consumption and material production to optimize the efficiency of manufacturing facilities (Öztuna Taner, 2023).
The physical exergy is considered, as chemical and fat-formation exergy are not included in the assessments, as they are negligible owing to the high production of yoghurt in the process stages in this study. Prior research has made certain assumptions when conducting energy and exergy analyses and obtaining results (Bühler et al., 2018; Jafaryani Jokandan et al., 2015; Mojarab Soufiyan and Aghbashlo, 2017; Mojarab Soufiyan et al., 2017; Öztuna Taner, 2023; Singh et al., 2019b; Singh et al., 2021). Furthermore, the equations for computing exergy for steam generation, refrigeration, pasteurization, and yoghurt production lines can be located in Appendix A.
The energy and exergy analyses of dairy milk production processes include raw material-lab analysis (1–2), raw material-filtration (2–3), lab analysis-clarification (3–4), filtration-separation (4–5), separation-evaporation (6–7), pasteurization-homogenization (7–8), evaporation-cup package (8–9), homogenization-incubation (9–10), cup package-cold storage (10–11), incubation-cold storage (11–12), and cold storage-shipment (12–13) in the factory. Furthermore, the Grassmann-Sankey diagram was employed to conduct energy and exergy analyses of the input, output, and loss (destruction) states.
3.1 Current of the energy and exergy analysis
The power computation of the machines and equipment in the factory is established based on the amount of energy consumed. The result was obtained by applying thermodynamic energy, exergy, and mass equivalent equations, specifically Equations 1–20. The equations from Equations 21–24 is particularly advantageous for calculating the power in the processes. The energy and exergy efficiencies of the yoghurt process in Table 3 were identified using the derived equations based on the process flows listed in Tables 4, 5.
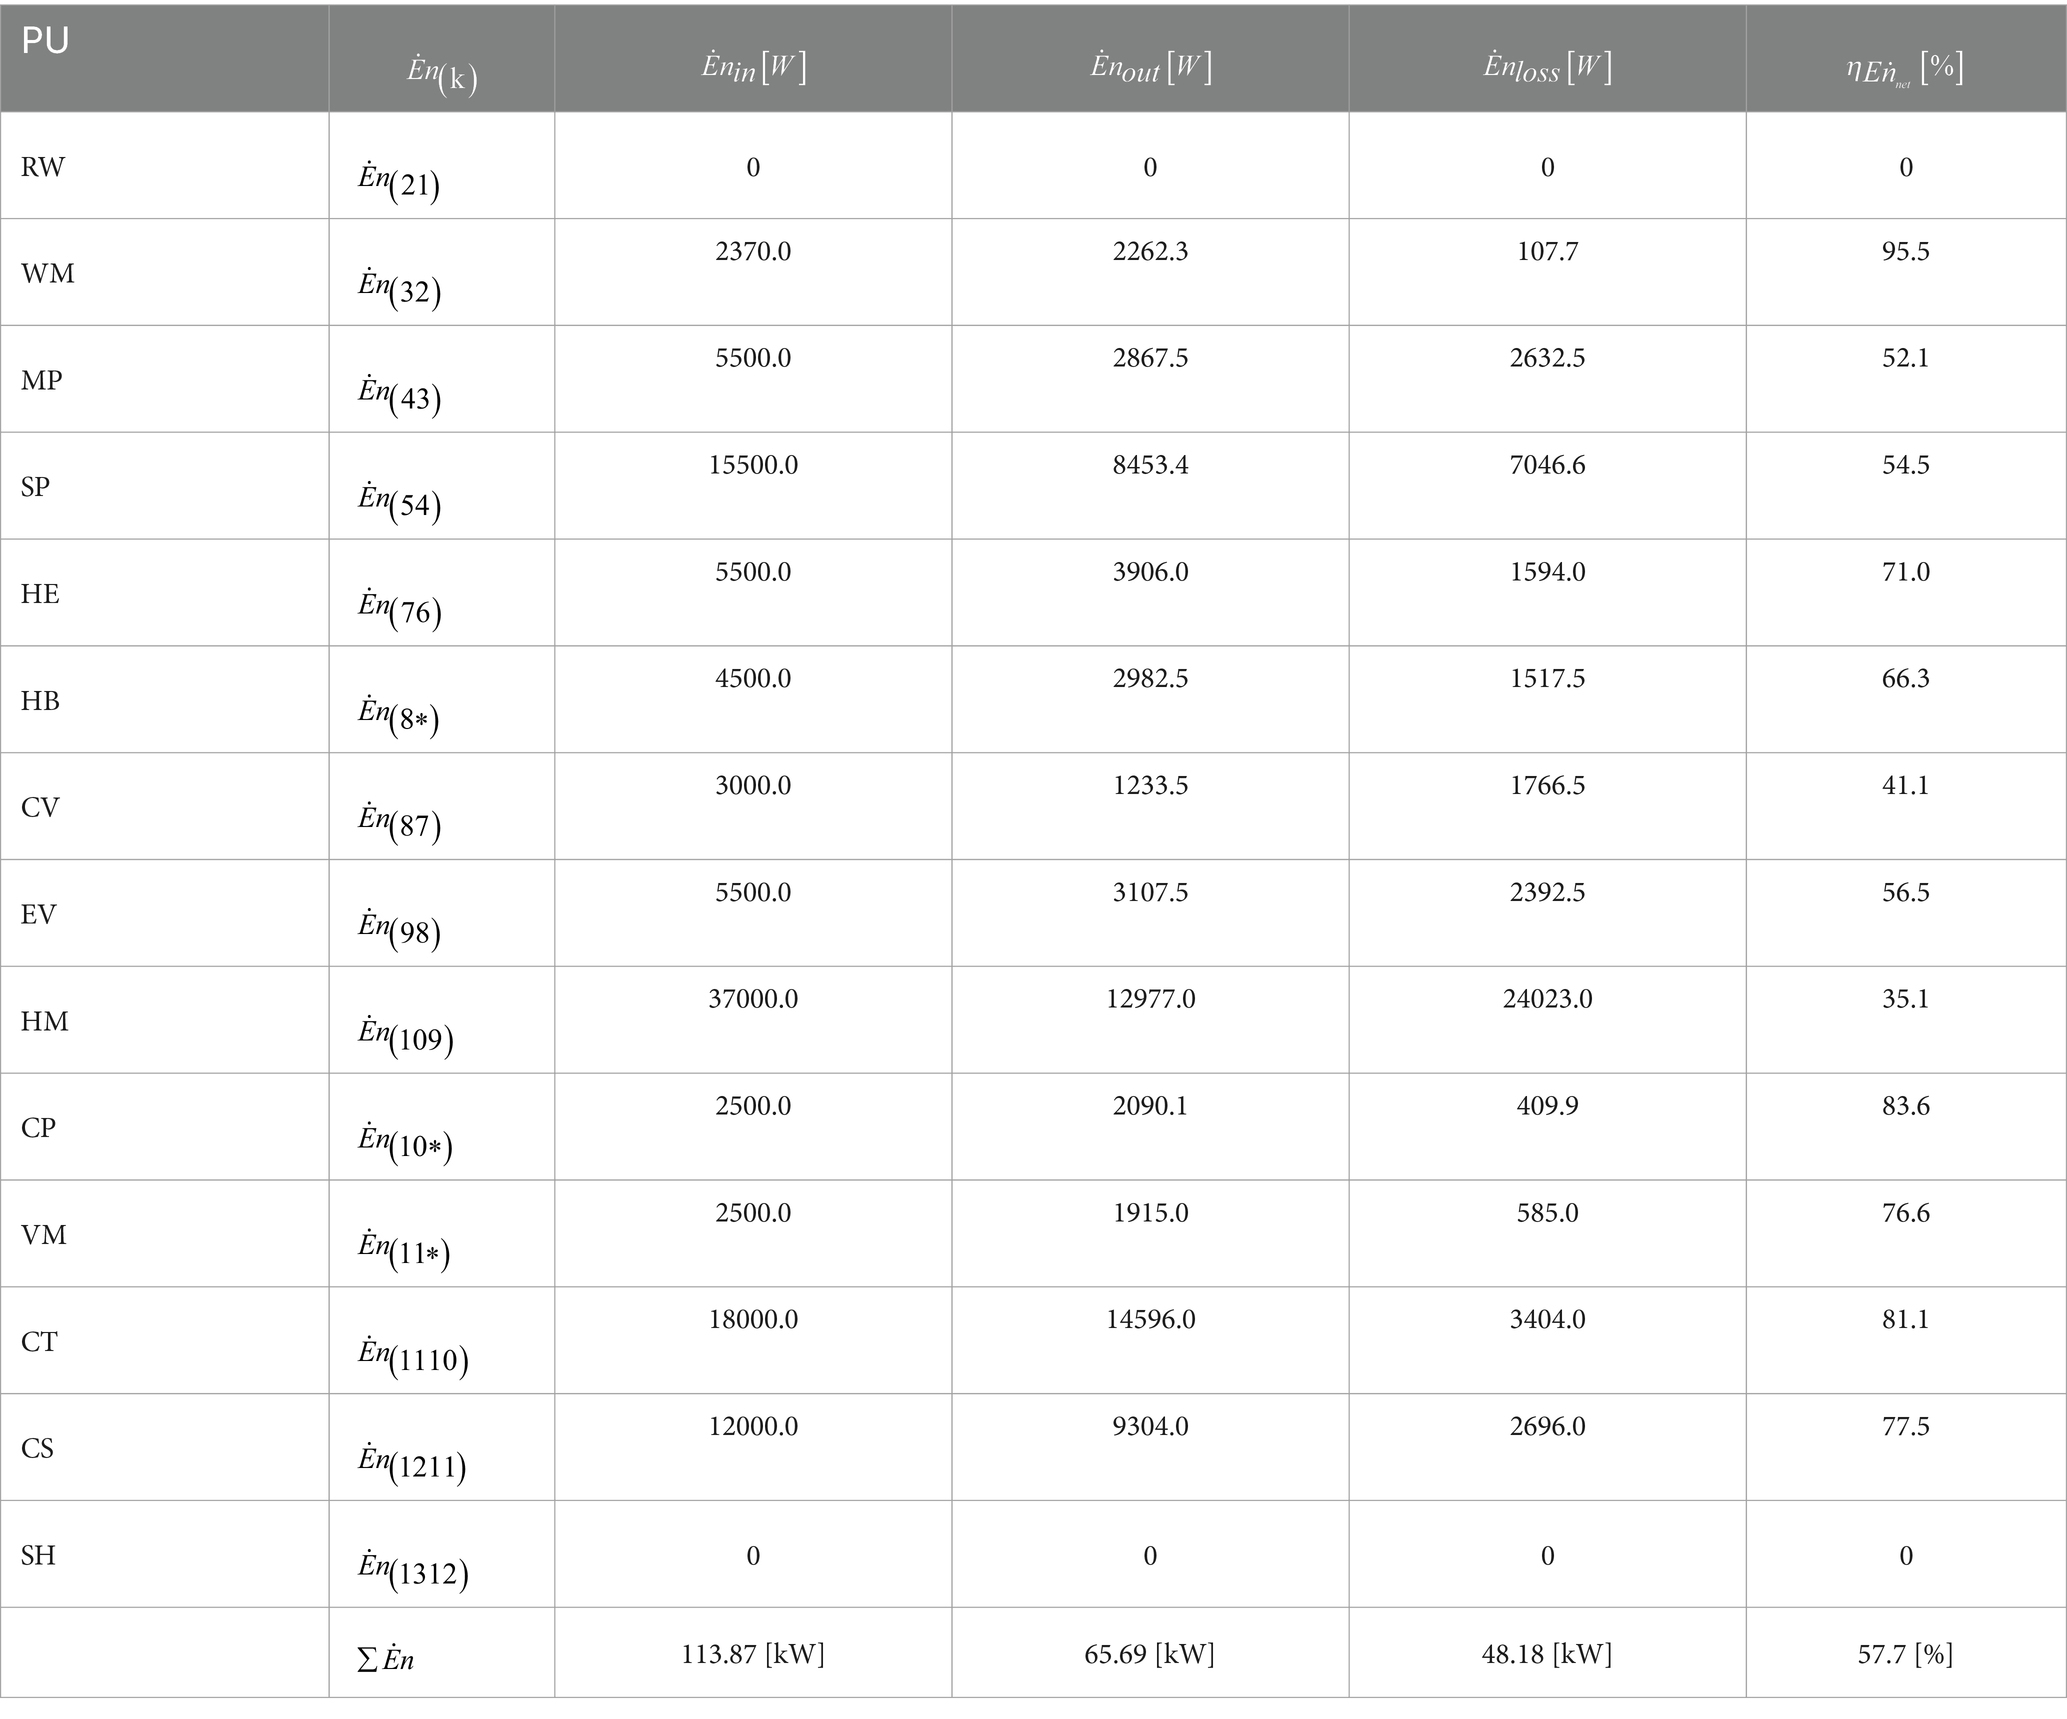
Table 4. Current results of the energy analysis for the yoghurt process at the whole of the dairy milk factory.
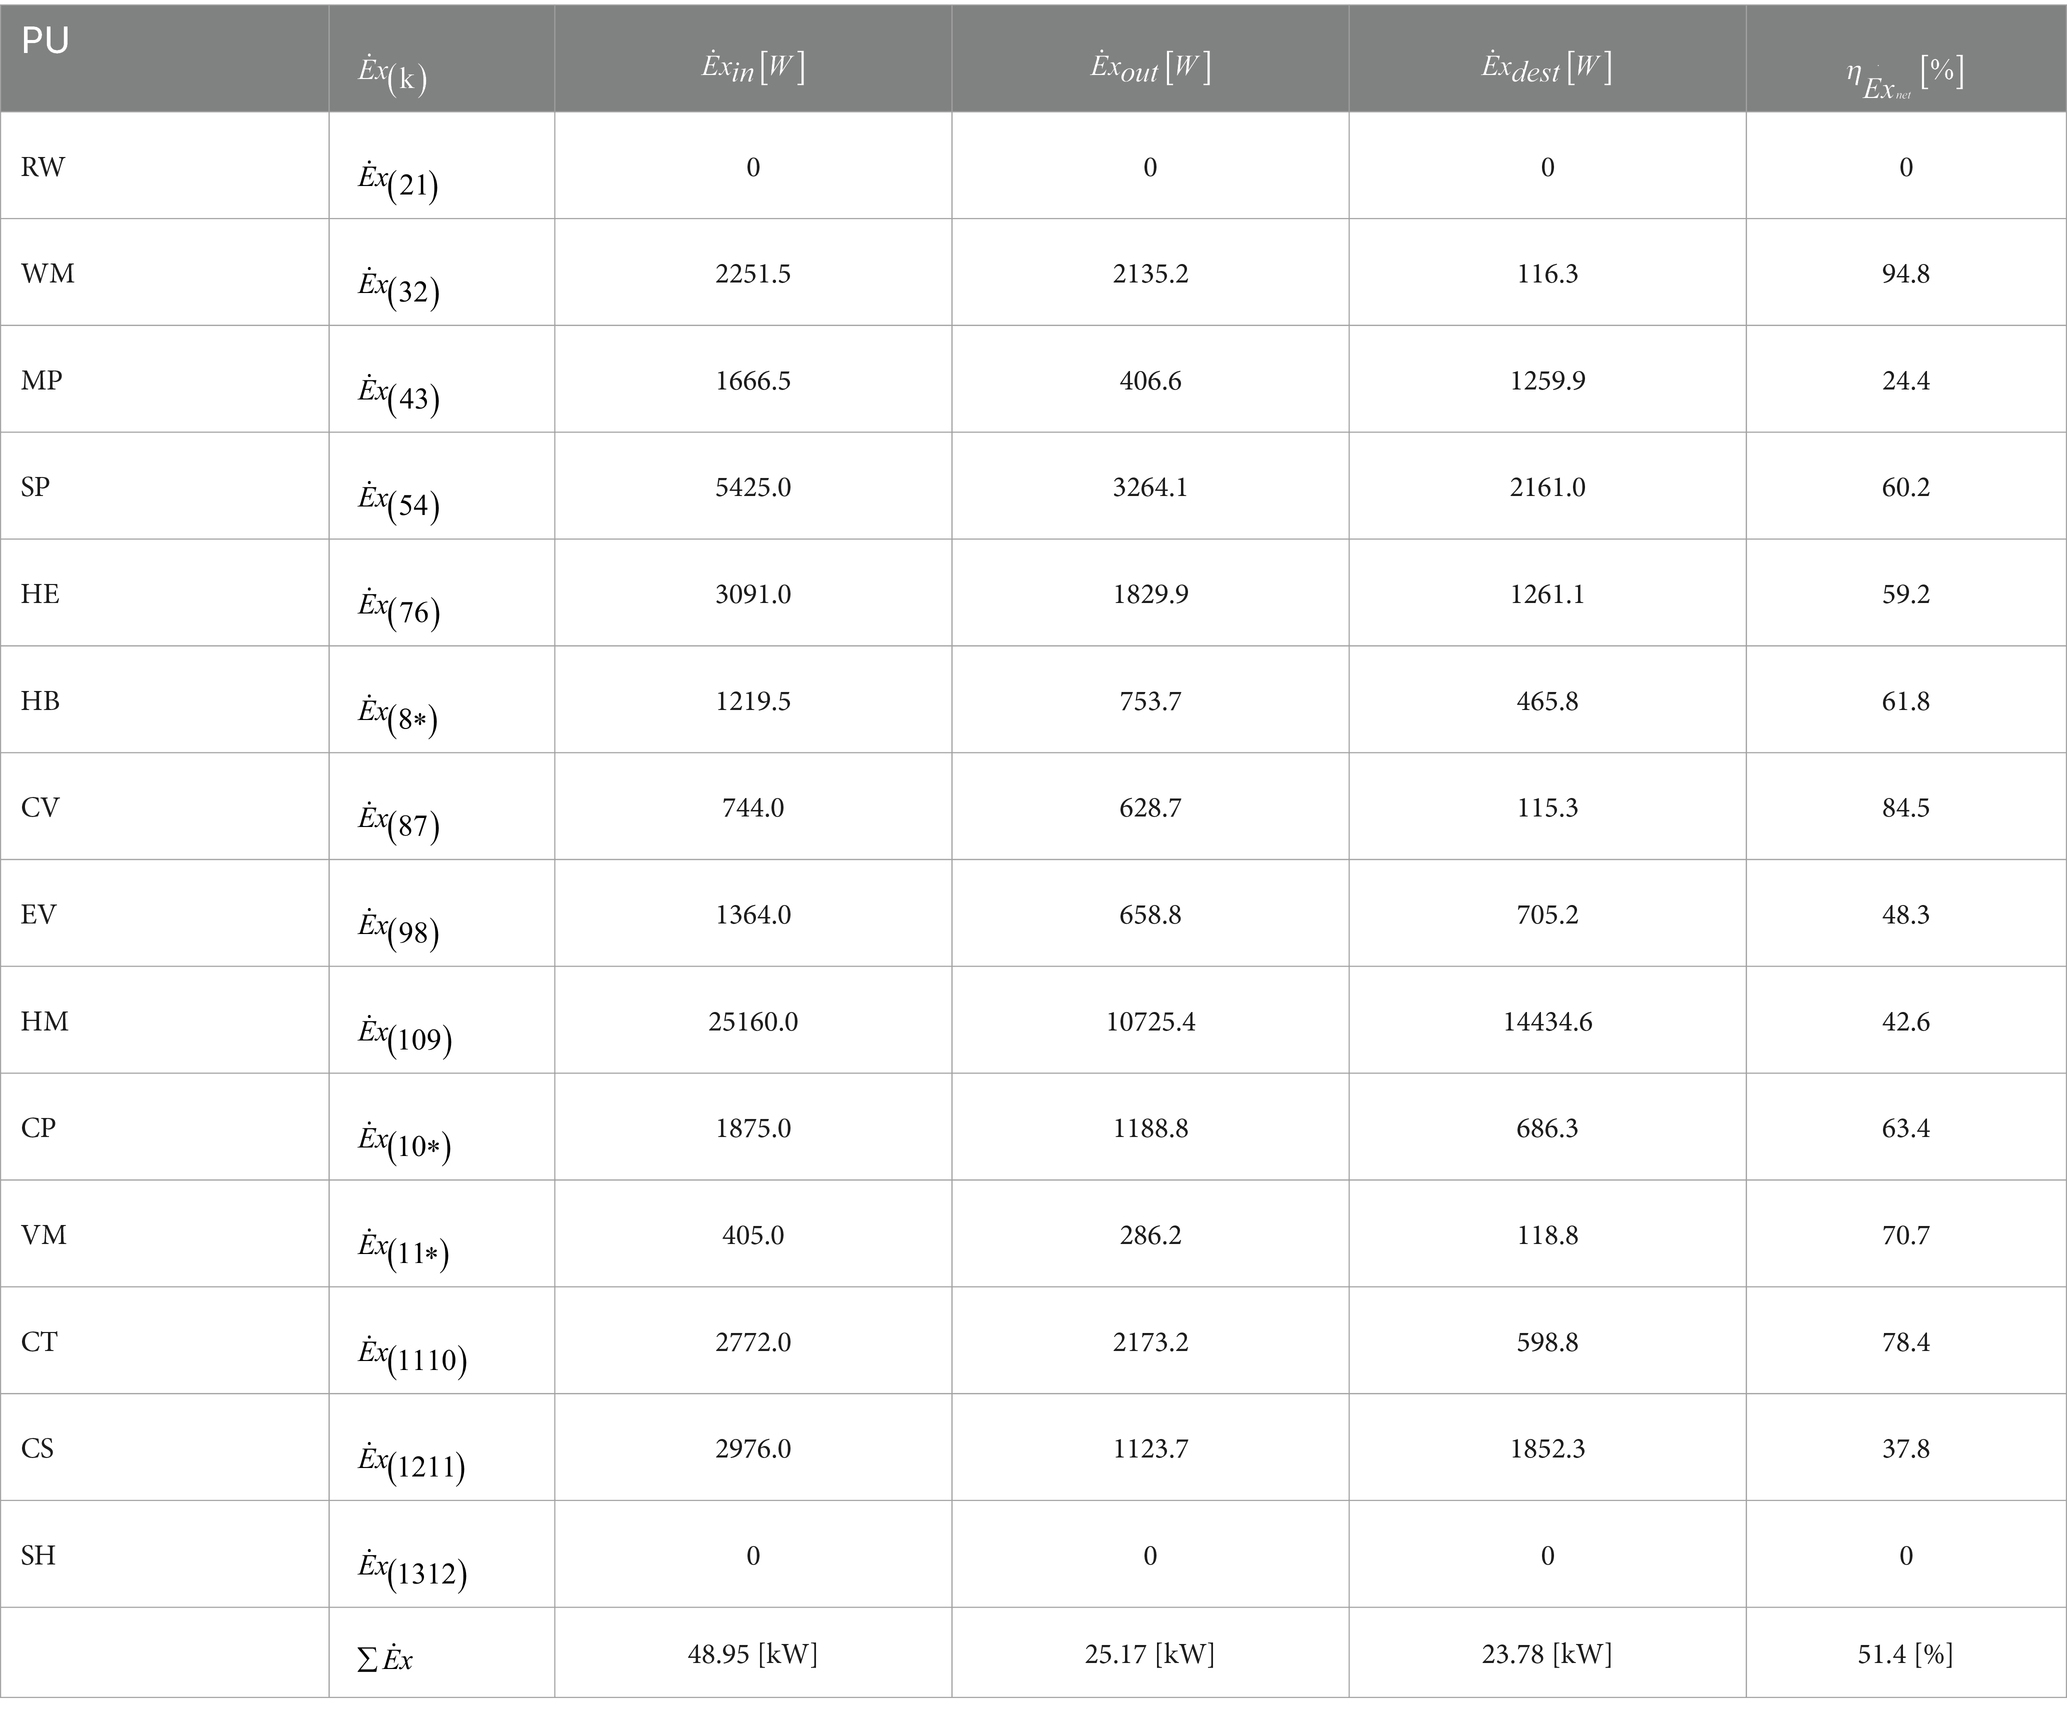
Table 5. Current results of the exergy analysis for the yoghurt process at the whole of the dairy milk factory.
The energy and exergy analyses are presented in Table 4, which displays the current results of the energy analysis performed on the yoghurt production process in the entire dairy milk factory. The yoghurt production process was analyzed, and it was emerged that the total energy input was 113.87 [kW], whereas the total energy output was 65.69 [kW]. The energy efficiency of this process was 57.7%. In addition, the energy efficiency of each process was considered. However, the RW and SH processes were not included in the energy assessments considering the processes are specifically related to transportation. The three processes with the highest energy efficiencies were the WM process with an efficiency of 95.5%, CP process with an efficiency of 83.6%, and CT process with an efficiency of 81.1%. Conversely, the HM process had the lowest energy efficiency (35.1%), followed by the CV (41.1%) and MP (52.1%) processes.
Table 5 displays the most recent results of the exergy analysis of the yoghurt production process for the entire dairy milk factory. The exergy input and output for the yoghurt production process were assessed to be 48.95 [kW] and 25.17 [kW], respectively. The exergy efficiency was calculated to be 51.4%. Furthermore, exergy efficiency assessments excluded the RW and SH processes because of their association with transportation. The three processes with the highest exergy efficiencies were the WM process with an efficiency of 94.8%, CV process with an efficiency of 84.5%, and CT process with an efficiency of 78.4%. In contrast, the MP process exhibited an exergy efficiency of 24.4%, the CS process demonstrated an exergy efficiency of 37.8%, and the HM process achieved an exergy efficiency of 42.6%. Consequently, these three processes were identified as having the lowest efficiency.
Figure 6 depicts the Grassmann-Sankey diagram, illustrating the energy flows and efficiency of the current processes. The Grassmann-Sankey diagram was utilized to analyze the energy efficiency rates between processes, energy inputs, outputs, and loss. The energy loss was found to be 48.2 [kW]. Estimating the energy efficiency of various processes and analyzing the energy inputs, outputs, and losses demonstrates that the HM process has the highest energy loss (24.02 kW), and the WM process has the lowest (0.11 kW).
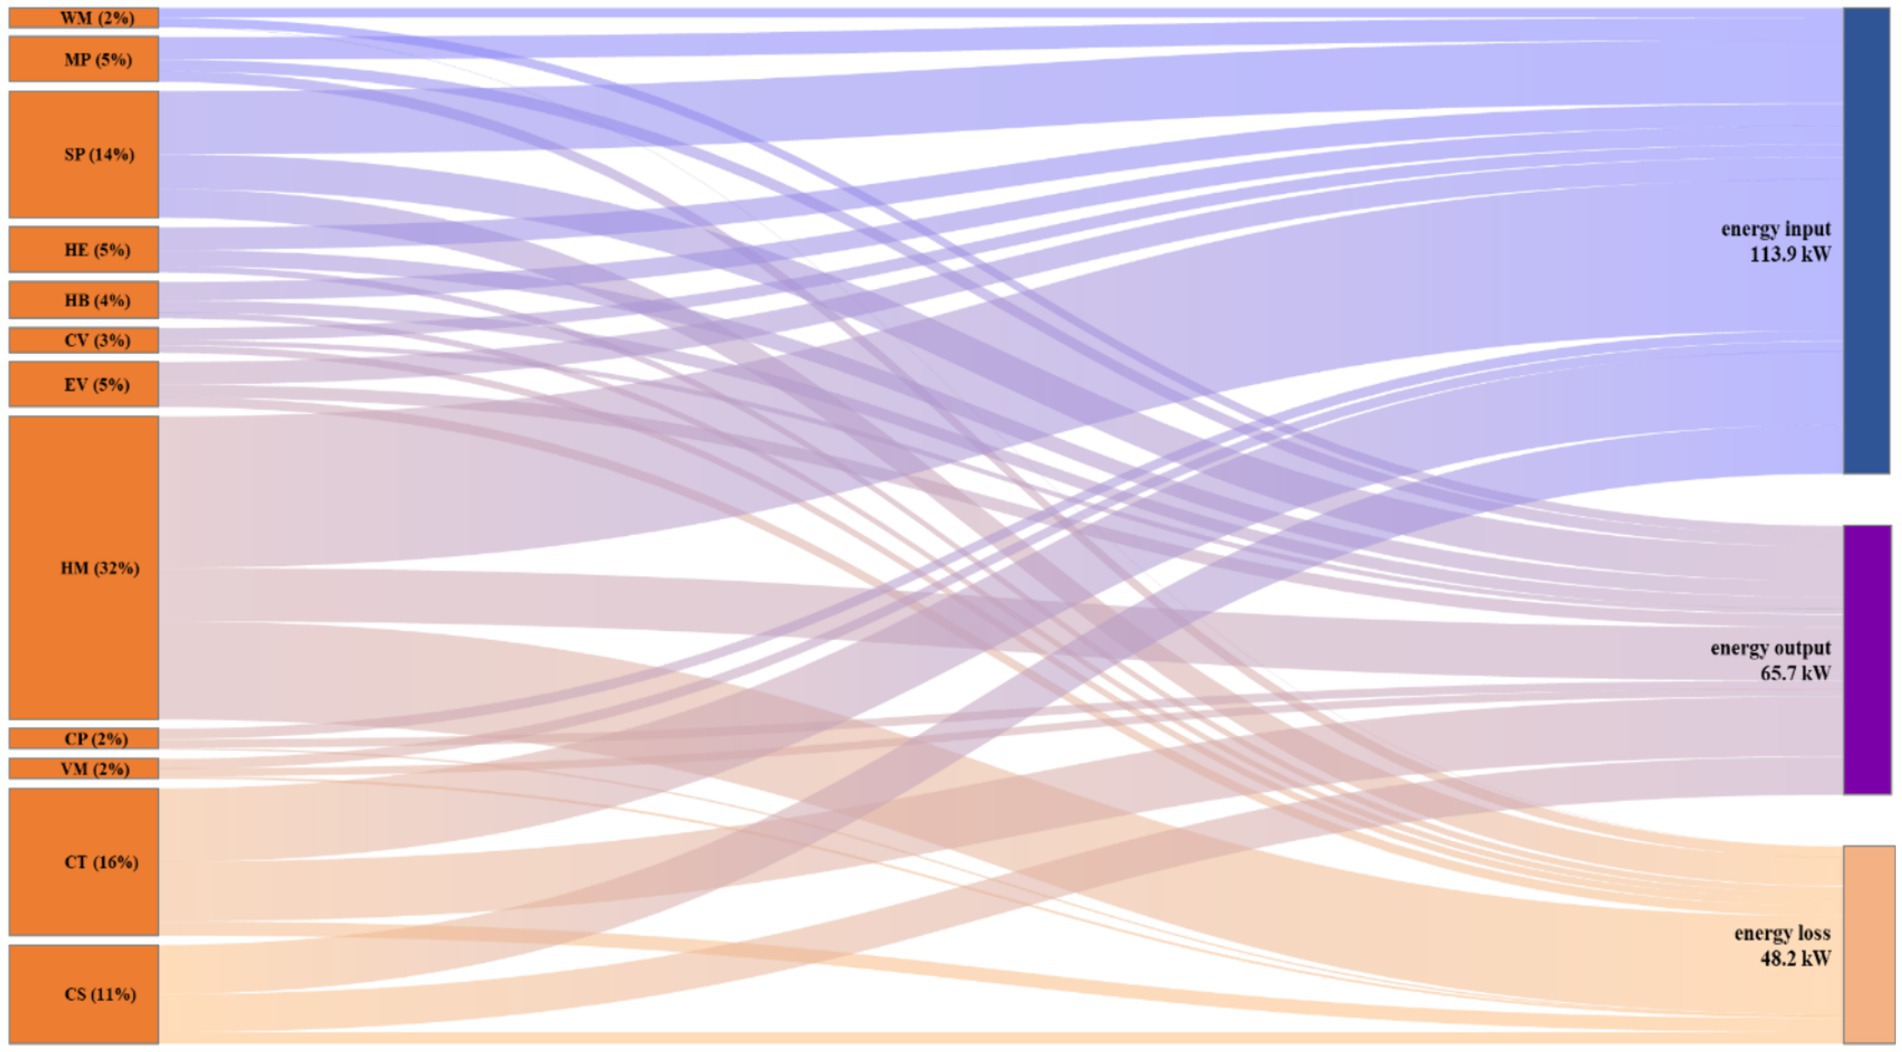
Figure 6. Grassmann-Sankey diagram of the energy flows and efficiency for the current processes.
Figure 7 illustrates the Grassmann-Sankey diagram representing the exergy flow and efficiency of the current processes. The Grassmann-Sankey diagram was used to analyze the exergy efficiency rates of the processes, as well as the exergy inputs, outputs, and losses. The current of the exergy destruction was obtained to be 23.8 [kW]. Moreover, upon assessing the exergy efficiency of various processes and analyzing the exergy inputs, outputs, and destruction, it is clear that the corresponding value of the highest exergy destruction is in the HM process (14.43 kW), and the corresponding value of the lowest exergy destruction is in the CV process (0.12 kW).
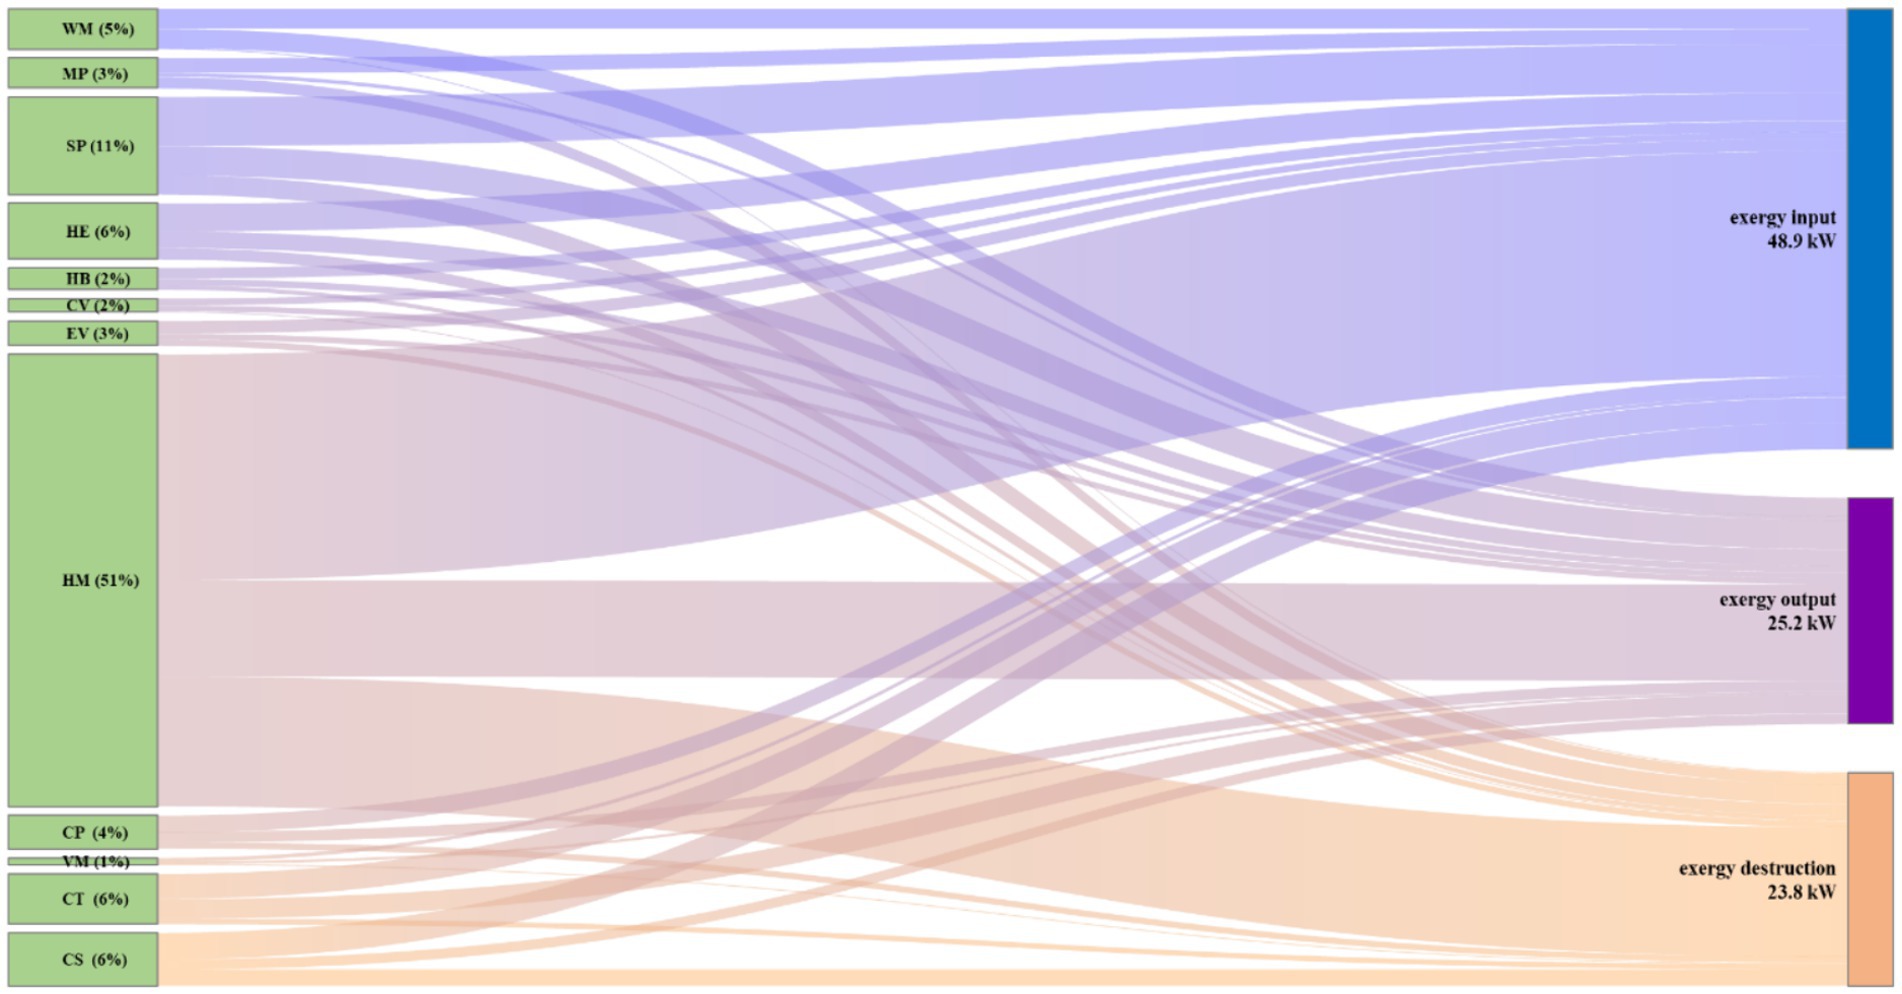
Figure 7. Grassmann-Sankey diagram of the exergy flows and efficiency for the current processes.
3.2 Enhancement of energy and exergy analysis
In this study, after applying the current energy and exergy analysis of the yoghurt process and presenting the energy density map with the Grassmann-Sankey diagram, the processes were enhanced by adjusting the mass and energy balances with the updates in the processes. The energy and exergy efficiencies of the process were considered through enhancements and modifications to previous implementations.
Table 6 displays the enhancement of the energy analysis conducted on the yoghurt production process for the entire dairy milk factory. An analysis of the yoghurt production process revealed that the total energy input was 113.9 [kW], whereas the total energy output was 72.05 [kW], resulting in an energy efficiency of 63.3%. As a result, several comparable studies on dairy companies’ energy efficiency have been conducted, a small number of which are reflected in this study. Başaran et al. (2021) found that with a different configuration process, 2.78 [kg/s] of milk can be obtained with 44.35% less energy input. The results of Bühler et al. (2018) in this case study align closely with the energy efficiency outcomes observed in a milk-processing factory. Singh et al. (2019a) obtained energy efficiency of 86.88% for a cream pasteurization plant. In the electrification scenario, Bühler et al. (2019) achieved a 48% reduction in electricity input and a 35% reduction in heat rate. Lincoln et al. (2022) achieved a 21% reduction in energy consumption by implementing process integration and electrification techniques in milk-evaporation systems to improve the efficiency. Husnain et al. (2022) demonstrated that 69.70% of the energy was utilized for the purpose of heating milk.
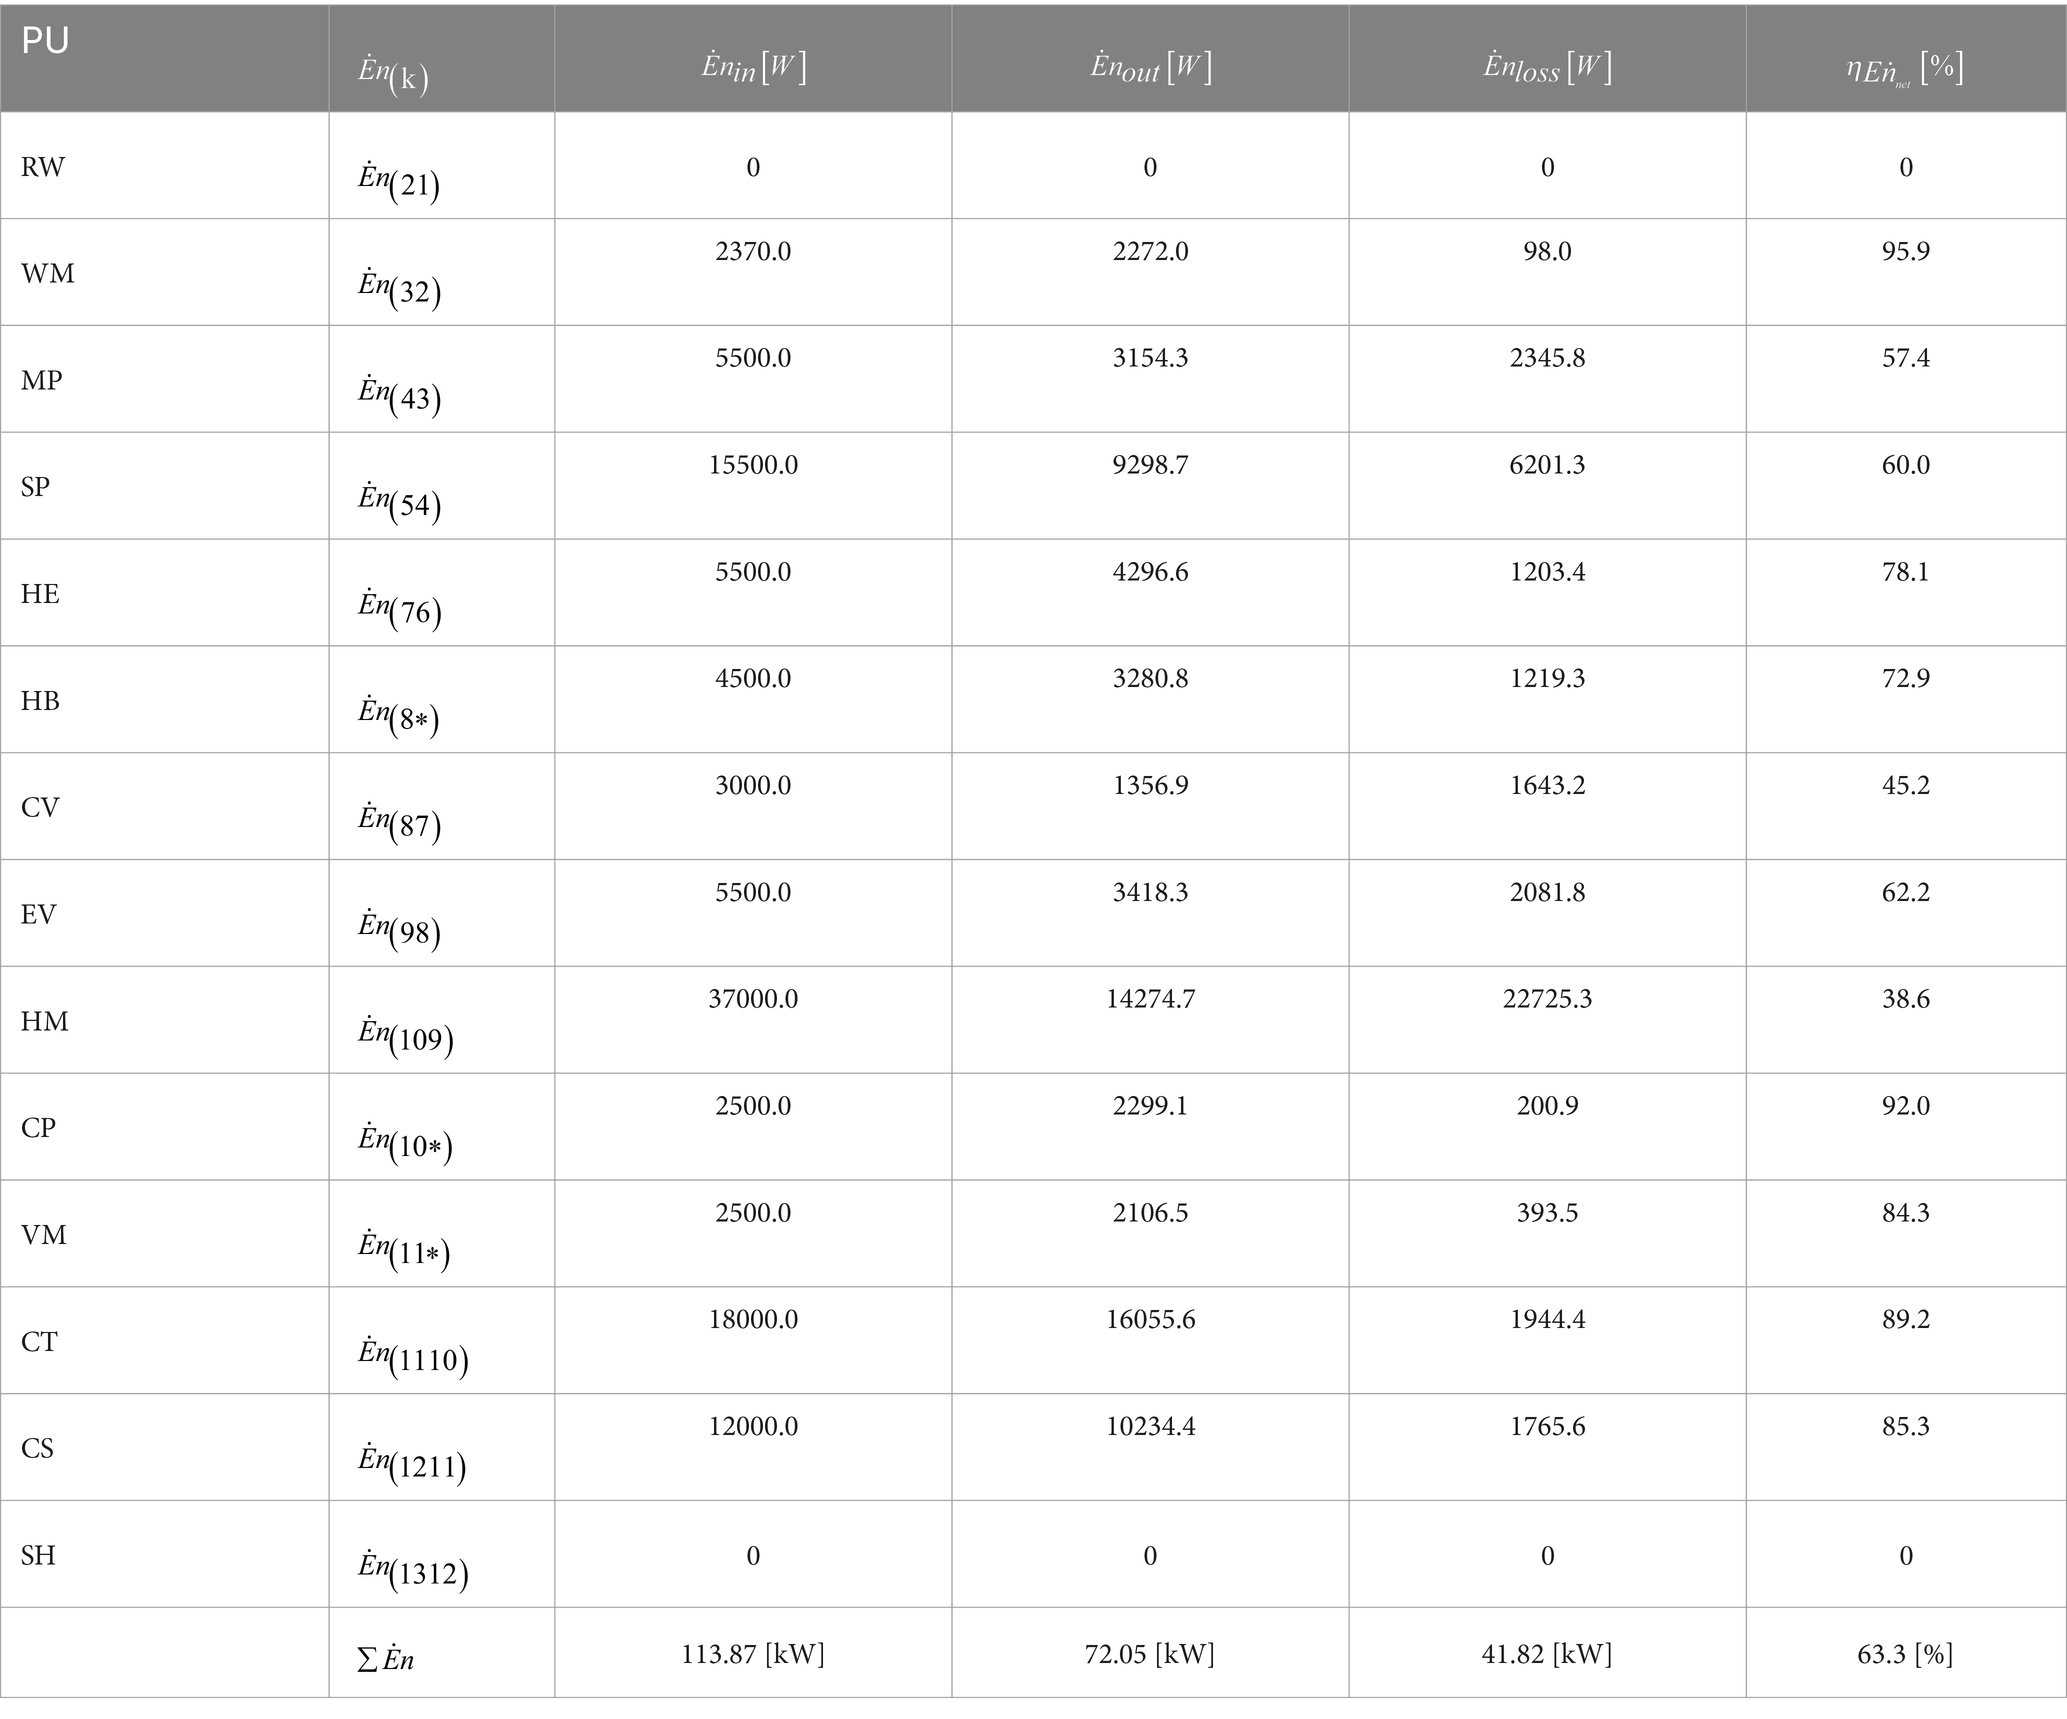
Table 6. Enhancement of the energy analysis for the yoghurt process throughout the dairy milk factory.
Table 7 exhibits the enhanced exergy analysis for the yoghurt production process across the dairy milk factory. The exergy input and output for the yoghurt production process were computed to be 48.95 [kW] and 29.77 [kW], respectively. The yoghurt process achieved exergy efficiency of 60.8%. As a result, several comparable studies on dairy companies’ energy efficiency have been conducted, a small number of which are reflected in this study. Singh et al. (2019b) obtained the exergy efficiency of 66.11% for a cream pasteurization plant. According to this study, the exergy reduction was 9.4% due to the increase in exergy efficiency in the yoghurt production process. The study conducted by Shokouhifar et al. (2024) demonstrates a significant decrease of 6.74% in the overall exergy consumption of the supply chain in literature.
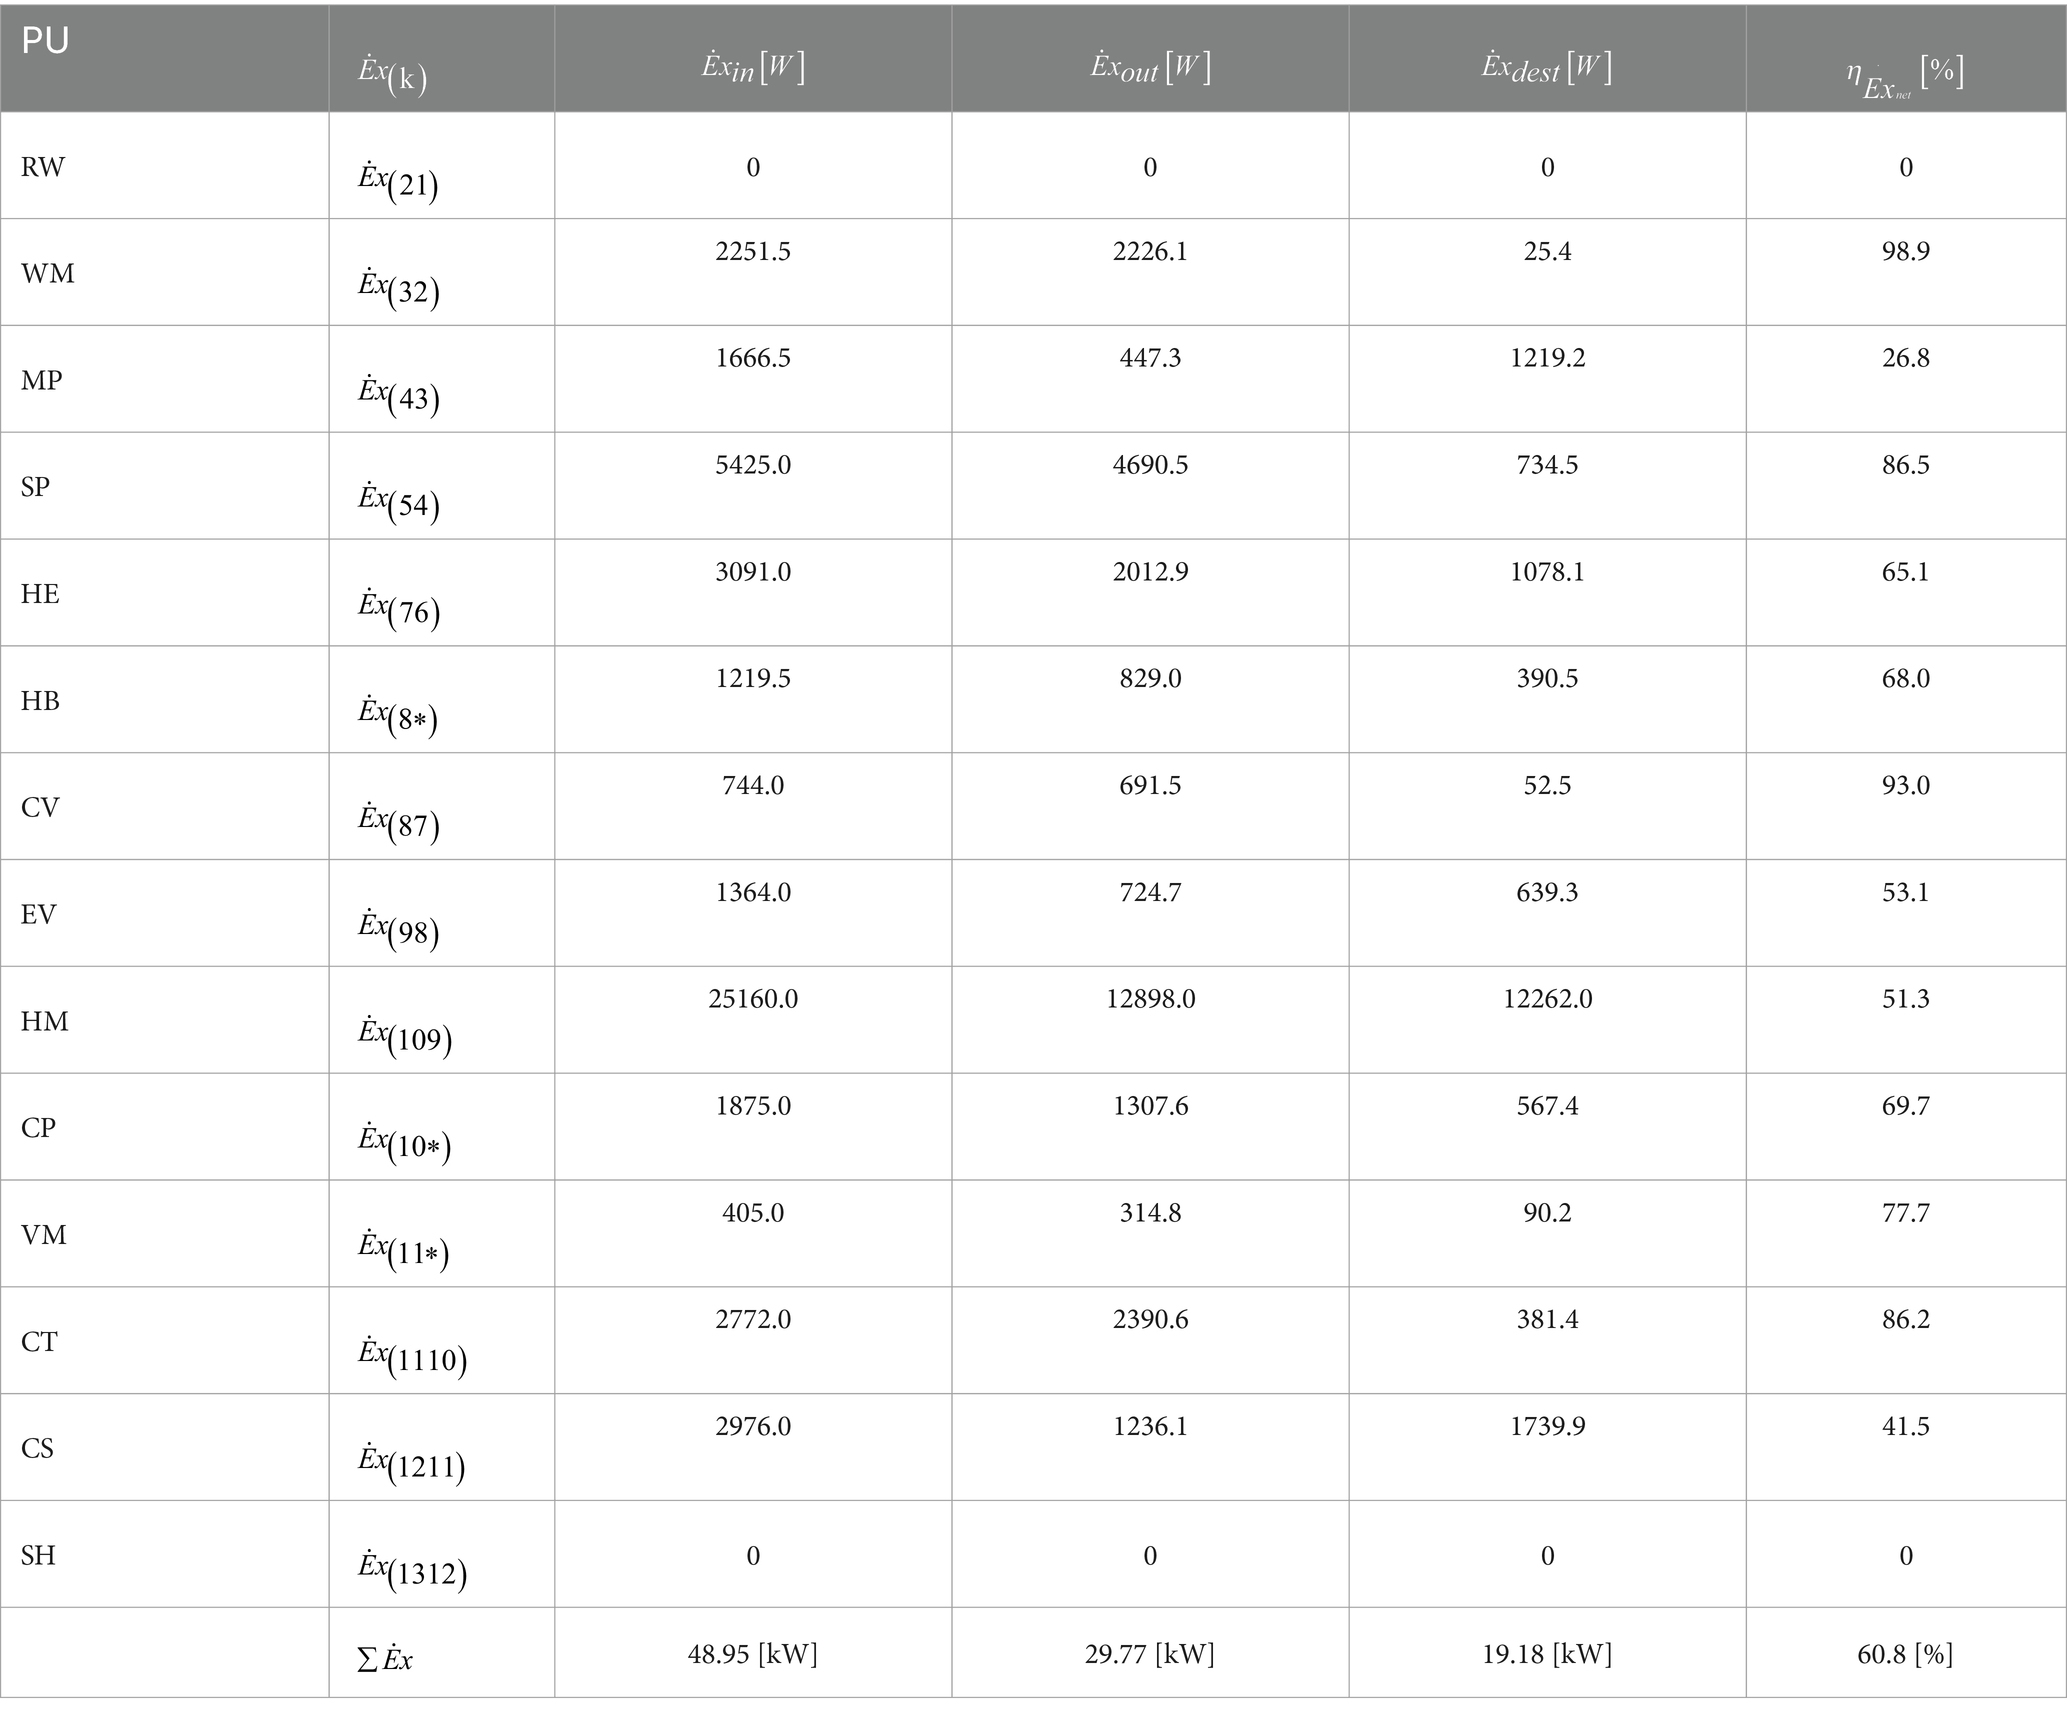
Table 7. Enhancement of the exergy analysis for the yoghurt process throughout the dairy milk factory.
Figure 8 depicts the Grassmann-Sankey diagram of the energy flow and efficiency in the enhancement processes. According to the Grassmann-Sankey diagram, the energy efficiency rates between processes and energy inputs, outputs, and losses are also under analysis. The enhancement in the energy loss was computed to be 48.2 [kW]. Furthermore, after assessing the energy efficiency of the different processes and examining the energy inputs, outputs, and losses, it is clear that the HM process has the highest energy loss (22.73 kW), and the WM process has the lowest energy loss (0.098 kW). In literature, Husnain et al. (2022) demonstrated that the evacuated tube collector had a total available power of 2.22 kW.
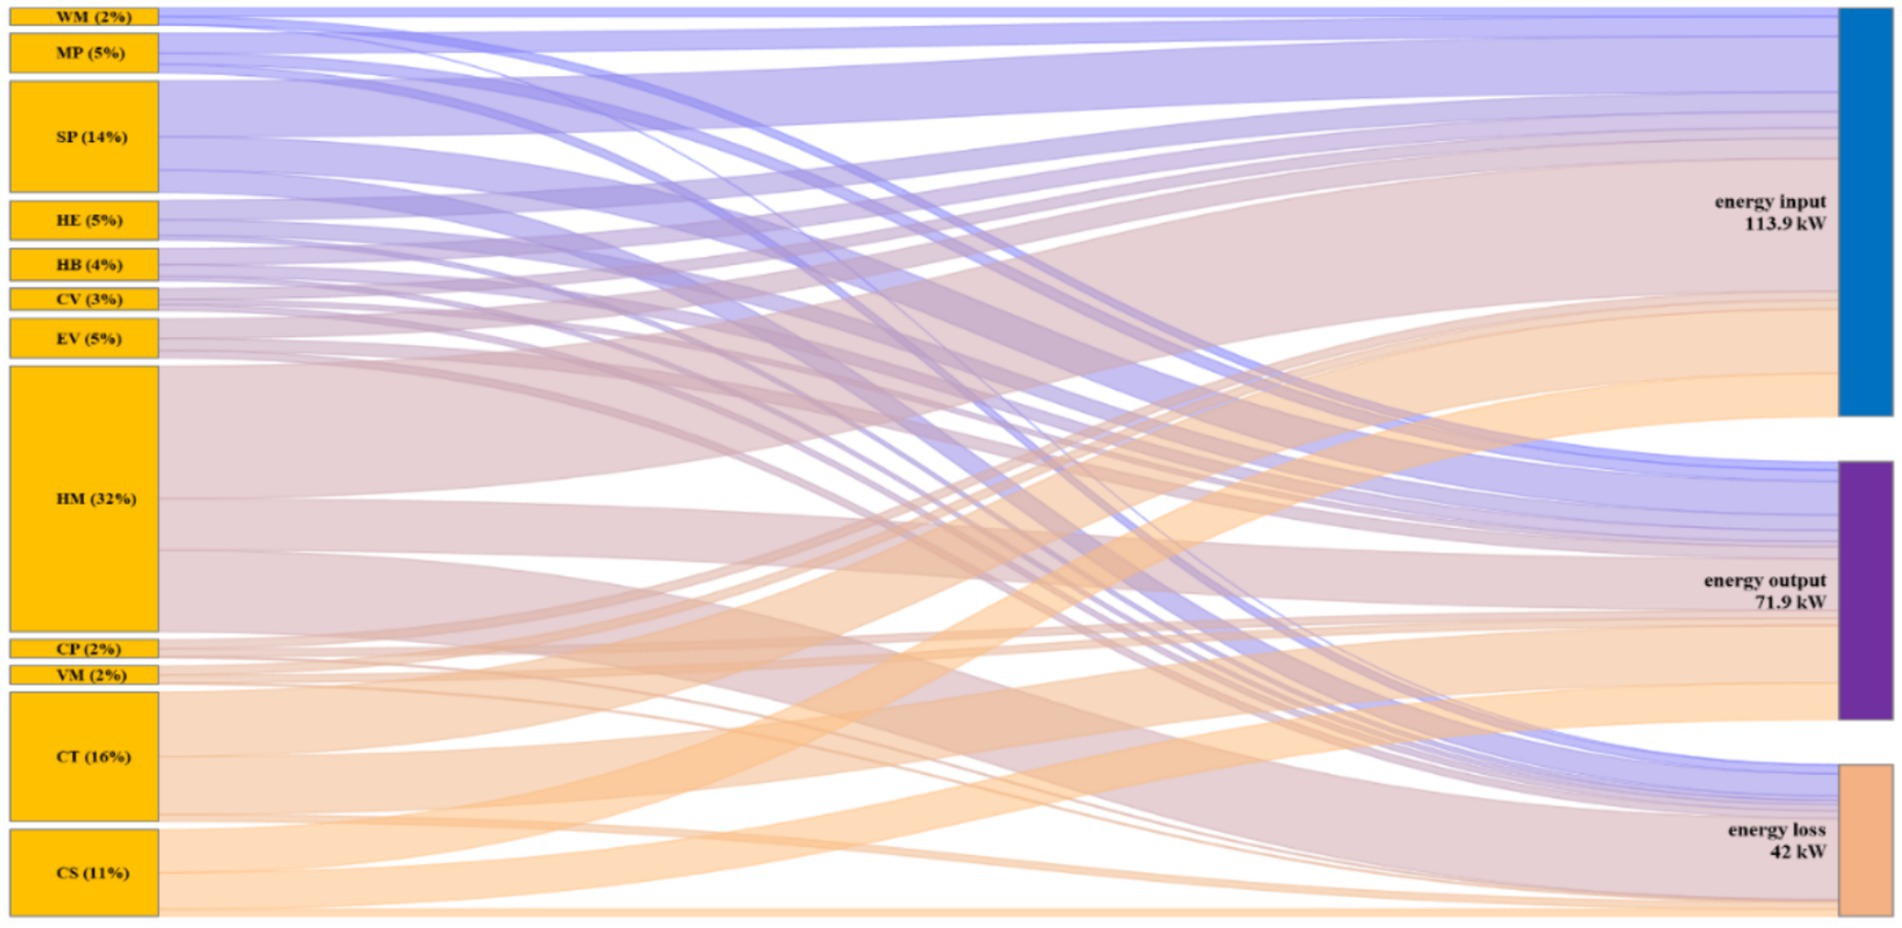
Figure 8. Grassmann-Sankey diagram of the energy flows and efficiency for the enhancement processes.
Figure 9 illustrates the Grassmann-Sankey diagram representing the exergy flow and efficiency of the enhancement processes. The Grassmann-Sankey diagram was used to analyze the exergy efficiency of the processes, as well as the exergy inputs, outputs, and losses. The enhancement of exergy destruction was calculated to be 19.2 [kW]. After evaluating the exergy efficiency of different processes and exploring the exergy inputs, outputs, and destruction, it is evident that the HM process has the highest exergy destruction value (12.26 kW), whereas the WM process has the lowest exergy destruction value (0.25 kW). In literature, Husnain et al. (2022) described how the heating process of raw milk accounted for 40% of the overall energy consumption. The overall thermal efficiency exceeded 80%. The exergy losses in the compressor of the refrigeration unit were found to remain relatively constant at 1.0037 kW (Husnain et al., 2022). Upon analyzing the literature, it becomes evident that this novel and groundbreaking work is more effective and the process is more appropriate.
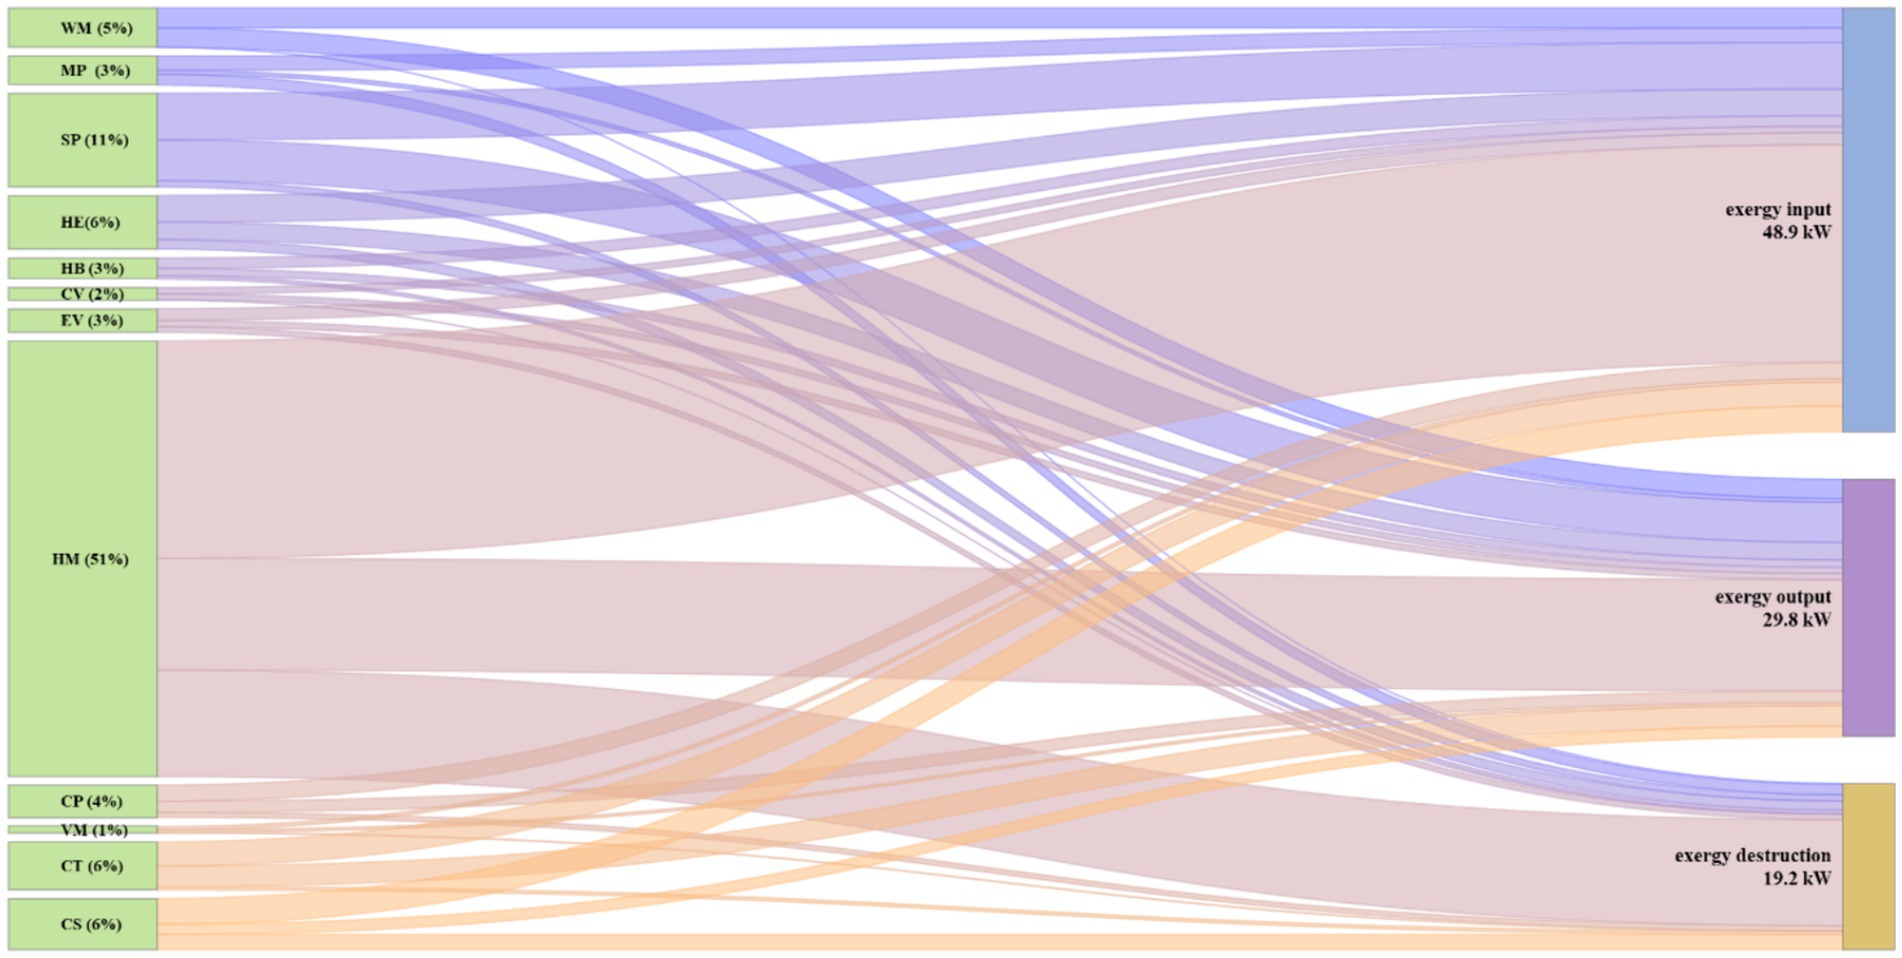
Figure 9. Grassmann-Sankey diagram of the exergy flows and efficiency for the enhancement processes.
4 Conclusion
This study clearly illustrates that assessing the energy and exergy efficiency of the yoghurt production process, whose raw material is milk, contributes to sustainability by influencing factory profitability. This study provides an in-depth assessment of the energy and exergy aspects of a dairy plant producing yoghurt. After conducting an energy and exergy analysis of the yoghurt process and creating an energy density map using the Grassmann-Sankey diagram, enhancements were made to the processes by modifying the mass and energy balances based on the updated data. Energy and exergy analyses of 13 yoghurt production processes were carried out using current and enhanced optimized data. The enhancement processes revealed that the yoghurt production process exhibited an energy efficiency of 63.3%, with an input of 113.9 [kW], an output of 72.05 [kW], and a loss of 41.82 [kW]. Additionally, the yoghurt production process demonstrated an exergy efficiency of 60.8%, with an input of 48.95 [kW], output of 29.77 [kW], and destruction of 19.18 [kW]. The exergy reduction in the yoghurt production process was 9.4% as a result of the improved exergy efficiency resulting from process enhancements.
The relevance of optimizations, in addition to current practices in energy and exergy efficiency assessments of yoghurt production processes, is demonstrated in this study. This case study is consistent with previous research highlighting that energy and exergy efficiencies increase in different scenarios as a result of dairy plant optimization methods. This study not only contributes to innovation in the yoghurt production process but also sheds light on the production of milk and dairy products. This study, with its innovative approaches, will serve as an inspiration for similar studies in the future and is expected to have a significant impact on sustainability. This study can be a source of inspiration for future studies that will be beneficial for the yoghurt process, as well as for the development of milk production. With modest changes in yoghurt and milk production, energy and exergy efficiencies can be boosted, contributing to the plant’s profitability.
Data availability statement
The raw data supporting the conclusions of this article will be made available by the authors, without undue reservation.
Author contributions
OOT: Conceptualization, Data curation, Formal analysis, Investigation, Methodology, Project administration, Resources, Software, Validation, Visualization, Writing – original draft, Writing – review & editing, Funding acquisition, Supervision.
Funding
The author declares that no financial support was received for the research, authorship, and/or publication of this article.
Acknowledgments
The Biçenler Dairy Agriculture and Animal Products Industry Trade Limited Company assisted this study in terms of energy and exergy efficiency with the Grassmann-Sankey Diagram study. Thanks are extended to factory management for their assistance with the production and energy data systems of the factory. The author would also like to acknowledge their valuable guidance and support throughout the study.
Conflict of interest
The author declares that the research was conducted in the absence of any commercial or financial relationships that could be construed as a potential conflict of interest.
Publisher’s note
All claims expressed in this article are solely those of the authors and do not necessarily represent those of their affiliated organizations, or those of the publisher, the editors and the reviewers. Any product that may be evaluated in this article, or claim that may be made by its manufacturer, is not guaranteed or endorsed by the publisher.
References
Aghaei, A. T., and Saray, R. K. (2021). Optimization of a combined cooling, heating, and power (CCHP) system with a gas turbine prime mover: a case study in the dairy industry. Energy 229:120788. doi: 10.1016/j.energy.2021.120788
Aghbashlo, M., Mobli, H., Rafiee, S., and Madadlou, A. (2013). A review on exergy analysis of drying processes and systems. Renew. Sust. Energ. Rev. 22, 1–22. doi: 10.1016/j.rser.2013.01.015
Ahammed, M. E., Bhattacharyya, S., and Ramgopal, M. (2018). Analysis of CO2 based refrigeration systems with and without ejector for simultaneous pasteurization and chilling of milk. Int. J. Refrig. 95, 61–72. doi: 10.1016/j.ijrefrig.2018.08.005
Azzaro-Pantel, C., Madoumier, M., and Gésan-Guiziou, G. (2022). Development of an ecodesign framework for food manufacturing including process flowsheeting and multiple-criteria decision-making: application to milk evaporation. Food Bioprod. Process. 131, 40–59. doi: 10.1016/j.fbp.2021.10.003
Başaran, A., Yılmaz, T., Azgın, Ş. T., and Çivi, C. (2021). Comparison of drinking milk production with conventional and novel inductive heating in pasteurization in terms of energetic, exergetic, economic and environmental aspects. J. Clean. Prod. 317:128280. doi: 10.1016/j.jclepro.2021.128280
Başaran, A., Yılmaz, T., and Çivi, C. (2023). Experimental investigation and evaluation of the thermodynamical performance of a novel hybrid design for milk pasteurization. Thermal Sci. Eng. Progress 44:102028. doi: 10.1016/j.tsep.2023.102028
Beck, M. B., Chen, C., Walker, R. V., Wen, Z., and Han, J. (2023). Multi-sectoral analysis of smarter urban nitrogen metabolism: a case study of Suzhou, China. Ecol. Model. 478:110286. doi: 10.1016/j.ecolmodel.2023.110286
Bergamini, R., Moussavi, A., Shahhosseini, H. R., Nguyen, T.-V., Bellemo, L., Elmegaard, B., et al. (2021). Analysis of energy integration opportunities in the retrofit of a milk powder production plant using the bridge framework. J. Clean. Prod. 328:129402. doi: 10.1016/j.jclepro.2021.129402
Bobovnik, G., and Kutin, J. (2023). Uncertainty analysis of the air velocity standard based on LDA and wind tunnel. Measurement 206:112228. doi: 10.1016/j.measurement.2022.112228
Bühler, F., Nguyen, T.-V., Jensen, J. K., Holm, F. M., and Elmegaard, B. (2018). Energy, exergy and advanced exergy analysis of a milk processing factory. Energy 162, 576–592. doi: 10.1016/j.energy.2018.08.029
Bühler, F., Zühlsdorf, B., Nguyen, T. V., and Elmegaard, B. (2019). A comparative assessment of electrification strategies for industrial sites: case of milk powder production. Appl. Energy 250, 1383–1401. doi: 10.1016/j.apenergy.2019.05.071
Cengel, Y. A., Boles, M. A., and Kanoglu, M. (2019). Thermodynamics: An Engineering Approach. New York: Mcgraw-Hill Education.
Esen, H., Inalli, M., Esen, M., and Pihtili, K. (2007). Energy and exergy analysis of a ground-coupled heat pump system with two horizontal ground heat exchangers. Build. Environ. 42, 3606–3615. doi: 10.1016/j.buildenv.2006.10.014
Figliola, R. S., and Beasley, D. (2015). Theory and Design for Mechanical Measurements, 6th Edition, Chapter 5. New Jersey: John Wiley & Sons Inc.
Guyot, C., and Kulozik, U. (2011). Effect of transglutaminase-treated milk powders on the properties of skim milk yoghurt. Int. Dairy J. 21, 628–635. doi: 10.1016/j.idairyj.2010.10.010
Heydari, A., Forati, M., and Khatam, S. M. (2021). Thermal performance investigation of a hybrid solar air heater applied in a solar dryer using thermodynamic modeling. J. Thermal Eng. 7, 715–730. doi: 10.18186/thermal.910320
Husnain, S. N., Amjad, W., Munir, A., and Hensel, O. (2022). Energy and exergy based thermal analysis of a solar assisted yogurt processing unit. Front. Energy Res. 10:887639. doi: 10.3389/fenrg.2022.887639
Huysveld, S., Van Linden, V., De Meester, S., Peiren, N., Muylle, H., Lauwers, L., et al. (2015). Resource use assessment of an agricultural system from a life cycle perspective – a dairy farm as case study. Agric. Syst. 135, 77–89. doi: 10.1016/j.agsy.2014.12.008
Jafaryani Jokandan, M., Aghbashlo, M., and Mohtasebi, S. S. (2015). Comprehensive exergy analysis of an industrial-scale yogurt production plant. Energy 93, 1832–1851. doi: 10.1016/j.energy.2015.10.003
Jing, R., He, Y., He, J., Liu, Y., and Yang, S. (2022). Global sensitivity based prioritizing the parametric uncertainties in economic analysis when co-locating photovoltaic with agriculture and aquaculture in China. Renew. Energy 194, 1048–1059. doi: 10.1016/j.renene.2022.05.163
Kaviani, A., Aslani, A., Zahedi, R., Ahmadi, H., and Malekli, M. R. (2022). A new approach for energy optimization in dairy industry. Clean. Eng. Technol. 8:100498. doi: 10.1016/j.clet.2022.100498
Khan, K. S., Latif, Y., Munir, A., and Hensel, O. (2022a). Comparative thermal analyses of solar milk pasteurizers integrated with solar concentrator and evacuated tube collector. Energy Rep. 8, 7917–7930. doi: 10.1016/j.egyr.2022.06.001
Khan, K. S., Munir, A., Raza, A., Latif, Y., and Hensel, O. (2022b). Improving Milk value chains: a case study for qualitative-economic feasibility of decentralized solar Milk pasteurization and chilling processes. Appl. Eng. Agric. 38, 409–419. doi: 10.13031/aea.14805
Li, M., Fu, Q., Singh, V. P., Ji, Y., Liu, D., Zhang, C., et al. (2019). An optimal modelling approach for managing agricultural water-energy-food nexus under uncertainty. Sci. Total Environ. 651, 1416–1434. doi: 10.1016/j.scitotenv.2018.09.291
Lincoln, B. J., Kong, L., Pineda, A. M., and Walmsley, T. G. (2022). Process integration and electrification for efficient milk evaporation systems. Energy 258:124885. doi: 10.1016/j.energy.2022.124885
Lorenzen, P. C., Ebert, Y., Clawin-Rädecker, I., and Schlimme, E. (2003). Influence of heat impact in reconstituted skim milk on the properties of yoghurt fermented by ropy or non-ropy starter cultures. Food Nahrung 47, 349–353. doi: 10.1002/food.200390080
Mehrabadi, Z. K., and Boyaghchi, F. A. (2019). Thermodynamic, economic and environmental impact studies on various distillation units integrated with gasification-based multi-generation system: comparative study and optimization. J. Clean. Prod. 241:118333. doi: 10.1016/j.jclepro.2019.118333
Mojarab Soufiyan, M., and Aghbashlo, M. (2017). Application of exergy analysis to the dairy industry: a case study of yogurt drink production plant. Food Bioprod. Process. 101, 118–131. doi: 10.1016/j.fbp.2016.10.008
Mojarab Soufiyan, M., Aghbashlo, M., and Mobli, H. (2017). Exergetic performance assessment of a long-life milk processing plant: a comprehensive survey. J. Clean. Prod. 140, 590–607. doi: 10.1016/j.jclepro.2015.11.066
Nathaphan, S., and Therdyothin, A. (2023). Effectiveness evaluation of the energy efficiency and conservation measures for stipulation of Thailand energy management system in factory. J. Clean. Prod. 383:135442. doi: 10.1016/j.jclepro.2022.135442
Oliveira, M., Cocozza, A., Zucaro, A., Santagata, R., and Ulgiati, S. (2021). Circular economy in the agro-industry: integrated environmental assessment of dairy products. Renew. Sust. Energ. Rev. 148:111314. doi: 10.1016/j.rser.2021.111314
Oliveira, M., Zucaro, A., Santagata, R., and Ulgiati, S. (2022). Environmental assessment of milk production from local to regional scales. Ecol. Model. 463:109795. doi: 10.1016/j.ecolmodel.2021.109795
Öztuna Taner, Ö. (2023). Energy and production analysis of a dairy milk factory: a case of study. J. Thermal Eng. 9, 1163–1176. doi: 10.18186/thermal.1370731
Queiroz, R. D. C. S., De Maranduba, H. L., Hafner, M. B., Rodrigues, L. B., and De Almeida Neto, J. A. (2020). Life cycle thinking applied to phytoremediation of dairy wastewater using aquatic macrophytes for treatment and biomass production. J. Clean. Prod. 267:122006. doi: 10.1016/j.jclepro.2020.122006
Rajendran, N., and Han, J. (2023). Techno-economic analysis and life cycle assessment of poly (butylene succinate) production using food waste. Waste Manag. 156, 168–176. doi: 10.1016/j.wasman.2022.11.037
Rajpoot, A. S., Choudhary, T., Chelladurai, H., Shukla, A., and Sinha, A. A. (2024). Comparative analysis of energy, exergy, emission, and sustainability aspects of third generation microalgae biodiesels in a diesel engine. Process Saf. Environ. Prot. 188, 1026–1036. doi: 10.1016/j.psep.2024.05.142
Ranjan, K., and Kaushik, S. (2014). Thermodynamic and economic feasibility of solar ponds for various thermal applications: a comprehensive review. Renew. Sust. Energ. Rev. 32, 123–139. doi: 10.1016/j.rser.2014.01.020
Saucedo-Velázquez, J., Gutiérrez-Urueta, G., Pacheco-Reyes, A., and Rivera, W. (2023). Case study: design of an absorption refrigeration system for milk preservation in Jalisco, Mexico. Case Stud. Thermal Eng. 44:102866. doi: 10.1016/j.csite.2023.102866
Shokouhifar, M., Naderi, R., Goli, A., Gultom, P., Shafiei Nikabadi, M., and Weber, G.-W. (2024). Metaheuristic-driven extended exergy accounting for sustainable closed-loop food supply chain management. Comput. Ind. Eng. 191:110148. doi: 10.1016/j.cie.2024.110148
Siddique, A. R. M., Bozorgi, M., Venkateshwar, K., Tasnim, S., and Mahmud, S. (2023). Phase change material-enhanced solid-state thermoelectric cooling technology for food refrigeration and storage applications. J. Energy Storage 60:106569. doi: 10.1016/j.est.2022.106569
Singh, G., Chopra, K., Tyagi, V., Pandey, A., Ma, Z., and Ren, H. (2021). A comprehensive energy, exergy and enviroeconomic (3-E) analysis with carbon mitigation for multistage evaporation assisted milk powder production unit. Sustain. Energy Technol. Assess. 43:100925. doi: 10.1016/j.seta.2020.100925
Singh, G., Singh, P., Tyagi, V., Barnwal, P., and Pandey, A. (2019a). Exergy and thermo-economic analysis of ghee production plant in dairy industry. Energy 167, 602–618. doi: 10.1016/j.energy.2018.10.138
Singh, G., Singh, P., Tyagi, V., Barnwal, P., and Pandey, A. (2019b). Exergy and thermo-economic analysis of ghee production plant in dairy industry. J. Therm. Anal. Calorim. 137, 1381–1400. doi: 10.1007/s10973-019-08016-y
Solanki, A., and Pal, Y. (2021). A comprehensive review to study and implement solar energy in dairy industries. J. Thermal Eng. 7, 1216–1238. doi: 10.18186/thermal.978029
Sorgüven, E., and Özilgen, M. (2012). Energy utilization, carbon dioxide emission, and exergy loss in flavored yogurt production process. Energy 40, 214–225. doi: 10.1016/j.energy.2012.02.003
Stelios, K., and Emmanuel, A. (2004). Characteristics of set type yoghurt made from caprine or ovine milk and mixtures of the two. Int. J. Food Sci. Technol. 39, 319–324. doi: 10.1111/j.1365-2621.2004.00788.x
Tan, Q., and Zhang, T. (2018). Robust fractional programming approach for improving agricultural water-use efficiency under uncertainty. J. Hydrol. 564, 1110–1119. doi: 10.1016/j.jhydrol.2018.07.080
The Union of Chambers and Commodity Exchanges of Turkey (UCCET): Industry Directorate (2023). Capacity criteria 3112 Milk and products capacity calculation.
Vutukuru, R., Pegallapati, A. S., and Maddali, R. (2019). Thermodynamic studies on a solar assisted transcritical CO2 based tri-generation system with an ejector for dairy applications. Int. J. Refrig. 108, 113–123. doi: 10.1016/j.ijrefrig.2019.08.031
Yildirim, N., and Genc, S. (2017). Energy and exergy analysis of a milk powder production system. Energy Convers. Manag. 149, 698–705. doi: 10.1016/j.enconman.2017.01.064
Zamberlin, S., Pogačić, T., Mahnet, S., Golem, Z., Havranek, J., and Samaržija, D. (2010). The effect of heat treatment of ovine milk on the compositional and sensory properties of set yoghurt. Int. J. Dairy Technol. 63, 587–592. doi: 10.1111/j.1471-0307.2010.00614.x
Zhang, W., Huang, J., Zhang, T., and Tan, Q. (2022). A risk-based stochastic model for supporting resources allocation of agricultural water-energy-food system under uncertainty. J. Hydrol. 610:127864. doi: 10.1016/j.jhydrol.2022.127864
Zheng, Z., Ji, L., Xie, Y., Huang, G., and Pan, J. (2022). Synergic management of crop planting structure and biomass utilization pathways under a food-energy-water nexus perspective. J. Clean. Prod. 335:130314. doi: 10.1016/j.jclepro.2021.130314
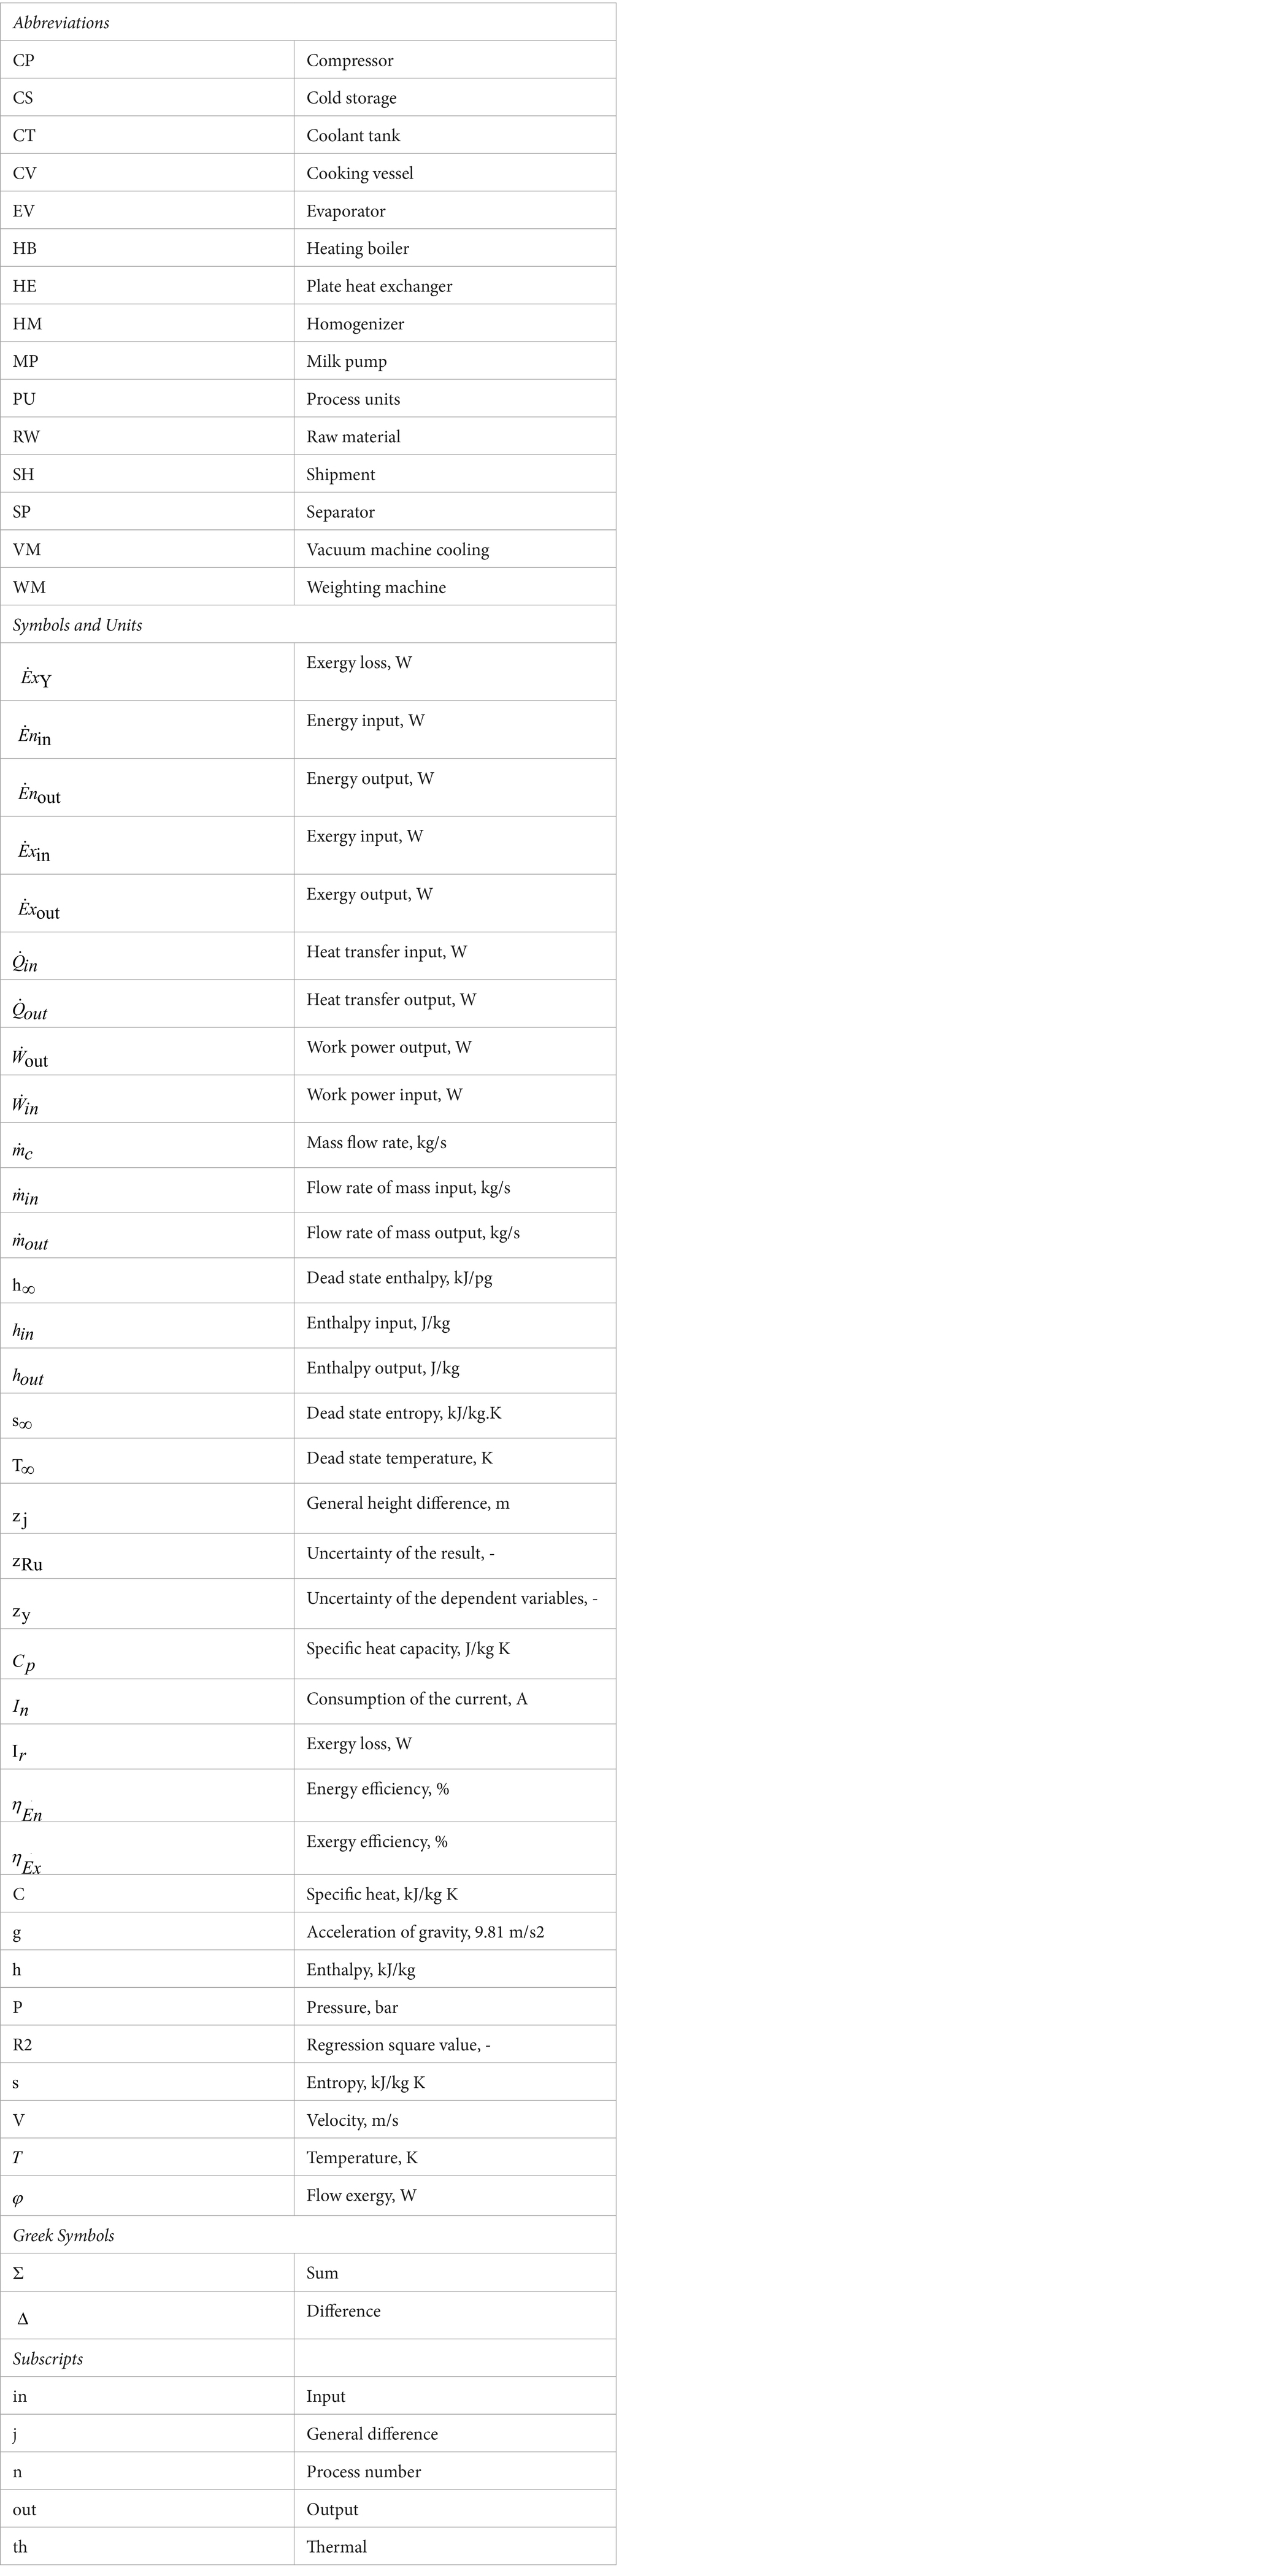
Nomenclature
Appendix
A1. Energy and exergy analysis of the process’s equations
This study focused on physical exergy, excluding chemical and fat-formation exergy from the assessments because of their insignificance in the context of high yoghurt production in the process phases. The exergy calculation equations for steam generation, refrigeration, pasteurization, and yoghurt production lines are shown in Tables A1 to A3 in Appendix A.
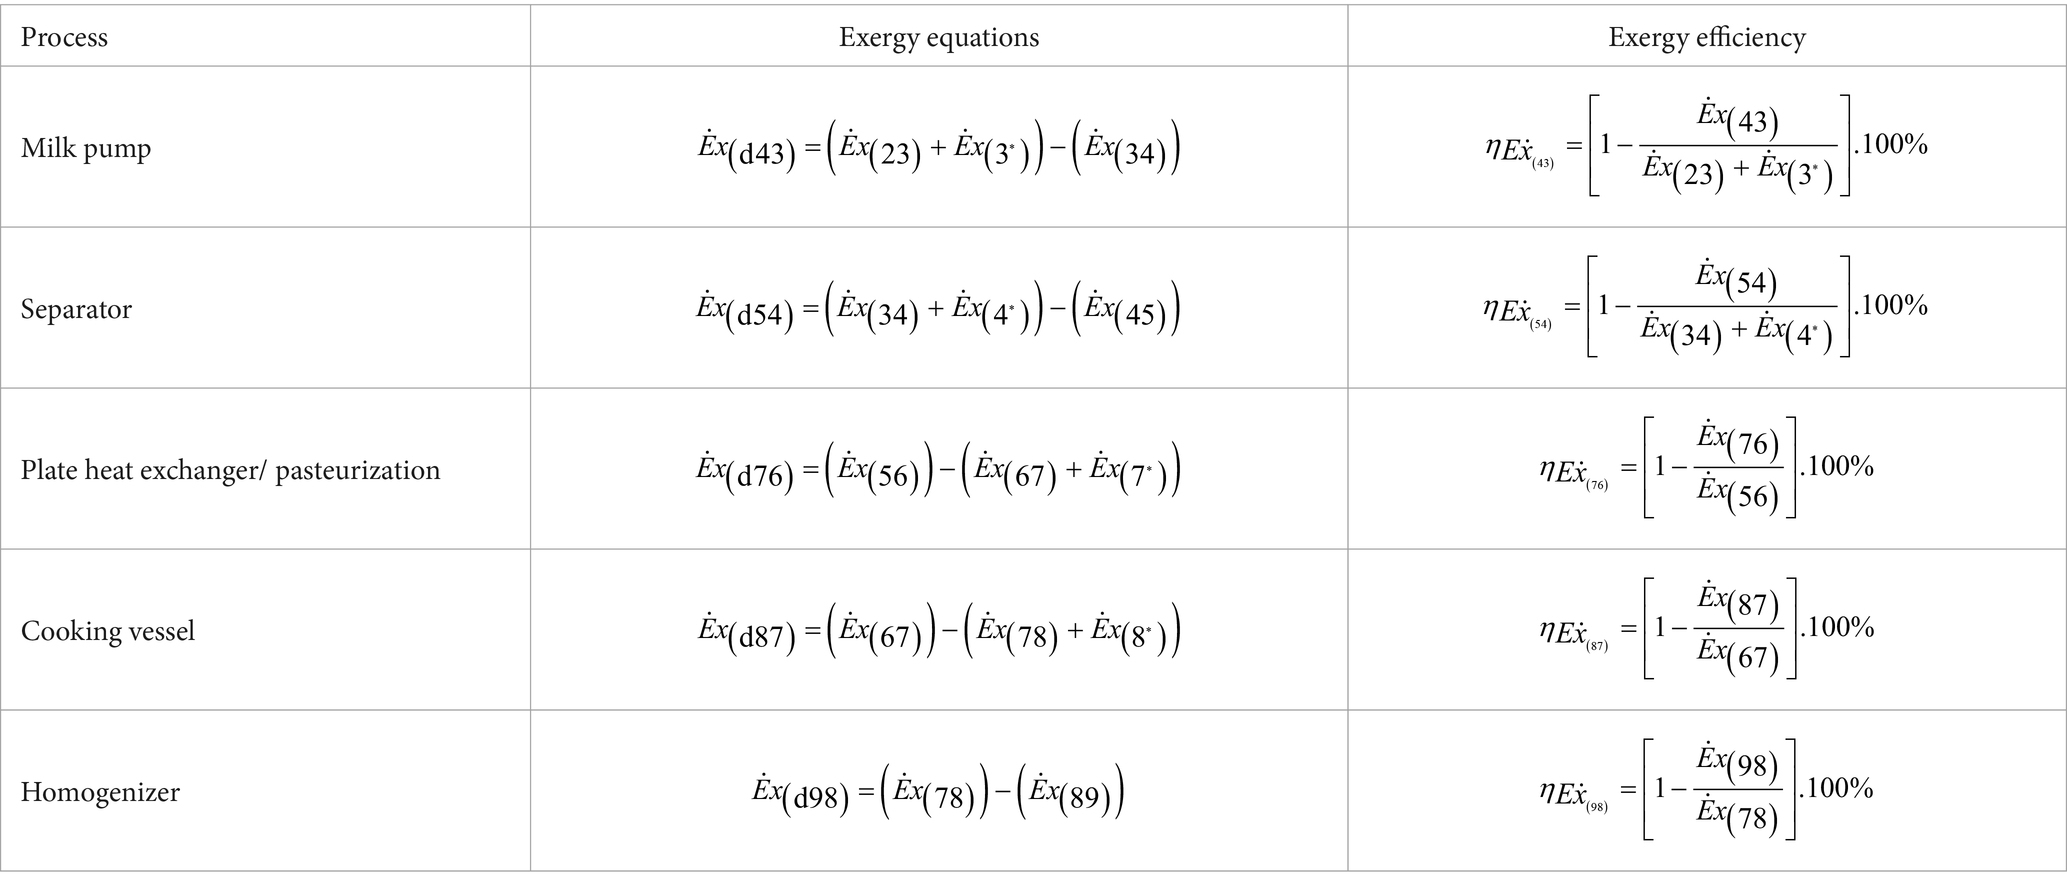
Table A1. Pasteurization unit (milk pump, separator, heat exchanger, cooker, pasteurization, and homogenizer) exergy destruction and efficiency equations
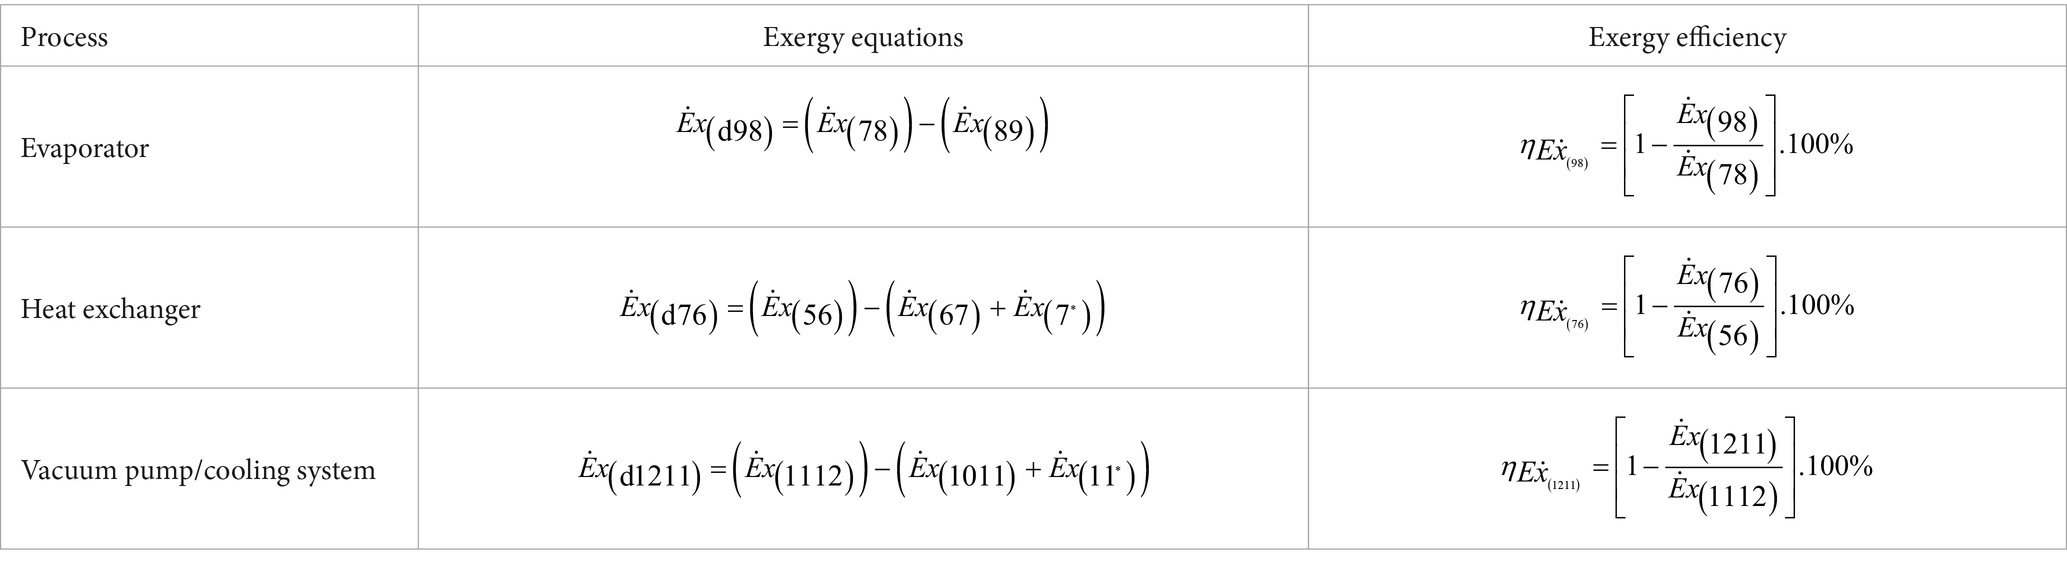
Table A2. Exergy destruction and efficiency equations for the yoghurt production unit (vacuum pump and evaporator, heat exchanger, plate heat exchanger, and cooling system).
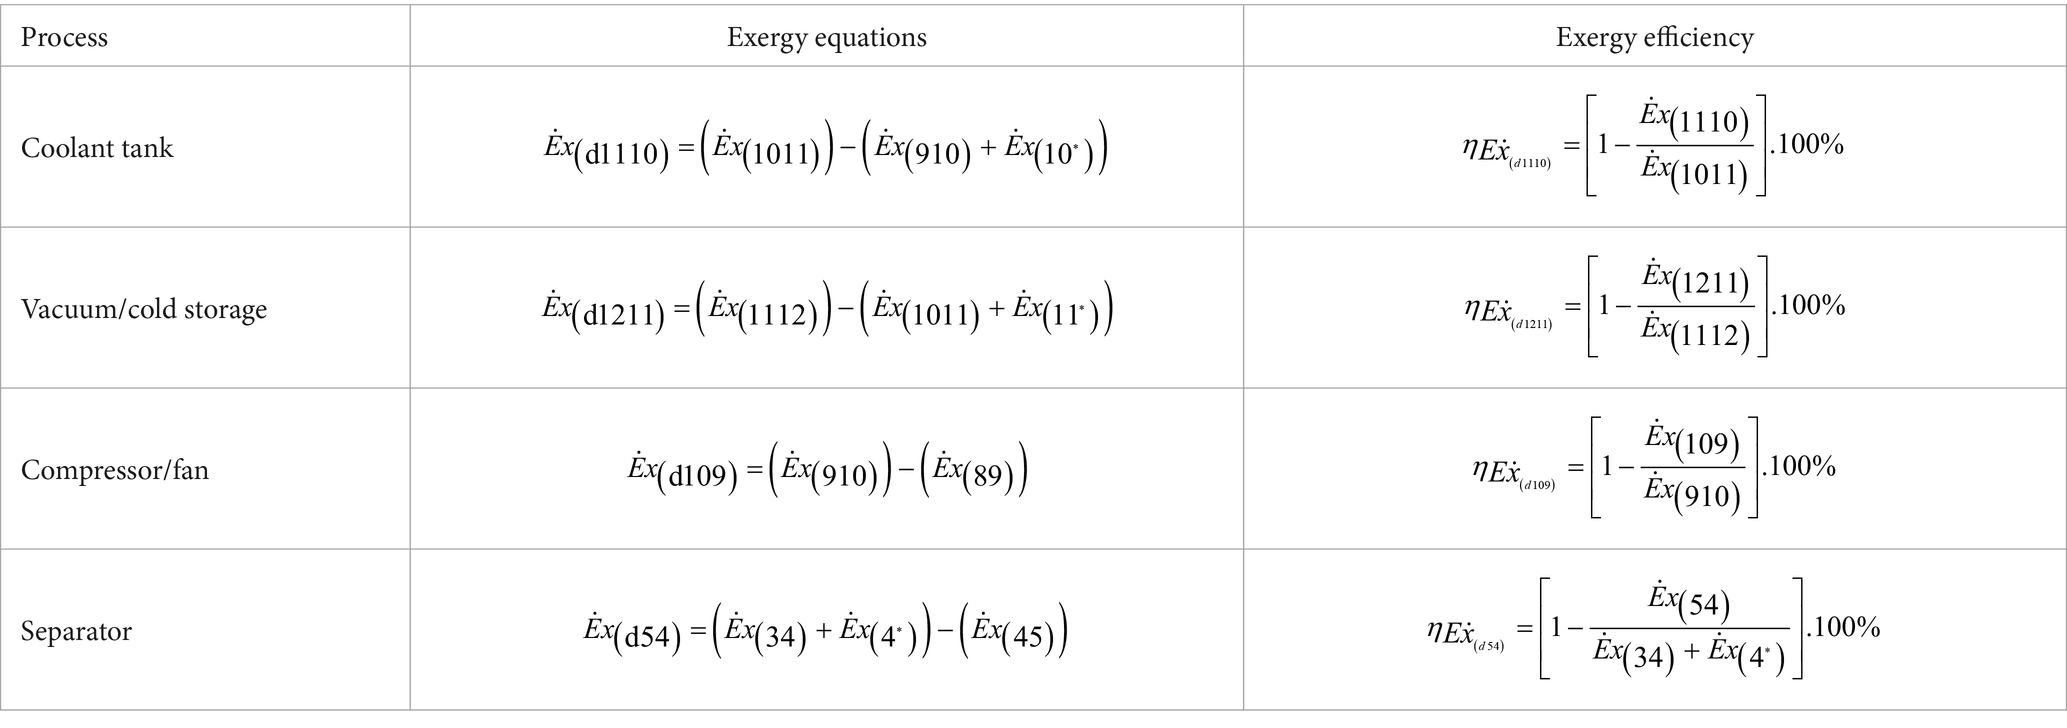
Table A3. Cooling and storage unit (vacuum machine cooling unit, coolant tank, condenser, cold storage, expansion valve, compressor, fan, and separator) exergy destruction and efficiency equations
Table A1 illustrates the exergy destruction and efficiency equations of the pasteurization unit (milk pump, separator, heat exchanger, cooker, pasteurization, and homogenizer) for the factory process.
Table A2 lists the exergy destruction and efficiency equations for the yoghurt production unit (vacuum pump and evaporator, heat exchanger, plate heat exchanger, and cooling system) in the factory process. Table A3 demonstrates the exergy and efficiency equations for the factory cooling and storage units (vacuum machine cooling unit, coolant tank, condenser, cold storage, expansion valve, compressor, fan, and separator). Table A4 displays the exergy destruction and efficiency equations for the factory’s steam system unit production (compressor, heat exchanger, condensate, pressure regulator, and boiler).
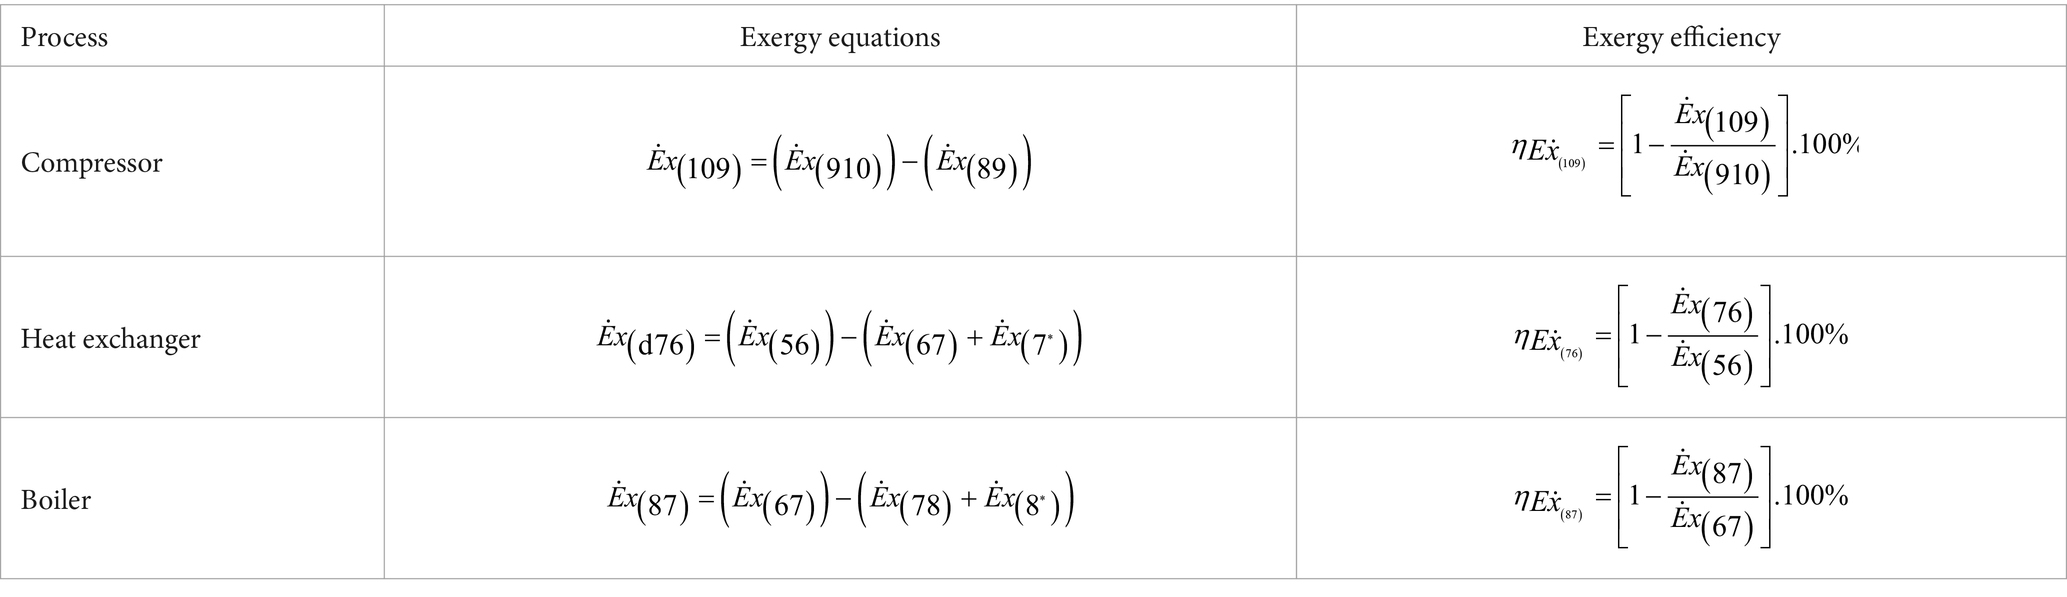
Table A4. Production of the steam system unit (compressor, heat exchanger, condensate, pressure regulator, and boiler) exergy destruction and efficiency equations
A2. Statistical method of the energy and exergy data
This study utilized statistical analysis to examine the data based on energy and exergy information. The mathematical reliability of the data was assessed using the SPSS 28.0 and Minitab 21.4.2 software. In addition, a statistical method was used to assess the reliability and accuracy of the data in the study. This involved conducting an uncertainty analysis of the measuring devices and an accuracy analysis of the factory process data (Table A5 and Table A6).
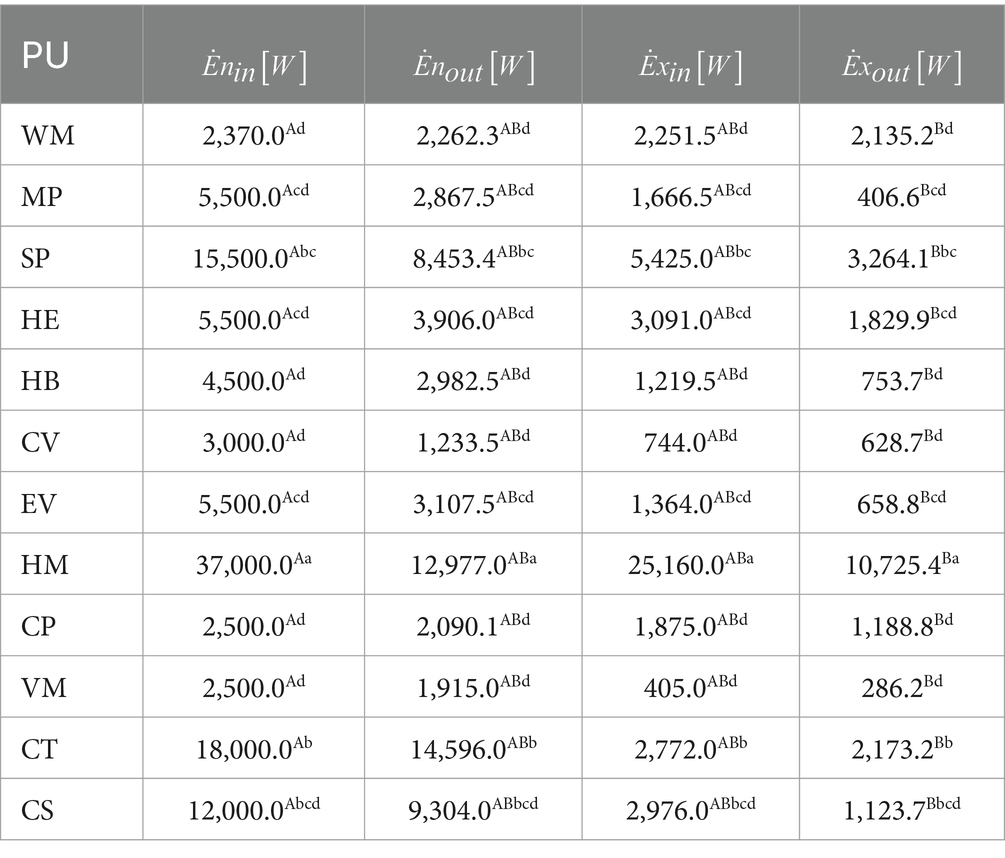
Table A5. Statistical analysis of the current data results for the yoghurt process
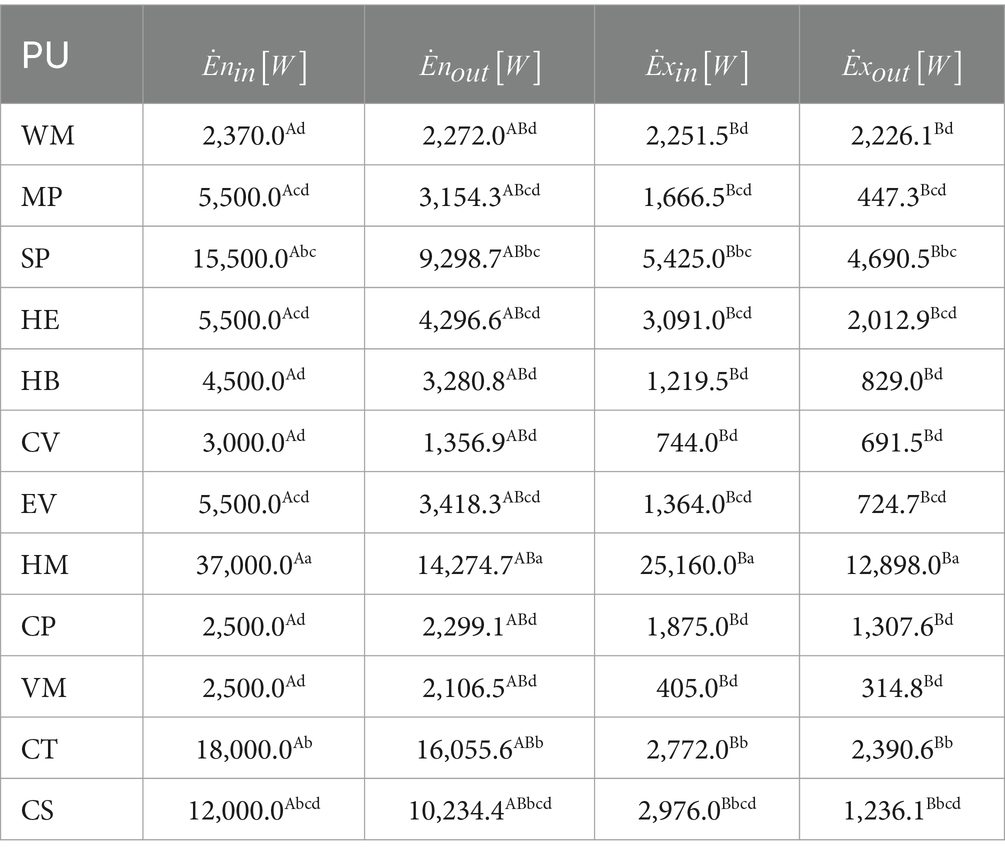
Table A6. Statistical analysis of the enhancement data results for the yoghurt process
Table A5 and Table A6 do not undergo any statistical analysis for data results regarding RW and SH. The data has been structured using the Tukey and Sidal pairwise comparisons method with a confidence level of 95%. The individual’s confidence level is 98.95%. Significant differences exist between items that do not share the letter “abcd”. ABCDThe uppercase letters in each column represent the comparison of the sample groups. If the samples are symbolized with the same letters, it indicates a statistically significant difference between them (p < 0.05). abcdThe lowercase letters in the same line are used to compare the energy and exergy quantities (input and output data), and there is a statistically significant difference between the processes represented by the same letters (p < 0.05).
Keywords: dairy milk plant, efficiency, energy, exergy, yoghurt
Citation: Oztuna Taner O (2024) Enhancement of the energy and exergy analysis capabilities of the yoghurt process: a case study of the dairy industry. Front. Sustain. Food Syst. 8:1450653. doi: 10.3389/fsufs.2024.1450653
Edited by:
Dimas Rahadian Aji Muhammad, Sebelas Maret University, IndonesiaReviewed by:
Adhitya Pitara Sanjaya, Sebelas Maret University, IndonesiaMehmet Esen, Firat University, Türkiye
Copyright © 2024 Oztuna Taner. This is an open-access article distributed under the terms of the Creative Commons Attribution License (CC BY). The use, distribution or reproduction in other forums is permitted, provided the original author(s) and the copyright owner(s) are credited and that the original publication in this journal is cited, in accordance with accepted academic practice. No use, distribution or reproduction is permitted which does not comply with these terms.
*Correspondence: Oznur Oztuna Taner, b290YW5lckBha3NhcmF5LmVkdS50cg==