 Cen Song
 Hanwen Shen1
 Jun Zhuang
- 1School of Economics and Management, China University of Petroleum, Beijing, China
- 2Department of Industrial and Systems Engineering, University at Buffalo, Buffalo, NY, United States
Alcoholic beverages have been a significant industry. However, they present food safety risks, necessitating heightened regulation and monitoring. The safety risk assessment of alcoholic beverages encompasses a variety of factors, including microorganisms, excessive methanol content, chemical adulteration, and food additives. The data used in this paper is sourced from the National Food Safety Sampling Inspection Results Query System in China. The primary conclusions are as follows: (1) A deviation reconstruction-based multi-weight decision model is proposed, which incorporates three distinct weight acquisition methods to perform optimization calculations. (2) The comparative investigations serve as evidence of the risk assessment model’s effectiveness. (3) The multi-weight decision model based on deviation reconstruction and the NSGA-II (non-dominated sorting genetic algorithm-II) exhibit excellent adaptability. The results of the risk assessment are analyzed, and recommendations are offered based on the categories of alcoholic beverages and the detection indicators. This paper investigates the regulation of food safety and the identification of risks in intoxicating beverages. It also transitions the response to food safety risks from a passive to an active protection strategy. This method has the potential to improve the public’s perception of safety and satisfaction with food-related concerns, as well as to provide the industry with practical solutions for sustainable growth. Simultaneously, this document establishes new risk assessment regulations for alcoholic beverages, offering recommendations for enhancing regulatory efficiency.
1 Introduction
As the socio-economic level continues to advance, alcoholic beverages have gained growing significance in people’s daily lives. This paper focuses on the study of alcoholic beverages, using the following aspects as the basis: First and foremost, the magnitude of alcoholic beverages is immense. In 2022, the National Bureau of Statistics (2023) reported that China’s production of alcoholic beverages exceeded 40 million kiloliters. This comprised 6.712 million kiloliters of Chinese Baijiu and 35.687 million kiloliters of beer. The production and sales rates of Chinese Baijiu and beer have exceeded 95%, leading to a total market value of the brewing business reaching an astonishing 4.5 trillion RMB. Moreover, there is still substantial untapped potential for expansion in the alcoholic beverages market. The World Health Organization (2018) estimated in 2016 that China’s per capita annual alcohol consumption would increase to 8.1 liters by 2025. In comparison, the predicted per capita annual alcohol consumption for the same period in the United States, the United Kingdom, Germany, and Russia were 10.3, 11.8, 12.6, and 12.4 liters, respectively. These figures suggest that there is still significant potential for growth in the Chinese alcoholic beverage market. Finally, alcoholic beverages have a distinct economic worth as a unique investment commodity. High-quality Chinese Baijiu products possess exceptional longevity, resistance to deterioration, and elimination, while also being subject to stringent control by producers in terms of sourcing, resulting in their remarkable scarcity and stability. The market price and the manufacturer’s suggested price exhibit a substantial disparity, rendering it an investment product that speculators actively chase due to interest rate differentials.
China plays a significant role in both the manufacturing and consumption of alcoholic beverages. The alcohol industry in China places great importance on ensuring high standards of quality and safety. This is crucial for the sector’s growth and the well-being of the population. Nevertheless, as alcoholic beverages gain popularity and the market expands, there has been a steady emergence of food safety concerns. For instance, in 2021, there was a reported issue of sodium cyclamate in Tanghua Liquor Industry in Maotai Town (Foodhappy 2021), as well as a persistent recurrence of counterfeit alcohol instances. To effectively regulate and prevent the reoccurrence of food safety incidents in alcoholic drinks, it is crucial to prioritize the assessment of identified or probable hazards. This requires the development of innovative approaches and techniques for evaluating food safety risks (Li et al., 2020; Song et al., 2022).
Alcoholic beverages pose quality and safety issues throughout the whole industry chain. Min and Yue (2023) categorized these risks as endogenous risks, exogenous risks, and quality risks, offering precise explanations for each category. Wang (2021) conducted a comprehensive investigation on different stages of alcohol production, including grain steaming, koji making, fermentation, and distillation. Their aim was to assess the effects of these processes on the quality and safety of alcohol. The study provides valuable insights and references that can be used for the advancement and quality management of the Chinese alcohol industry. Chen et al. (2019) examined the possible concerns with the quality and safety of Huangjiu manufacturing, specifically addressing the control of dangerous compounds throughout the entire process, including raw material selection, koji manufacture, fermentation, and aging. By effectively integrating existing knowledge and empirical evidence, precise and consistent risk assessment outcomes may be generated for alcoholic beverages. These outcomes can then be utilized to enhance the monitoring and examination of alcoholic beverages, foster industry growth, and advance food safety assurance technologies.
In order to effectively oversee and avoid the reoccurrence of food safety incidents related to alcoholic beverages, it is crucial to use innovative approaches and techniques for assessing food safety risks. Food safety risk assessment entails the systematic observation, surveillance, and numerical examination of food safety hazards to describe and analyze potential food safety concerns (Song et al., 2020). To avoid the impracticality of sampling every alcoholic beverage individually, it is advisable to prioritize known and possibly problematic samples for targeted supervision. This approach can effectively prevent food safety issues. An important focus of food safety supervision is the utilization of inspection data, including pass rates and indicator information, to extract and analyze information to assess the status of food safety.
The novel contributions of this study are outlined as follows: (1) this study aims to examine the quality and safety of food during the production process. It involves examining and evaluating the risks associated with food safety to quantify them and offer specific suggestions to food production companies. (2) The current research utilizes the NSGA-2 algorithm to provide a quantitative risk assessment approach that considers several factors. This method overcomes the limits of existing risk assessment strategies that only rely on sampling. It also addresses concerns of bias, subjectivity, and data imbalance to some extent. (3) This study enhances the safety risk assessment of alcoholic beverages by incorporating a multi-criteria decision-making model. The model is optimized using algorithmic iteration to analyze potential risks and offer appropriate recommendations and strategies. Consequently, this research contributes to the enhancement of the food safety management system.
The current research integrates detection data on alcoholic beverages and specifically examines six categories of harmful elements in alcohol detection, including metal pollutants, pesticide pollutants, food additives, quality indicators, microbial contamination, and non-food contamination. Various risk assessment methodologies are employed to analyze the risks associated with alcoholic beverages. These methodologies involve the integration of prior information and experimental data to ensure reliable and consistent risk assessment outcomes. This paper offers guidance for the supervision and surveillance of the safety of alcoholic beverages, which promotes the growth of the alcoholic beverage industry and enhances food safety assurance technology. The subsequent sections of this work are structured in the following manner. Section 2 presents a comprehensive analysis of the existing literature on food safety evaluation and the NSGA-II algorithm. Section 3 provides an overview of the materials and procedures employed in this work. Section 4 presents an empirical analysis utilizing the government sampling dataset. Section 5 offers a comprehensive conclusion to this paper from different perspectives.
2 Literature review
2.1 Research on safety risks of alcoholic beverages
China plays a significant role in both the production and consumption of alcoholic beverages. The risk of alcohol quality safety permeates the entire industrial chain. Min and Yue (2023) categorized the risk associated with the safety of alcohol quality into three types: endogenous risks, exogenous risks, and quality risks. In their study, Wang et al. (2021) examined the several stages involved in alcohol production, including steaming, mixing, fermentation, and distillation. Their findings offer valuable insights for the advancement of China’s alcohol sector and the enhancement of product quality control. In their study, Chen et al. (2019) examined the potential safety concerns about the quality and presence of dangerous compounds in the manufacture of Chinese rice wine. This investigation encompassed many stages of the manufacturing process, such as the selection of raw materials, fermentation, aging, and other related procedures. Yang et al. (2019) conducted an analysis of the primary elements that influence the quality and safety of grape raw materials and the process of making wine in China. This analysis was based on the existing regulations and standards. They provided recommendations for enhancing the quality and safety of wine using standards and technological advancements. Foreign scholars have also performed thorough research on the safety hazards associated with alcoholic beverages. Leonardi and Portinale (2017) developed a machine learning classifier using a Bayesian network model to analyze the different characteristics of Piedmont (Italy) wine. This approach offers an efficient way to detect fraudulent local wine.
2.2 Research on methods in food safety assessment
The subject of food safety risk assessment is intricate and demanding, including many qualitative and quantitative indicators. It necessitates the thorough use of diverse assessment methods and standards (Gupta et al., 2023). Food safety risk assessment study faces substantial obstacles due to the large volume of data and the complexity of standard unification. The National Food Safety Inspection Results Query System reveals that prevalent food safety risk factors encompass pesticide and veterinary medicine residues, food additives, biotoxins, microbiological residues, and chemical contamination, among other factors (Han et al., 2022). When considering the evaluation process, food safety assessment methods can be categorized into two groups: comprehensive evaluation methods and machine learning approaches. Comprehensive evaluation methods are appropriate for circumstances that need the consideration of various indicators in a comprehensive manner and can offer an intuitive assessment of risk levels (Song and Zhuang, 2017). In contrast, machine learning techniques offer benefits in handling large volumes of data and identifying intricate patterns, hence revealing potential non-linear correlations and patterns (Bao et al., 2023). Furthermore, it is essential for food safety risk assessment to be a dynamic process that consistently enhances and adapts evaluation methodologies to uphold the precision and dependability of the evaluation outcomes (Deng et al., 2021). Zamiri-Noghreh et al. (2023) examine the conduct of participants in the food supply chain by employing the game theory methodology. The experimental findings demonstrate that with the implementation of suitable legislation, the government can effectively deter the utilization of unapproved chemical additives by participants in the food supply chain.
The comprehensive evaluation method is a widely employed approach for the qualitative or quantitative assessment of various indicators (Zhu et al., 2021; Boggia et al., 2023). Wang and Chen (2014) used an enhanced analytical hierarchy process to examine different indicators of an early warning system. They also used the fuzzy comprehensive evaluation method to determine the significance of each indicator. As a result, they developed a safety warning system using fuzzy clustering and principal component analysis. Another often utilized strategy is implementing an indication system followed by conducting a thorough examination. Wang and Yue (2017) developed a safety warning strategy for mitigating food transportation hazards. They implemented a sustainable data mining approach to continuously monitor and identify potential dangers using warning criteria. They utilized internet technology and association rule mining technologies in the realm of food safety monitoring, resulting in a decrease in the potential hazards to the food supply chain. Ma et al. (2020) suggested an enhanced AHP-based data analysis approach for assessing food safety indicators. This method allows for the calculation of risk values for different components of food safety.
Some scholars combined comprehensive evaluation methods with machine learning methods to study food safety risks. As an illustration, Huang et al. (2020) introduced a parallel LSTM model to forecast the risk level of non-compliant and high-risk merchants. They also developed a dataset for evaluating food safety. Westerveld et al. (2021) incorporated the extreme gradient-boosting machine learning model into food safety prediction and achieved high accuracy in forecasting the long-term safety of grains.
From the literature review of food safety evaluation methods, the following deductions can be made: (1) Comprehensive evaluation and machine learning are now the dominant approaches used for assessing food safety. By combining these two methodologies, we may exploit their respective strengths to investigate and assess food safety concerns. (2) Developing a risk assessment model and hazard evaluation system is a very efficient research approach for conducting food safety risk assessment. (3) Food safety risk assessment methodologies must be regularly updated and refined in coordination with current national requirements to ensure they remain timely and realistic.
3 Materials and methods
3.1 Data acquisition and indicator selection
The data was obtained from the National Food Safety Sampling Inspection Results Query System’s inspection data on alcoholic foods, which were published from 2020 to 2022. The inspection data comprises various details, including product classification, product name, inspection judgment result, classification of non-conforming items, non-conforming items, non-conforming standard columns, detection values, regulatory limits, product specifications, trademarks, production dates, production enterprise names, production enterprise addresses, production provinces, sampling unit names, sampling unit addresses, notification times, notification numbers, notification units, execution measures, source links, inspection items, inspection levels, inspection agencies, and inspection standards. The primary objects of investigation are alcoholic beverages and their associated goods. Irrelevant information, such as trademarks, notification units, execution measures, and source connections that cannot be used as variable information for the study objectives, are excluded and removed.
The risk categories for alcoholic beverages typically include quality indicators, food additives, contaminants, biological toxins, pesticides, veterinary drugs, microorganisms, illegal additives, and other factors (China National Center for Food Safety Risk Assessment, 2023). The total data obtained amounted to 40,464 records, with part of the data shown in Table 1, where the inspection results are the actual detected values.
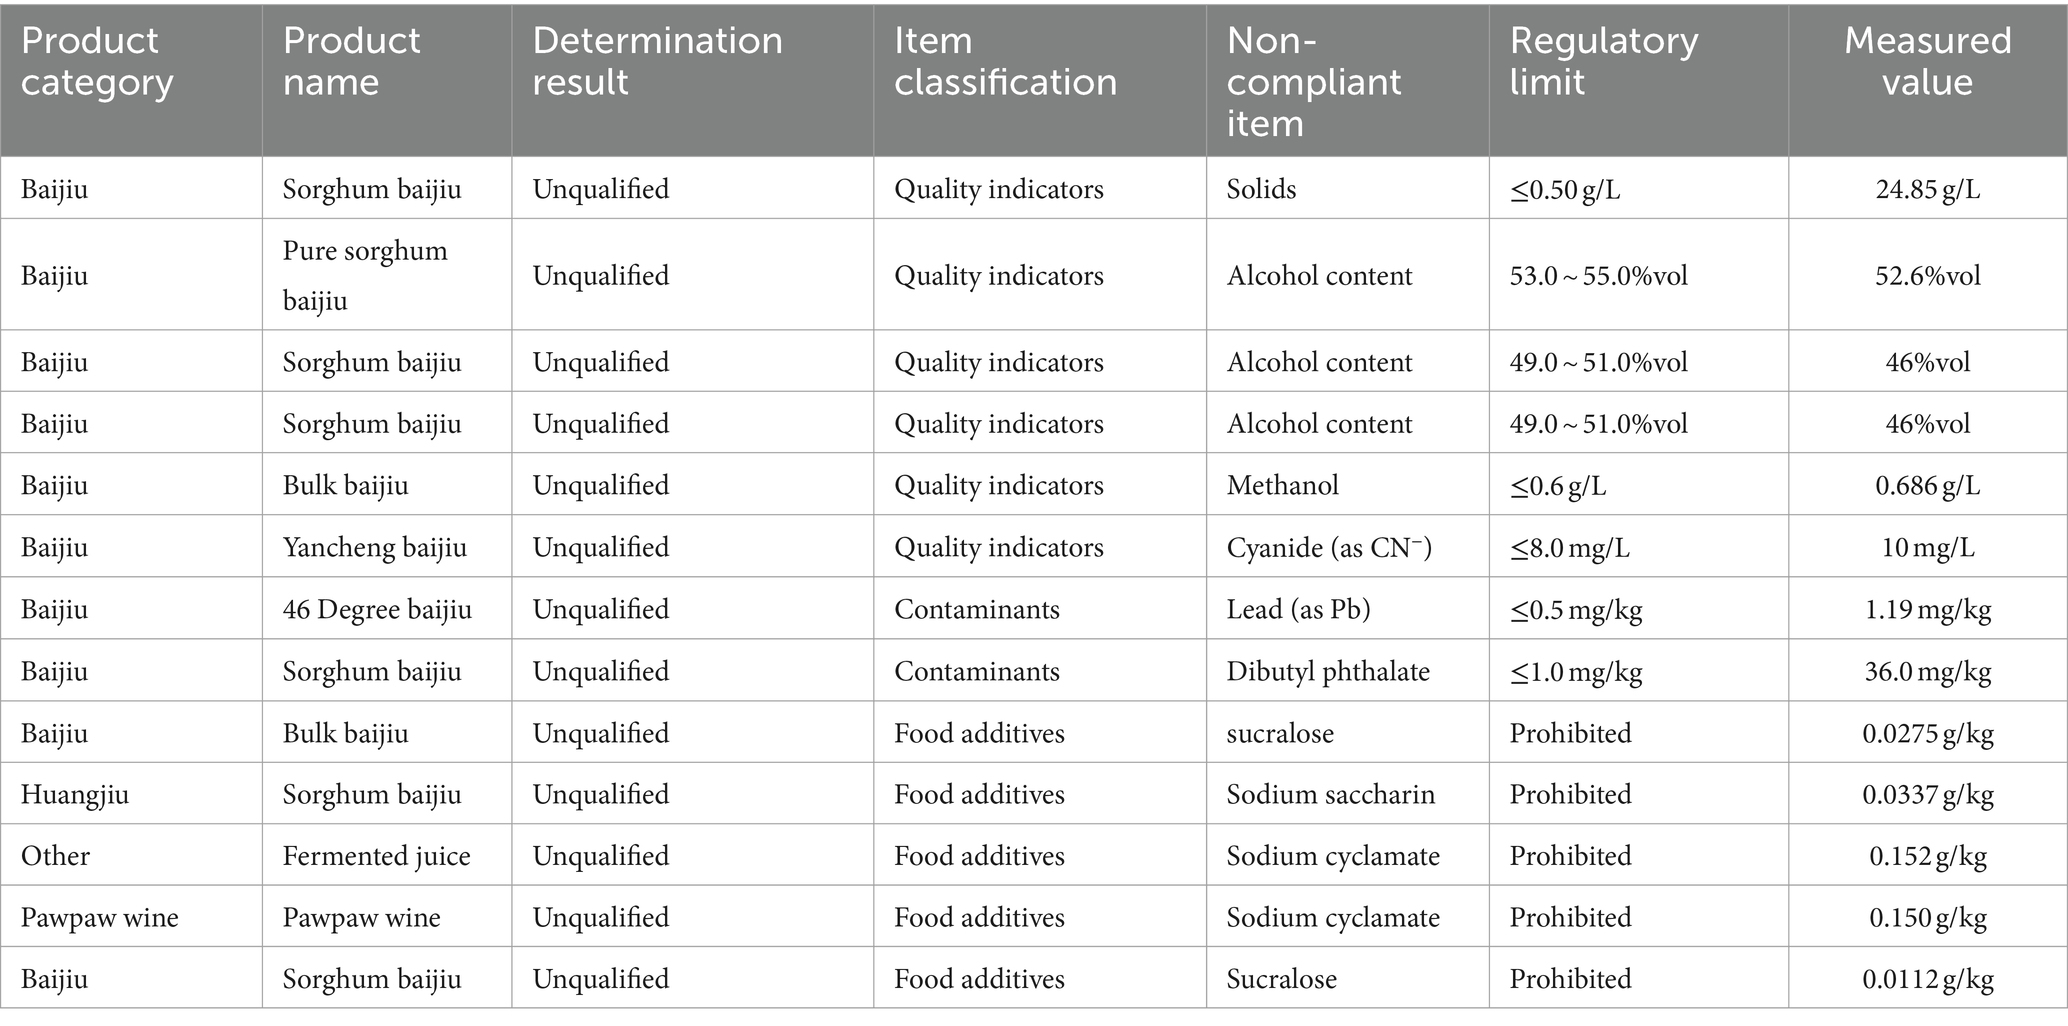
Table 1. Partial raw data of food safety supervision and sampling inspection.
Figure 1 shows the proportion of unqualified items in the inspection data.
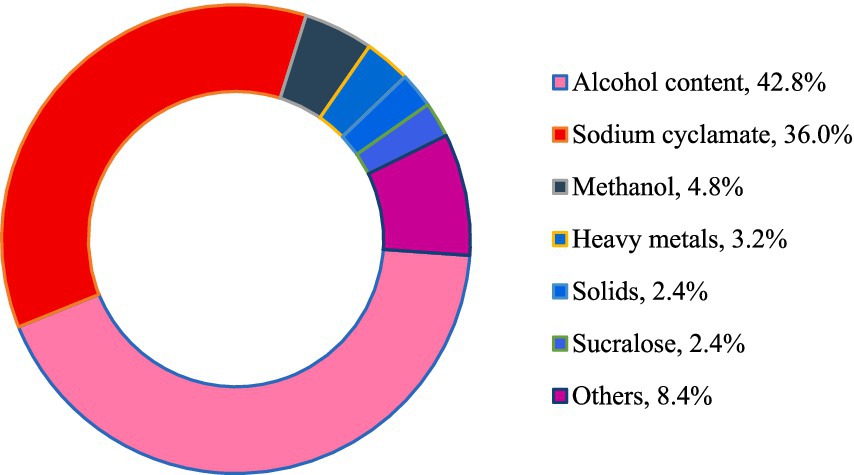
Figure 1. Proportion of unqualified indicators.
The risk indicators are chosen based on many criteria, which include: (1) Selecting representative indicators rather than all the indicators, as the possibility of a dimensional disaster during evaluation grows when there are dozens or more indicators. Choosing indicators with a significant proportion of non-conformance rates to indicate relevant risk categories can both decrease the burden and ensure the study’s success (Li et al., 2021). (2) Pertinent legislation, regulations, or standards for alcoholic beverages, primarily derived from the corresponding standards of the National Medical Products Administration; (3) the inherent qualities of alcoholic beverages, determined by production methods, ingredients, and storage conditions, among other factors. Alcoholic beverages, for instance, include a sterilizing effect that can potentially lower the danger of microbiological contamination. Additionally, these beverages contain indications that are poisonous and damaging. It is important to prioritize indicators that present substantial dangers to human health, such as heavy metals and banned chemicals. Additionally, economic and measurable aspects should be considered. The costs of detecting various indicators are subject to variation, and data normalization is necessary during the preprocessing phase. Hence, the assessment criteria considered the expense of detection and the measurability of the indicators. After considering the factors mentioned above, six key indicators are chosen to assess the safety hazards associated with alcoholic beverages. These indicators include alcohol concentration, sodium cyclamate, methanol, heavy metals, solids, and sucralose.
3.2 Weight acquisition
3.2.1 Entropy weighting method for weight calculation
The Entropy method is a weight calculation method based on the principle of information entropy. It is suitable for multi-criteria decision-making problems, especially in the case of relatively independent criteria indicators, different scales, and different data types. The steps are as follows:
1) Collect data for all indicators and normalize the data to enable comparison between indicators with different units and scales. The calculation methods for the positive and negative indicators are shown in Equations 1, 2, respectively.
For positive indicators:
For negative indicators:
2) Define the information entropy to calculate the entropy value of each indicator in the sample. Information entropy is a measure of the variability or uncertainty of indicators. The larger the entropy value, the greater the variability of the indicator, and the higher the weight.
The weight of the j-th indicator in the i-th sample is shown in Equation 3.
where, i = 1, 2, 3,..,n, and j = 1, 2, 3,..,m.
The entropy value of the j-th indicator is shown in Equation 4.
where, , (0 ).
3) Determine the coefficient of variation to calculate the weight of each indicator. The coefficient of variation is the ratio of the standard deviation to the mean value of the indicator, which represents the volatility or difference of the indicator. The larger the coefficient of variation, the greater the volatility of the indicator, and the higher the weight.
The difference coefficient of the j-th indicator is shown in Equation 5.
The weight of the j-th indicator is shown in Equation 6.
3.2.2 Improved AHP method for weight calculation
The AHP method is a weight calculation method based on hierarchy theory. By dividing the decision problem into multiple levels and using methods such as expert judgment and comparative evaluation for hierarchical analysis, the weights of various criteria were ultimately obtained. The traditional AHP method usually uses expert scoring to construct judgment matrices, but it has the disadvantage of high subjectivity (Zheng and Frey, 2004). This paper proposes improvements to the method of constructing judgment matrices from three aspects: the nature of the indicators themselves, legal rules, and expert scoring (Garre et al. 2020). The specific steps are as follows:
1) Quantify the nature of the indicators themselves and legal rules. The indicators are scored based on the toxicity and harm of the detected substances (Li et al., 2013). Higher levels of toxicity and harm result in a higher score. The toxicity and harm are referenced from the descriptions of the indicators provided by the National Medical Products Administration, shown in Table 2.

Table 2. Toxicity and harm assessment.
Additionally, the hazardous substance detection items can be categorized into “prohibited use” and “restricted use” categories in accordance with legal standards. The detection results of each indicator can be reported as “qualified,” “unqualified,” or “not detected.” Samples that contain prohibited hazardous substances are classified as high-risk and assigned the maximum possible score upon detection. The scoring for restricted hazardous compounds is determined by quantitatively comparing them to legal standards. Table 3 displays the legal standards for each indicator as stated by the National Medical Products Administration.
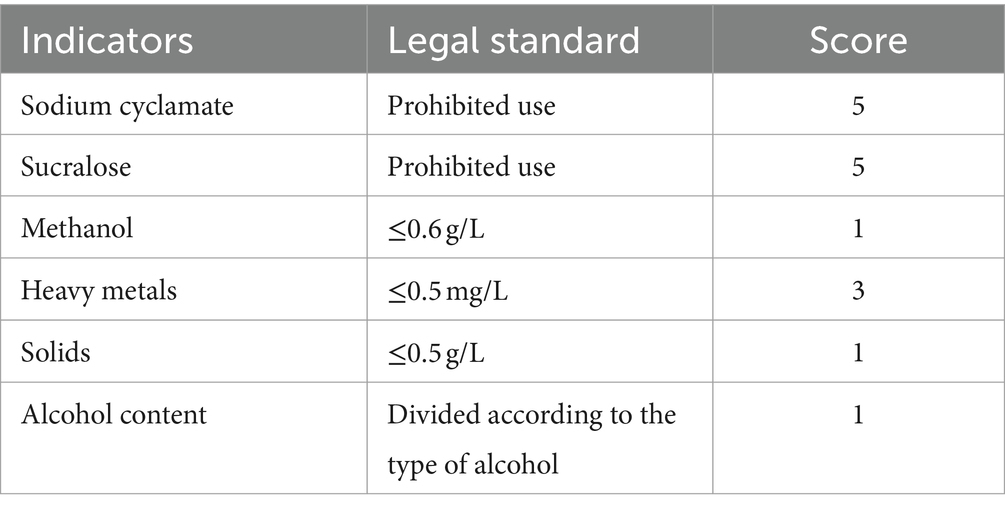
Table 3. Legal standards assessment.
Finally, the scores from the toxicity and harm assessment table, legal standards assessment table, and expert scoring table are combined in Table 4.
2) Construct the indicator judgment matrix
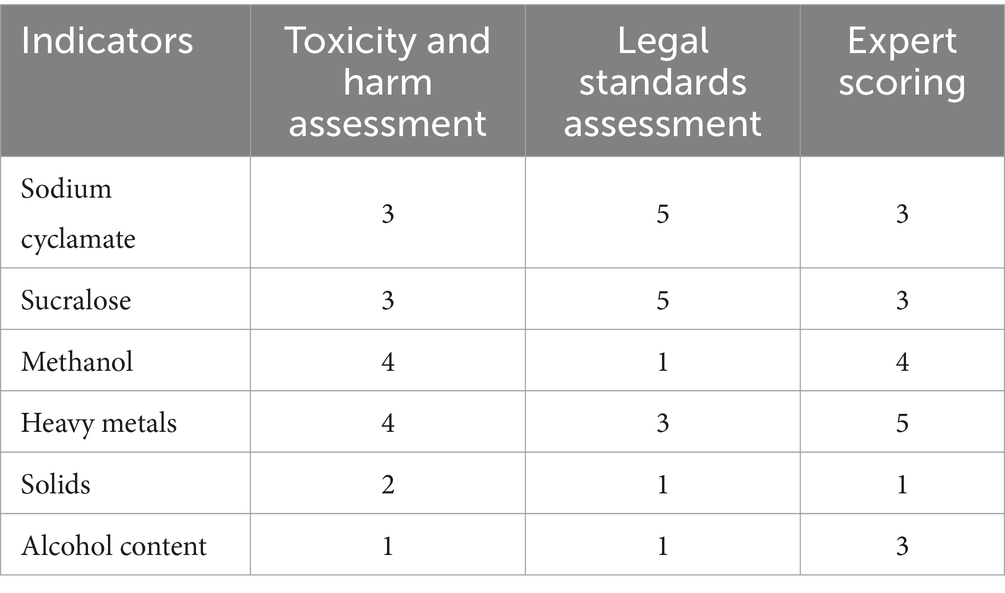
Table 4. Summary of indicator scores.
Based on weighted average method, the indicator judgment matrix is constructed in Table 5.
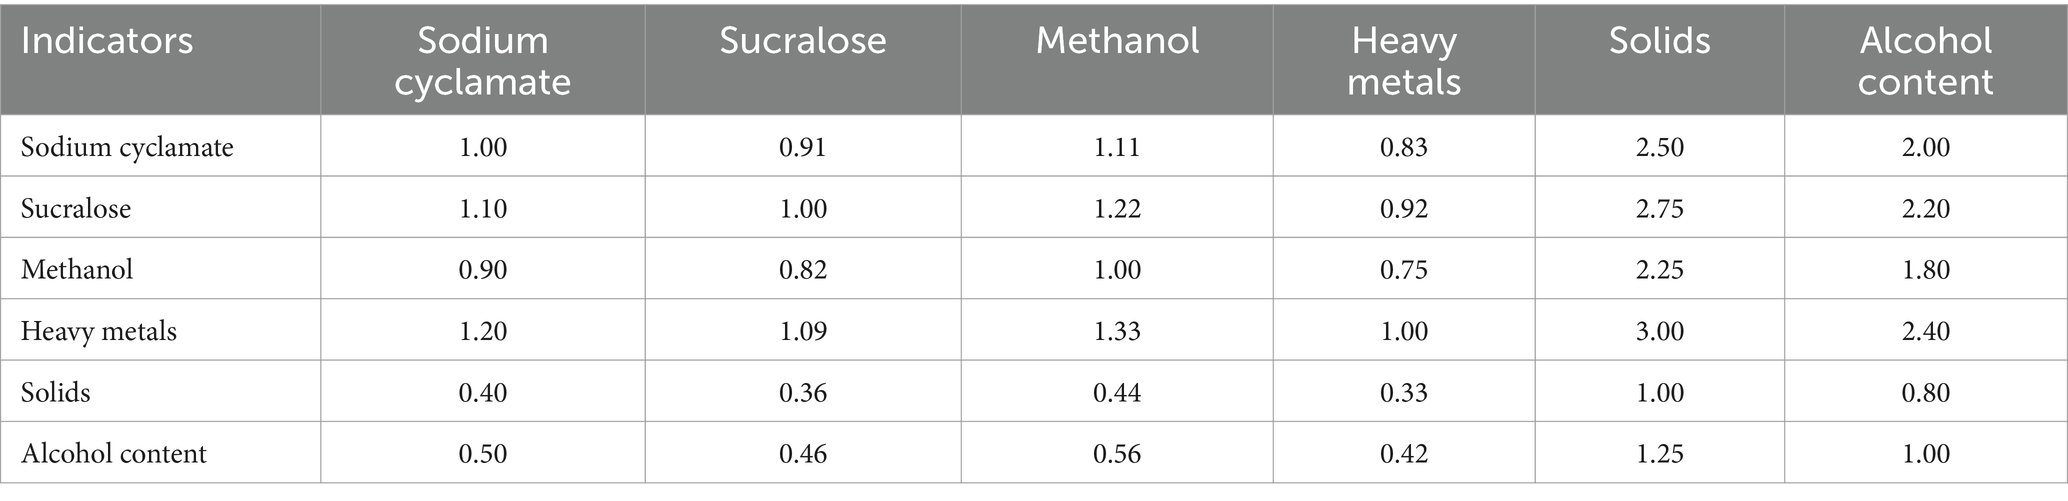
Table 5. Indicator judgment matrix.
3.2.3 CRITIC method for weight calculation
The CRITIC method is a multi-criteria decision-making approach that aims to objectively allocate weights to each indicator by considering both the strength of their comparisons and the conflicts between indicators. This method can accurately reflect the importance and interrelationships between indicators while also considering the variability of each indicator and its correlations. The steps of the CRITIC method are as follows:
1) Indicator normalization: normalize the evaluation indicators to the same scale for effective comparison.
2) Indicator variability calculation: measure the degree of variation of each indicator in the sample.
3) Indicator conflict calculation: measure the conflict between indicators by calculating their correlation coefficients. The higher the correlation coefficient, the more conflict exists between indicators and the more difficult it is to optimize them simultaneously.
4) Information quantity and weight calculation: calculate the information quantity of each indicator using the concept of information entropy. The greater the information quantity, the more important the indicator. Calculate the weight of each indicator based on both its variability and conflict.
Table 6 shows the results of the variability, conflict, information quantity, and weight of each indicator.
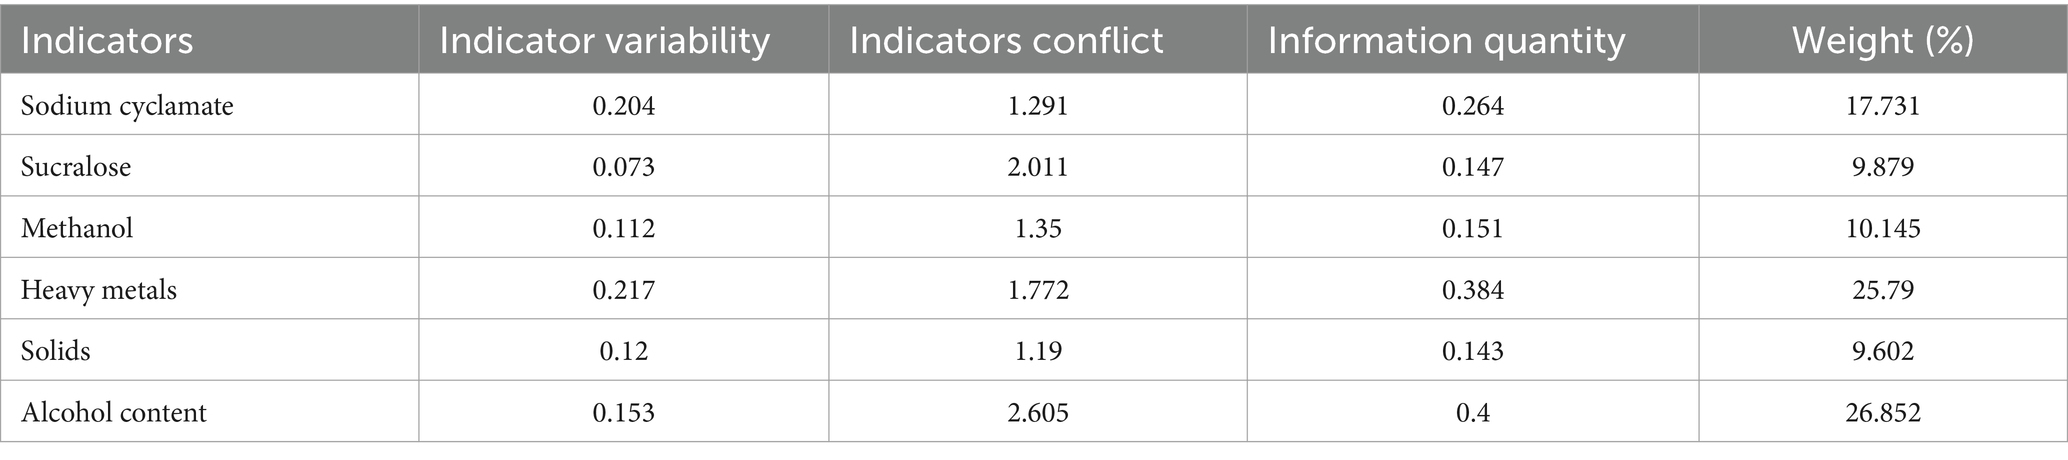
Table 6. Related calculation data of the CRITIC method.
Table 7 shows the weighting results from the entropy weighting method, the improved AHP method, and the CRITIC method.
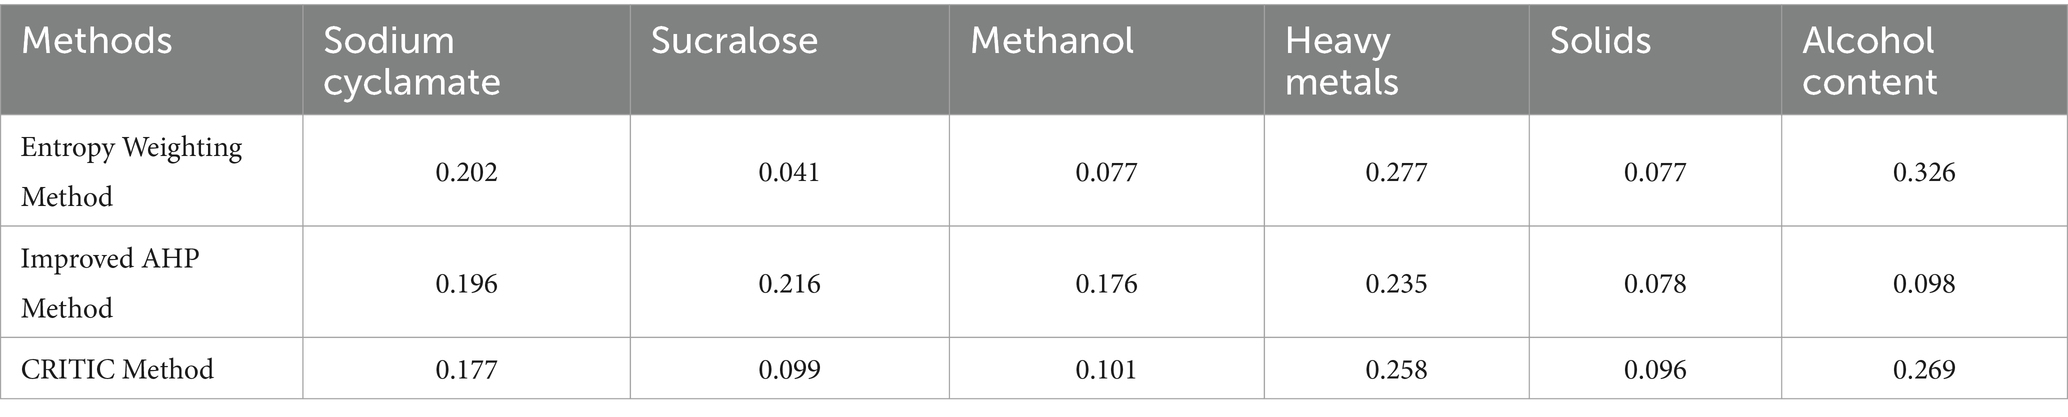
Table 7. Indicator weights of various methods.
3.3 Multi-weight decision model based on deviation reconstruction
There are six indicators related to alcoholic beverages, including alcohol content, sodium cyclamate, methanol, heavy metals, solids, and sucralose. The weights are determined by three different methods. The weighted vectors are constructed for each method, but each method has its advantages and disadvantages (Kou et al., 2014; Deng and Zhang, 2019). Therefore, a comprehensive analysis of the weights is constructed to identify a more accurate method. The deviation function is defined in Equation 7.
where .
is the target weight, is the weight of the six indicators calculated by the entropy weighting method, is the weight of the six indicators calculated by the improved AHP method, and is the weight of the six indicators calculated by the CRITIC method.
Equation 8 shows the relative deviation . Divide the weighted value of method by the weighted values of all methods to obtain the relative weight of method. Then, compare this relative weight with the relative weights obtained by each method under ideal conditions to derive the relative deviation. The smaller it is, the performance of this method is closer to the ideal situation and better.
where represents the number of methods, with = 3. m = 1, 2, 3.
Consider the minimum deviation for each method, ensuring positivity by using squared forms. Construct three distinct objective functions: the entropy weight method objective function , the improved AHP method objective function , and the CRITIC method objective function . They constitute a multi-objective optimization function, as shown in Equation 9.
where .
3.4 Weight optimization based on NSGA-II algorithm
The fundamental aspect of risk assessment methodologies is the determination of the weight of each indicator. Conventional methods to determine the weights of composite indicators, such as linear weighting and multiplication weighting, have inherent constraints. These methods can only yield a single set of answers, which often falls short of the optimal set. The study initially combines the weights derived from various approaches using deviation reconstruction. It then applies the NSGA-II algorithm to maximize the solution set of this multi-weight decision. The NSGA-II algorithm is capable of generating a Pareto front and fully considering factors such as expert subjectivity, overall data level, and data information to determine the optimal solution set.
3.4.1 Steps of NSGA-II algorithm
NSGA-II algorithm is a multi-objective optimization algorithm that Deb et al. improved based on the NSGA (Deb et al., 2002). The NSGA-II algorithm’s implementation involves a series of steps: initialization of the population, fast non-dominated sorting, crossover and mutation of the population, fusion of parent and offspring populations, and identification of the Pareto solution set (Yaghoubi and Fazli, 2023). The NSGA-II process flow diagram is shown in Figure 2.
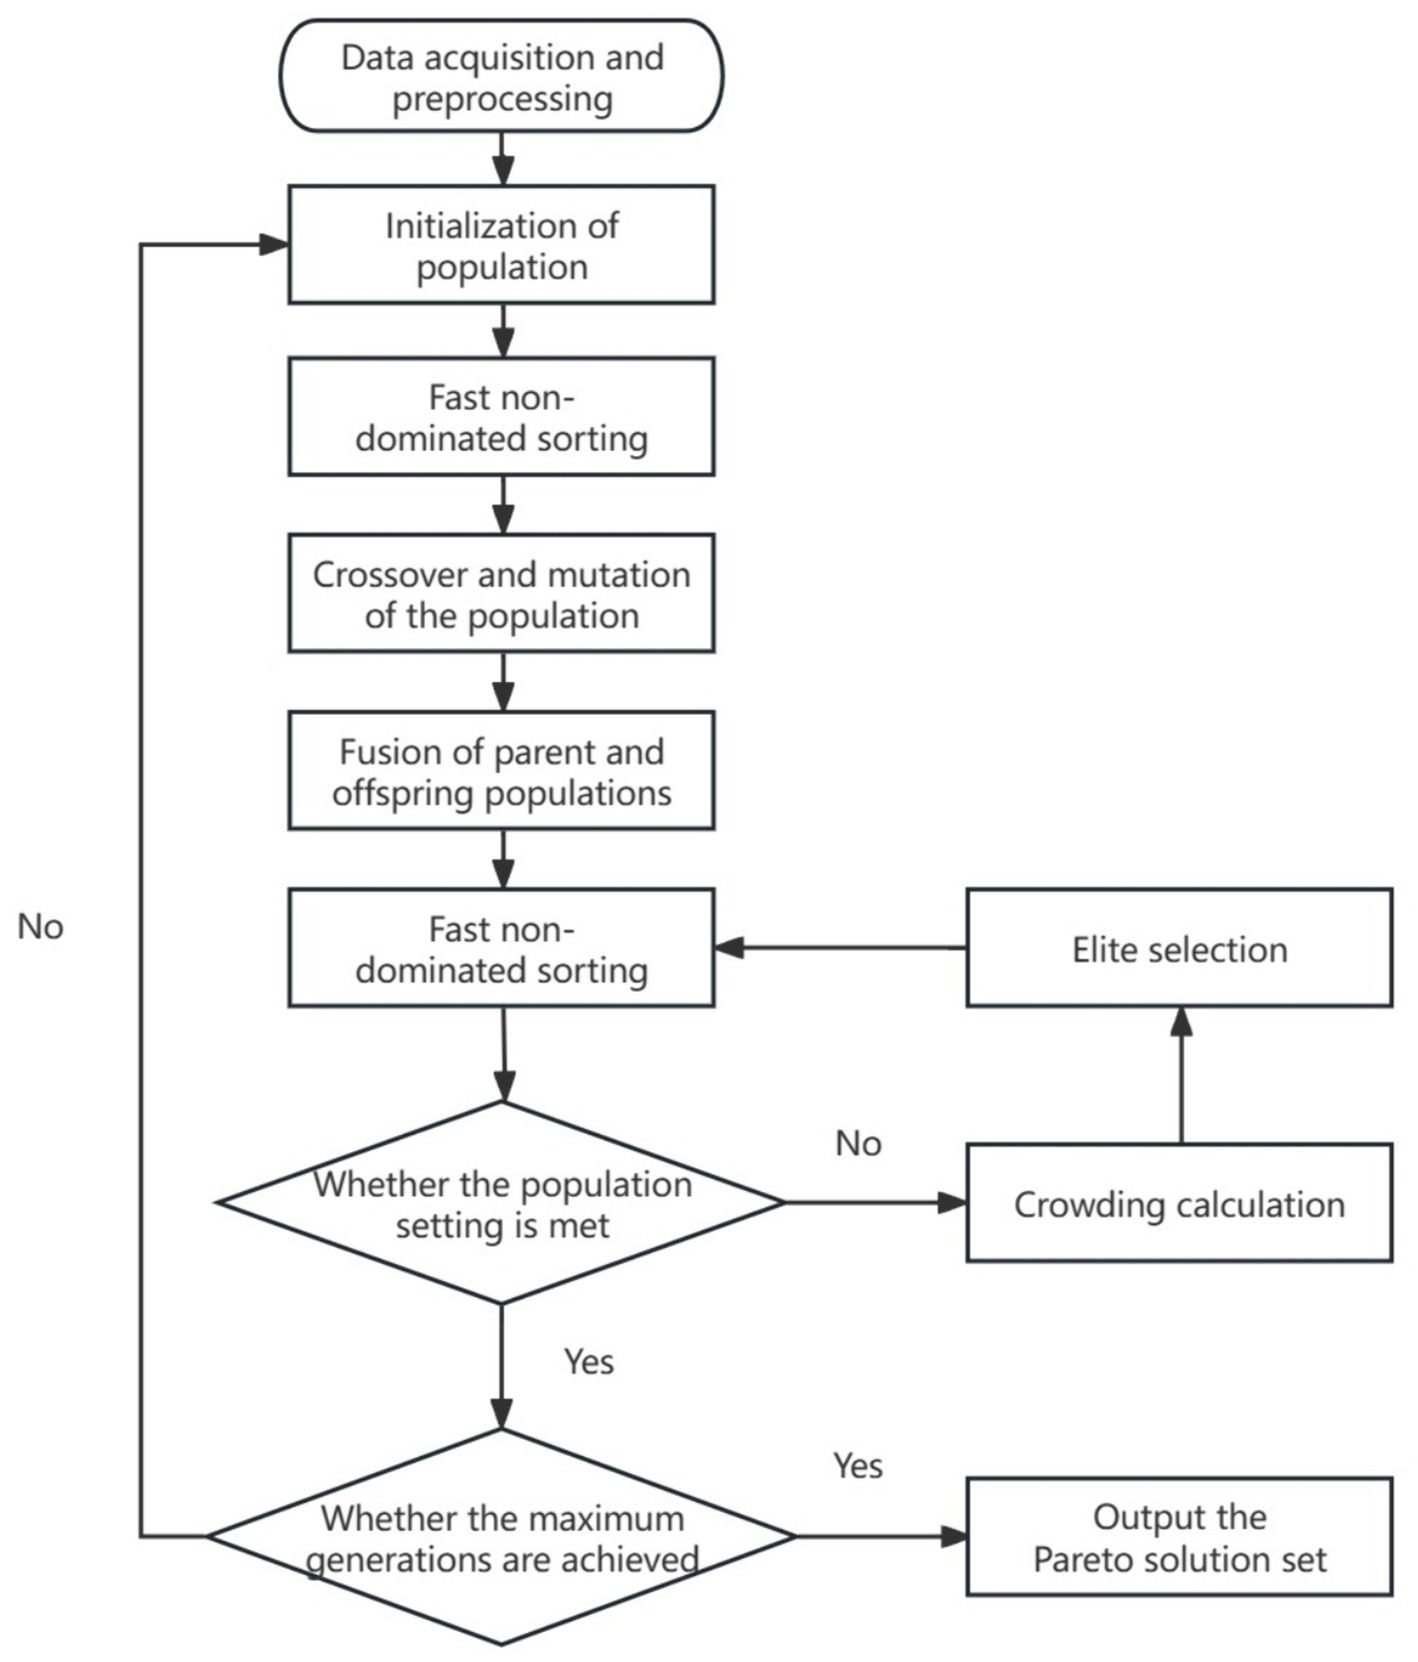
Figure 2. Implementation of NSGA-II algorithm.
Step 1: Develop a multi-objective optimization model by defining parameters for various objective functions and weight parameters. Construct an algorithmic model based on the DEAP framework.
Step 2: Initialize population parameters, including population size, maximum generation, crossover rate, and mutation rate. Once initialized, designate the initial parent population as ‘Pop’ and the offspring population as ‘Offspring’.
Step 3: Conduct fast, non-dominated sorting of the population and perform crossover and mutation operations. To enhance the algorithm’s ability to explore the solution space and avoid local optima, employ binary crossover and polynomial mutation algorithms.
Step 4: Combine the offspring population with the parent population after crossover and mutation, resulting in a population size of (pop + offspring). Remove duplicate individuals from this merged population before proceeding. If the deduplicated population size is less than Pop, use crossover and mutation algorithms to supplement it.
Step 5: Perform elite selection on the merged population ‘Pop’ using the following strategy: utilize the fast non-dominated algorithm for Pareto front sorting of all individuals in the population, establishing different Pareto front levels. Calculate the crowding distance for each individual in each Pareto front level using the crowding distance algorithm. This computation involves sorting individuals’ values in each level along each dimension of the objective function space and calculating the sum of distances between adjacent individuals as the crowding distance for each individual. Subsequently, prioritize individuals in each Pareto front level based on their crowding distance, starting from higher Pareto front levels and selecting individuals until the specified quantity limit is met.
Step 6: Check whether the specified maximum generations have been reached. If so, terminate the algorithm and output the Pareto front solution set. Otherwise, continue with the aforementioned operations until the maximum evolution generations are achieved.
3.4.2 Pareto solution set
The Pareto Solution Set is the set of all non-dominated solutions in multi-objective optimization problems. In this study, the Pareto Solution Set is determined by using the fast non-dominated sorting method and crowding distance calculation method, and is defined as follows:
S = {S1, S2, S3 , Sn}, where each solution Si is not dominated by any other solution. That is, for any solution Sj ∈ S (i ≠ j), at least one of the following two conditions is satisfied:
1) Si has at least one objective function value that is better than the corresponding value of Sj.
2) All objective function values of Si are equal to the corresponding values of Sj.
3.4.3 Binary crossover operator
In the crossover operation, the genes of the parent individuals are crossed according to a certain ratio to obtain two different offspring. The crossover factor is constructed based on the distance between the two offspring and their parent individual. It is applied to the genes of the offspring to obtain the final offspring shown in Equation 10.
where is a uniformly distributed random number on the [0,1] interval, is the precision of the variable, i is the i-th variable, and j represents the j-th gene.
After obtaining the crossover factor, the genes of the offspring individuals are obtained in Equations 11, 12.
where and are the j-th genes of the two parent individuals, respectively.
Finally, the offspring genes are constrained to ensure that their value ranges are within the variable’s value range. Once the offspring genes exceed the value range, they are truncated to the nearest boundary.
3.4.4 Polynomial mutation operator
The individual before mutation is and the individual after mutation is . The random variable δ follows the polynomial distribution. The arithmetic relationship among , and δ is shown in Equation 13.
where are the upper and lower bounds of variable .
Here δ is used to control the degree of mutation. Its value is determined in Equation 14.
Here y is an auxiliary variable calculated by Equation 15.
where r is a random number between 0 and 1, and eta is the control parameter to control the shape of the polynomial function.
When eta is small, the polynomial function is flatter, and the mutation range changes less significantly, which is suitable for fine-grained mutation searches. When eta is large, the polynomial function is steeper, and the mutation range changes significantly, which is suitable for coarse-grained mutation searches.
The degree of mutation for each mutation point is controlled, and it increases gradually with the distance from the mutation point. It ensures that the degree of local mutation is larger than that of global mutation, which can avoid getting trapped in local optima to some extent. Moreover, for the central point, the degree of mutation is more uniform, and the mutation is more stable. The risk of large jumps leading to a missing solution set is minimized, ensuring the accuracy of the search.
4 Empirical analysis
4.1 Basic parameters
A multi-objective optimization problem is solved by using the NSGA-II algorithm in the PyCharm Community Edition 2022. The parameters in the NSGA-II algorithm include x1, x2, x3, x4, x5, and x6, representing sodium cyclamate, sucralose, methanol, heavy metals, solids, and alcohol content, respectively. The population size is set to 150, and the evolutionary generation is set to 250. The crossover probability is set to 0.5, and the mutation probability is set to 0.2, with a mutation parameter of eta = 30.0.
4.2 Analysis of Pareto solutions
4.2.1 Convergence analysis of Pareto solutions
For multi-objective optimization functions, observing whether the Pareto front converges is an effective way to validate the experimental results. Convergence implies that the Pareto front undergoes substantial changes after each iteration, no matter whether it is able to maintain stability. The number of Pareto solutions is set as 50, 100, 150, and 250, respectively, to obtain the Pareto front plot as shown in Figure 3.
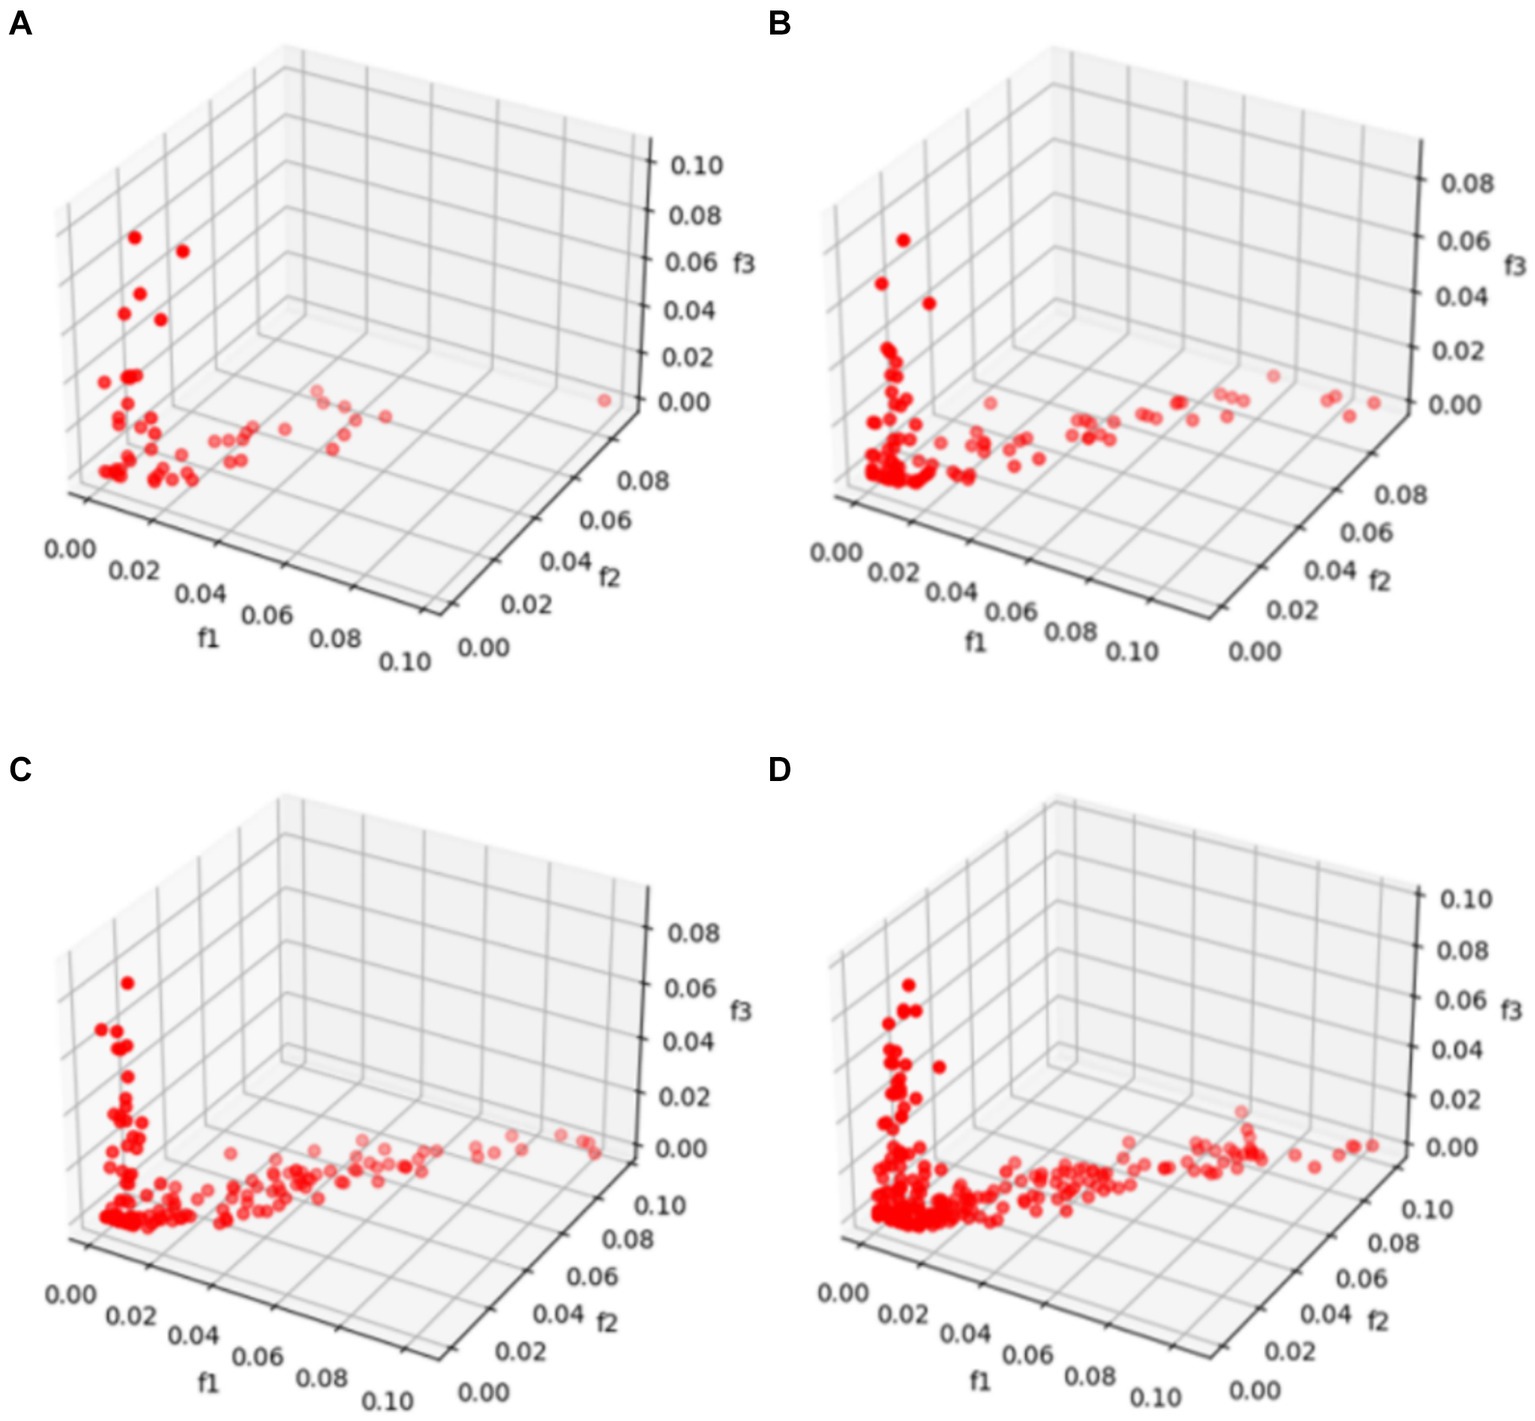
Figure 3. Comparison of different numbers of Pareto solutions. (A) Shows that when there are few numbers of solutions set as 50, the individuals are scattered randomly in the solution space. However, as the number of individuals increases in (B–D), their distributions show significant convergence, demonstrating the effectiveness and convergence of the NSGA-II algorithm.
4.2.2 Diversity assessment of Pareto solutions
The hypervolume indicator refers to the volume of the region in the target space enclosed by the non-dominated solution set obtained by the algorithm and the reference point. The advantage of HV is that it can evaluate both convergence and diversity simultaneously, but its complexity is high when facing high-dimensional multi-objective optimization. The selection of reference points can affect the accuracy of the hypervolume indicator to some extent. The calculation formula for the hypervolume indicator is shown in Equation 16.
where δ represents the Lebesgue measure for volume measurement, |S| indicates the number of non-dominated solution sets, and represents the hypervolume formed by the reference point and the i-th solution in the solution set.
This paper designs an experiment to calculate the hypervolume indicator of the Pareto solution set. Firstly, 50, 100, and 150 random Pareto solution sets are extracted, defined as the data to be solved. Secondly, a reference point is set as 1.0, 1.0, 1.0 that h can cover all Pareto solution sets, where the Pareto front of the objective function is located in the first quadrant, and the values of the objective function tend to zero. In addition, practical applications have shown that for minimization multi-objective optimization problems, using this reference point can effectively measure the coverage of the Pareto front (Fonseca et al., 2006; Si et al., 2015). Finally, according to the extracted Pareto solution sets and the reference point, parallel experiments are set up to reduce the influence of other factors and obtain the hypervolume indicator, as shown in Figure 4.

Figure 4. Boxplot of hypervolume.
Figure 4 shows that as the Pareto solution set increases, the mean of the hypervolume indicator shows an upward trend, indicating that the hypervolume index is effective in the experiment. The solution set obtained by the algorithm exhibits diversity and a convergence trend.
4.2.3 Comparative analysis
To verify the suitability of the NSGA-II algorithm for the proposed model, the genetic algorithm (GA) and least squares model (LS Model) are introduced for comparative experiments. In the PyCharm Community Edition 2022, a population size of 100, crossover probability of 50%, mutation probability of 33%, and 250 evolution generations are set for each method. By combining the NSGA-II algorithm, the genetic algorithm, the deviation-reconstructed multi-objective decision-making model, and the least squares model, four different methods for optimal solution sets are shown in Figure 5.
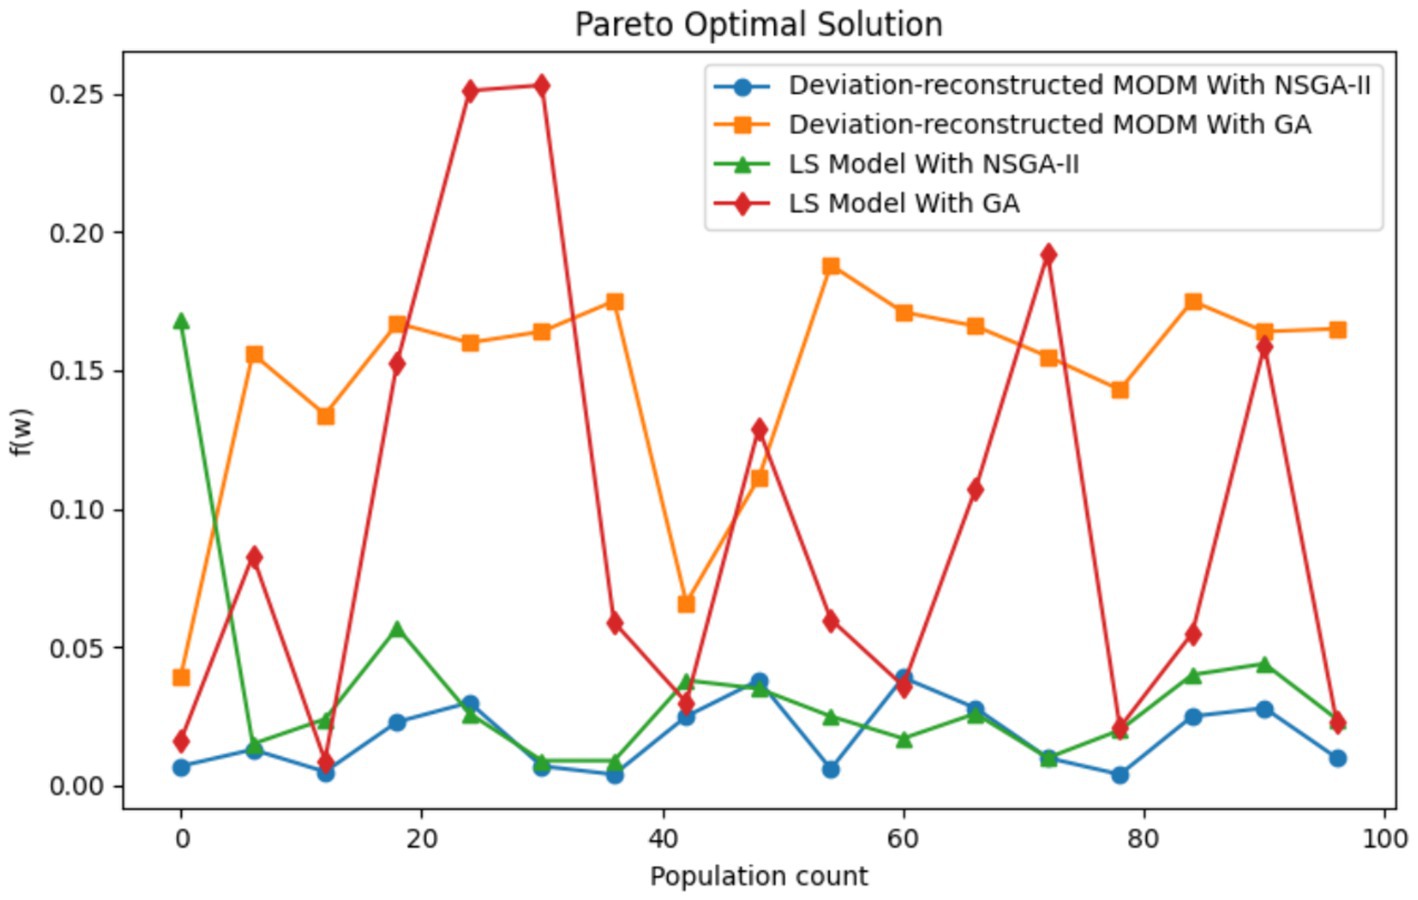
Figure 5. Comparison of solution sets of each method.
Figure 5 shows that the NSGA-II algorithm has a higher quality solution set overall for the deviation-reconstructed multi-objective decision-making model and outputs a more stable and less fluctuating solution set, which significantly reduces the difficulty of finding suitable solutions in the optimal solution set. Moreover, the deviation-reconstructed multi-objective decision model is significantly superior to the least squares model in terms of the accuracy of finding the optimal solution. The optimal solution’s fluctuation is smaller, demonstrating the model’s superiority in application in this field.
4.3 Indicator risk assessment
Based on the Pareto solution set, the weights of each indicator are set as 0.073 for sodium cyclamate, 0.192 for methanol, 0.113 for solids, 0.066 for heavy metals, 0.162 for sucralose, and 0.395 for alcohol content. Table 8 shows the risk assessment for different types of alcohol according to the weight of each indicator. The risk evaluation list shows the ratio of the total risk of each type of alcohol to the sample quantity.
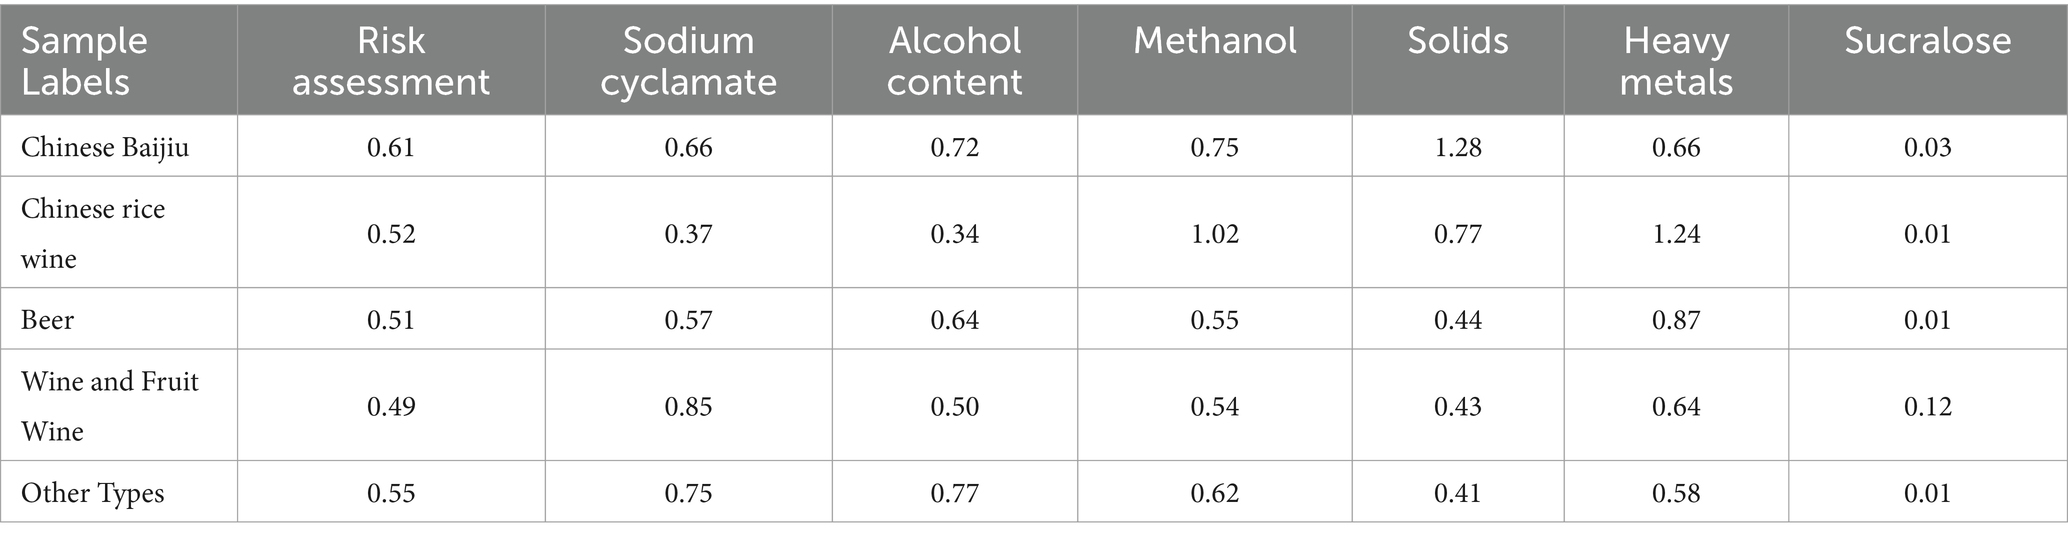
Table 8. Risk assessment for different types of alcohol.
From the perspective of different types of alcoholic beverage, the risk evaluation value of Chinese Baijiu is the highest. It is related to the raw materials and production processes of Chinese Baijiu, whose raw materials for Chinese Baijiu production are grains and legumes. High purity Chinese Baijiu cannot be directly obtained by small factories that carry out preliminary fermentation, and the raw materials or some additives added to improve the taste in the production process may also cause problems in the alcohol and solid content of Chinese Baijiu. Therefore, it is suggested that the regulatory authorities can take the two indicators of alcohol content and solids as a key point when testing Chinese Baijiu to improve the efficiency of testing and obtain results faster.
From the perspective of indicators, methanol and heavy metal indicators have a higher risk. It is related to the raw materials and environment of alcoholic beverages. Protein-and starch-rich raw materials tend to generate methanol and aldehydes at high temperatures, and some unscrupulous vendors also directly blend methanol into alcohol, resulting in significant food safety hazards. The heavy metal problem in alcoholic beverages is closely related to the quality of raw materials or environmental pollution during processing. Non-compliant additives and packaging materials can also cause similar problems. To address these issues, regulatory authorities should conduct regular or random inspections of the alcohol beverage production enterprises during the production supervision process, which can reduce or avoid food safety issues from the source.
4.4 Risk level classification
This paper combines existing risk weight data with raw data to provide a more detailed classification of the testing results of sampled products, which can improve sensitivity and accurate evaluation of food safety. The safety risk levels of detection items for alcoholic beverages are divided into five levels in Table 9.

Table 9. Standard for risk classification of detection items.
Based on the improved Argmax function, the comprehensive risk rating for alcoholic beverages is defined as shown in Equation 17.
where i refers to the safety risk rating of the detection items, and refers to the passing rate of the detection items i for each product (Figure 6).
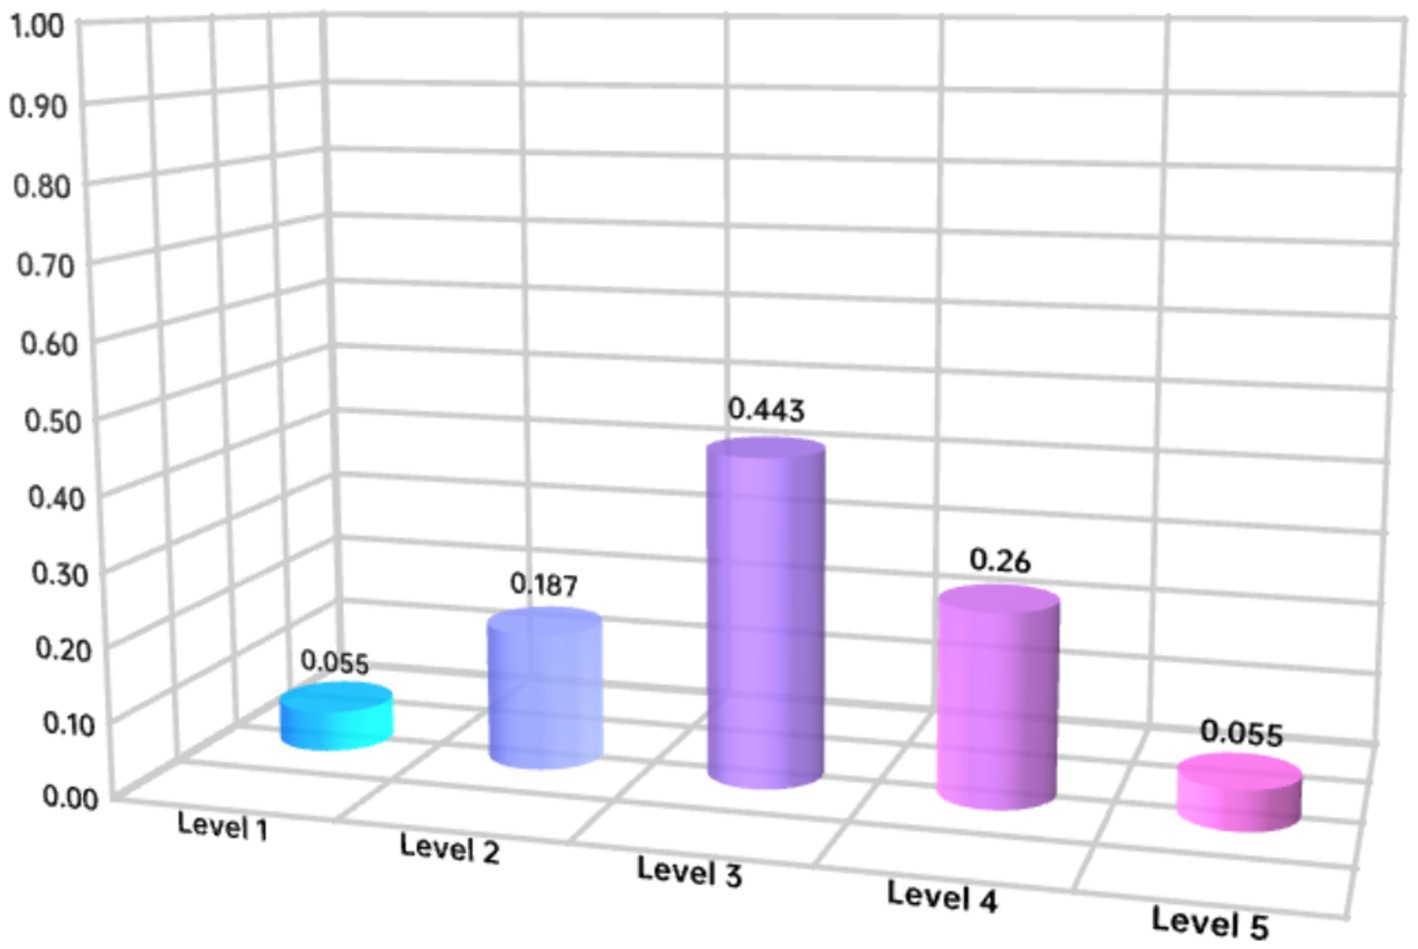
Figure 6. Comprehensive risk level of alcoholic beverages.
5 Conclusion and future research directions
This paper employs a novel risk assessment methodology that is based on a weighted analysis of monitoring data to examine the safety risks associated with alcoholic beverages. The study examines six specific categories of risk factors and offers risk evaluations from the viewpoints of both types of alcoholic beverages and types of hazards. The risk safety assessment method described in this paper is capable of effectively identifying potential safety hazards in alcoholic beverages and providing risk warning information. This method can assist consumers in transitioning from a reactive approach to a proactive one when dealing with food safety concerns. The study develops novel risk assessment guidelines for alcoholic beverages, offering a theoretical foundation for risk prevention and control measures, and providing guidance for enhancing regulatory effectiveness. The main conclusions are as follows:
1) Method innovation and weight assignment. The study employs an improved AHP method for assigning weights to risk indicators. This method integrates subjective weighting based on expert scoring, objective weighting derived from the toxicological properties of hazardous substances, and legal standard-based weighting. The multi-weighted decision-making model based on deviation reconstruction synthesizes the weights obtained from the improved AHP method, the entropy weighting method, and the CRITIC method. This approach optimizes weight calculations under constraints, establishing a comprehensive risk assessment system for alcoholic beverages.
2) Detailed risk assessment outcomes for alcoholic beverages. The proposed risk weighting methodology provides detailed risk assessment results by analyzing both the types of alcoholic beverages and their detection indicators. The evaluation results indicate that for different types of alcoholic beverages, Chinese baijiu poses a greater risk, with the risk primarily concentrated on its alcohol content and solids; for various risk indicators of alcoholic beverages, methanol and heavy metals present a higher risk and require focused attention.
3) Comparative analysis of decision models. The multi-weighted decision model based on deviation reconstruction is compared and analyzed with the least squares model, NSGA-II algorithm, and conventional genetic algorithm. It indicates that the NSGA-II algorithm and the deviation reconstruction-based multi-weighted decision model exhibit superior adaptability, achieving more stable and higher-quality solutions compared to the other models.
4) Strategic recommendations for risk regulation. Existing research and previous experience show the limitations of relying solely on qualitative evaluations or quantitative detections for large-scale food safety risk assessments. It suggests that combining qualitative and quantitative approaches can enhance the efficiency and effectiveness of regulatory efforts. For different types of alcoholic beverages, targeted detection strategies should be employed. High-risk detection indicators should be prioritized for sampling, while the frequency of detecting low-risk indicators should be reduced to minimize redundant work and improve efficiency.
The paper can be improved as follows:
1) Differential evolution algorithms, particle swarm optimization algorithms, and other algorithms can be introduced for model comparison experiments.
2) There is room for improvement in the NSGA-II algorithm, such as adaptive crossover and mutation factor strategies, and super-individual strategies, which can improve the optimization efficiency of the solution set and reduce the complexity of the work.
3) The source data contains regional information. Besides the analysis and comparison of alcoholic beverage types and indicator types, the analysis and comparison can also be conducted from the perspective of regions.
Data availability statement
The original contributions presented in the study are included in the article/supplementary material, further inquiries can be directed to the corresponding author.
Author contributions
CS: Conceptualization, Funding acquisition, Methodology, Writing – original draft. HS: Data curation, Formal analysis, Software, Writing – original draft. SA: Writing – review & editing. JZ: Supervision, Writing – review & editing.
Funding
The author(s) declare that financial support was received for the research, authorship, and/or publication of this article. This research was funded by National Natural Science Foundation of China grant number [71901218].
Conflict of interest
The authors declare that the research was conducted in the absence of any commercial or financial relationships that could be construed as a potential conflict of interest.
Publisher’s note
All claims expressed in this article are solely those of the authors and do not necessarily represent those of their affiliated organizations, or those of the publisher, the editors and the reviewers. Any product that may be evaluated in this article, or claim that may be made by its manufacturer, is not guaranteed or endorsed by the publisher.
References
Bao, S. H., Yin, D. Z., and Zhao, Q. Y. (2023). Comprehensive evaluation of the effect of five sterilization methods on the quality of black carrot juice based on PCA, TOPSIS and GRA models. Food Chem. X 17:100604.
Boggia, A., Fagioli, F. F., Paolotti, L., Ruiz, F., Cabello, J. M., and Rocchi, L. (2023). Using accounting dataset for agricultural sustainability assessment through a multi-criteria approach: an Italian case study. Int. Trans. Operat. Res.: J. Int. Federation of Operat. Res. Soc. 30, 2071–2093. doi: 10.1111/itor.13141
Chen, X. L., Yang, J., Li, X. S., Pei, J. J., and Xiao, Y. X. (2019). Research progress on quality analysis and quality safety control of Chinese rice wine. J. Food Saf. Qual. 10, 1582–1587.
China National Center for Food Safety Risk Assessment . (2023). Available at: https://www.cfsa.net.cn/Article/News_List.aspx?channelcode=0BF7C4EABE99AB17785E8C097FEFB9C0C989A3242E08B589 (Accessed March 3, 2023).
Deb, K., Pratap, A., Agarwal, S., and Meyarivan, T. (2002). A fast and elitist multi-objective genetic algorithm: NSGA-II. IEEE Trans. Evol. Comput. 6, 182–197. doi: 10.1109/4235.996017
Deng, X. Y., Cao, S. H., and Horn, A. L. (2021). Emerging applications of machine learning in food safety. Annu. Rev. Food Sci. Technol. 12, 513–538. doi: 10.1146/annurev-food-071720-024112
Deng, XY, and Zhang, J. (2019). “Multi-objective location of fresh food E-commerce distribution network based on improved NSGA-II algorithm.” In Proceedings of the Sixth International Conference on Transportation Engineering (ICTE 2019), 671–680.
Fonseca, C. M., Paquete, L., and López-Ibáñez, M. (2006). An improved dimension-sweep algorithm for the hypervolume indicator. IEEE Congress Evolutionary Comput., 1–6. doi: 10.1109/CEC.2006.1688440
Foodhappy . (2021). Baijiu of Tanghua liquor industry in Maotai town will be detected again as sodium cyclamate. Available at: https://www.foodhappy.cn/?p=867.
Garre, A., Boue, G., Fernandez, P. S., Membre, J. M., and Egea, J. A. (2020). Evaluation of multicriteria decision analysis algorithms in food safety: a case study on emerging Zoonoses prioritization. Risk Anal. 40, 336–351. doi: 10.1111/risa.13391
Gupta, R., Shankar, R., Lai, K. H., and Kumar, A. (2023). Risk profiling of food security impediments using decision maker’s behavioural preference towards operational risk management. Ann. Oper. Res., 1–36. doi: 10.1007/s10479-022-05148-7
Han, Z., Wang, H. X., and Gong, L. (2022). Application and challenges of big data technology in food safety supervision. J. Food Saf. Qual. 13, 956–962.
Huang, Q. C., Sun, J, and Wang, J. H. (2020). “A novel parallelized LSTM for detecting internet food safety.” In 2020 19th International symposium on distributed computing and applications for business Engineering and Science (DCABES 2020), 251–254. doi: 10.19812/j.cnki.jfsq11-5956/ts.2022.03.026
Kou, G., Peng, Y., and Wang, G. X. (2014). Evaluation of clustering algorithms for financial risk analysis using MCDM methods. Inf. Sci. 275, 1–12. doi: 10.1016/j.ins.2014.02.137
Leonardi, G., and Portinale, L. (2017). Applying machine learning to high-quality wine identification. Lect. Notes Comput. Sci 10640, 31–43. doi: 10.1007/978-3-319-70169-1_3
Li, G., Liu, Q., and Shang, X. (2021). “Risk analysis and early warning of food safety testing based on big data.” In 2020 International Conference on applications and techniques in cyber intelligence, vol 1244, 417–422.
Li, G., Shang, X., and Liu, Q. (2020). Regional food safety testing risk analysis and early warning research. Innovative computing. Lecture Notes in Electrical Eng. 675, 1135–1142. doi: 10.1007/978-981-15-5959-4_139
Li, J. S., Yingqi, Z., and Linhai, W. (2013). Public panic behavior based on food safety incidents: a case of additive. LISS 2012, 1411–1417. doi: 10.1007/978-3-642-32054-5_200
Ma, B., Han, Y. M., and Cui, S. Y. (2020). Risk early warning and control of food safety based on an improved analytic hierarchy process integrating quality control analysis method. Food Control 108:106824. doi: 10.1016/j.foodcont.2019.106824
Min, Y., and Yue, Q. H. (2023). Food safety risk analysis and prevention advices of baijiu in China. China Brew. 42, 13–17. doi: 10.11882/j.issn.0254-5071.2023.03.003
National Bureau of Statistics . Production of major industrial products. (2023). Available at: https://data.stats.gov.cn/easyquery.htm?cn=A01\u0026amp;zb=A020909\u0026amp;sj=202303 (Accessed March 3, 2023).
Si, W. J., Jie, Z., Ong, Y.-S., Zhang, A. N., and Tan, P. S. (2015). A simple and fast Hypervolume Indicator-based multi-objective evolutionary algorithm. IEEE Transac. Cybernetics 45, 2022–2213. doi: 10.1109/TCYB.2014.2367526
Song, C., Guo, J. M., Gholizadeh, F., and Zhuang, J. (2022). Quantitative analysis of food safety policy-based on text mining methods. Foods 11:3421. doi: 10.3390/foods11213421
Song, C., Guo, C. Y., Hunt, K., and Zhuang, J. (2020). An analysis of public opinions regarding take-away food safety: a 2015-2018 case study on Sina Weibo. Food Secur. 9:511. doi: 10.3390/foods9040511
Song, C., and Zhuang, J. (2017). Modeling a Government-Manufacturer-Farmer game for food supply chain risk management. Food Control, 78, 443–455.
Wang, Q. L. (2021). Research Progress in quality analysis and quality control of baijiu. Liquor-Making Sci. Technol. 8, 97–101. doi: 10.13746/j.njkj.2021102
Wang, F., and Chen, H. X. (2014). The pre-warning analysis of packaging design safety of jelly food. Adv. J. Food Sci. Technol. 6, 1045–1049. doi: 10.19026/ajfst.6.157
Wang, J., and Yue, H. L. (2017). Food safety pre-warning system based on data mining for a sustainable food supply chain. Food Control 73, 223–229. doi: 10.1016/j.foodcont.2016.09.048
Westerveld, J. J. L., van den Homberg, M. J. C., Nobre, G. G., van den Berg, D. L. J., Teklesadik, A. D., and Stuit, S. M. (2021). Forecasting transitions in the state of food security with machine learning using transferable feature. Sci. Total Environ. 786:147366. doi: 10.1016/j.scitotenv.2021.147366
World Health Organization . (2018). Global status report on alcohol and health 2018, 349–356. Available at: https://apps.who.int/iris/handle/10665/274603.
Yaghoubi, A., and Fazli, S. (2023). Designing a new multi-objective model for the vehicle routing scheduling at a cross-docking center in mitigating CO2 emissions at green supply chain under uncertainty. Ann. Oper. Res. doi: 10.1007/s10479-023-05587-w
Yang, C. L., Cao, P. P., Shan, W. L., Wang, H., and Li, H. (2019). Factors affecting the quality and safety of wine and quality management in wine making. J. Food Saf. Qual. 10, 1572–1581. doi: 10.3969/j.issn.2095-0381.2019.06.027
Zamiri-Noghreh, E., Safarzadeh, S., and Ranjbar, M. (2023). Product safety assessment in a dairy dual-channel supply chain using game theory. Ann. Oper. Res. doi: 10.1007/s10479-023-05283-9
Zheng, J. Y., and Frey, H. C. (2004). Quantification of variability and uncertainty using mixture distributions: evaluation of sample size, mixing weights, and separation between components. Risk Anal. 24, 553–571. doi: 10.1111/j.0272-4332.2004.00459.x
Keywords: alcoholic beverages, food safety, NSGA-II, risk analysis, risk assessment
Citation: Song C, Shen H, Amireddy S and Zhuang J (2024) Food risk assessment based on NSGA-II algorithm: a case study of alcoholic beverages. Front. Sustain. Food Syst. 8:1449964. doi: 10.3389/fsufs.2024.1449964
Edited by:
Hamada Imtara, Arab American University, PalestineReviewed by:
Feras Abujaber, Arab American University, PalestineMarouane Aouji, Ibn Tofail University, Morocco
Janpriy Sharma, University of Trento, Italy
Copyright © 2024 Song, Shen, Amireddy and Zhuang. This is an open-access article distributed under the terms of the Creative Commons Attribution License (CC BY). The use, distribution or reproduction in other forums is permitted, provided the original author(s) and the copyright owner(s) are credited and that the original publication in this journal is cited, in accordance with accepted academic practice. No use, distribution or reproduction is permitted which does not comply with these terms.
*Correspondence: Cen Song, c29uZ2NlbjIyQDEyNi5jb20=