- Graduate School of Global Environmental Studies, Kyoto University, Kyoto, Japan
87% of agricultural subsidies are harmful to the environment and human health while contributing little to food security. The first step to addressing harmful subsidies is to identify and trace them in policies. Small Island Developing States (SIDS), such as the Maldives, are the most vulnerable to environmental degradation caused by activities they contribute minimally. In the case of subsidies, the relative contribution to the environmental degradation by islands and the relative impacts of subsidies on islands are not studied, leaving a void in the global knowledge pool. This paper addresses the first step of this gap by identifying and assessing the historical trends of subsidy integration in Maldivian agricultural policy by analyzing their temporal distribution patterns and the quality of subsidy inclusion in national plans in the past four decades. The framework adopted for this study is a multi-criteria scoring protocol and a classification of 15 subsidy types to deliver a quantitative overview of the status and trends in subsidy in the agriculture sector of the Maldives. The results showed that although the scale of agriculture in the country is limited, subsidies have consistently been an integral part of agricultural planning since 1985, with agricultural inputs being one of the most frequently and highly subsidized over the years. Twelve different subsidy types were traced in the ten assessed national plans, and eleven subsidy types were identified in the plan from 2019 to 2023. These results serve as a baseline for the understanding of subsidies in the Maldives by providing a narrative of an island state for the global overview of subsidies and for comparative studies thereof.
1 Introduction
1.1 Research background
Subsidies are an essential tool for stimulating economic activities, but they often result in unintended negative consequences, both to the environment and to human wellbeing. It is estimated that USD 1.8 trillion is spent annually on subsidies at a global level (Koplow and Steenblik, 2022), with the agriculture sector as one of the primary recipients with an allocation of up to USD 700 billion in 2020 (Heyl et al., 2022). According to the report preceding the United Nations Food Systems Summit 2021, 87% of agricultural subsidies are harmful to the people and the planet, resulting in inequality (FAO, UNDP, UNEP, 2021). The negative impacts of subsidies stem from unsustainable practices such as land use change and over-exploitation (IPBES, 2019a; Oosterhuis and ten Brink, 2014), which have resulted in 38% of Earth’s land conversion (FAO, 2020) threatening 24,000 species with extinction (Benton et al., 2021). Additionally, ineffective allocation of subsidies often becomes a burden to the sector, slowing down production (Maroušek et al., 2015) and does not essentially benefit the intended recipients (Boussios et al., 2022). Contrary to their intended purpose, the existing literature further points toward the failure of agricultural subsidies to contribute to food security (Heyl et al., 2022; OECD, 2021).
Subsequent to the increase in literature in the past few decades demonstrating the harmful impacts of subsidies, including agricultural subsidies (Bruvoll et al., 2011; Damania et al., 2023; Guo et al., 2021; OECD, 2021; Oosterhuis and ten Brink, 2014; Salunkhe and Deshmush, 2012; Tietenberg and Folmer, 2005) the global community has adopted targets such as the Aichi Biodiversity Target 3 in 2010 and, more recently, Target 18 of the Kunming-Montreal Global Biodiversity Framework (GBF), where Parties shall “Identify by 2025, and eliminate, phaseout or reform harmful incentives including subsidies … while substantially and progressively reducing them by at least $500 billion per year by 2030 starting with the most harmful incentives” (CBD, 2023).
Global targets on environment and climate change often do not sufficiently reflect the urgency of the environmental crisis or the magnitude of action necessary to bring about positive change (Ekardt et al., 2023; Ekardt et al., 2022). Additionally, they have repeatedly failed to generate positive action. The fifth edition of the Global Biodiversity Outlook reports little progress in the last decade toward achieving Aichi Biodiversity Target 3, with only six countries having taken the initiative to identify harmful subsidies by 2020 (Dempsey et al., 2020; SCBD, 2020). The lack of action on subsidies is partially a result of resistance from different pressure-groups driven by vested political interests, which often becomes a hurdle in addressing these subsidies (Heyl et al., 2022; Kato and Greeley, 2016). In many parts of the developing world, it is also a result of inadequate resources and means of implementation. However, one of the biggest challenges in addressing subsidies, as pointed out in The Global Assessment Report on Biodiversity and Ecosystem Services, is the lack of groundwork for the broadscale reform of subsidies (IPBES, 2019a).
As outlined in target 18 of the GBF, the first step in addressing harmful subsidies is identifying them, which are often hidden within policies, sometimes making it difficult to trace them (Oosterhuis and ten Brink, 2014; SCBD, 2020). It is essential to accurately identify, trace and quantify subsidies to leverage informed decision-making to effectively address the negative impacts of subsidies (Heyl et al., 2022). Researchers often assess specific impacts of a selected subsidy in a particular country or a locality, such as climate change impacts of a fuel subsidy using carbon emission as a proxy within a city, as seen in the works by Choi et al. (2016) and Solarin (2020), or compare the benefits of subsidy in different forms of carbon options, as in the work by (Mardoyan and Braun, 2015). However, there is limited research on the identification of subsidies in national policies and plans. Experts have developed some tools to identify subsides within policies, notably by the OECD, to assist policy and decision-makers in identifying and reforming harmful subsidies (OECD, 2006; Oosterhuis and ten Brink, 2014; Valsecchi et al., 2009). Although these tools can play an essential role in policy screening for subsidies, there is still a lack of research on screening national policies and plans for subsidy integration. Most of the literature on subsidy, including on policy screening is concentrated in the developed world, mega economies, and more specifically in the OECD countries. In small island states such as the Maldives, there is a remarkable scarcity of literature on subsidy identification, their impacts and reform. For example, the available literature on subsidies in the Maldives is limited to a simple recognition of the link between fuel subsidies and their environmental impacts, as seen in Nizar and Rasheed (2016) and Hassan (2020).
In climate change, through extensive research and literature, it is established that SIDS are the most vulnerable to its impacts despite their low per capita emissions (IPCC, 2023). Similarly, for effective policy and decision-making on subsidies at national and global levels, literature that establishes the relative contribution to the global impacts of subsidies, as well as the relative impacts of subsidies on SIDS, is crucial. With the dearth of studies, especially in small islands, and the lack of groundwork, leveraging informed decision-making is challenging.
Therefore, this study aims to contribute toward bridging this gap, by focusing on subsidies in agricultural planning in the Maldives. This study provides an overview of the historical trend, current status and quality of subsidy integration in national agricultural planning through in-depth document analysis since 1985. This study begins by describing the national context governing the agriculture sector followed by a description of the methodology adapted from Baker et al. (2012) and Geneletti and Zardo (2016) to assess the level of integration of subsidies into agricultural plans, and from Tang et al. (2010) to calculate the quality of inclusion of subsidies using the depth score. The results of the analysis are presented in the next step, followed by a discussion of the findings and their possible impacts on the environment. The study concludes with a summary of policy implications of the key findings, along with recommendations.
1.2 Study location
The site selected for this study was the Maldives, a Small Island Developing State with 1,190 tiny coral islands scattered across the Indian Ocean. The total land area of the country is approximately 300Km2. The Maldives presents an ideal setting for this study due to the dearth of literature in the Maldives and in similar countries, as well as its unique geographic, physical, environmental, and socioeconomic conditions, which pose exceptional challenges in food production.
The Maldives is known for its unique beaches, turquoise lagoons, and vibrant coral reefs. Similar to many other SIDS, Maldives is also home to unique, fragile, and highly vulnerable terrestrial ecosystems (Fernández-Palacios et al., 2021; Keppel et al., 2014; UNESCO, 2021). In 2023 there were around 0.4 million Maldivians, with approximately half residing in the capital city and the rest scattered across 187 islands. The Maldives is a middle-income developing country with a nominal GDP of around USD 11,800 in 2022 (World Bank, 2023). The lockdown at the onset of the COVID-19 pandemic in early 2020 resulted in an economic standstill that displayed the significance of primary sectors such as fisheries and agriculture in employment, food security and livelihood (MBA, 2022; MoED and UNDP, 2020).
Substantive agriculture in the Maldives can be categorized into 3 different types based on the type of land used (IFAD, 2020): (1) Backyard gardening – In almost all inhabited outer islands, it represents a substantial share of agricultural production and rural food security where backyards and front yards of houses are utilized to grow both long-term and short-term crops; (2) Designated croplands in inhabited islands (Figure 1) - Some of the inhabited islands allocate agricultural plots within the island’s natural habitats just beyond the settlement, which are then turned into croplands by local farmers. This type of agriculture is the most extensive form of commercial agriculture by individual farmers, with a major share comprising of short-term crops; and (3) Uninhabited islands designated for agriculture purposes—This type of agriculture began in the Maldives with long-term lease of 32 islands in 2004 (MPND, 2007). This is the largest commercial and industrial-scale agricultural practice in the Maldives, with 52 islands designated for the purpose by 2022 (President’s Office, 2022). Monoculture is more prevalent in this type of agriculture, in which the target market is mostly resorts.
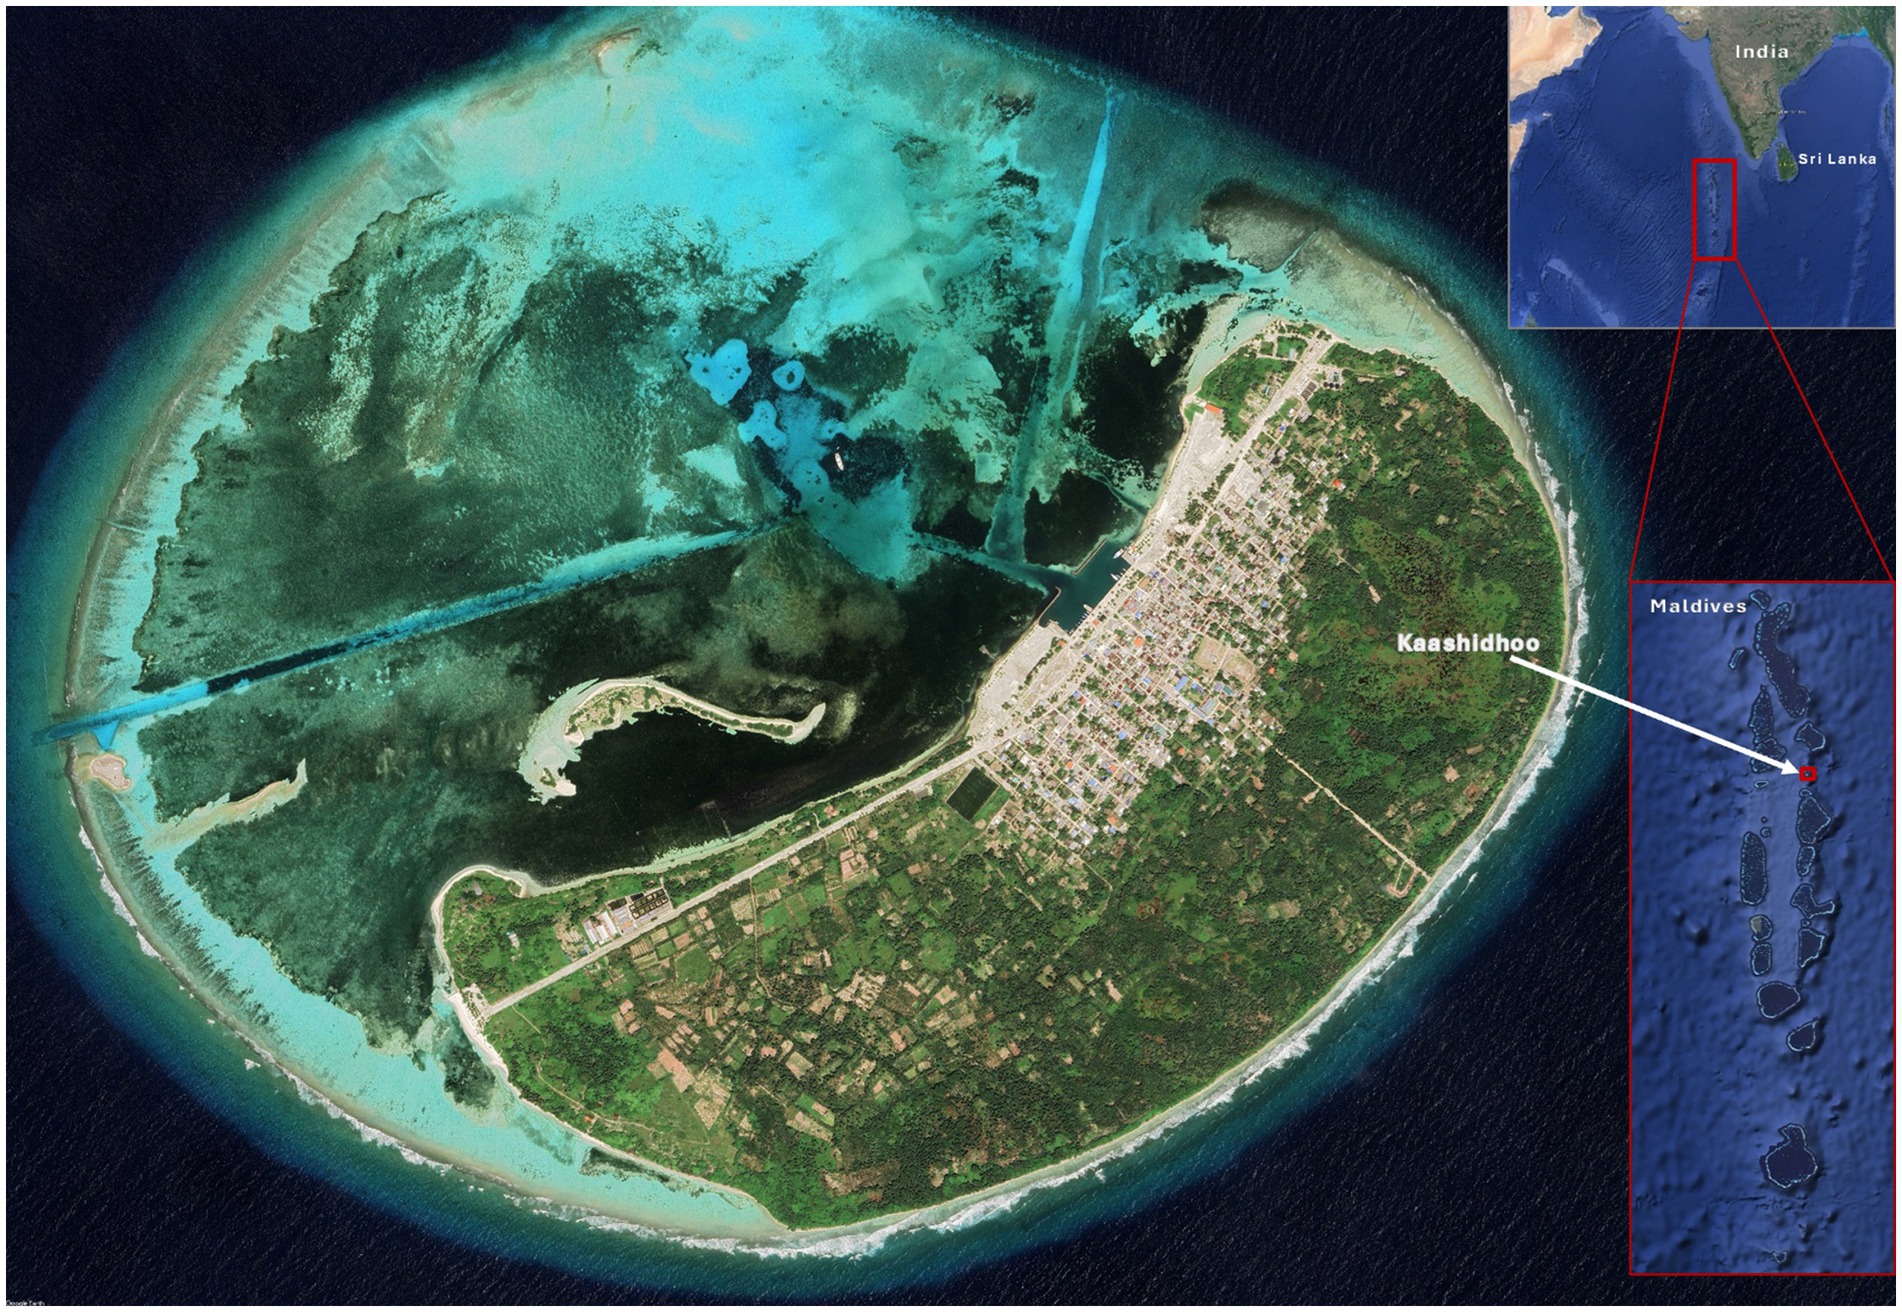
Figure 1. Location map of the Maldives and Kaashidhoo Island - one of the heavily agricultural islands of the Maldives where agricultural land is allocated just outside the settlement (Map Data Source: Google Image © 2024 Airbus).
Due to the dispersed nature of islands, the land available for agriculture is fragmented. Agriculture is practiced in over 21% of the arable land (FAO, 2022), with approximately 7,600 registered farmers constituting nearly 5% of the working population (MBS, 2020). Despite the massive numbers in terms of land use and farmers, national statistics show that the Maldives continues to depend on imports to meet more than 90% of its nutritional requirements (IFAD, 2020), including 100% of its staples (MoFMRA, 2019). Additionally, a major portion of the demand for varieties produced in the Maldives is also met through imports (Table 1). Meanwhile, there has been a significant decline in the contribution of agriculture to the GDP of the country, falling from 12.7% in 1984 (NPD, 1985) to 1% in 2022 (MBS, 2022). This decline may be due to exceptional growth in sectors other than agriculture, poor maintenance of agricultural statistics, or both.

Table 1. (a) The value of locally grown fresh produce traded in the Male’ market from 2014 to 2021 (does not include intra, inter-island, and resort trade), against (b) the value of imports of fresh crops mainly produced in the Maldives for the same period (does not include imports of processed food and staples such as rice and flour).
1.3 Agricultural planning and governance in the Maldives
Agricultural policy has remained an integral part of national planning from the First National Development Plan (NDP) in 1985 to the latest plans in 2019, with a dedicated section on agriculture that governed the sector’s development and strategy. The first five plans were donor-targeted short-term plans in line with other budgetary cycles. Maldives moved to 5-year medium-term plans with the adoption of the 6th NDP in 2001, which continued through the 7th NDP. In 2010, aligning with the electoral period of the first democratic government, a four-year Strategic Action Plan (SAP) was developed, which replaced the role of the NDPs. The government elected from 2013 to 2018 did not develop an overarching national plan or a specific sectoral agricultural plan during this period. When a new government was elected at the end of 2018, a second SAP was adopted from 2019 to 2023. Additionally, for the first time, a specific 10-year fisheries and agricultural policy was adopted in 2019, which aligned with the SAP of 2019.
The Maldives is a centralized unitary republic with a presidential system of government in which each sector is headed by a cabinet minister appointed by the president. At the time of the first NDP, the agriculture sector was governed under a dedicated Ministry of Agriculture. By the time of the 3rd NDP, the agriculture and fisheries sectors were merged into a single ministry and remained so until November 2023, when the two ministries were separated once again. However, NDPs and SAPs revealed that both sectors have retained their distinct identities as separate sectors throughout the past several decades of national planning.
2 Methodology
2.1 Materials
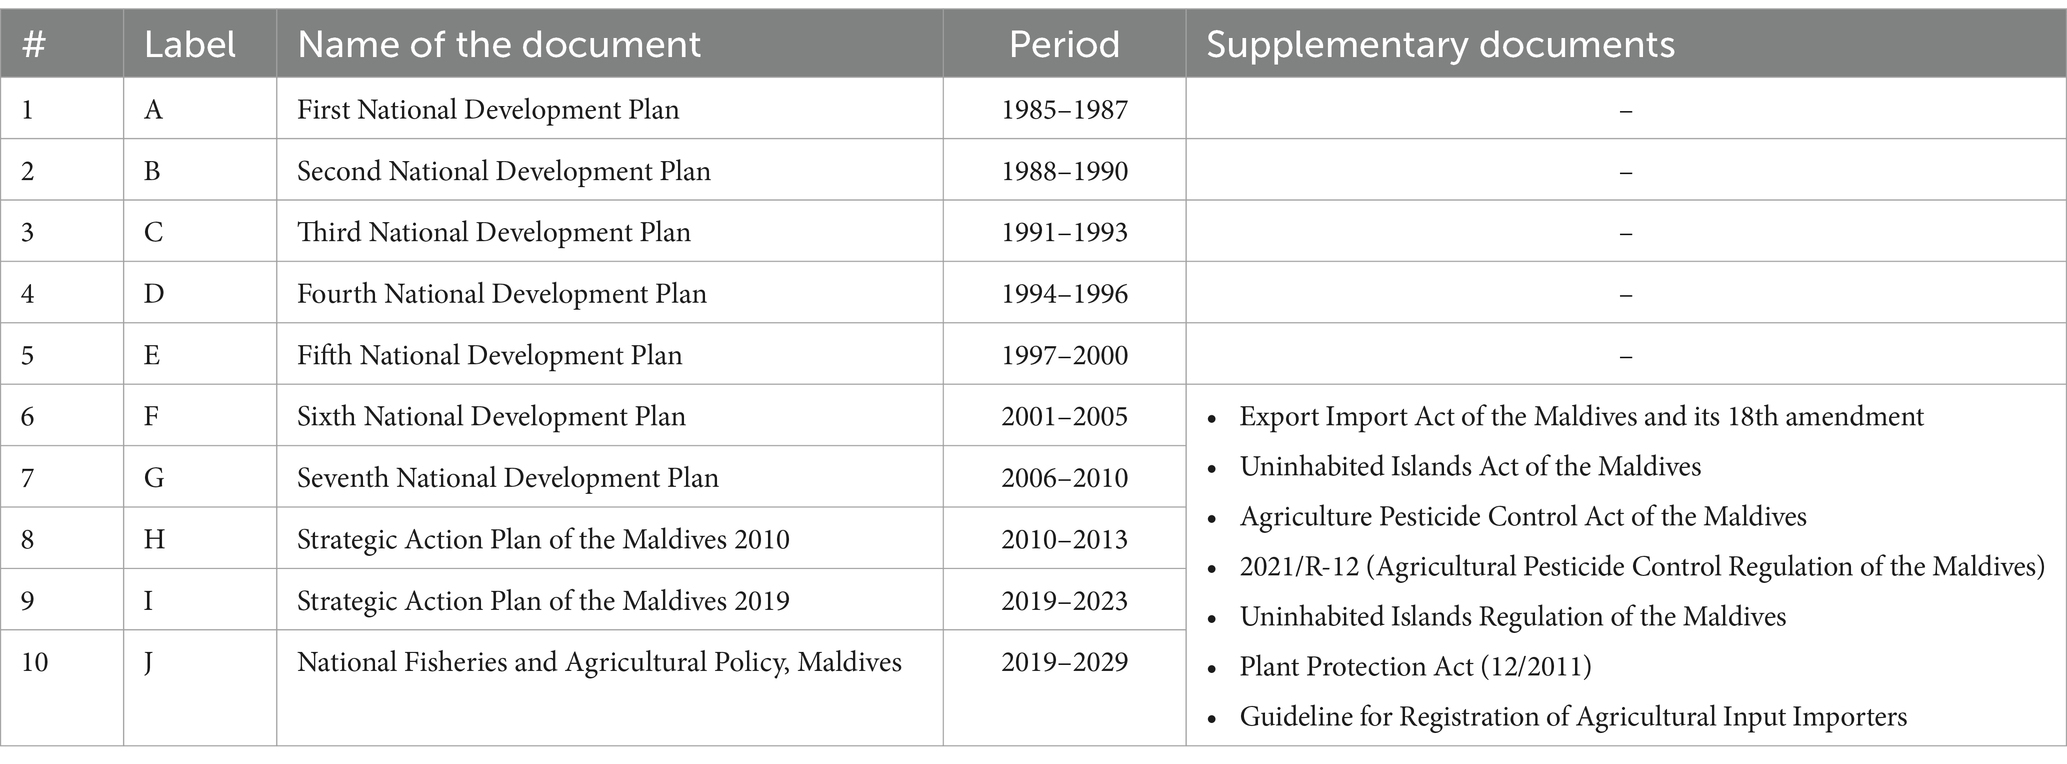
The materials used in this study are the 7 NDPs from 1985 to 2010, the two SAPs from 2010 to 2013 and 2019 to 2023, and the Fisheries and Agriculture Policy of the Maldives from 2019 to 2029. Together, these documents represent the entire spectrum of national agricultural planning and policy since 1985. Table 2 presents a comprehensive list of these documents, each of which is assigned an alphabet for easy referencing. These documents will be collectively referred to as plans in the following sections.
The first five NDPs were produced in two volumes, with the second volume focusing on implementation provisions. From the sixth NDP onwards, there was only one volume with a noticeable decline in the information on the implementation provisions. Consequently, the analysis was expanded to include associated documents adopted by the government as part of the implementation process described in the plans. These documents are listed as “Supplementary Documents” in Table 2.
As this study focuses specifically on the agriculture sector (which does not include fisheries), the plans were not analyzed in their entirety, as agriculture was presented as a separate section in each plan. Nevertheless, in cases where information is intermixed across all sectors, as seen in the Information Base or the Implementation sections, the relevant sections were carefully examined.
2.2 Subsidy types
A comprehensive understanding of subsidy definitions, classifications, and intended purposes is imperative to effectively recognize and evaluate them. While different organizations, including the World Trade Organization (WTO, 2024), have defined and categorized subsidies, there is no universally accepted set of typologies or terminologies for subsidy definition and description (Cottrell and Zerzawy, 2021; Heyl et al., 2022). As pointed out by Heyl et al. (2022), precise terminology is important to identify and quantify invisible subsidies to effectively address environmental issues at the decision-making level. Keeping this in mind, the definition of “subsidy” adopted for this study is from Valsecchi et al. (2009) and subsidy classification is derived from the subsidy typologies presented in IEEP et al. (2007) and later employed by Valsecchi et al. (2009) and Bruvoll et al. (2011). This classification distinguishes between on-budget and off-budget subsidies as well as explicit and implicit subsidies while taking into account the externalities. The 15 types of subsidies, as detailed in Table 3, are labeled from s1 to s15 for easy referencing in the analysis process. The “Subsidy Types” described in the table are not meant to be exhaustive; instead, they serve as broad descriptors for the numerous subsidy categories commonly encountered within policies.
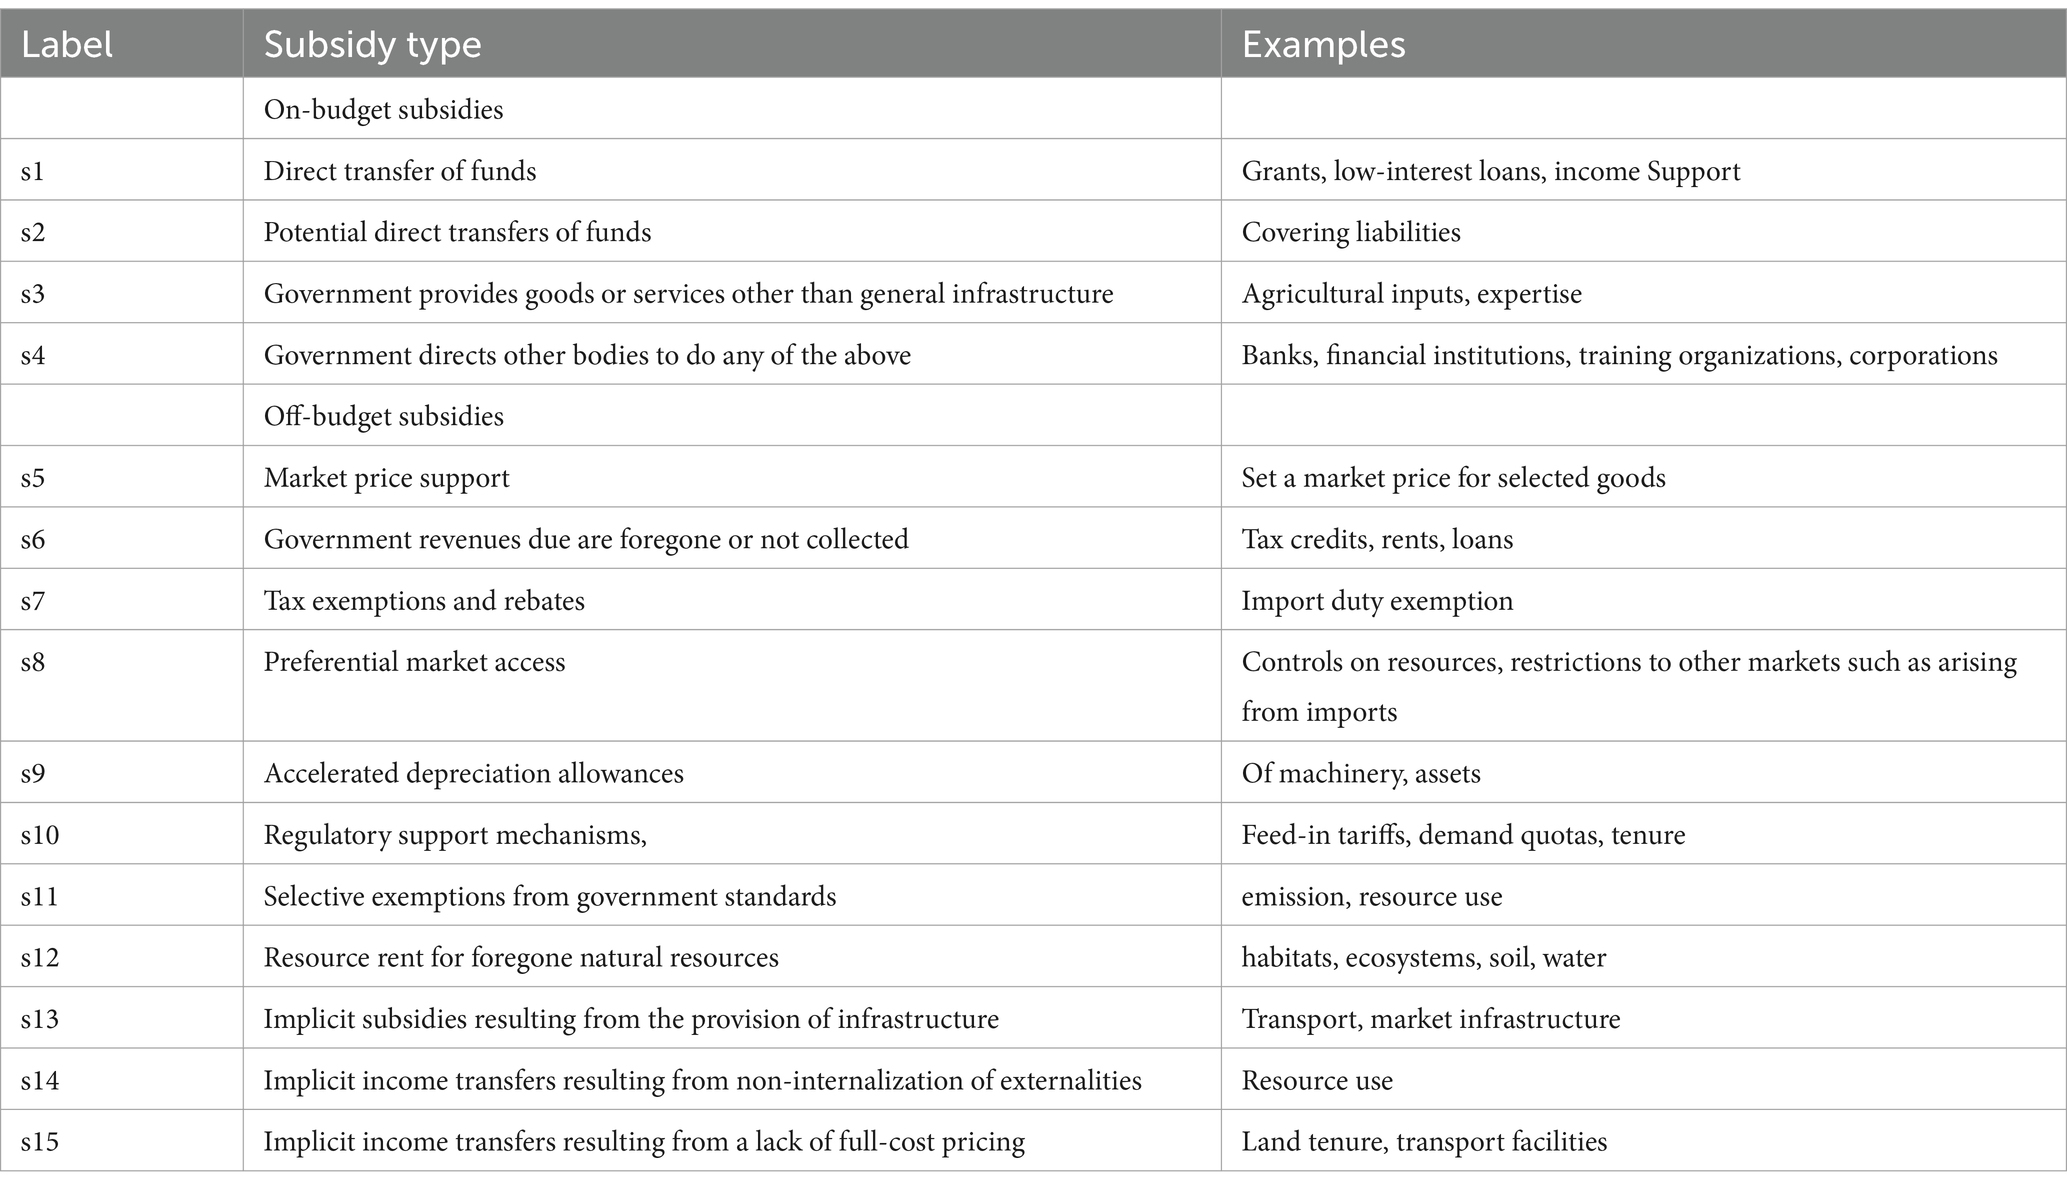
Table 3. Description of subsidy types adapted from IEEP et al. (2007), Valsecchi et al. (2009), and Bruvoll et al. (2011).
2.3 Assessment methods
The methodology adopted for this analysis is mainly derived from Baker et al. (2012), where local development plans were screened for integration of climate adaptation using a scoring protocol. Several researchers employed this methodology to assess the level of inclusion of various environmental measures, such as Ecosystem-based Adaptation (Geneletti and Zardo, 2016), climate adaptation (Heidrich et al., 2013), and ecosystem services (Bruno et al., 2023; Cortinovis and Geneletti, 2018), in Policy documents in national planning.
The analysis of the plans was conducted in three stages. The first stage involved screening for subsidies through a thorough examination of the plans, focusing on in-depth content analysis to identify subsidies embedded within the plans. The plans were analyzed under the four planning components described in Table 4, which correspond to different sections within the planning documents. The description of the planning components was adapted and modified from that of Geneletti and Zardo (2016). Component ii was altered to incorporate policy, strategy, targets and objectives as these terminologies were observed across different plans to represent this component. Planning documents do not typically adhere to the precise terminology outlined in Table 3 but often use various terms and expressions based on their specific objectives. Accordingly, content analysis of each component was construed around a wide array of direct and indirect statements, concepts, and descriptions to identify the subsidy types integrated within the plan. Supplementary documents were available only from the time of the seventh plan, Plan G. As such, these documents were analyzed to find additional information on component iv for the latest four plans. The identified subsidies for each component were then systematically computed in tabular form using Microsoft Excel to facilitate the subsequent scoring and analysis. When a subsidy was identified in a component based on the subsidy type description and examples in Table 3, the available information in the plan on the subsidy was extracted and tabulated on a component-wise basis for further analysis in the second stage. This method of subsidy screening in policies was also employed by Valsecchi et al. (2009).

Table 4. Description of planning components: modified from Geneletti and Zardo (2016).
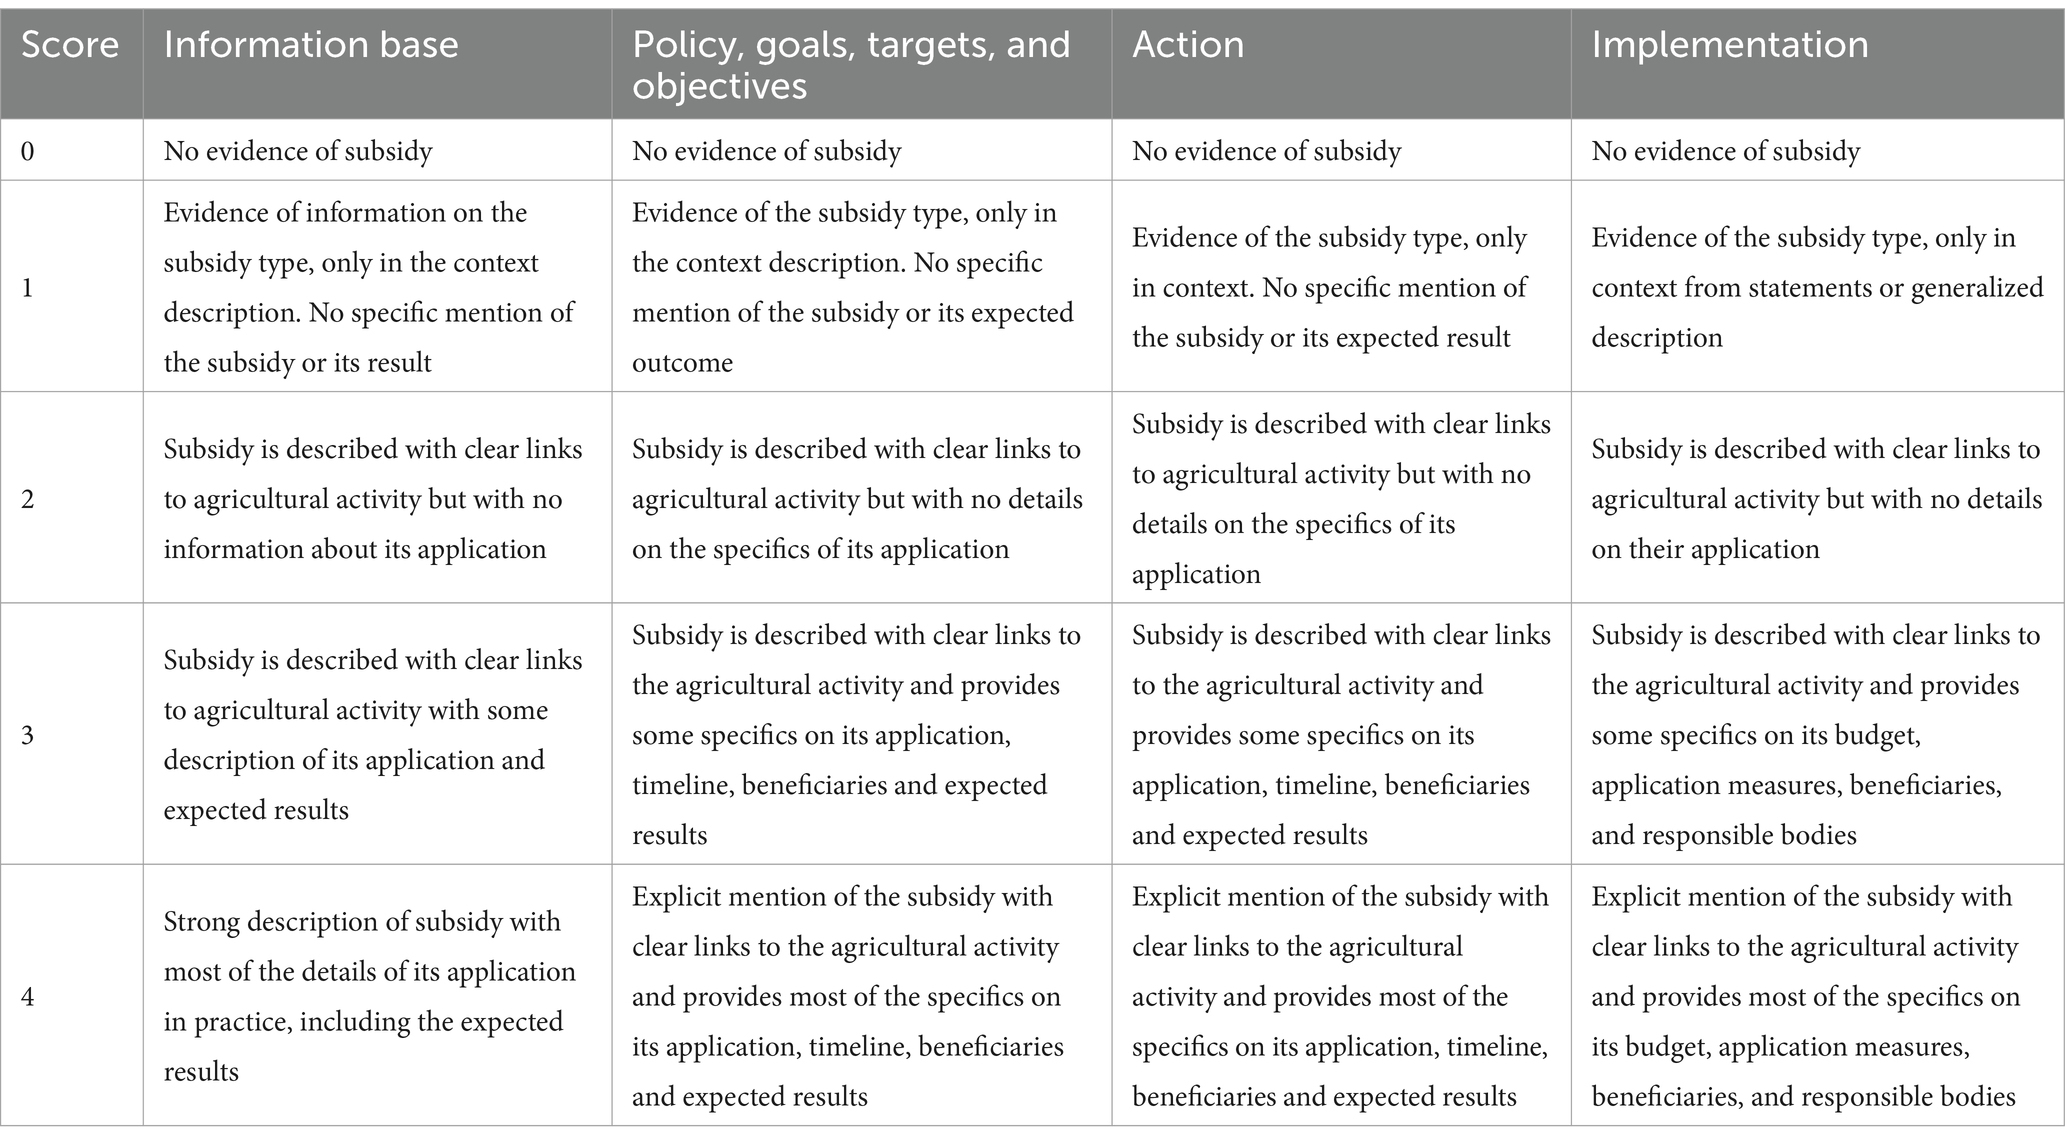
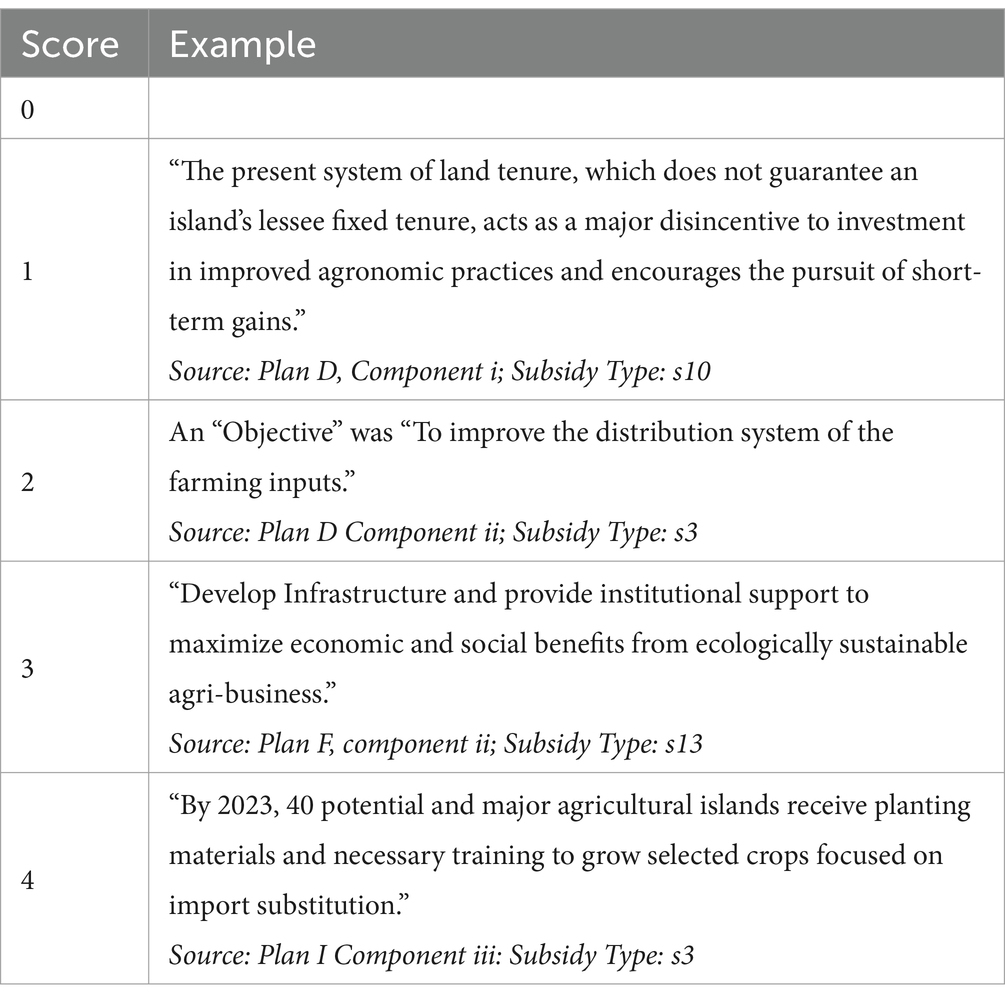
In the second stage, a score was assigned to each identified subsidy to calculate the temporal distribution and the quality of subsidy integration in the plans. As the first step of this stage, a scoring protocol was developed and scores were assigned based on the methodology by Baker et al. (2012). A 5-point scale was adopted, where “0” indicates no integration of the subsidy type and “4” signifies the full integration of the subsidy within the component. A description of the scoring system, as modified from Baker et al. (2012) and Geneletti and Zardo (2016), is presented in Table 5. The scoring protocol was then used to assign scores to each identified subsidy in each component of the plan. If a particular subsidy type was not found in the planning component, a score of “0” was assigned. Any description of a subsidy type that received a score of 1 or higher indicates the presence of the subsidy type within the component of that particular plan. The scores were then computed component-wise for each plan for the 15 subsidy types. Table 6 presents illustrative examples from the assessed plans to demonstrate the scoring employed in this assessment.
In the second step, the assigned scores were used to calculate the temporal distribution of subsidies across the plans. The total score for each plan was calculated by summing the scores of individual subsidy types in the four components of the plan. Because there are four planning components and 15 subsidy types (with a maximum possible score of 4 for each subsidy type in each component), the highest possible score for a plan is 240 (4 × 4 × 15). In this step, to understand the distribution pattern of subsidies across planning components, the total scores of individual components were calculated for each plan and across all plans. As 15 subsidy types could be integrated into a single planning component with a maximum score of 4 each, the maximum possible score for a component in one plan is 60 (4 × 15), and for 10 plans is 600 (4 × 15 × 10).
In the third step, to understand the distribution of subsidy types, the number of subsidy types identified in each plan, as well as the number of plans each subsidy type was found in, was counted. Additionally, the distribution of individual subsidy types across all plans was calculated by summing the score of each subsidy type. The maximum possible score for a subsidy type in one component across all plans is 40 (4 × 10), and the maximum score for a subsidy type across all plans in all components is 160 (4 × 4 × 10).
In the fourth step, the quality of integration of subsidy types across all plans was assessed. Quality analysis was performed using a depth score indicator adapted from Tang et al. (2010). Cortinovis and Geneletti (2018) used this indicator to assess the quality of ecosystem services integration in urban planning. Consistent with their use of the depth score, this study employed the adapted formula described below to assess the quality of integration of subsidies by subsidy type and by plan. When calculating the depth score, only those entries with a score of 1 or higher were considered. The depth score offers insights into the level of detail, clarity, and specificity of information on subsidies integrated within the plans.
In this formula, IDSj is the jth indicator depth score (scale 25–100% if at least one component has subsidy integrated; if none of the components integrated subsidy, the score is 0); Ij is the jth indicator received score (scale 0–4), and Pj is the number of plans that address the jth indicator.
3 Results
Stage one of the analysis revealed that subsidies have been integrated into agriculture in all plans since the inception of national planning in 1985. It was found that information was not consistent across the plans, and the templates used in preparing the plans differed over time. The first five plans were produced in two volumes with the first four plans adhering to the same template with four planning components. From plans A to D, the first volume contained all four components, while the second volume focused only on implementation with details at the project level, including budget, project objectives, outcomes, responsible authorities, and timelines. Through content analysis, except for Component ii of Plan B and components i and iii of Plan C, at least one subsidy type was identified in each component of the four plans.
The fifth plan, Plan E, followed a different template where the plan was produced in two volumes with two editions of the second volume and did not contain components ii and iii. At least one subsidy type was identified in components i and iv of this plan. Plan F and G followed a separate template with only one volume and did not contain a section on component iii. In Plan F there was no indication of any subsidy type in component iv and at least one subsidy type was identified in components i and ii. On the other hand, at least one subsidy type was identified in the three components present in Plan G. Although Plan H was named an “Action Plan,” there was no section on actions (component iii). At least one subsidy was identified in the rest of the components. Plan I contained all four components and except for component i, at least one subsidy type was found in the rest of the components. Plan J also lacked component iii and subsidies were found in the rest of the components. Plans H and I were structured in a tabular framework where little but very specific information was provided on the implementation.
In summary, three plans were observed to have all four components, with all 10 plans having components i and iv. Five out of 10 plans did not contain an action component iii, and nine contained component ii. For components i and ii, subsidies were observed in 8 plans, for component iii, in 4 plans, and for component iv, in 9 plans.
3.1 Temporal changes in the level of subsidy integration in national planning
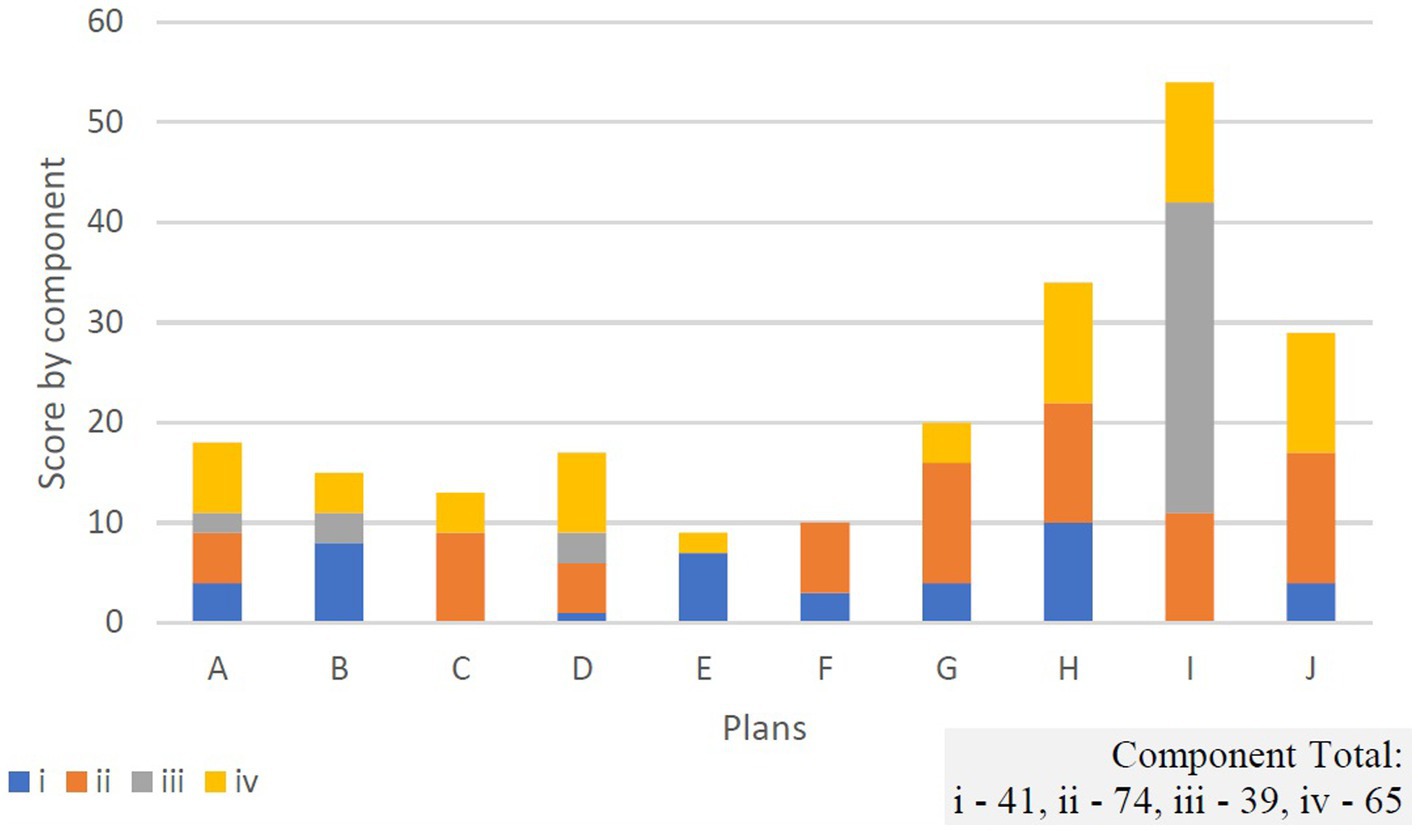
Figure 2 illustrates the trend in subsidy integration for the 10 plans. The plan with the highest integration of subsidy was Plan I for the period from 2019 to 2023, with a score of 54 out of 240 (23%). In contrast, Plan E, which was adopted from 1997 to 2000, received a score of 9, the lowest among the 10 plans. Although this plan was the most extensive in terms of size, it lacked components ii and iii, which contributed to the low score.
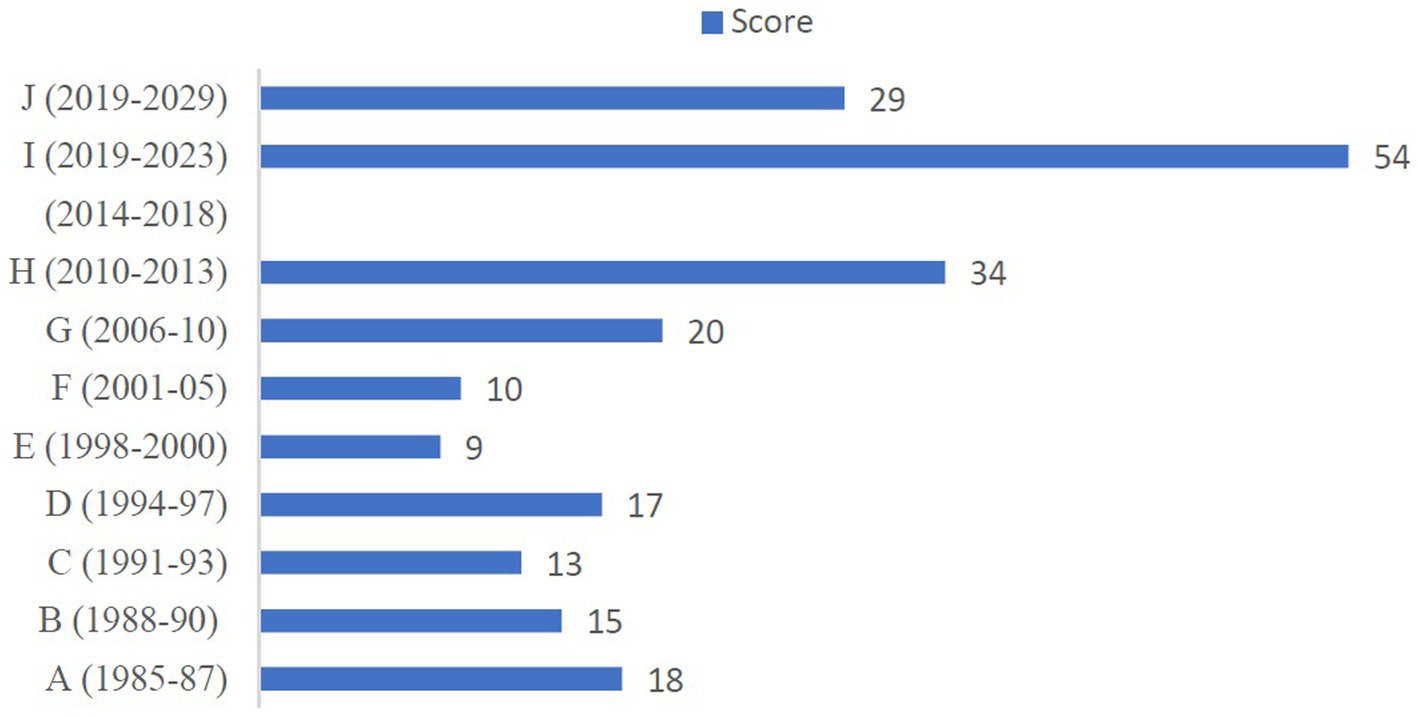
Figure 2. Total score by plan from 1985 to 2029 (see Table 1 for the alphabet assigned to each plan).
A gradual increase in subsidy integration was observed from Plan G (from 2006) to Plan I (end of 2023). Before this period, subsidy levels remained roughly constant, ranging between scores of 9 to 18. It is important to note that the absence of a national plan or agricultural policy between 2014 and 2018 does not equate to a lack of subsidies in this period. It was observed that activities initiated during Plan H continued throughout this period, while some continue into the present day. This was evident from the examination of the supplementary documents where implementation of subsidies, such as eliminating import duties from all agricultural inputs, including fertilizers, equipment, and machinery, and eased land tenure regulations in uninhabited agricultural islands, were observed. Another observation is that the increase in subsidies coincided with the change in government from authoritarian to democratic in 2008 and the graduation of the Maldives from LDC status (UN, 2012).
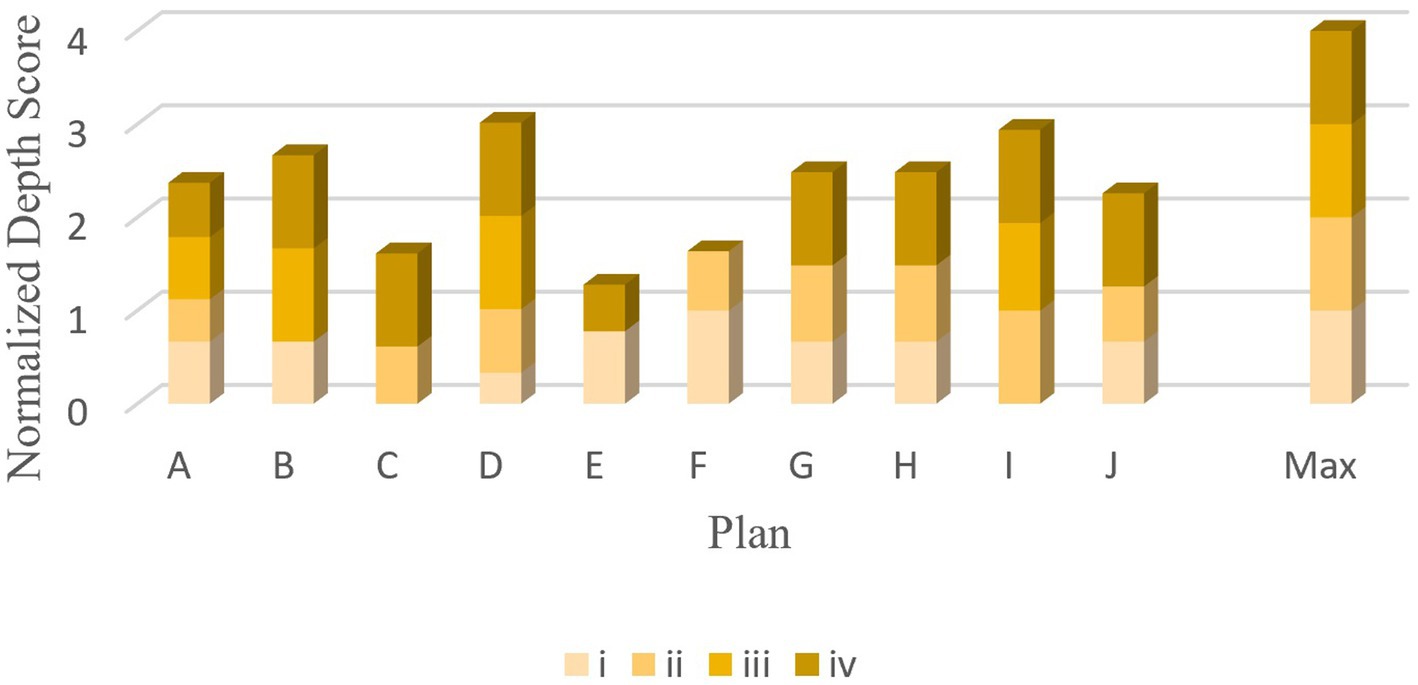
In addition to the total score of each plan, Figure 3 illustrates the components in which subsidies were identified, the total of each component in each plan, and the total score for each component across all plans. Only two plans, Plans A and D had subsidies integrated into all four planning components. Six plans had subsidies integrated into three components, and two plans had subsidies integrated into two components. The highest level of subsidy integration was observed in component ii (policies, strategies, targets, and objectives), with a cumulative score of 74 out of 600, followed by component iv with a score of 65. The score by component of each plan ranged from 1 out of 60 in component i of Plan D to 32 out of 60 in Component iii of Plan I. One reason for the absence of a subsidy in a particular component was the nonexistence of the component in the plan.
3.2 Distribution of subsidy types
3.2.1 Coverage of subsidy types across all plans
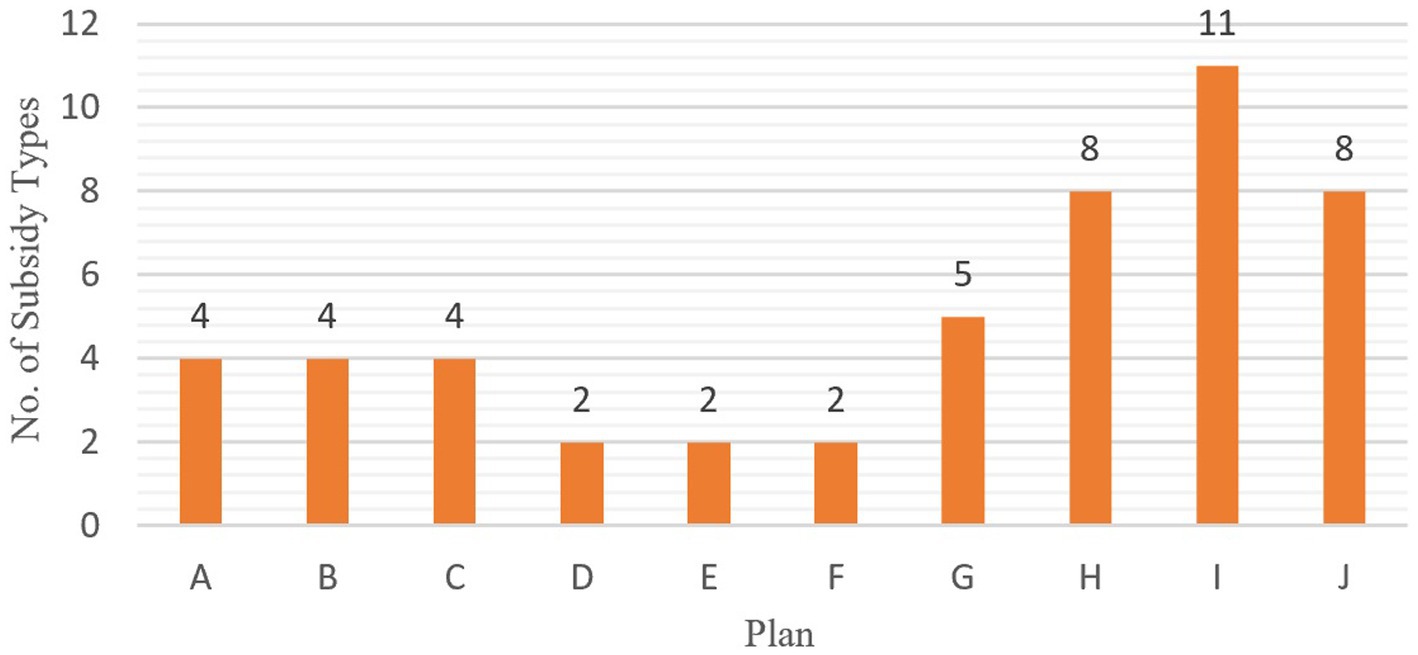
Figure 4 illustrates the number of subsidy types observed in each plan, which ranged from 2 to 11. Of the 10 plans, Plan I, from 2019 to 2023, exhibited the most diverse subsidy integration with 11 types of subsidies. Four subsidy types were observed in the first three plans, and two subsidy types were observed in the subsequent three plans. It was observed that, in line with the total score for the plans, the number of subsidy types found in the initial 15 years of planning was relatively low, ranging from 2 to 4, compared to the subsequent plans (5–11) with a gradual increase in subsidy types since Plan G in 2006.
Of the 15 subsidy types, 12 subsidies were identified from the assessed plans. Out of the identified subsidies, except for s12, all other subsidy types were present in Plan I. As depicted in Figure 5. Subsidy type s3 (in which the government provides goods or services other than infrastructure) was found in nine plans. The most frequently found elements under s3 were in the form of providing agricultural inputs to farmers, such as seedlings, saplings, agrochemicals, tools, and equipment (Plans A, B, C, D, I, and J). Plans E, F, and H also integrated this subsidy but described it more generally as assistance through providing material support, establishing markets, or providing institutional and technical support to the farmers. The second most frequently found subsidy type was s10 in seven plans, and the third was s8 in six plans. Subsidy types s5 and s11 were found only once in one plan, Plan I. Subsidy type s4 (where the government directs other bodies to transfer funds and/or provide goods and services) has been consistently present since 2001 (Plan F onwards), and subsidy types s6 (where government revenues are foregone or not collected) and s7 (where taxes are exempted or rebated) have been observed since 2010 (Plan H) and were not found in periods prior to that. The three subsidy types not observed in any plan were s2, s9 and s14. Six types of subsidies were integrated into more than 50% of the plans, whereas another six subsidy types were integrated into <30% of the plans.
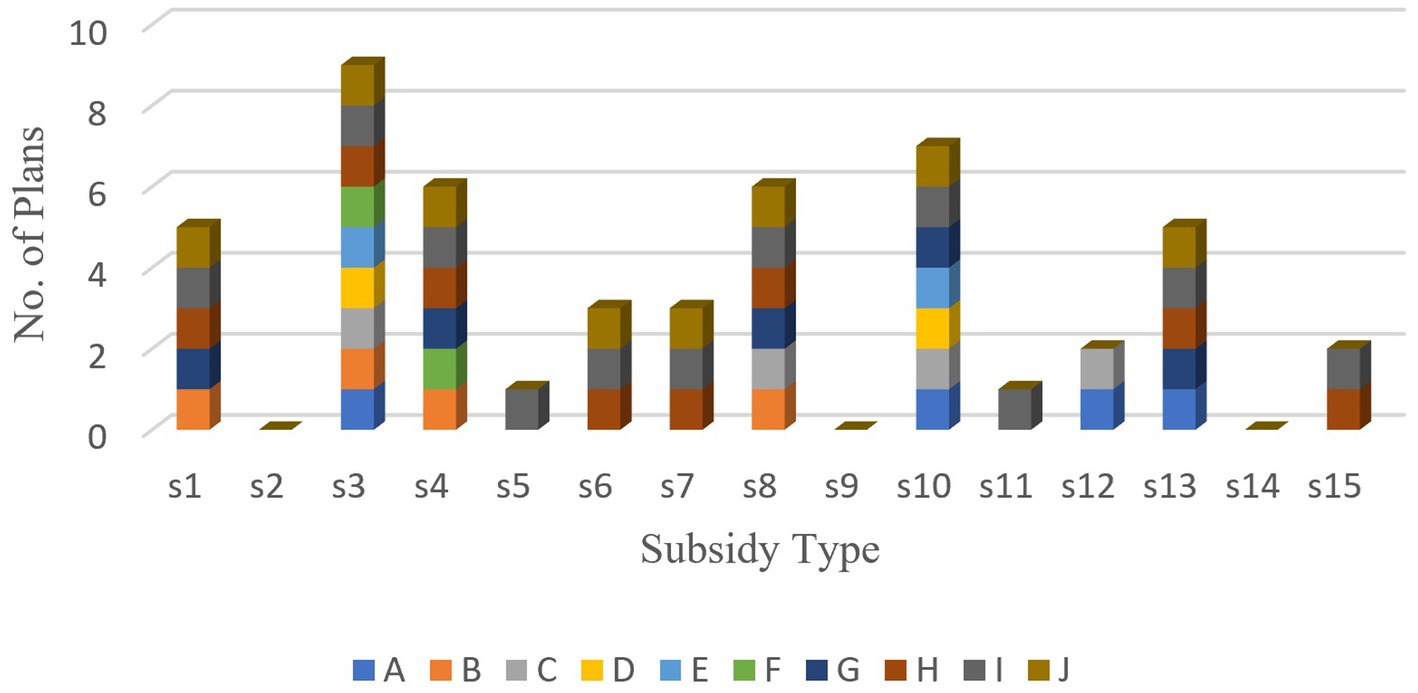
Figure 5. The coverage of each subsidy type across all plans (see Table 2 for the labels assigned to each subsidy type).
3.2.2 Total score for each subsidy type
As shown in Figure 6, the scores for the 12 observed subsidy types varied from 2 out of 160 in s5 and s11 to 56 out of 160 in s3, with an average score of 18.25. The second highest score for a subsidy type was 29 in s10, demonstrating that their scores, in line with the frequency of occurrence, were comparatively lower than those of subsidy type s3. Subsidy type s3 scored 18 out of 40 in two planning components (ii and iv) and 10 in the other two components, indicating that s3 was the most widely integrated subsidy across all four planning components. Four subsidy types (s1, s3, s4, and s10) were found in all four planning components, and another four subsidies (s6, s7, s8, and s13) were found in three planning components. Subsidy types s5 and s11 were found only in component iii of Plan I.
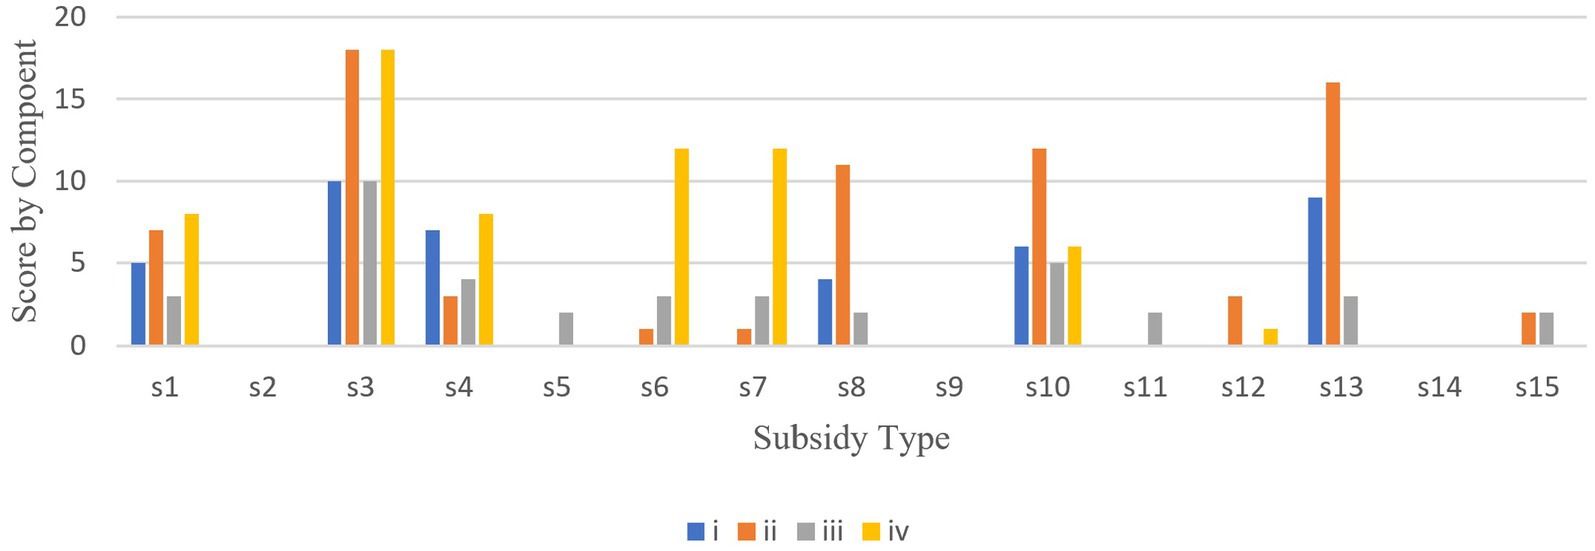
Figure 6. Total score of each subsidy type by component (see Table 3 for component legends).
3.3 Depth score for the quality of inclusion of subsidy
3.3.1 Depth score by subsidy type
The quality of information integration of subsidies across all plans was found to be considerably good, as shown in Figure 7. The average depth score for the 12 subsidy types was 61%. With a minimum possible depth score of 25% and a maximum of 100%, five subsidy types scored 70% and above, and the only subsidy type that received a score lower than 50% was s12, indicating that the quality of information presented in the plans where it was found was relatively poor.
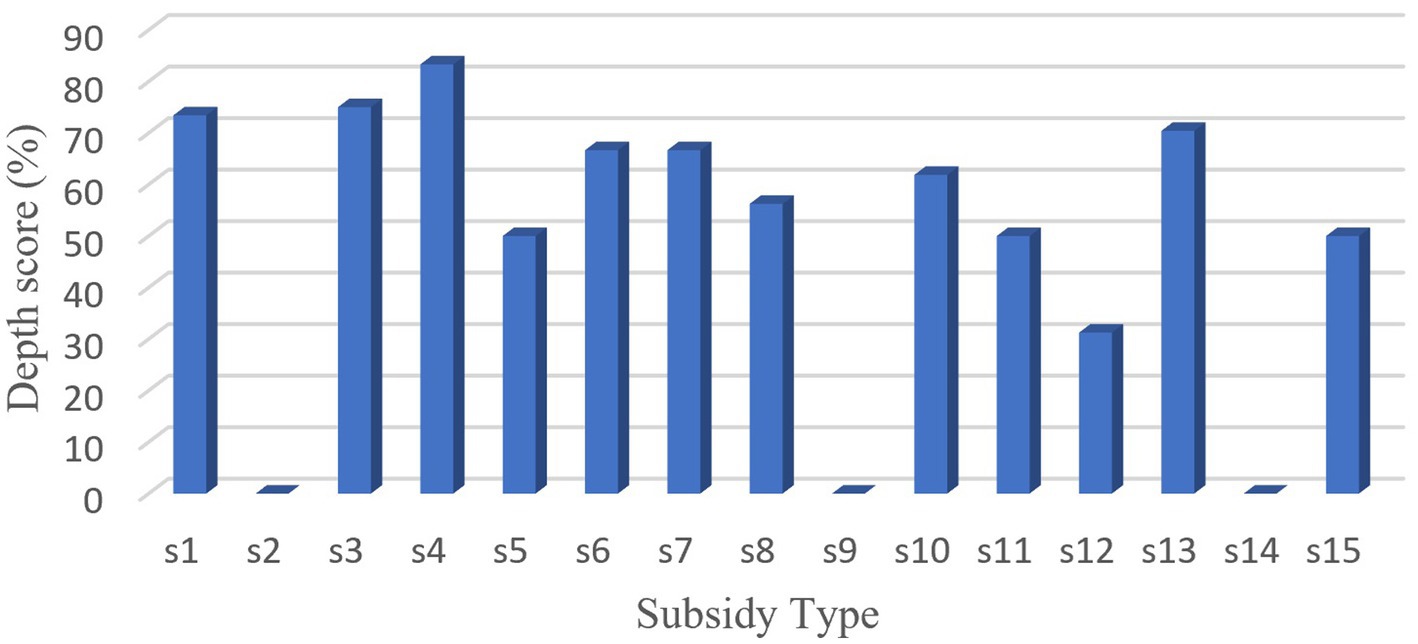
Figure 7. Depth Score illustrating the depth of details integrated into plans for each subsidy type.
Subsidy type s4, which is on the government directing other bodies to transfer funds such as loans or goods and services, exhibited the highest quality with a score of 83%. An example of s4 was observed in Plan I, where 1,500 farmers and 10 agricultural enterprises, including 300 women, were expected to benefit from a low-interest loan scheme by the end of the plan period. A government financing institution named SME Development Financing Corporation was assigned to support and facilitate a low-interest loan and a credit scheme, whereas Community Based Producer Organizations (CBPOs) were assigned to provide financial support to farmers. The specifics regarding the subsidy were clear in the documents in terms of timeline, volumes, implementation mechanisms, and beneficiaries, resulting in a higher depth score.
3.3.2 Depth score by plan
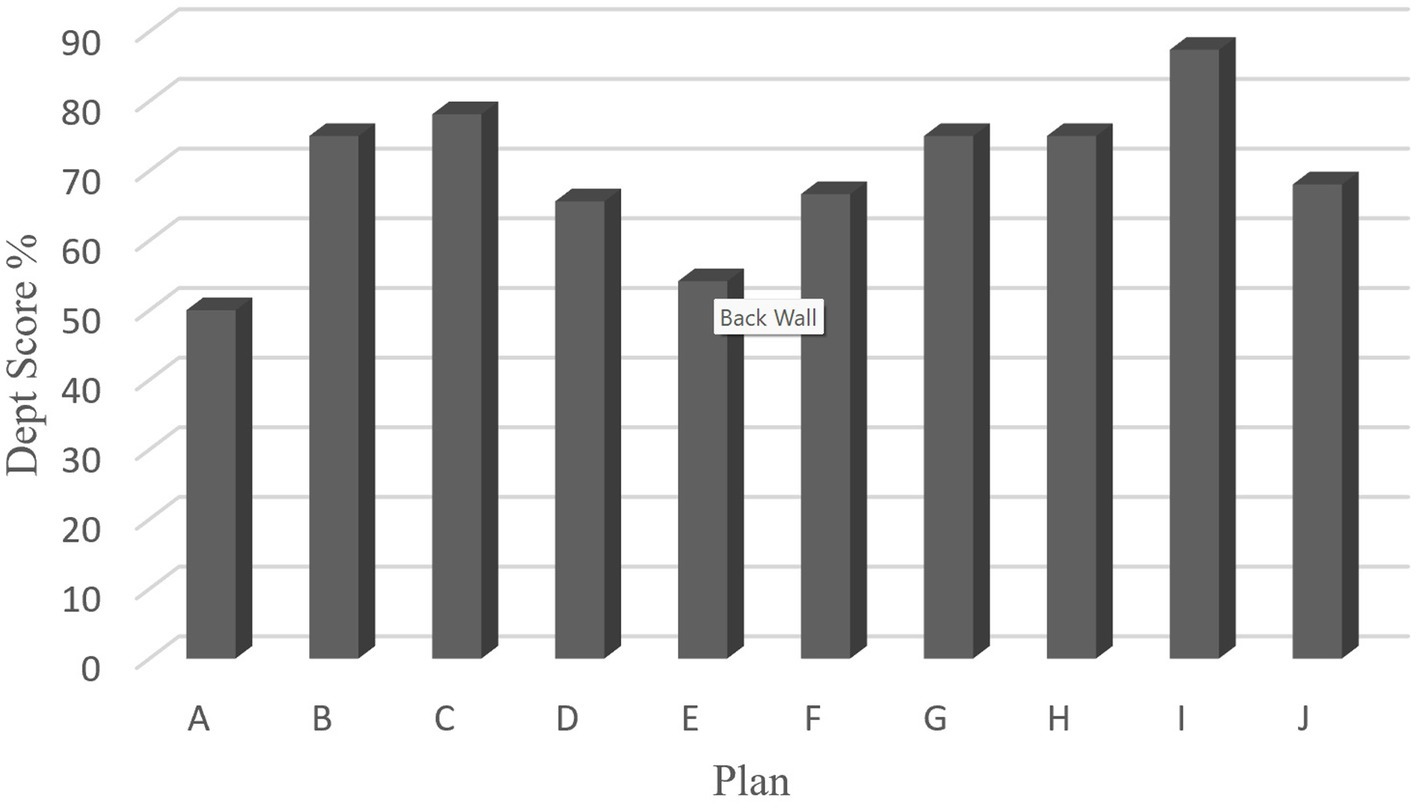
The depth score for each plan served as an indicator of the quality of subsidy integration within the plan. As shown in Figure 8, the quality of the information presented across all plans was fairly good, with an average depth score of approximately 70%. Between a possible range of 25–100%, the lowest score for quality (50%) was observed in Plan A, which corresponded to the earliest plan period in 1985. The highest score was in Plan I for the period 2019–2023, with a score of 87.4%. The second highest depth score was observed in Plan C, from 1991 to 1993, with a score of 78%. With a score of 54%, the second lowest score was observed in Plan E for the period 1997–2000. As such, the scores represent two peaks and two lows in the quality of subsidy integration across two different planning periods.
Among all planning components, the quality score for component iv was consistently the highest across the plans, with seven plans receiving the maximum depth score of 100% for this component (Figure 9). This indicates that the quality of subsidy details integrated into the implementation component was the highest among all components. On average, the lowest quality scores were observed in components i, and ii as there is comparatively less information on subsidy in these two components. Out of the four depth scores for component iii, three scores were approximately 100%, showing a high quality of integration of subsidy in plans where this component was present.
4 Discussion
The results revealed a high degree of subsidy integration in the agriculture sector of the Maldives over the past two decades. The most common subsidy across all time periods was on agricultural inputs. The plans further revealed that the motive behind subsidies was the expansion of agriculture to achieve food security. The Maldives, similar to other SIDS, is highly vulnerable to food insecurity with low production coupled with high dependency on imports from distant international markets, making them susceptible to external economic shocks (Connell et al., 2020; FAO, 2017, 2014; Guell et al., 2022; Massa, 2021). While this study provides an overview, the lack of in-depth research on islands in this field makes it challenging to derive any concrete conclusion at a global scale or provide a comparative analysis with the rest of the SIDS. As a small island state with limited agriculture, the global significance of subsidy in the Maldives may possibly be negligible, while its impacts are high.
4.1 Explaining the subsidization of the agriculture sector
The driving force behind subsidies likely stems from the challenges in expanding the agriculture sector. A careful analysis of the plans revealed four recurring challenges.
The first challenge, as seen in other island nations, is the various biophysical constraints that make expanding and sustaining the agriculture sector challenging (Connell et al., 2020; Guell et al., 2022; Massa, 2021). In the case of the Maldives, this was presented as a constraint in all plans except Plan I (this plan lacked component i on the Information Base, where this information was found in other Plans). The Maldives face a paucity of arable land, a consequence of geographical fragmentation into tiny islands, and the alkaline limestone origin of coral sand, which results in high soil porosity and infertility (FAO, 2022).
The second challenge, identified in all plans except Plan B, is the lack of adequate markets. The dispersed nature of the islands and the poor transportation links result in diseconomies of size (Connell et al., 2020; Van Driessche, 2023). Inter-island transportation remained largely disconnected and expensive throughout the study period (MPE, 1991; Van Driessche, 2023), making the delivery of highly perishable goods to distant markets such as Male’, uneconomical. The lack of adequate markets and relative dysconnectivity is another challenge observed in many SIDS (OECD, 2018; Van Driessche, 2023).
The third is the high unit cost of production, a predicament in SIDS such as the Maldives. The combination of limited and fragmented arable land, infertile soil, unfavorable climatic conditions, limited freshwater resources, the prevalence of pests and diseases, the lack of domestic agricultural inputs, and the considerable distance from markets lead to lower economies of scale and higher unit cost of production, rendering agriculture cost-ineffective (OECD, 2018; Van Driessche, 2023). This drives the government to contribute toward farmer costs through subsidies as a guarantee to investors of returns of their investments to sustainably grow the sector (Akbari et al., 2021; Pavolová et al., 2021). While the overall objectives of all the plans contributed toward reducing the production cost, six plans (A, E, F, H, I, and J) specifically mentioned this as a challenge.
The fourth constraint is the readily available low-cost imported agricultural products. In seven out of 10 plans (Plan C, D, E, F, G, H, and I), contribution toward import substitution was highlighted as an objective to either achieve food security or contribute toward the economy. A study by Van Driessche (2023) found unfair foreign competition and unregulated food imports are hurdles faced by local farmers. In SIDS, due to the high unit cost of production, local produce cannot compete against low-priced imported agricultural produce (Connell et al., 2020; FAO, 2014; Guell et al., 2022). As Mukhametzyanov et al. (2021) highlighted, successful import substitution can only be achieved when the unit cost of production becomes competitive, and the scale of local production matches the demand. As a result, subsidies such as tax reliefs, tariff reductions, and standardized regulations are employed to address import substitutions (Laguardia Martinez, 2019).
Similarly, the Maldives government applied various initiatives, including different forms of subsidies, to support farmers. A substantial portion of the subsidies identified in this research was directed toward agricultural inputs such as fertilizers, machinery, and equipment and on increasing the number of agricultural uninhabited islands through long-term leases with better security and reduced rents. Transport infrastructure and market interventions were introduced to address the issue of dysconnectivity. At the same time, most of the identified subsidies contributed toward reducing production costs and import replacement programs.
4.2 The increase in subsidies since Plan G
It was observed that there was an increasing trend in subsidy integration since Plan G in 2006. This plan coincides with the post-tsunami recovery period, in which half of the country’s agricultural land was destroyed, leading to the government’s prioritization of strengthening primary sectors (MPND, 2005). Additionally, this planning period saw a shift in the scale of agriculture from homestead gardening, as in Plan A, to a commercial industry. During Plan F (2001–2005), the government introduced a long-term lease of agricultural islands with the lease of 32 islands. As stated in this plan, “making available sufficient finances to invest in agriculture is important for the growth of the industry” was one of the ways the government supported the growing industry. The transition from small-scale to industrial-scale agriculture likely contributed to the subsequent subsidy increase to support the growing sector.
To sustain the growing industry, the government introduced additional subsidies in plan G through financial institutions, banks, investment, and credit schemes in addition to providing infrastructure and agricultural inputs. Plan G also introduced the regulation on agriculture and commodity imports to support import replacement programs. Notably, in 2008, a 5-year subsidy program of USD 3.2 million was introduced to support this sector (MoE, 2019). This clearly illustrates that the rapid expansion of the sector is matched by a proportional increase in subsidies. This is further confirmed by the increase in the combined annual expenditure on subsidies for food, electricity, water, fisheries, and agriculture from USD 29 million in 2012 to USD 75 million in 2019 (MOF, 2022). To foster further growth in the industry, by the time of Plan I, covering the period from 2019 to 2023, the government has established Business Centers (BCs), Business Center Cooperations (BCCs), and CBPOs to finance the industry through low-interest loans and credit schemes. To complement financing, in 2019, the President of the Maldives introduced a loan scheme (President’s Office, 2019) with a discounted interest rate of 6% (SDFC, 2022). Hence, the most recent plans further increased subsidy integration, reflecting the government’s commitment to support the industry’s continuous growth.
4.3 Subsidy distribution and quality
The most frequently observed subsidy type, s3, was found in nine plans, confirming the government’s substantial support for farmers in the form of agricultural inputs, goods and services. Many countries, including India, various African nations, and SIDS such as Fiji, provide similar subsidies, more frequently on fertilizers, to support farmers (Guell et al., 2022; Holden, 2019; Kato and Greeley, 2016; Salunkhe and Deshmush, 2012). This subsidy is important to the Maldives because the country does not produce agricultural inputs such as seedlings, fertilizers, machinery, or equipment. In the first four plans, the provision of inputs was more comprehensively described, likely as a measure to attract potential donors. The second most frequently observed subsidy type was s10, which was identified in seven plans. A major portion of this subsidy was allocated as security to uninhabited agricultural islands where a significant portion of arable land remains.
The quality of integration of subsidies across all plans, with the exception of s12, was relatively good. One possible explanation is the need for plans to provide comprehensive information to donors and other institutions regarding recipients’ details and subsidy implementation mechanisms. This is particularly evident when the government delegates the execution of subsidies to other bodies, as in the case of subsidy type s4. One of the reasons why Plan I (Strategic Action Plan 2019 to 2023) received the highest score for quality could be its alignment with the global trend in adopting SMART criteria (Specific, Measurable, Achievable, Realistic and Time-bound) as seen in the Sustainable Development Goals.
4.4 The environmental cost of an agriculture sector dependent on subsidies
The environmental impacts of agriculture on the terrestrial and marine ecosystems in the Maldives remain largely unstudied. However, existing literature suggests potential environmental consequences associated with the sector. The subsidized imports of agricultural inputs such as seeds and seedlings in the Maldives have led to the introduction of more than 323 non-native species for cultivation, which accounted for more than 55% of the total plant species in the country in 2015 (MEE, 2015a). Invasive alien species are one of the biggest drivers of biodiversity loss worldwide (IPBES, 2019b) with 90% of extinctions related to invasive species reported in islands (IPBES, 2023). One recorded incident in the Maldives is the widespread infestation from the coconut beetle across the country during the late 1980s to the 1990s (Zelazny et al., 1990).
Currently, there is no study on the Food Security Index of the Maldives or any attribution of the expanding agriculture sector toward achieving food security and human wellbeing. Singapore, another small island state, has a high Food Security Index with an overall score of 73.1, ranking 28th among the 113 assessed countries (The Economist, 2023). Like the Maldives, Singapore continues to import more than 90% of its nutritional requirements (SFA, 2022), demonstrating that food security can be achieved without a strong agriculture sector. None of the four indicators of food security (affordability, availability, sustainability and adaptation, and quality and safety) depend on the expansion of the agriculture sector within a country.
With 21% of land converted for agriculture (FAO, 2022), which includes 52 uninhabited islands (President’s Office, 2022), agriculture has become a significant driver of landcover change in the Maldives, threatening the conservation of native vegetation (Fallati et al., 2017). Additionally, the literature points toward adverse environmental impacts arising from the inappropriate and excessive use of agricultural inputs, such as fertilizers, on coral reefs, soil, and terrestrial ecosystems of the Maldives (BOBLME, 2010; MEE, 2017; Painter et al., 2023). Between 2010 and 2020, the value of fertilizer imports in the Maldives tripled (MEE, 2015b; MoECCT, 2022), raising further concerns about the potential impacts of agricultural practices in the country.
4.5 A look at the limitations of this study
As a first-time assessment of subsidies in the Maldives, this study is limited by many factors. The process of identifying subsidies from the information provided in the plans was challenging as the information was scattered without direct statements on subsidies. Supplementary documents were useful in gaining a further understanding of the plans. However, the number of supplementary documents and the period for which they were available was limited. The methodology adopted for this study was previously not used to screen policies for subsidies. Hence, the scoring criteria of the methodology required modification to be suitable for the study. Additionally, this methodology relied on the information provided within individual components, and the lack of a component in a plan affected the results regardless of the level of incorporation of subsidies in other components in the plan. Another limitation is the lack of a globally accepted subsidy typology that could guide policy analysis for subsidy screening. The final limitation is that the assessment was done by one person, the author, based on information provided in the plans, subjecting the results to subjectivity. An assessment with multiple experts of globally recognized subsidy typologies weighted based on their relative importance could give better and more accurate results.
5 Conclusion and recommendations
As expected of this study, the findings revealed a high degree of subsidy integration in the agriculture sector of the Maldives, with a gradual increase in subsidy since 2006. While an increase in subsidies may signify the growth of the sector, it also raises concerns about the potential impacts on both human wellbeing and the environment. While this study provides an overview of the status and trends in subsidies in the Maldives, it does not shed light on the effectiveness of the subsidies in ensuring economic growth, food security, or environmental sustainability. Further studies on the quantitative and qualitative impacts of agricultural subsidies will be necessary for informed decision-making regarding subsidy reforms.
It is important that future planning processes re-evaluate the current trajectory in agricultural planning and assess the sector’s alignment with the country’s aspiration to achieve food security. This entails comprehensively weighing the cost–benefit dynamics and exploring alternative strategies to attain food security while promoting environmental conservation. Similar to Singapore (SFA, 2022) diversification of imports and source countries, as well as improving long-term storage, are options to explore. Some countries have opted for a better trade network through open-access markets to achieve food security (OECD, 2021). Other options include adopting modern-day solutions such as social media for spontaneous access to distant markets (Dvorský et al., 2023), use of Artificial Intelligence for cost reduction and resource efficiency (Kliestik et al., 2023), taking advantage of shared resources to overcome individual insufficiencies (Razminienė et al., 2021), exploring a suitable technology for nutrient recycling, efficiency and cost-effectiveness (Maroušek and Gavurová, 2022; Stávková and Maroušek, 2021) such as biochar farming practices (Maroušek et al., 2023; Maroušek et al., 2017) that could address the challenges and deficiencies in the agriculture sector that drive subsidies. Studying these alternative approaches could open up opportunities for better food security with environmental sustainability and human wellbeing.
Data availability statement
The original contributions presented in the study are included in the article/Supplementary material, further inquiries can be directed to the corresponding author.
Author contributions
IM: Conceptualization, Data curation, Investigation, Methodology, Resources, Visualization, Writing – original draft, Writing – review & editing.
Funding
The author(s) declare that no financial support was received for the research, authorship, and/or publication of this article.
Conflict of interest
The author declares that the research was conducted in the absence of any commercial or financial relationships that could be construed as a potential conflict of interest.
Publisher’s note
All claims expressed in this article are solely those of the authors and do not necessarily represent those of their affiliated organizations, or those of the publisher, the editors and the reviewers. Any product that may be evaluated in this article, or claim that may be made by its manufacturer, is not guaranteed or endorsed by the publisher.
Supplementary material
The Supplementary material for this article can be found online at: https://www.frontiersin.org/articles/10.3389/fsufs.2024.1444269/full#supplementary-material
References
Akbari, M., Loganathan, N., Tavakolian, H., Mardani, A., and Štreimikienė, D. (2021). The dynamic effect of micro-structural shocks on private investment behavior /. Acta Montan. Slovaca 26, 1–17. doi: 10.46544/AMS.v26i1.01
Baker, I., Peterson, A., Brown, G., and McAlpine, C. (2012). Local government response to the impacts of climate change: an evaluation of local climate adaptation plans. Landsc. Urban Plan. 107, 127–136. doi: 10.1016/j.landurbplan.2012.05.009
Benton, T. G., Bieg, C., Harwatt, H., Pudasaini, R., and Wellesley, L. (2021). Food system impacts on biodiversity loss. Three levers for food system transformation in support of nature. London: Chatham House.
BOBLME (2010). Coastal pollution loading and water quality criteria, BOBLME-2010-Ecology_06. Maldives: Bay of Bengal Large Marine Ecosystem Project.
Boussios, D., Castillo, M., and Brewer, B. (2022). The unintended beneficiaries of farm subsidies. Land Econ. 98, 658–673. doi: 10.3368/le.98.4.062620-0093R1
Bruno, E., Falco, E., Shahab, S., and Geneletti, D. (2023). Integrating ecosystem services in transfer of development rights: a literature review. Land Use Policy 131:106694. doi: 10.1016/j.landusepol.2023.106694
Bruvoll, A., Magne Skjelvik, J., and Vennemo, H. (2011). Reforming environmentally harmful subsidies: How to counteract distributional impacts. Copenhagen: Nordic Council of Ministers.
CBD. (2023). Kunming-Montreal global biodiversity framework. Convention on Biological Diversity. Available at: https://www.cbd.int/gbf/targets/ (accessed October 3, 2023).
Choi, J.-K., Bakshi, B. R., Hubacek, K., and Nader, J. (2016). A sequential input–output framework to analyze the economic and environmental implications of energy policies: gas taxes and fuel subsidies. Appl. Energy 184, 830–839. doi: 10.1016/j.apenergy.2016.05.033
Connell, J., Lowitt, K., Saint Ville, A., and Hickey, G. M. (2020). “Food security and sovereignty in Small Island developing states: contemporary crises and challenges” in Food security in Small Island states. eds. J. Connell and K. Lowitt (Singapore: Springer), 1–23.
Cortinovis, C., and Geneletti, D. (2018). Ecosystem services in urban plans: what is there, and what is still needed for better decisions. Land Use Policy 70, 298–312. doi: 10.1016/j.landusepol.2017.10.017
Cottrell, J., and Zerzawy, F. (2021). Subsidies: Practical step to untangle the subsidies knot. Vienna: Sigrid Svehla-Stix Environment Agency Austria.
Damania, R., Balseca, E., de Fontaubert, C., Gill, J., Kim, K., and Rentschler, J. (2023). “The effects of agricultural subsidies on forests and their spillovers,” in Detox Development: Repurposing Environmentally Harmful Subsidies. Washington, DC: The World Bank, 187–208.
Dempsey, J., Martin, T. G., and Sumaila, U. R. (2020). Subsidizing extinction? Conserv. Lett. 13:e12705. doi: 10.1111/conl.12705
Dvorský, J., Bednarz, J., and Blajer-Gołębiewska, A. (2023). The impact of corporate reputation and social media engagement on the sustainability of SMEs: perceptions of top managers and the owners. Equilibrium. Q. J. Econ. Economic Policy 18, 779–811. doi: 10.24136/eq.2023.025
Ekardt, F., Bärenwaldt, M., and Heyl, K. (2022). The Paris target, human rights, and IPCC weaknesses: legal arguments in favour of smaller carbon budgets. Environments 9:112. doi: 10.3390/environments9090112
Ekardt, F., Günther, P., Hagemann, K., Garske, B., Heyl, K., and Weyland, R. (2023). Legally binding and ambitious biodiversity protection under the CBD, the global biodiversity framework, and human rights law. Environ. Sci. Eur. 35:80. doi: 10.1186/s12302-023-00786-5
Fallati, L., Savini, A., Sterlacchini, S., and Galli, P. (2017). Land use and land cover (LULC) of the republic of the Maldives: first national map and LULC change analysis using remote-sensing data. Environ. Monit. Assess. 189, –417. doi: 10.1007/s10661-017-6120-2
FAO (2014). Food security and nutrition in Small Island developing states (SIDS)- Policy Paper. Rome: FAO.
FAO (2017). Global action Programme on food security and nutrition in Small Island developing states |policy support and governance| food and agriculture Organization of the United Nations. Rome: FAO.
FAO (2020). Sustainable food and agriculture. Rome: Food and Agriculture Organization of the United Nations.
FAO (2022). FAO country profiles:Maldives. Rome: Food and Agriculture Organization of the United Nations.
FAO, UNDP, UNEP (2021). A multi-billion-dollar opportunity – repurposing agricultural support to transform food systems. Rome: FAO, UNDP, and UNEP.
Fernández-Palacios, J. M., Kreft, H., Irl, S. D. H., Norder, S., Ah-Peng, C., Borges, P. A. V., et al. (2021). Scientists’ warning – the outstanding biodiversity of islands is in peril. Global Ecol. Conserv. 31:e01847. doi: 10.1016/j.gecco.2021.e01847
Geneletti, D., and Zardo, L. (2016). Ecosystem-based adaptation in cities: an analysis of European urban climate adaptation plans. Land Use Policy 50, 38–47. doi: 10.1016/j.landusepol.2015.09.003
Guell, C., Brown, C. R., Navunicagi, O. W., Iese, V., Badrie, N., Wairiu, M., et al. (2022). Perspectives on strengthening local food systems in Small Island developing states. Food Sec. 14, 1227–1240. doi: 10.1007/s12571-022-01281-0
Guo, L., Li, H., Cao, X., Cao, A., and Huang, M. (2021). Effect of agricultural subsidies on the use of chemical fertilizer. J. Environ. Manag. 299:113621. doi: 10.1016/j.jenvman.2021.113621
Hassan, H. R. (2020). Maldives: Building Back better through clean energy. Washington, DC: World Bank.
Heidrich, O., Dawson, R. J., Reckien, D., and Walsh, C. L. (2013). Assessment of the climate preparedness of 30 urban areas in the UK. Clim. Chang. 120, 771–784. doi: 10.1007/s10584-013-0846-9
Heyl, K., Ekardt, F., Sund, L., and Roos, P. (2022). Potentials and limitations of subsidies in sustainability governance: the example of agriculture. Sustain. For. 14:15859. doi: 10.3390/su142315859
Holden, S. T. (2019). Economics of farm input subsidies in Africa. Annu. Rev. Resour. Econ. 11, 501–522. doi: 10.1146/annurev-resource-100518-094002
IEEP Best, A., Blobel, D., Berglund, M., Markandya, A., Sgobbi, A., et al. (2007). Reforming environmentally harmful subsidies (final report to the European Commission’s DG Environment). Brussels: Institute for European Environmental Policy.
IFAD (2020). Agricultural development: Maldives agribusiness Programme project design report. Rome: International Fund for Agricultural Development.
IPBES (2019a). Global assessment report on biodiversity and ecosystem services of the intergovernmental science-policy platform on biodiversity and ecosystem services. Bonn: IPBES.
IPBES (2019b). Summary for policymakers of the global assessment report on biodiversity and ecosystem services. Bonn: IPBES.
IPCC (2023). Climate change 2023: Synthesis report. Contribution of working groups I, II and III to the sixth assessment report of the intergovernmental panel on climate change. Geneva: IPCC.
Kato, T., and Greeley, M. (2016). Agricultural input subsidies in sub-Saharan Africa. IDS Bull. 47:130. doi: 10.19088/1968-2016.130
Keppel, G., Morrison, C., Meyer, J.-Y., and Boehmer, H. J. (2014). Isolated and vulnerable: the history and future of Pacific Island terrestrial biodiversity. Pac. Conserv. Biol. 20, 136–145. doi: 10.1071/PC140136
Kliestik, T., Nica, E., Durana, P., and Popescu, G. H. (2023). Artificial intelligence-based predictive maintenance, time-sensitive networking, and big data-driven algorithmic decision-making in the economics of industrial internet of things. Oeconomia Copernicana 14, 1097–1138. doi: 10.24136/oc.2023.033
Koplow, D., and Steenblik, R. (2022). Protecting nature by reforming environmentally harmful subsidies - the role of business. Forrestdale, WA: Earth Track.
Laguardia Martinez, J. (2019). “Cuba: a Caribbean SIDS reinventing itself” in Development, political, and economic difficulties in the Caribbean. ed. A. M. Bissessar (Cham: Springer International Publishing), 215–233.
Mardoyan, A., and Braun, P. (2015). Analysis of Czech subsidies for solid biofuels. Int. J. Green Energy 12, 405–408. doi: 10.1080/15435075.2013.841163
Maroušek, J., and Gavurová, B. (2022). Recovering phosphorous from biogas fermentation residues indicates promising economic results. Chemosphere 291:133008. doi: 10.1016/j.chemosphere.2021.133008
Maroušek, J., Hašková, S., Zeman, R., Váchal, J., and Vaníčková, R. (2015). Assessing the implications of EU subsidy policy on renewable energy in Czech Republic. Clean Techn. Environ. Policy 17, 549–554. doi: 10.1007/s10098-014-0800-1
Maroušek, J., Kolář, L., Vochozka, M., Stehel, V., and Maroušková, A. (2017). Novel method for cultivating beetroot reduces nitrate content. J. Clean. Prod. 168, 60–62. doi: 10.1016/j.jclepro.2017.08.233
Maroušek, J., Minofar, B., Maroušková, A., Strunecký, O., and Gavurová, B. (2023). Environmental and economic advantages of production and application of digestate biochar. Environ. Technol. Innov. 30:103109. doi: 10.1016/j.eti.2023.103109
Massa, I. (2021). More vulnerable SIDS face more difficulties to achieve the SDG 2 – zero hunger. Available at: https://www.unsdsn.org/more-vulnerable-sids-face-more-difficulties-to-achieve-the-sdg-2-zero-hunger (accessed December 9, 2023).
MBA (2022). Rapid assessment of the impact of COVID-19 on household income, expenditure and employment. Malé: Maldives Bureau of Statistics.
MBS. (2020). Statistical yearbook of Maldives 2020. Maldives bureau of Statistics. Available at: http://statisticsmaldives.gov.mv/yearbook/2020/ (Accessed July 11, 2022).
MEE (2015a). Fifth National Report to the United Nations convention on biological diversity. Malé: Ministry of Environment and Energy.
MoE (2019). Sixth National Report of the Maldives to the convention on biological diversity. Malé: Ministry of Environment and Energy.
MoECCT (2022). Baseline assessment on National use of chemicals and associated risks 2022. Malé: Ministry of Environment, Climate Change and Tecnology, Maldives.
MoED and UNDP (2020). Rapid livelihood assessment: impact of the COVID-19 crisis in the Maldives. Malé: The Ministry of Economic Development, Government of Maldives and United Nations development Programme 2020.
MOF. (2022). Government Finance Statistics 2012–2023. URL https://www.finance.gov.mv/publications/statistical-releases/government-finance-statistics (accessed 11.8.22).
MoFMRA (2019). National Fisheries and agricultural policy 2019–2029. Malé: Ministry of Fisheries, Marine Resources and Agriculture, Maldives.
MPE (1991). Development constraints, plans and strategies. Malé: Ministry of Planning and Environment.
MPND (2005). The Maldives: one year after tsunami - Maldives. Government of the Republic of Maldives, Asian Development Bank, International Federation of the red Cross and red Crescent Societies, United Nations, World Bank, government of Japan, American red Cross, Australian red cross, British red cross, Canadian red cross French red cross, German red Cross, OCHA, UNDP, UNEP, UNFPA, UNICEF, WFP, and WHO, Maldives. Malé: MPND.
MPND (2007). Seventh National Development Plan 2006–2010. Malé: Ministry of Planning and National Development.
Mukhametzyanov, R., Romanyuk, M., Ostapchuk, T., and Ivantsova, N. (2021). The objective need and trend of ensuring the food security in Russia in conditions of import substitution. BIO Web Conf. 37:00079. doi: 10.1051/bioconf/20213700079
Nizar, A. Z., and Rasheed, S. (2016). “Fiscal costs and challenges of social protection and subsidies: the case of the Maldives,” in MMA Research Papers, 15.
NPD (1985). National Development Plan of the Maldives 1985 1987 (plan). Malé: Ministry of Planning and Development.
OECD (2006). Subsidy reform and sustainable development: Economic. Paris: Environmental and Social Aspects, Organisation for Economic Co-operation and Development.
OECD (2018). Making development co-operation work for Small Island developing states. Paris: Organisation for Economic Co-operation and Development.
OECD (2021). Agricultural policy monitoring and evaluation 2021: Addressing the challenges facing food systems. Paris: Organisation for Economic Co-operation and Development.
Oosterhuis, F. H., and ten Brink, P. (2014). Paying the polluter – Environmentally harmful subsidies and their reform. New York, NY: Edward Elgar Pub.
Painter, S. C., Artioli, Y., Amir, F. H., Arnull, J., Ganeshram, R. S., Ibrahim, N., et al. (2023). Anthropogenic nitrogen pollution threats and challenges to the health of south Asian coral reefs. Frontiers in marine. Science 10:1187804. doi: 10.3389/fmars.2023.1187804
Pavolová, H., Bakalár, T., Kyšeľa, K., Klimek, M., Hajduová, Z., and Zawada, M. (2021). The analysis of investment into industries based on portfolio managers. EBSCOhost 26, 161–170. doi: 10.46544/AMS.v26i1.14
President’s Office. (2019). SME bank service and agriculture loan service will facilitate in the development of SME’s- president. The President’s Office. Available at: https://presidency.gov.mv/Press/Article/20837 (Accessed March 23, 2022).
President’s Office. (2022). Isles - Home. Available at: https://isles.gov.mv/home/en/ (accessed March 29, 2022).
Razminienė, K., Vinogradova-Zinkevič, I., and Tvaronavičienė, M. (2021). Clusters in transition to circular economy: Evaluation of relation. Acta Montanistica Slovaca 26, 1–12. doi: 10.20334/2021-009-M
Salunkhe, H., and Deshmush, B. B. (2012). The overview of government subsidies to agriculture sector in India. IOSR J. Agric. Vet. Sci. 1, 43–47. doi: 10.9790/2380-0154347
SCBD (2020). Global biodiversity outlook 5. Montreal, QC: Secretariat of the Convention on Biological Diversity.
Solarin, S. A. (2020). An environmental impact assessment of fossil fuel subsidies in emerging and developing economies. Environ. Impact Assess. Rev. 85:106443. doi: 10.1016/j.eiar.2020.106443
Stávková, J., and Maroušek, J. (2021). Novel sorbent shows promising financial results on P recovery from sludge water. Chemosphere 276:130097. doi: 10.1016/j.chemosphere.2021.130097
Tang, Z., Brody, S. D., Quinn, C., Chang, L., and Wei, T. (2010). Moving from agenda to action: evaluating local climate change action plans. J. Environ. Plan. Manag. 53, 41–62. doi: 10.1080/09640560903399772
The Economist. (2023). Global food security index (GFSI). Global Food Security Index (GFSI). Available at: https://impact.economist.com/sustainability/project/food-security-index (accessed September 27, 2023).
Tietenberg, T. H., and Folmer, H. (2005). The international yearbook of environmental and resource economics 2004/2005: A survey of current issues. London: Edward Elgar Publishing.
UN (2012). Monitoring of graduated countries from the category of least developed countries, Maldives (review of the list of least developed countries). New York, NY: United Nations.
UNESCO (2021). Islands: fragile showcases of biodiversity. UNESCO 3, 23–24. doi: 10.18356/22202293-2021-3-7
Valsecchi, C., Brink, P.ten, Bassi, S., Withana, S., Lewis, M., and Oosterhuis, F. H. (2009). Environmentally harmful subsidies (EHS): Identification and assessment - full report.
Van Driessche, P. A. (2023). Agricultural producer Markets in the Maldives: how poor market connectivity between farmers and the markets can be enhanced. Int. J. Rural. Manag. 20, 24–44. doi: 10.1177/09730052231161897
World Bank. (2023). World bank open data. Available at: https://data.worldbank.org (Accessed May 16, 2024).
Keywords: subsidy, agriculture, food security, sustainability, small island developing states, Maldives
Citation: Mohamed IA (2024) Assessing subsidy integration in the 40 years of agricultural planning in the Maldives. Front. Sustain. Food Syst. 8:1444269. doi: 10.3389/fsufs.2024.1444269
Edited by:
Christian Bux, University of Foggia, ItalyReviewed by:
Stanislav Škapa, Brno University of Technology, CzechiaFelix Ekardt, University of Rostock, Germany
Copyright © 2024 Mohamed. This is an open-access article distributed under the terms of the Creative Commons Attribution License (CC BY). The use, distribution or reproduction in other forums is permitted, provided the original author(s) and the copyright owner(s) are credited and that the original publication in this journal is cited, in accordance with accepted academic practice. No use, distribution or reproduction is permitted which does not comply with these terms.
*Correspondence: Ilham Atho Mohamed, aWxoYW05OTk5QGdtYWlsLmNvbQ==; aWxoYW0ubW9oYW1lZC42N3pAc3Qua3lvdG8tdS5hYy5qcA==
 Ilham Atho Mohamed