- 1School of Environment and Urban Construction, Lanzhou City University, Lanzhou, China
- 2College of Water Resources and Architectural Engineering, Northwest A&F University, Xianyang, China
Introduction: Global climate change has led to increases in the temperature and decreases in the number of frost days in northern China, facilitating a shift from a single cropping system (SCS, spring maize) to a double cropping system (DCS, winter wheat-summer maize rotation).
Methods: Therefore, under the current climate conditions, DCS expansion should be evaluated, and new planting schemes should be explored. In this paper, we identified the areas with potential for DCS in northern China considering an annual accumulated temperature of >0°C. The World Food Studies simulation model was used to simulate the yield, irrigation requirement (IR), and net income under various crop management conditions when considering the maximum yield and water use efficiency (WUE) of crops.
Results: Our results indicated that the potential DCS area increased by approximately 31.51 × 10⁴ km2 in northern China, with the primary DCS areas being located in the provinces of Gansu, Shaanxi, Shanxi, Hebei, and Liaoning. Regarding variety selection, winter wheat and summer maize varieties with early and mid-early maturation were found to be favored for the potential DCS areas. The sowing dates corresponding to the maximum WUEs of the crops were later than those corresponding to the maximum yields. In the potential DCS areas, under the maximum yield condition, the average unit total yield, IR, and net income increased to 2700 kg ha−1, 305 mm, and 607 USD ha−1, respectively, whereas under the maximum WUE condition, increases of 2862 kg ha−1, 284 mm, and 608 USD ha−1, respectively, were observed. The average unit total yield of the DCS was 15927 and 13793 kg ha−1 under the maximum yield and maximum WUE condition, respectively.
Discussion: Our findings may clarify the effects of climate change on agricultural production patterns and indicate suitable crop management practices.
1 Introduction
The sharp continual increase in the global population necessitates a proportional increase in global grain yield to meet food demand (Wu et al., 2006). However, industrialization, climate change, and grain being increasingly used for non-consumption purposes (e.g., as biofuels) pose a major challenge in terms of grain yield (Singh et al., 2020). Food shortage translates into higher food prices, thus affecting the economic and social stability of a country (Ben Hassen and El Bilali, 2022). Improving grain yield is of substantial importance in China, one of the most populous countries in the world. Increasing yields would help ensure regional food security and the implementation of national food security strategies.
The three major elements of food security are cultivated land, planting intensity (the number of harvests per year), and crop yield (FAO, 2002). Therefore, one or more of these three elements should be improved to increase agricultural productivity (Yang et al., 2015). However, the large-scale expansion of arable lands is challenging in China because of urbanization and industrialization (Gao et al., 2019b; Zhang L. et al., 2018). Therefore, studies have focused primarily on the effects of climate change on crop yield under the current arable land conditions and the improvement of crop yield through optimization of crop management practices. For example, in their study conducted in China, You et al. (2009) demonstrated that a 1°C increase in temperature reduced wheat yield by 3–10%; they further reported that the increase in temperature in the last century decreased wheat yield by approximately 4.5% in China. Because of the influence of a continental monsoon climate, only 25–40% of the total water requirement of the winter wheat is met by precipitation in northern China during the crop’s growth period (Fang et al., 2010), and Zhao et al. (2020) demonstrated that the reduction in the yield of winter wheat under water stress conditions was 113%. On the other hand, appropriate agricultural practices have been reported to offset some of the effects of climate change on crop yield (Lehmann et al., 2013). Ma et al. (2018) indicated that sowing winter wheat on the optimal date increases yield by adjusting the growth redundancy and physiological traits of roots and stems—for example, by improving the water use efficiency (WUE) of the crop. Yin et al. (2018) also demonstrated that the nitrogen use efficiency of crops may be improved by adjusting the sowing date. A study conducted on the North China Plain revealed that crop renewal resulted in a 12.2–22.6% increase in crop yield (Xiao and Tao, 2014). Crop yield can also be increased by using optimizing irrigation strategies (Xu et al., 2020; Zhao et al., 2020; Wu et al., 2023). In general, climate appears to be the most direct factor influencing agricultural productivity. Hence, climate change is anticipated to negatively affect the agriculture sector (Ju et al., 2013). Nevertheless, global warming may offer new opportunities for agricultural production. For example, in Europe, crop acreage may move northward due to global warming (Carter et al., 1996). Furthermore, the increase in temperature has facilitated a shift from a single cropping system (SCS; spring maize) to a double cropping system (DCS; winter wheat–summer maize rotation) in northern China (Gao et al., 2019a; Yang et al., 2015). However, the appropriate field management strategies in potential DCS areas remain to be determined. Climate conditions are a crucial factor influencing the selection of planting schemes (He et al., 2020; Lehmann et al., 2013); however, the spatial variability of climate may introduce uncertainties in terms of scaling up site-specific field management strategies to the regional level. During the selection of planting schemes, not only the crops’ irrigation requirements (Gao et al., 2019a) but also factors such as planting dates and crop varieties, which considerably influence crop yield (He et al., 2015; Xiao and Tao, 2014), should be considered. However, this topic has not received sufficient attention. As a result of climate change, the yield of spring maize in China has decreased (Chen et al., 2013; Lv et al., 2015). Therefore, further evaluation of the feasibility of transitioning from an SCS to a DCS in northern China is urgently required, and suitable field management strategies must be identified.
Northern China is the primary base for grain production in China, accounting for 72 and 83% of China’s total wheat and maize production, respectively (National Bureau of Statistics of China).1 This region is highly sensitive to climate change. Therefore, to enhance land productivity and ensure regional food security, the effect of climate change on agricultural production patterns must be determined. In this paper, we sought to identify potential DCS areas in northern China and investigate the temporal and spatial effects of various crop management conditions on crop yield, irrigation requirement (IR), WUE, and net income. Our findings may offer key insights into appropriate crop management practices and help predict the effects of climate change on the patterns of agricultural production.
2 Materials and methods
2.1 Study area
The crop planting systems used in northern China can be divided into the SCS and DCS (Figure 1, Liu and Han, 1987). The SCS primarily refers to spring maize, whose growth period is generally April to October. By contrast, the DCS primarily refers to the winter wheat–summer maize rotation system; winter wheat is generally sown in October of Year 1 and harvested between late May and early June of Year 2, whereas summer maize is sown between mid and late June and harvested between late September and early October. Global warming has resulted in the continuous northward expansion of DCS areas in China. Therefore, in this study, potential DCS areas (with a shift from an SCS to a DCS) were defined as the study area. Additionally, this region is predominantly characterized by a temperate continental climate and a temperate monsoon climate. The average annual rainfall ranges from 400 to 1,000 mm; however, it is unevenly distributed throughout the year, with most precipitation occurring between July and October. The average annual temperature ranges between 8.5°C and 12.7°C, with a decreasing trend observed from south to north.
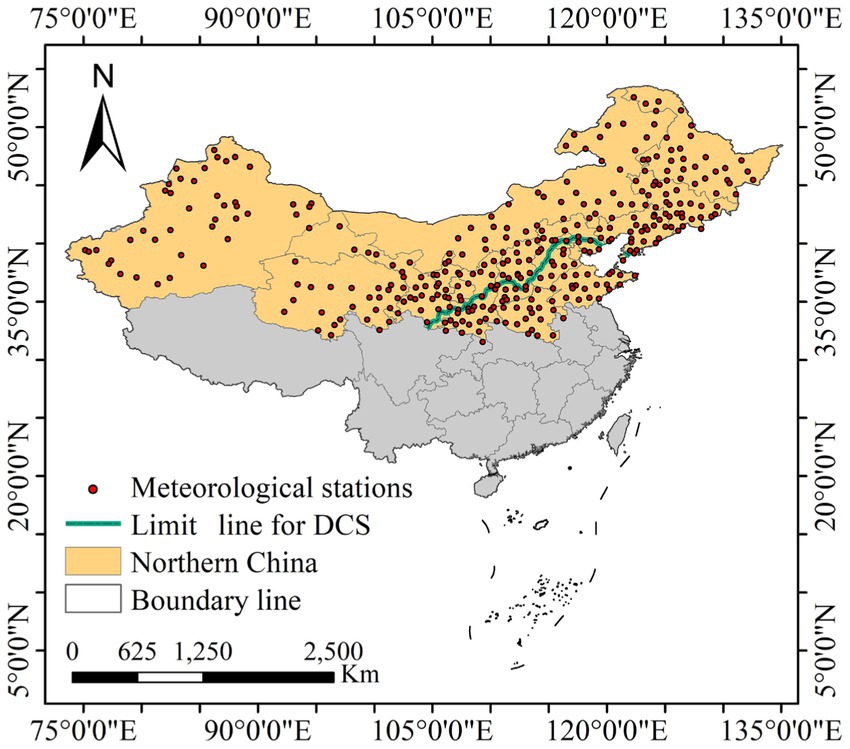
Figure 1. Distribution patterns of meteorological stations and crop plantation in northern China. The green line represents the boundary between SCSs and DCSs in 1968.
2.2 Dataset
Meteorological data (1968–2020) obtained from the China Meteorological Network2 comprised daily maximum and minimum temperatures, relative humidity, wind speed, precipitation, and sunshine hours. Daily solar radiation was calculated using the Angston–Prescott Equation 1 (Liu et al., 2009). The Kriging method was employed for spatial interpolation, with a spatial resolution of 1 km. However, missing data may arise from anomalies in the operation of meteorological stations. Therefore, we initially identified the latitude and longitude of the affected locations and retrieved the corresponding meteorological data from the fifth generation ECMWF atmospheric reanalysis V53 and the National Oceanic and Atmospheric Administration.4 Finally, we computed the average value of the multi-source datasets to minimize errors and replace the missing meteorological data.
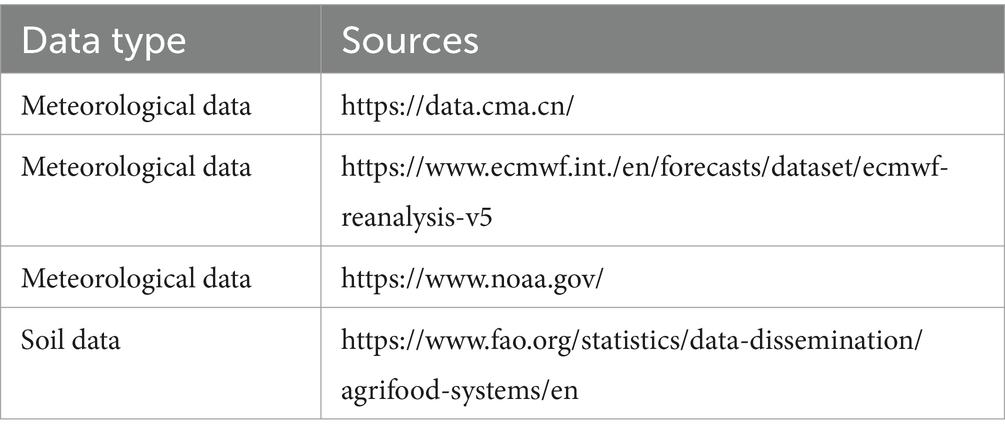
We employed China 1:1,000,000 soil data obtained from the world soil database5 regarding two layers: the 0–30-cm and 30–100-cm layers. The soil parameters required for the WOFOST model were calculated using data from the aforementioned soil database, as described previously (Brunet et al., 2010; Montzka et al., 2011; Su et al., 2014). The data used in this paper can be found in Table 1.
Due to the varying spatial resolutions among different data sources, we utilized the Python GDAL and Xarray libraries to resample the data to a 1 km resolution using cubic convolution interpolation prior to performing data analysis.
2.3 Methods
2.3.1 Study area identification
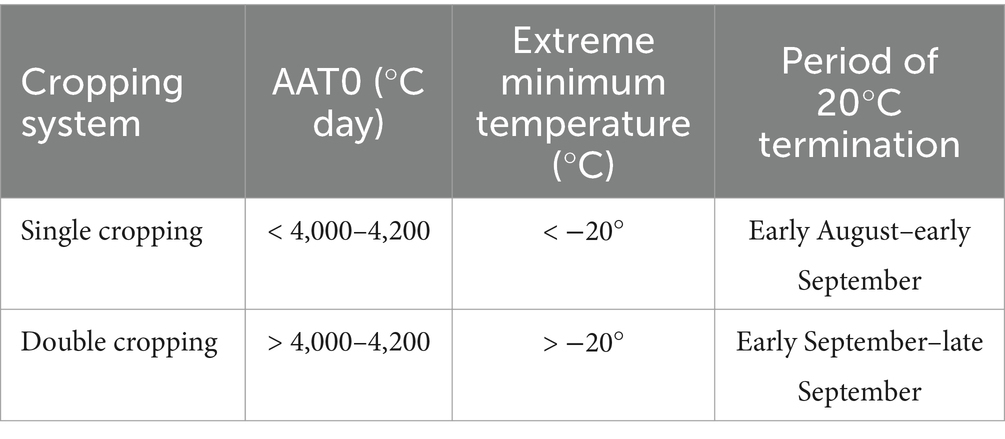
We divided the crop planting systems used in northern China into SCS and DCS areas (Liu and Han, 1987); the classification criteria are shown in Table 2. An annual accumulated temperature of >0° (AAT0) was calculated first. AAT0 was defined as the accumulated value of the daily mean temperature during a period when the temperature was stable at >0°C; it was calculated as follows:
where a and b are the start and end dates, respectively, of a year when the daily mean temperature (Ti) is consistently >0°C. For each meteorological station, we used a 5-point moving average method on an annual basis to filter the original daily mean temperatures and to determine the period during which the temperature was stable at >0°C. This period corresponded to that between a and b. We then used ordinary kriging to spatially interpolate AAT0 calculated from different stations, in addition, Sen’s slope method (Gocic and Trajkovic, 2013) was utilized to assess trends in climate data. We chose the AAT0 method based on its proven effectiveness in previous studies and its suitability for the specific research area (Gao et al., 2019a; Yang et al., 2015). The AAT0 method is straightforward and well-suited for large-scale historical data analysis. Additionally, we considered the constraints of minimum temperature and the period of 20°C termination, ensuring the survival of winter wheat and sufficient growth time for summer maize. Based on these criteria, we employed ArcGIS (Version 10.2) to delineate the boundary lines of SCS and DCS planting areas using contour lines. In accordance with the method of Gao et al. (2019a), we considered the range of limit line changes from 1968 to 2000 as the potential DCS areas, which served as our study area. And the performance of SCSs and DCSs under different field management conditions from 2001 to 2020 were evaluated. Choosing the time range of 1968–2020 for evaluating limit line changes for DCS may increase uncertainty due to anomalous temperatures in certain years. Furthermore, a longer duration is required to assess the impact of field management on crop production, with a generally accepted timeframe of 20 years considered suitable.
2.3.2 Model simulation and crop management conditions
The WOFOST model developed at Wageningen University was used to simulate daily crop growth. The input parameters for the simulation were primarily meteorological, soil, crop management, and crop variable data; the output data included the daily crop leaf area index, biomass, yield, and evapotranspiration (Wit et al., 2019). The WOFOST model has been widely used and validated in China (Wu et al., 2022; Zhuo et al., 2022). To simulate the biophysical parameters of maize and wheat, we used PCSE 5.5,6 which is a Python package based on the WOFOST model (Wit et al., 2019).
The acreage potentially available for DCS has increased due to global warming. However, proper selection of crop management practices suitable for local climate conditions remains a challenge. In this paper, we explored three crop management conditions: crop variety, sowing date, and irrigation strategy (Table 3). The crop varieties used commonly in the five provinces (Gansu, Shaanxi, Shanxi, Hebei, and Liaoning) of northern China between 2001 and 2020 were selected. Supplementary Tables S1–S3 present the main crop parameters for each variety, and most of them were obtained from Master’s thesis of China. The statistical yearbook data for the years 2010–20207 were used to evaluate the performance of model parameters (Figure A1). The results indicated R2 values of 0.75, 0.82, and 0.76, with RMSE values of 432, 752, and 728 Kg ha−1 for winter wheat, summer maize, and spring maize, respectively. Meaning that the WOFOST model and its selected parameters can be effectively utilized for simulating the yield of wheat and maize. AAT0 is a key determinant of SCSs and DCSs (Table 2). Therefore, TSUM1 and TSUM2 are the primary parameters that differ between crop varieties. These parameters represent the accumulated temperatures from germination to flowering and from flowering to maturity, respectively, which play a crucial role in determining crop maturity dates (Ceglar et al., 2019; Zhao et al., 2013). Smaller values of TSUM1 and TSUM2 indicate that crops require less heat, and that they mature earlier. In this study, the average planting dates for different crop types in five provinces were determined on the basis of previous research (Sun et al., 2007; Lv et al., 2013; Sun et al., 2016; Gao et al., 2018) and local field management practices. Specifically, spring maize was planted on April 20, summer maize was planted on June 15, and winter wheat was planted on October 15. On the basis of the average sowing dates in the five provinces, we determined a sowing date range by considering 5 and 10 days before and 5 and 10 days after the average sowing date. Considering the key water demand stages of the varieties, the irrigation periods determined for spring maize and summer maize were the sowing and filling stages, whereas those determined for winter wheat were the wintering, green-up, and flowering stages. Irrigation was limited to 50 mm/application for maize and 75 mm/application for winter wheat. Thus, we considered two irrigation strategies for spring maize and summer maize (we assumed that irrigation must be performed on the sowing date to ensure maize growth) and four irrigation strategies for winter wheat. We set the planting density for spring maize, summer maize, and winter wheat at 70000, 65000, and 4.5 million plants per hectare, respectively, in accordance with previous research (Sun et al., 2016; Gao et al., 2018; Wang H. et al., 2018; Wang Y. et al., 2018). We also assumed the absence of nutrient stress in crops. To simplify the calculation and statistical analysis, we divided the study area into grids with a spatial resolution of 20 km × 20 km (788 grids in total). To this end, we assumed the same planting patterns and meteorological conditions in each grid. Therefore, the value (soil and climate data) for each grid was the mean of all pixels within that grid coverage.
SPV, SPS, and SPI represent the varieties, sowing date, and irrigation strategy, respectively, for spring maize. SUV, SUS, and SUI represent the varieties, sowing date, and irrigation strategy, respectively, for summer maize. WV, WS, and WI represent the varieties, sowing date, and irrigation strategy, respectively, for winter wheat. For each crop, the three aforementioned parameters under different sets of crop management conditions are indicated using additional numerical numbers corresponding to the conditions used in paper.
2.3.3 IR and net income
Northern China is a semi-arid region where irrigation is necessary for field crops to achieve optimal yield. Therefore, evaluating crop water requirements (CWR) and water use efficiency (WUE) under different field management practices is crucial. Although the WOFOST model can simulate changes in soil moisture, field sampling data were unavailable in this study; thus, the parameters related to the model’s water module could not be optimized. In addition, in accordance with previous research (Rötter et al., 2012; Palosuo et al., 2011), the simulated soil moisture results of the WOFOST model were deemed unacceptable. Therefore, the potential evapotranspiration (ET0) was calculated using the Penmen–Monteith equation (Equation 2), which is recommended by the United Nations Food and Agriculture Organization (Allen et al., 1998). The potential crop water requirement was calculated by multiplying the crop coefficient Kc by ET0 (Equation 3). Additionally, due to the water limitations in Northern China, this study assumed the absence of surface runoff and deep percolation; thus, IR was calculated as the difference between CWR and effective precipitation (Equations 4, 5). WUE was defined as the ratio of yield to CWR (Equation 6), This method has been used in previous studies (Liu et al., 2022; Gao et al., 2019a; Wu et al., 2019).
where ET0 is the daily reference evapotranspiration (mm d−1), Rn is the net radiation (MJ m−2 d−1), G is the soil heat flux (MJ m−2 d−1), is the slope of a saturated vapor pressure–temperature curve (kPa °C−1), is the psychrometric constant (kPa °C−1), and T is the daily average temperature (°C). U2 is the wind speed at an altitude of 2 m (m s−1), es is the saturated vapor pressure (kPa), and ea is the actual air vapor pressure (kPa). Pe is the effective precipitation (mm), and P is the daily precipitation (mm d−1).
Studies have reported strong correlations between Kc and the leaf area indices of wheat and maize (Guo et al., 2020; Kang et al., 2003); therefore, the daily leaf area index simulated using the WOFOST model was used to calculate crop coefficients (Equations 7, 8).
Where Kc,maize and Kc,wheat were Kc for maize and wheat, respectively.
In order to evaluate the economic benefits of switching from SCS to DCS, we calculated the average profit (gross income minus total costs) per kg of summer maize and winter wheat according to previous studies (Chen et al., 2022; Fan et al., 2014; Sun et al., 2021; Zhang M. et al., 2018), which were 0.172 USD Kg−1 for summer maize and 0.196 USD kg−1 for winter wheat.
3 Results
3.1 Potential DCS expansion area and its climate characteristics
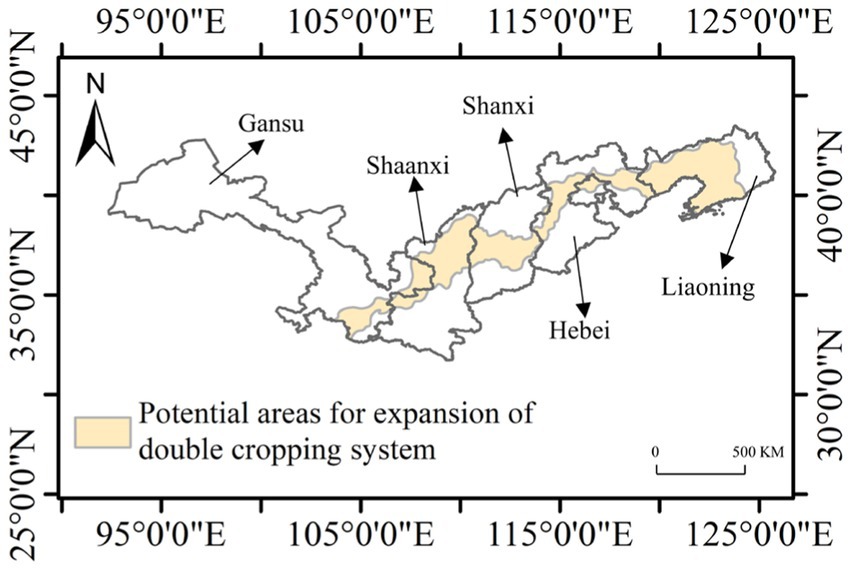
From 1968 to 2000, the potential DCS expansion area increased by 31.51 × 10⁴ km2 in northern China (Figure 2), and Liaoning had the largest potential DCS area (10.3 × 10⁴ km2), followed by Shaanxi (6.64 × 10⁴ km2), Hebei (5.50 × 10⁴ Km2), Shanxi (4.98 × 10⁴ km2), and Gansu (4.09 × 10⁴ km2).
Over the last century, global warming has substantially altered the spatiotemporal distributions of temperature and precipitation in China. In each province, the annual AAT0 was found to be higher in the southern region (Figure 3A). Gansu Province had the highest annual AAT0 (4,782°C), followed by Shanxi (4,672°C), Shaanxi (4,423°C), Liaoning (4,391°C), and Hebei (4,386°C). The annual AAT0 in the five provinces exhibited a strong increasing trend (Figure 3B; increasing from 77°C decade−1 to 100°C decade−1). This suggested that the potential DCS areas may continue to expand due to further warming.
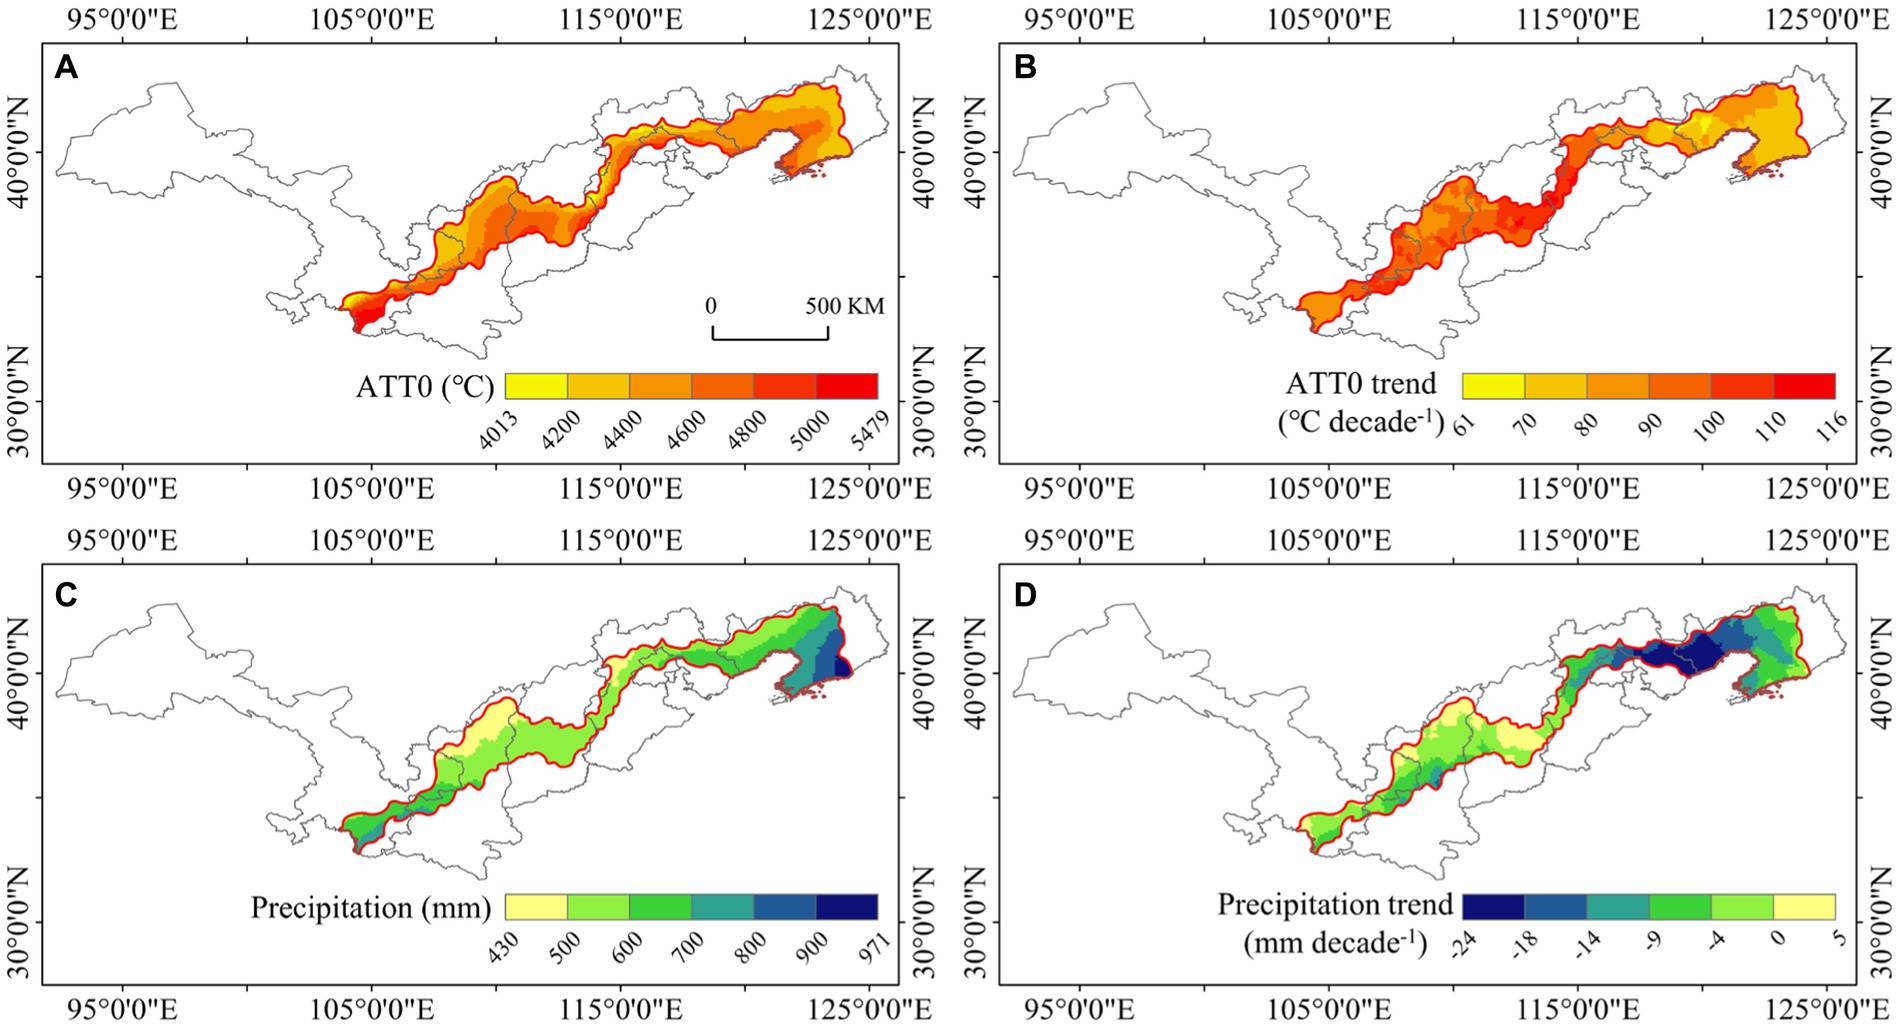
Figure 3. Distribution of annul accumulated temperature (A) and its trend (B) during a period when the temperature was stable at >0°C, and distribution of annual precipitation (C) and its trend (D) between 1968 and 2020 in the potential DCS areas. An AAT0 trend of >18°C decade−1 indicates moderate significance (p < 0.05), whereas that of >58°C decade−1 indicates high significance (p < 0.01). A precipitation trend of less than −9 mm decade−1 indicates moderate significance (p < 0.05), whereas that of less than −18 mm decade−1 indicates high significance (p < 0.01).
Liaoning Province had the highest amount of annual precipitation (702 mm) and decreased from southeast to northwest. For the other provinces, annual precipitation was lower at greater latitude (Figure 3C); the amounts of annual precipitation in Gansu, Hebei, Shanxi, and Shaanxi were 630, 568, 536, and 530 mm, respectively. We noted a decreasing trend in annual precipitation since 1968; in particular, prominent downward trends were noted for western Liaoning and eastern Hebei, whereas no clear trends were found for the other areas (Figure 3D).
3.2 Effects of various crop management conditions on yield
3.2.1 Spring maize
The average yield in the five provinces under SPI2 was 4.29% higher than that under SPI1 over the entire period 2001–2020 (Figure 4). Considering the SPI2 condition, SPV4 and SPS5 ensured the maximum yield in Gansu (13,679 kg ha−1) and SPV5 ensured the maximum yield in the other provinces when considering SPS3 in Shaanxi, SPS4 in Shanxi, SPS3 in Hebei, and SPS5 in Liaoning; the corresponding yields were 13,182, 13,193, 12,667, and 13,783 kg ha−1, respectively.
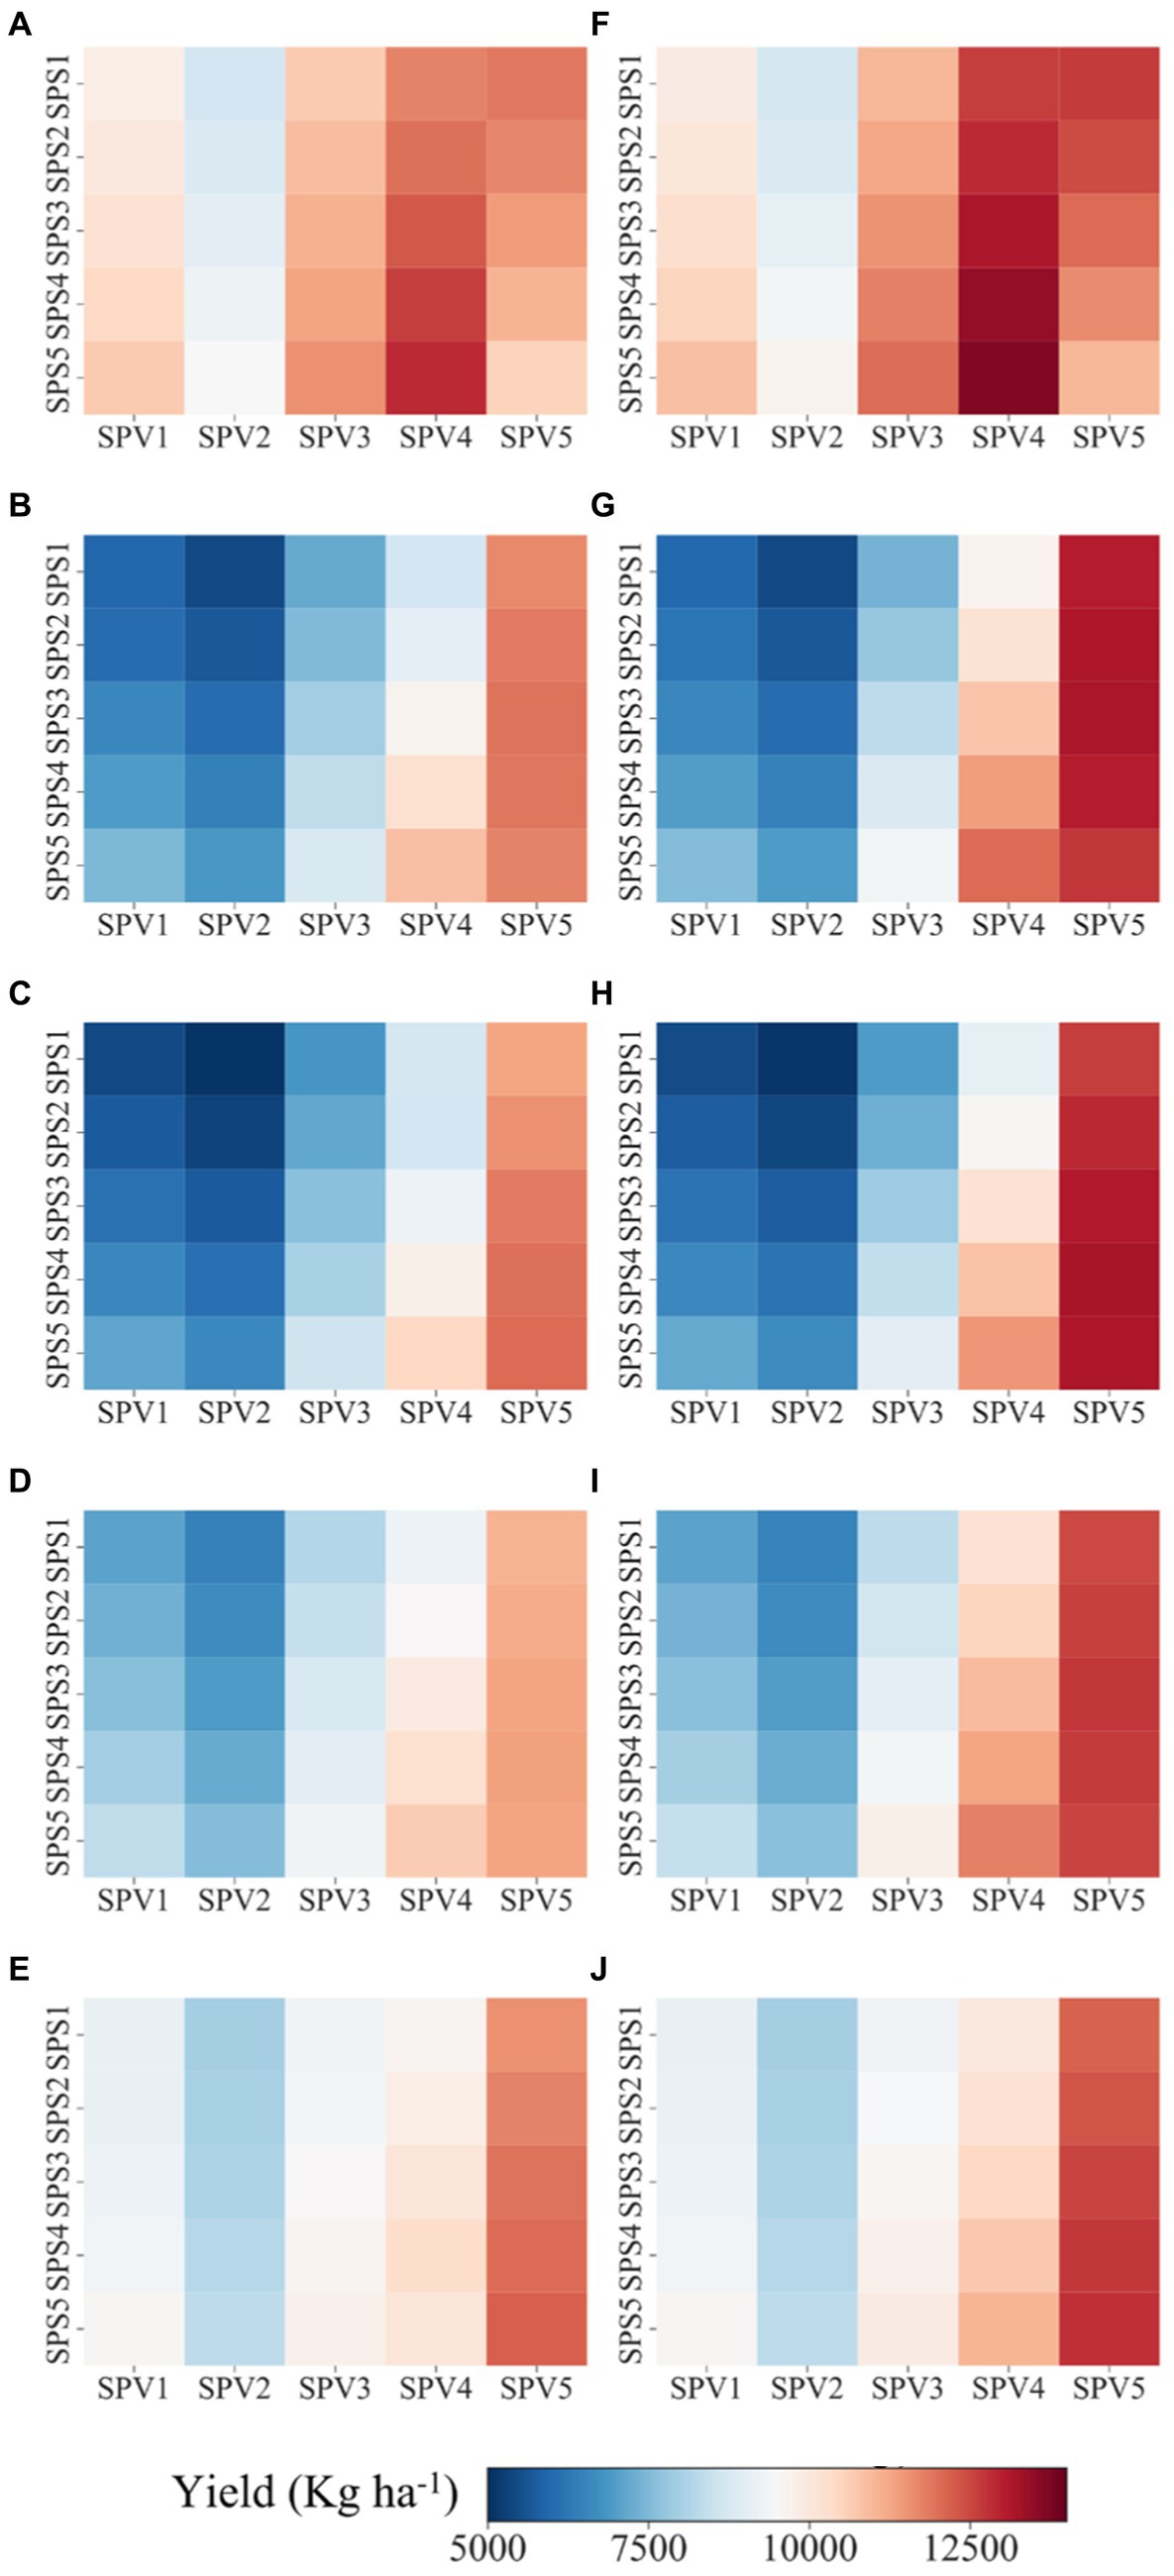
Figure 4. Effects of variety and sowing date on the average yield of spring maize in Gansu (A,F), Shaanxi (B,G), Shanxi (C,H), Hebei (D,I), and Liaoning (E,J) between 2001 and 2020 under irrigation strategies 1 (A–E) and 2 (F–J). SPV1, SPV2, SPV3, SPV4, and SPV5 represent spring maize varieties 1, 2, 3, 4, and 5, respectively. SPS1, SPS2, SPS3, SPS4, and SPS5 represent spring maize sowing dates 1, 2, 3, 4, and 5, respectively.
3.2.2 Summer maize
The average yield in the five provinces under SPI2 was 2.59% higher than that under SPI1 over the entire period 2001–2020 (Figure 5). Considering the SPI2 condition, SUV2 ensured the maximum yield in all five provinces when considering SPS1 in Gansu and Shaanxi, SPS2 in Shanxi and Hebei, and SPS3 in Liaoning; the corresponding yields were 10,493, 10,396, 10,008, 9,889, and 9,378 kg ha−1, respectively.
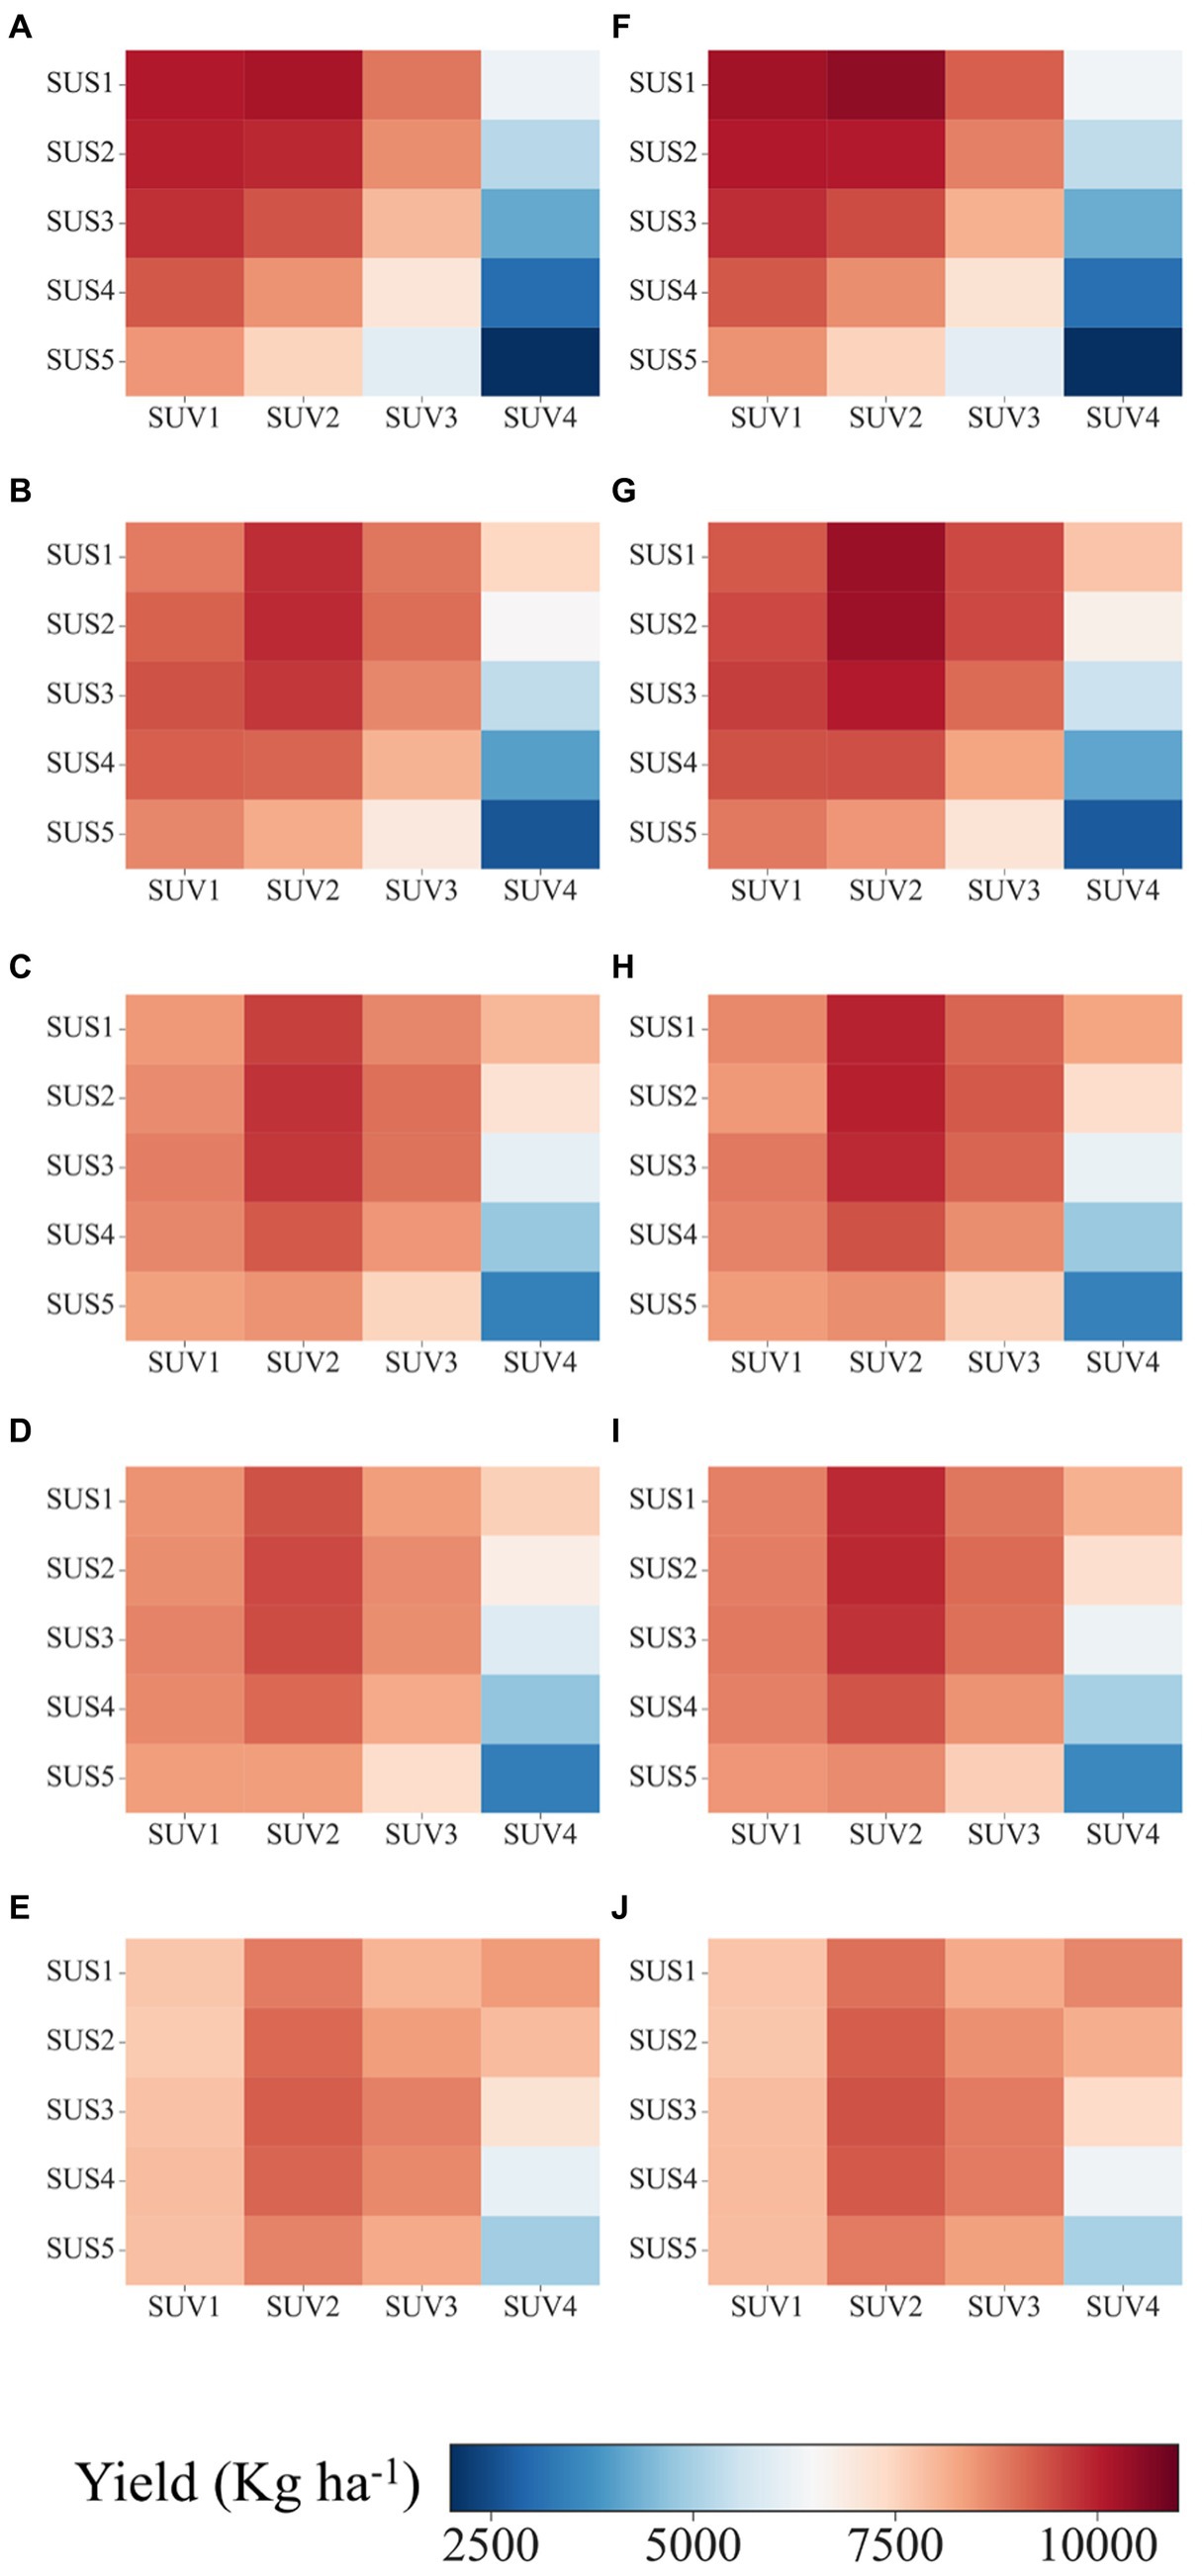
Figure 5. Effects of variety and sowing date on the average yield of summer maize in Gansu (A,F), Shaanxi (B,G), Shanxi (C,H), Hebei (D,I), and Liaoning (E,J) between 2001 and 2020 under irrigation strategies 1 (A–E) and 2 (F–J). SUV1, SUV2, SUV3, SUV4, and SUV5 represent summer maize varieties 1, 2, 3, 4, and 5, respectively. SUS1, SUS2, SUS3, SUS4, and SUS5 represent summer maize sowing dates 1, 2, 3, 4, and 5, respectively.
3.2.3 Winter wheat
The average yield of winter wheat under WI2, WI3, and WI4 was 46.51, 8.84, and 53.04% higher than that under WI1 for the entire period 2001–2020 (Figure 6). Therefore, irrigation at the green-up stage appears to be crucial for improving the yield of winter wheat. Considering the WI4 condition, WV1 ensured the maximum yield when considering WS4 in Gansu, WS3 in Shaanxi, and WS3 in Shanxi and WV2 ensured the maximum yield when considering WS2 in Hebei and WS1 in Liaoning; the corresponding yields were 7,042, 5,803, 5,582, 5,415, and 5,775 kg ha−1, respectively.
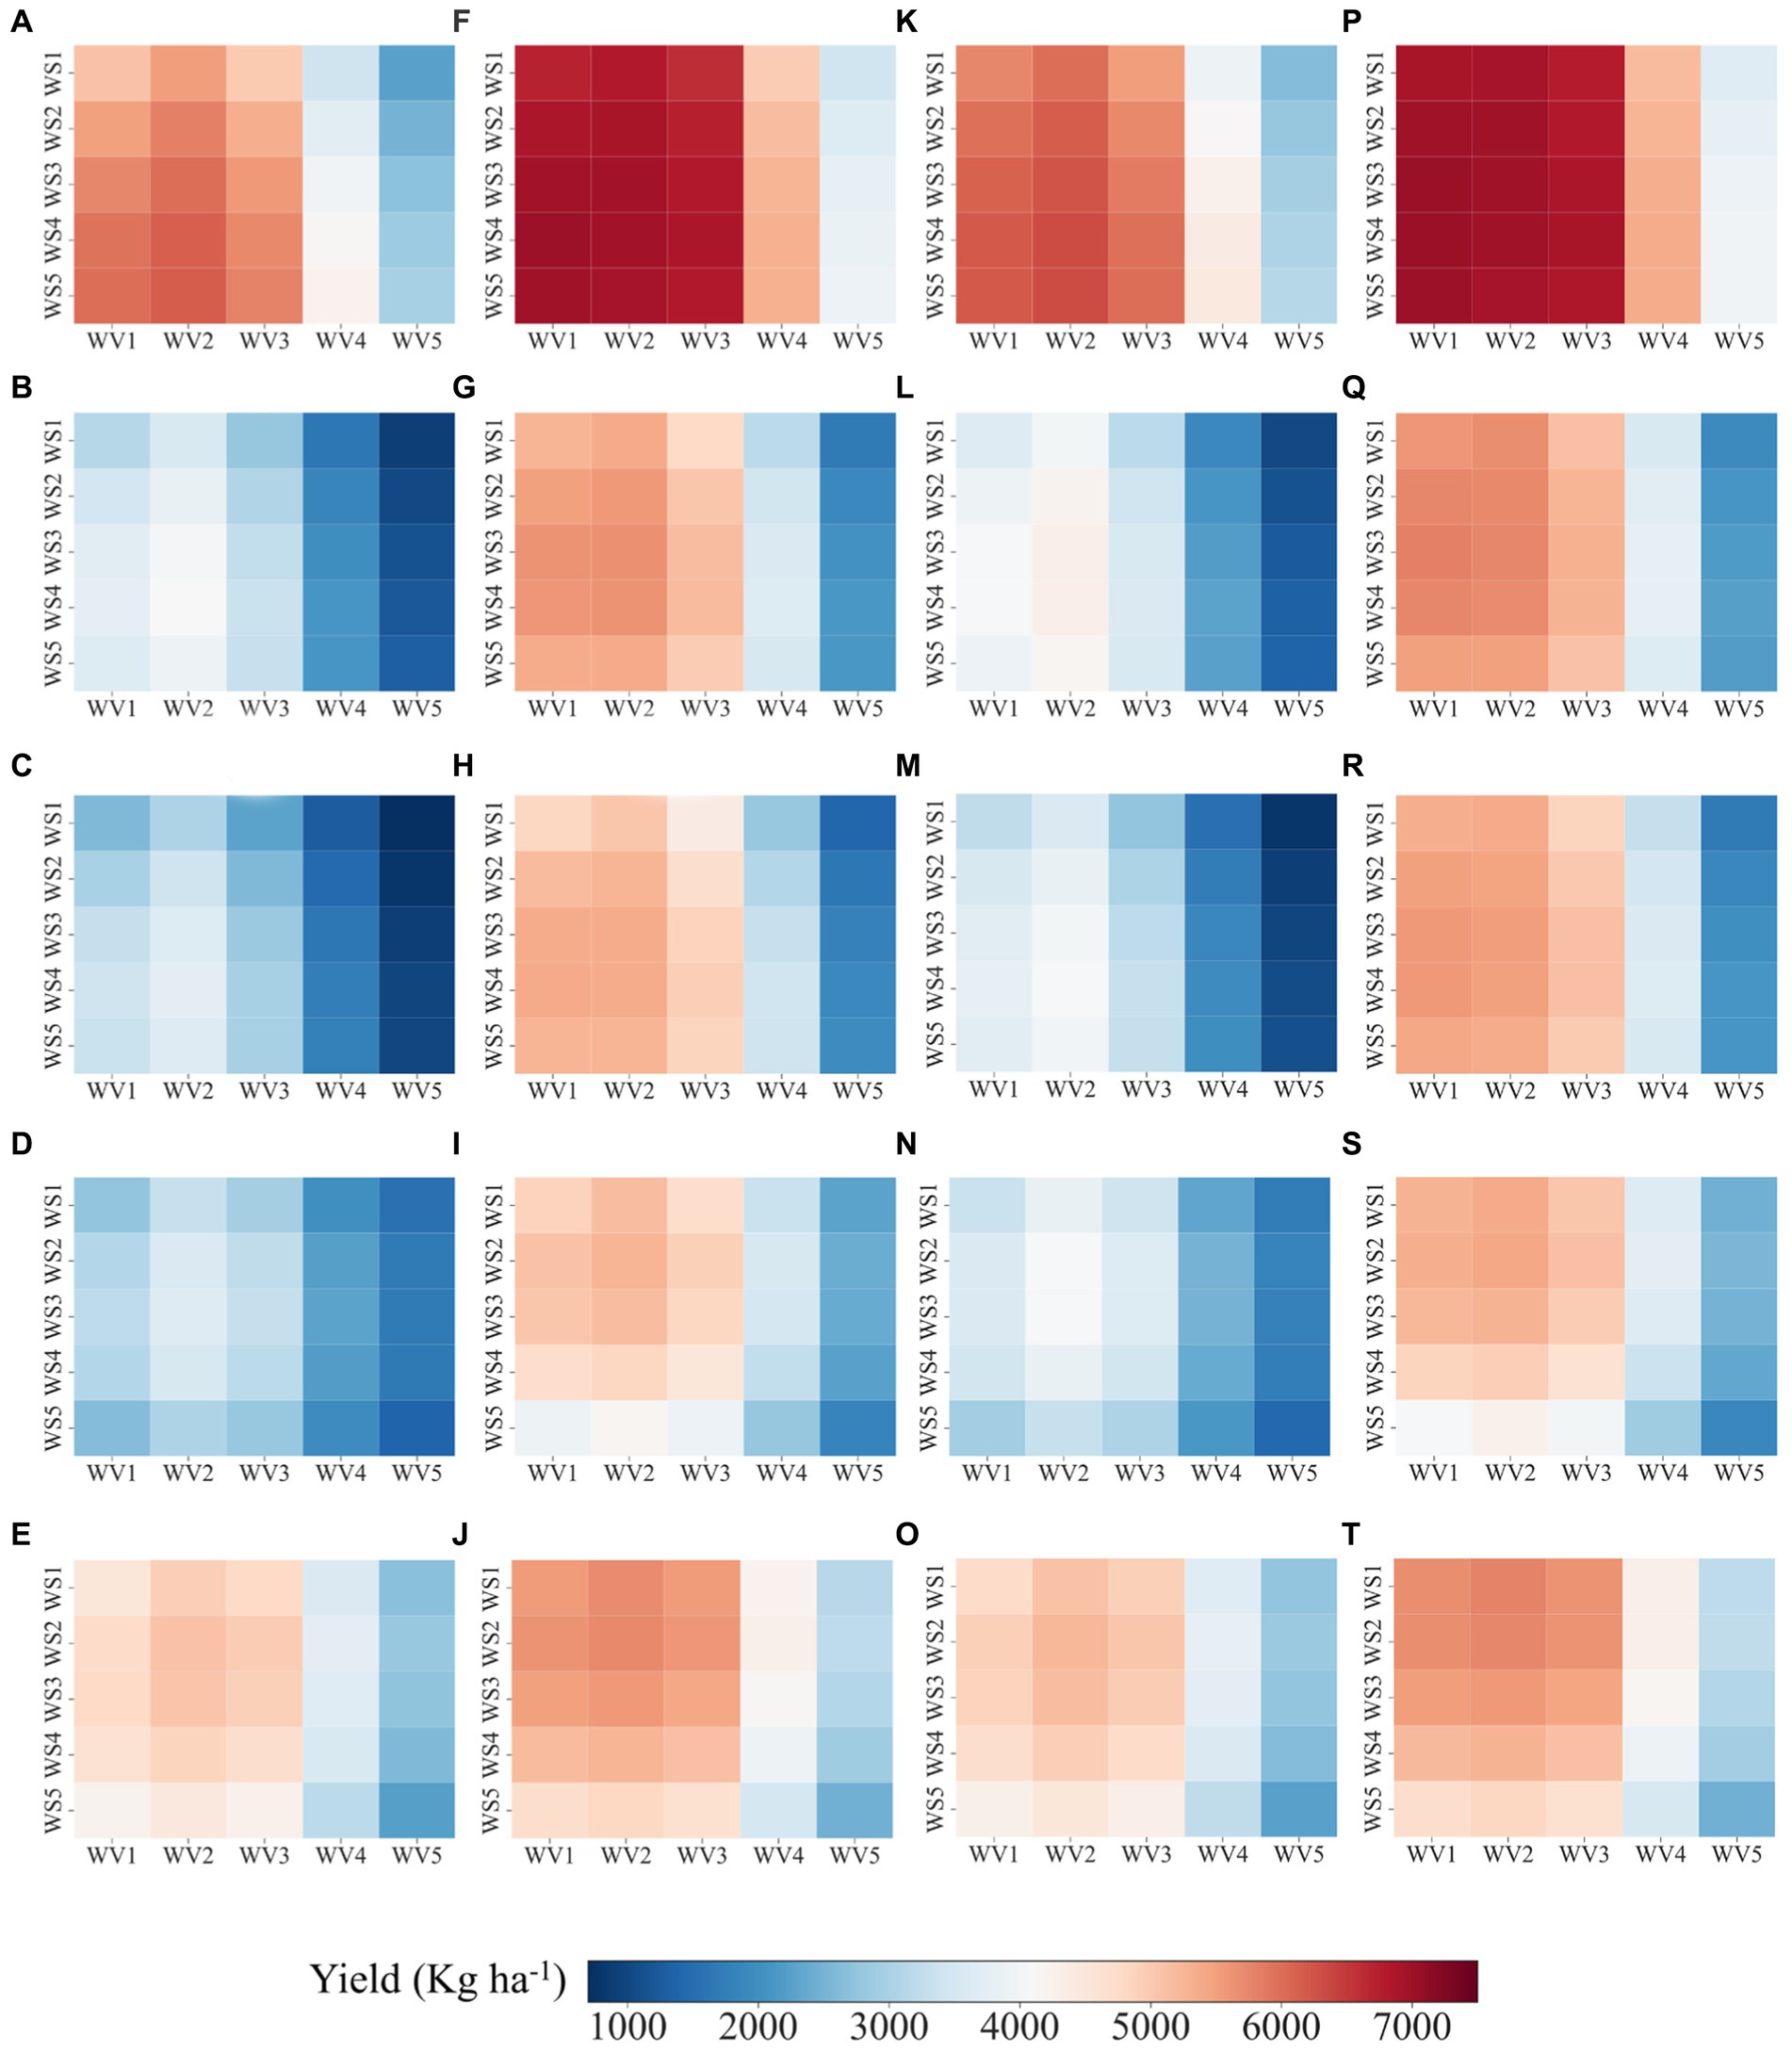
Figure 6. Effects of variety and sowing date on the average yields of winter wheat in Gansu (A,F,K,P), Shaanxi (B,G,L,Q), Shanxi (C,H,M,R), Hebei (D,I,N,S), and Liaoning (E,J,O,T) between 2001 and 2020 under irrigation strategies 1 (A–E), 2 (F–J), 3 (K–O), and 4 (P–T). WV1, WV2, WV3, WV4, and WV5 represent winter wheat varieties 1, 2, 3, 4, and 5, respectively. WS1, WS2, WS3, WS4, and WS5 represent winter wheat sowing dates 1, 2, 3, 4, and 5, respectively.
In general, the varieties with mid-late and delayed maturation and mid-late and delayed sowing dates were selected for spring maize to ensure high yield. For summer maize, the varieties with mid-early maturation and early and mid-early sowing dates were selected to ensure high yield. Finally, for winter wheat, the varieties with early and mid-early maturation were selected to ensure high yield; however, the sowing date varied depending on the local climate conditions.
3.3 Temporal variation in yield corresponding to different cropping systems and its driving factors
In potential DCS areas, when different crop types reached their maximum yield under various field management practices, the most significant yield increase from SCS to DCS was observed in Gansu, with an average yield increase of 2,807 kg ha−1 (Figure 7), followed by Shaanxi (1748 kg ha−1), Liaoning (1,501 kg ha−1), Hebei (1,439 kg ha−1), and Shanxi (1,197 kg ha−1). Notably, although the overall yield of DCS was higher than that of SCS in the potential DCS areas we assessed, the yield of DCS was not higher than that of SCS for all years (e.g., 2001, 2004, 2007, 2011, 2017, 2019, and 2020). This suggests that there is still uncertainty in DCS areas, and the winter wheat-summer maize rotation system is significantly influenced by climatic factors.

Figure 7. Yield gap between DCS and SCS when spring maize, summer maize, and winter wheat reach their maximum yields under different field management practices across five provinces from 2001 to 2020.
However, the climatic drivers of yield gaps vary by region (Table 4). Temperature favors an increase in yield gaps, primarily due to a decrease in spring maize yield and an increase in winter wheat yield. A continuous rise in temperature shortens the growth cycle of spring maize while reducing the impact of low-temperature stress on winter wheat. Additionally, precipitation was negatively correlated with yield gaps because the water consumption of spring maize during its growth period is much higher than that of summer maize or winter wheat. Soil moisture replenished by precipitation significantly increases spring maize yield, thereby reducing yield gaps. The impact of solar radiation on yield differences was more complex, being negatively correlated in Shanxi and Hebei but positively correlated in other regions. Solar radiation is the direct energy source for photosynthesis and indirectly affects respiration. Different hydrothermal conditions play an important regulatory role, thereby modulating the effects of solar radiation.

Table 4. The partial correlation coefficients between the yields of spring maize, summer maize, winter wheat, and yield gap with temperature, precipitation, and solar radiation in five provinces.
3.4 Comparison of potential DCS areas in terms of production indicators and net income
3.4.1 Yield, IR, and WUE
Figure A2 presents the spatial distribution of crop management conditions in 2001–2020 when considering the maximum yields of spring maize, summer maize, and winter wheat. In Gansu, Shaanxi, Shanxi, Hebei, and Liaoning, the average yield of the DCS was 17,962, 16,282, 15,706, 15,520, and 15,224 kg ha−1 and the average IR was 516, 630, 624, 598, and 374 mm, respectively (Figure A3). Compared with the findings corresponding to the SCS in Gansu, Shaanxi, Shanxi, Hebei and Liaoning, the average yield of the DCS was 3,589, 2,915, 2,317, 2,338, and 2,343 kg ha−1 higher (Figure 8A) and the average IR was 285, 333, 349, 329, and 231 mm higher (Figure 8B), respectively; the average WUE was 4.7, 3.9, 5.1, 5.1, and 4.5 kg mm−1 ha−1 lower, respectively (Figure 8C). In the study area, the yield of winter wheat served as the primary factor determining the difference in yield between SCSs and DCSs, with a coefficient of determination (R2) of 0.58 for winter wheat (Figure 9), followed by the coefficients for summer maize (R2 = 0.51) and spring maize (R2 = 0.21). However, in the provinces of Shaanxi, Shanxi, and Hebei, the yield of summer maize exhibited the highest correlation with the yield difference (Table 5); this result indicated that adopting a DCS and increasing the yield of summer maize would be more effective than increasing the yield of winter wheat, thus enhancing land productivity. Similar results were obtained for winter wheat in the provinces of Gansu and Liaoning.

Figure 8. Spatial distribution of the differences (gaps) between the DCS and SCS in terms of yield (A), IR (B), and WUE (C) in 2001–2020 when considering the maximum yields of spring maize, summer maize, and winter wheat.

Figure 9. Spatial correlation of yield gaps with the yield of spring maize (A), summer maize (B), and winter wheat (C) from 2001 to 2020 at the maximum yield of spring maize, summer maize, and winter wheat.
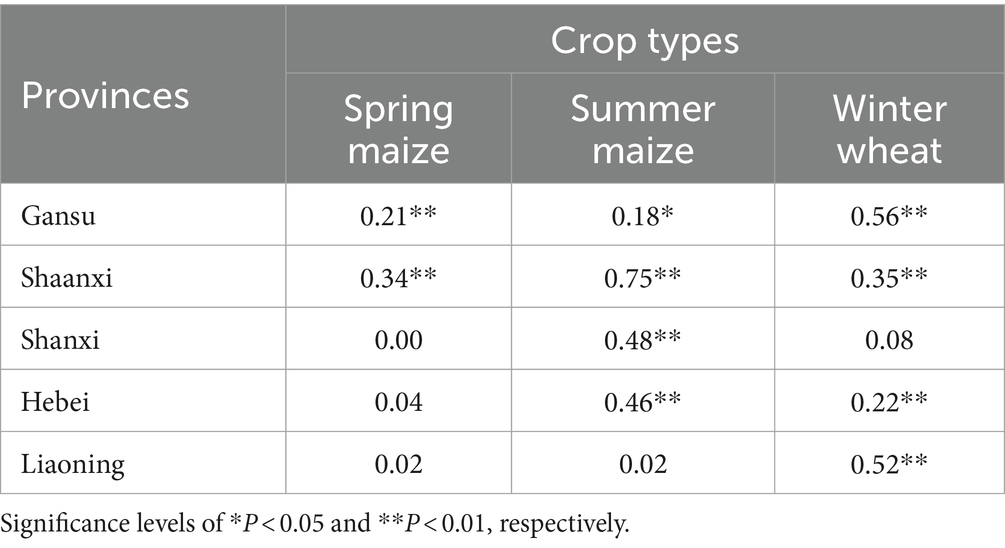
Table 5. Determination coefficients for the correlations of yield gap with the yield of spring maize, summer maize, and winter wheat in each province between 2001 and 2020 when considering the maximum yields of spring maize, summer maize, and winter wheat.
Figure A4 presents the spatial distribution of crop management conditions in 2001–2020 when considering the maximum WUEs of spring maize, summer maize, and winter wheat. In Gansu, Shaanxi, Shanxi, Hebei, and Liaoning, the average yield of the DCS was 16,618, 14,021, 13,007, 13,123, and 13,261 kg ha−1, and the average IR was 443, 529, 521, 510, and 291 mm, respectively (Figure A3). Compared with the findings corresponding to the SCS in Gansu, Shaanxi, Shanxi, Hebei, and Liaoning, the average yield of the DCS was 4,809, 2,434, 1,063, 2,511, and 3,493 kg ha−1 higher (Figure 10A) and the average IR was 306, 295, 288, 329, and 202 mm higher (Figure 10B), respectively; the average WUE was 8.2, 5.1, 5.5, 6.5, and 6.7 kg mm−1 ha−1 lower (Figure 10C), respectively. The determination coefficients for the correlations of yield gap with the yields of spring maize, summer maize, and winter wheat were 0.39, 0.02, and 0.44, respectively (Figure 11). Table 6 presents the determination coefficients corresponding to each province. Yield gap was most strongly correlated with winter wheat yield in Gansu and Liaoning and with spring maize yield in Shaanxi, Shanxi, and Hebei. Compared with the increases noted when considering the maximum WUEs of the crops, the DCS yield was 1,344–2,699 kg ha−1 higher and the average IR was 73–103 mm higher when considering the maximum yields of the crops.

Figure 10. Spatial distribution of the gaps between the DCS and SCS in terms of yield (A), IR (B), and WUE (C) in 2001–2020 when considering the maximum WUEs of spring maize, summer maize, and winter wheat.

Figure 11. Spatial correlations of yield gap with the yield of spring maize (A), summer maize (B), and winter wheat (C) in 2001–2020 when considering the maximum WUEs of spring maize, summer maize, and winter wheat.
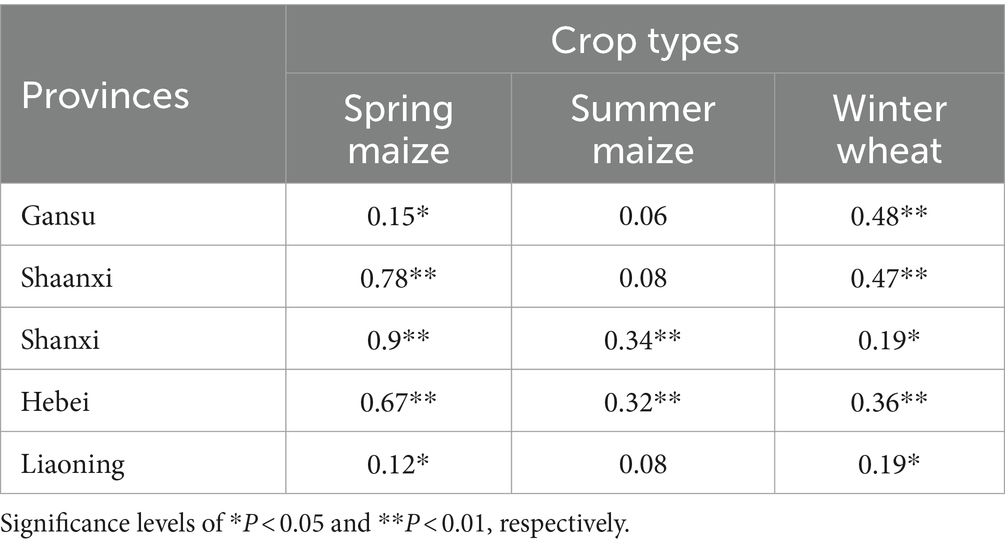
Table 6. Determination coefficient for the correlations of yield gaps with the yield of spring maize, summer maize, and winter wheat in each province between 2001 and 2020 when considering the maximum WUEs of spring maize, summer maize, and winter wheat.
Generally, converting an SCS to a DCS increases the grain yield per unit of land area. However, this conversion is accompanied by an increase in IR and a decrease in WUE.
3.4.2 Net income
Considering the maximum yields of the crops, the net income from the DCS yields in Gansu, Shaanxi, Shanxi, Hebei, and Liaoning was 787, 641, 533, 533, and 542 US dollar (USD) ha−1 higher, respectively (Figure 12A), than for the SCS. Considering the maximum WUEs of the crops, the net income in Gansu, Shaanxi, Shanxi, Hebei, and Liaoning was 978, 524, 281, 531, and 727 USD ha−1 higher, respectively (Figure 12B); in some areas of Shaanxi, Shanxi, and Hebei, the net income from the DCS yield was lower than that from the SCS yield. Furthermore, compared with the net income obtained when considering the maximum yields of the crops, those obtained when considering the maximum WUEs were 191, −117, −251, −2, and 185 USD ha−1 higher in Gansu, Shaanxi, Shanxi, Hebei, and Liaoning, respectively.

Figure 12. Changes in net income from the DCS yield compared with that from the SCS yield when considering the maximum yields (A) and maximum WUEs (B) of the crops and the differences between the net income obtained when considering the maximum WUEs and that obtained when considering the maximum yields (C) of the crops in 2001–2020.
4 Discussion
4.1 Potential DCS areas and their crop management conditions
Although global warming has shortened the growth periods of crops and reduced the number of frost days (extreme low-temperature conditions; Estrella et al., 2007), it has expanded the areas available for multiple cropping. Previous studies have confirmed the northward shift of the DCS in China (Gao et al., 2019a; Yang et al., 2015), which aligns with our findings. However, the potential DCS area identified in this study is approximately 50,000 km2 larger than those of Gao (Gao et al., 2019a), with Shaanxi showing the most significant difference. This discrepancy may be attributed to differences in study periods, as the trend of global warming varies over different time frames, contributing to the uncertainty. Furthermore, with the current intensification of global warming, adhering to unchanged field management practices may no longer be effective (Chen et al., 2020; Liu et al., 2021; He et al., 2015). Therefore, we analyzed the impacts of various field management practices from multiple perspectives, including yield, water use efficiency, and economic performance. This analysis better demonstrates the feasibility of transitioning from SCS to DCS in potential DCS areas. Winter wheat is the primary cereal crop involved in northward DCS expansion in northern China. The vernalization stage is considered to be important for winter wheat (Wang et al., 1995); this indicates the ability of winter wheat to grow normally at low temperature for a certain period. However, accumulated temperature theory holds that the development rate of organisms is dependent on temperature. Sufficient effective accumulated temperature is essential if crops are to move from one phenological stage to another (McMaster and Smika, 1988).
In the present study, considering the maximum yields and WUEs of the crops, we identified a tendency favoring the selection of winter wheat and summer maize varieties with early and mid-early maturation for cultivation in the potential DCS areas (Figures A1, A3) because these varieties require relatively low accumulated temperatures for an effective phenological cycle and normal crop growth. Conversely, some studies conducted on the North China Plain have reported that to adapt to global warming, crop varieties that require higher temperatures should be introduced to ensure high yield; the dry matter accumulation time and the key growth period of winter wheat should coincide with the rainy season (Wang et al., 2013; Xiao et al., 2013). However, because of the low AAT0 in potential DCS areas, the introduction of varieties with delayed maturation may affect not only the normal development of the first crop but also the seeding of the next crop. The sowing dates should be selected by considering different purposes. The pursuit of yield requires early sowing to ensure high accumulated temperature, whereas the pursuit of WUE requires delayed sowing to reduce soil water consumption. Therefore, crop management practices must be optimized by considering local climate conditions and purposes.
4.2 Prospects and challenges of SCS to DCS conversion
The yield per unit area increased when a SCS was changed to a DCS. Notably, the increase in winter wheat yield was higher than the decrease in maize yield. Although the demand for wheat has increased only slightly in China, industrial and feeding demands have surged in recent years, particularly in 2020 and 2021, leading to a situation where the demand for winter wheat has exceeded its yield (Chen and Lu, 2019). Amidst a complex international situation, the likelihood of a food crisis in some parts of the world has been increasing (Ben Hassen and El Bilali, 2022; Sosa et al., 2022). Therefore, despite China having solved its food rationing problem, increasing food production is crucial in light of international trade and national food security strategies. Maize, used for producing biofuel, has emerged as a significant contributor to economic growth. In the United States, 35% of the total maize produced is used for ethanol production (Sarwer et al., 2022), establishing a long-term, stable, and controllable processing and conversion channel, thereby enhancing the country’s ability to regulate its food market. However, China still lags behind developed countries in biofuel production. The conversion of SCS to DCS appears to improve the utilization of arable lands, unit yield of crops, and net income of farmers.
However, the transition from SCS to DCS is often challenging. Changing the cropping structure entails increased labor, higher water consumption, and alterations in the industrial structure, which poses a significant challenge for Northern China (Liu et al., 2014; Xiao et al., 2018). Throughout the growth period of winter wheat, precipitation can only meet 25–40% of its water requirements (Fang et al., 2010). Most potential DCS areas are located in arid or semi-arid regions with scarce water resources, necessitating increased groundwater extraction, which further exacerbates environmental degradation. Additionally, terrain and economic factors are significant constraints to altering cropping structures. Currently, China is still dominated by small-scale farming, and the fragmentation of arable land, combined with the mountainous and hilly terrain in the study region, hinders the operation of large agricultural machinery. Moreover, the need to keep food prices within reasonable limits for social stability has led to more farmers seeking work outside agriculture. Our results indicate that in most areas of Gansu and Shaanxi, when accounting for maximum yield, the yield and net income increase from DCS can exceed 4,000 kg ha−1 and 700 USD ha−1, respectively. These regions benefit the most from climate change, and the increase in yield and income is a significant driving force for altering the cropping structure. Nonetheless, altering the cropping structure is a complex challenge involving social, economic, and environmental factors. Further studies are necessary to determine the optimal cropping system at the national level.
4.3 Limitations and future works
The ordinary kriging method was employed for spatial interpolation of meteorological data. However, due to the uneven distribution of meteorological stations and the variations caused by topography, this interpolation may introduce discrepancies, which could ultimately result in uncertainties in the simulation outcomes (Shen et al., 2014; Shen et al., 2018; Wang et al., 2016). Furthermore, this study primarily utilized ATT0 and temperature constraints to determine potential DCS areas. However, this process did not comprehensively account for the growing degree days and actual growth cycles of different crops. Such simplification may lead to overlapping growth periods for winter wheat and summer maize (Figures A1, A3), affecting crop growth and yield. Additionally, given the varying temperature and growth requirements of different crops, using only ATT0 and temperature constraints for regional delineation might not adequately capture the optimal planting times and growth environments for the crops. This, to some extent, constrains the accuracy and applicability of the study’s findings. Nevertheless, in this study, we compared the performance of various crop varieties and planting dates, thus providing useful guidance for local DCS field management. In future research, we will incorporate various cropping system models to accurately determine potential DCS areas. Additionally, we will synthesize local climate data with actual planting conditions to implement a series of adjustments to field management, considering various optimization objectives.
5 Conclusion
We identified the areas potentially suitable for DCS in northern China and evaluated the effects of various crop management conditions on yield, IR, and net income. The total potential DCS area in northern China (31.51 × 10⁴ km2) was discovered to be distributed among Gansu, Shaanxi, Shanxi, Hebei, and Liaoning provinces. Winter wheat and summer maize varieties with early or mid-early maturation are likely to be selected for cultivation in the potential DCS areas to ensure a normal phenological cycle and high yield. The sowing date was found to be dependent on the actual local climate conditions and planting purposes; however, the sowing dates corresponding to the maximum WUEs of the crops were later than those corresponding to the maximum yields. Generally, under maximum yield and WUE conditions in potential DCS areas, DCSs increase the unit total yield and net income compared with SCSs. However, this increase is accompanied by an increase in IR and a decrease in WUE. Gansu exhibited the maximum increase in crop yield, and Shanxi and Hebei exhibited the largest increase in IR.
Data availability statement
The datasets presented in this study can be found in online repositories. The names of the repository/repositories and accession number(s) can be found in the article/Supplementary material.
Author contributions
XW: Conceptualization, Formal analysis, Methodology, Writing – original draft. JWa: Writing – review & editing, Data curation, Validation. JWu: Resources, Visualization, Writing – original draft.
Funding
The author(s) declare that financial support was received for the research, authorship, and/or publication of this article. This work was supported by the National Natural Science Foundation of China (no. 32060301), Gansu Education Science and Technology Innovation Fund Project (no. 2022B-223), Gansu natural science foundation (no. 20JR5RA002), and Discipline Construction Project of Lanzhou City University.
Conflict of interest
The authors declare that the research was conducted in the absence of any commercial or financial relationships that could be construed as a potential conflict of interest.
Publisher’s note
All claims expressed in this article are solely those of the authors and do not necessarily represent those of their affiliated organizations, or those of the publisher, the editors and the reviewers. Any product that may be evaluated in this article, or claim that may be made by its manufacturer, is not guaranteed or endorsed by the publisher.
Supplementary material
The Supplementary material for this article can be found online at: https://www.frontiersin.org/articles/10.3389/fsufs.2024.1441396/full#supplementary-material
Footnotes
3. ^https://www.ecmwf.int/en/forecasts/dataset/ecmwf-reanalysis-v5
5. ^https://www.fao.org/statistics/data-dissemination/agrifood-systems/en
References
Allen, R., Pereira, L. S., Raes, D., and Smith, M. (1998). Crop evapotranspiration: Guidelines for computing CropWater requirements-irrigation and drainage paper 56. Rome: Food and Agriculture Organization of the United Station.
Ben Hassen, T., and El Bilali, H. (2022). Impacts of the Russia-Ukraine war on global food security: towards more sustainable and resilient food systems? Foods 11:2301. doi: 10.3390/foods11152301
Brunet, P., Clément, R., and Bouvier, C. (2010). Monitoring soil water content and deficit using electrical resistivity tomography (ERT) – a case study in the Cevennes area, France. J. Hydrol. 380, 146–153. doi: 10.1016/j.jhydrol.2009.10.032
Carter, T. R., Saarikko, R. A., and Niemi, K. J. (1996). Assessing the risks and uncertainties of regional crop potential under a changing climate in Finland. AFSci 5, 329–350. doi: 10.23986/afsci.72750
Ceglar, A., Van der Wijngaart, R., Wit, A., Lecerf, R., Boogaard, H., Seguini, L., et al. (2019). Improving WOFOST model to simulate winter wheat phenology in Europe: evaluation and effects on yield. Agric. Syst. 168, 168–180. doi: 10.1016/j.agsy.2018.05.002
Chen, X., Chen, F., Chen, Y., Gao, Q., Yang, X., Yuan, L., et al. (2013). Modern maize hybrids in Northeast China exhibit increased yield potential and resource use efficiency despite adverse climate change. Glob. Chang. Biol. 19, 923–936. doi: 10.1111/gcb.12093
Chen, Y., and Lu, C. (2019). Future grain consumption trends and implications on grain security in China. Sustain. For. 11:5165. doi: 10.3390/su11195165
Chen, S., Zhang, X., Shao, L., Sun, H., Niu, J., and Liu, X. (2020). Effects of straw and manure management on soil and crop performance in North China plain. Catena 187:104359. doi: 10.1016/j.catena.2019.104359
Chen, J., Zhao, C., Jones, G., Yang, H., Li, Z., Yang, G., et al. (2022). Effect and economic benefit of precision seeding and laser land leveling for winter wheat in the middle of China. Artif. Int. Agric. 6, 1–9. doi: 10.1016/j.aiia.2021.11.003
Estrella, N., Sparks, T. H., and Menzel, A. (2007). Trends and temperature response in the phenology of crops in Germany. Glob. Chang. Biol. 13, 1737–1747. doi: 10.1111/j.1365-2486.2007.01374.x
Fan, Y., Wang, C., and Nan, Z. (2014). Comparative evaluation of crop water use efficiency, economic analysis and net household profit simulation in arid Northwest China. Agric. Water Manag. 146, 335–345. doi: 10.1016/j.agwat.2014.09.001
Fang, Q. X., Ma, L., Green, T. R., Yu, Q., Wang, T. D., and Ahuja, L. R. (2010). Water resources and water use efficiency in the North China plain: current status and agronomic management options. Agric. Water Manag. 97, 1102–1116. doi: 10.1016/j.agwat.2010.01.008
FAO (2002). World agriculture: Towards 2015/2030, Summary Report. Rome: Food and Agriculture Organization of the United Nations.
Gao, X., Cheng, W., Wang, N., Liu, Q., Ma, T., Chen, Y., et al. (2019b). Spatio-temporal distribution and transformation of cropland in geomorphologic regions of China during 1990–2015. J. Geogr. Sci. 29, 180–196. doi: 10.1007/s11442-019-1591-4
Gao, Z., Feng, H.-Y., Liang, X.-G., Zhang, L., Lin, S., Zhao, X., et al. (2018). Limits to maize productivity in the North China plain: a comparison analysis for spring and summer maize. Field Crop Res. 228, 39–47. doi: 10.1016/j.fcr.2018.08.022
Gao, J., Yang, X., Zheng, B., Liu, Z., Zhao, J., Sun, S., et al. (2019a). Effects of climate change on the extension of the potential double cropping region and crop water requirements in northern China. Agric. For. Meteorol. 268, 146–155. doi: 10.1016/j.agrformet.2019.01.009
Gocic, M., and Trajkovic, S. (2013). Analysis of changes in meteorological variables using Mann-Kendall and Sen's slope estimator statistical tests in Serbia. Glob. Planet. Chang. 100, 172–182. doi: 10.1016/j.gloplacha.2012.10.014
Guo, H., Li, S., Kang, S., Du, T., Tong, L., Hao, X., et al. (2020). Crop coefficient for spring maize under plastic mulch based on 12-year eddy covariance observation in the arid region of Northwest China. J. Hydrol. 588:125108. doi: 10.1016/j.jhydrol.2020.125108
He, L., Asseng, S., Zhao, G., Wu, D., Yang, X., Zhuang, W., et al. (2015). Impacts of recent climate warming, cultivar changes, and crop management on winter wheat phenology across the loess plateau of China. Agric. For. Meteorol. 200, 135–143. doi: 10.1016/j.agrformet.2014.09.011
He, L., Jin, N., and Yu, Q. (2020). Impacts of climate change and crop management practices on soybean phenology changes in China. Sci. Total Environ. 707:135638. doi: 10.1016/j.scitotenv.2019.135638
Ju, H., van der Velde, M., Lin, E., Xiong, W., and Li, Y. (2013). The impacts of climate change on agricultural production systems in China. Clim. Chang. 120, 313–324. doi: 10.1007/s10584-013-0803-7
Kang, S., Gu, B., Du, T., and Zhang, J. (2003). Crop coefficient and ratio of transpiration to evapotranspiration of winter wheat and maize in a semi-humid region. Agric. Water Manag. 59, 239–254. doi: 10.1016/S0378-3774(02)00150-6
Lehmann, N., Finger, R., Klein, T., Calanca, P., and Walter, A. (2013). Adapting crop management practices to climate change: modeling optimal solutions at the field scale. Agric. Syst. 117, 55–65. doi: 10.1016/j.agsy.2012.12.011
Liu, X., and Han, X. (1987). China’s multi-cropping. Beijing: Beijing Agricultural University Press.
Liu, Y., Lin, Y., Huo, Z., Zhang, C., Wang, C., Xue, J., et al. (2022). Spatio-temporal variation of irrigation water requirements for wheat and maize in the Yellow River Basin, China, 1974–2017. Agric. Water Manag. 262:107451. doi: 10.1016/j.agwat.2021.107451
Liu, B., Liu, L., Tian, L., Cao, W., Zhu, Y., and Asseng, S. (2014). Post-heading heat stress and yield impact in winter wheat of China. Glob. Chang. Biol. 20, 372–381. doi: 10.1111/gcb.12442
Liu, X., Mei, X., Li, Y., Zhang, Y., Wang, Q., Jensen, J. R., et al. (2009). Calibration of the Ångström–Prescott coefficients (a, b) under different time scales and their impacts in estimating global solar radiation in the Yellow River basin. Agric. For. Meteorol. 149, 697–710. doi: 10.1016/j.agrformet.2008.10.027
Liu, Y., Zhang, J., and Ge, Q. (2021). The optimization of wheat yield through adaptive crop management in a changing climate: evidence from China. J. Sci. Food Agric. 101, 3644–3653. doi: 10.1002/jsfa.10993
Lv, Z., Liu, X., Cao, W., and Zhu, Y. (2013). Climate change impacts on regional winter wheat production in main wheat production regions of China. Agric. For. Meteorol. 172, 234–248. doi: 10.1016/j.agrformet.2012.12.008
Lv, S., Yang, X., Lin, X., Liu, Z., Zhao, J., Li, K., et al. (2015). Yield gap simulations using ten maize cultivars commonly planted in Northeast China during the past five decades. Agric. For. Meteorol. 205, 1–10. doi: 10.1016/j.agrformet.2015.02.008
Ma, S.-C., Wang, T.-C., Guan, X.-K., and Zhang, X. (2018). Effect of sowing time and seeding rate on yield components and water use efficiency of winter wheat by regulating the growth redundancy and physiological traits of root and shoot. Field Crop Res. 221, 166–174. doi: 10.1016/j.fcr.2018.02.028
McMaster, G. S., and Smika, D. E. (1988). Estimation and evaluation of winter wheat phenology in the central Great Plains. Agric. For. Meteorol. 43, 1–18. doi: 10.1016/0168-1923(88)90002-0
Montzka, C., Moradkhani, H., Weihermüller, L., Franssen, H.-J. H., Canty, M., and Vereecken, H. (2011). Hydraulic parameter estimation by remotely-sensed top soil moisture observations with the particle filter. J. Hydrol. 399, 410–421. doi: 10.1016/j.jhydrol.2011.01.020
Palosuo, T., Kersebaum, K. C., Angulo, C., Hlavinka, P., Moriondo, M., Olesen, J. E., et al. (2011). Simulation of winter wheat yield and its variability in different climates of Europe: a comparison of eight crop growth models. Eur. J. Agron. 35, 103–114. doi: 10.1016/j.eja.2011.05.001
Rötter, R. P., Palosuo, T., Kersebaum, K. C., Angulo, C., Bindi, M., Ewert, F., et al. (2012). Simulation of spring barley yield in different climatic zones of northern and Central Europe: a comparison of nine crop models. Field Crop Res. 133, 23–36. doi: 10.1016/j.fcr.2012.03.016
Sarwer, A., Hussain, M., Al-Muhtaseb, A. H., Inayat, A., Rafiq, S., Khurram, M. S., et al. (2022). Suitability of biofuels production on commercial scale from various feedstocks: a critical review. Chem. Bio. Eng. Rev. 9, 423–441. doi: 10.1002/cben.202100049
Shen, X., Liu, B., Li, G., Wu, Z., Jin, Y., Yu, P., et al. (2014). Spatiotemporal change of diurnal temperature range and its relationship with sunshine duration and precipitation in China. J. Geophys. Res. Atmos. 119, 13–163. doi: 10.1002/2014JD022326
Shen, X., Liu, B., and Lu, X. (2018). Weak cooling of cold extremes versus continued warming of hot extremes in China during the recent global surface warming hiatus. J. Geophys. Res. Atmos. 123, 4073–4087. doi: 10.1002/2017JD027819
Singh, D., Sharma, D., Soni, S. L., Sharma, S., Kumar Sharma, P., and Jhalani, A. (2020). A review on feedstocks, production processes, and yield for different generations of biodiesel. Fuel 262:116553. doi: 10.1016/j.fuel.2019.116553
Sosa, S., Rother, B., Mitra, P., Kim, D., Pierre, G., Fayad, D., et al. (2022). Tackling the global food crisis. IMF Notes 2022:1. doi: 10.5089/9798400221972.068
Su, S. L., Singh, D. N., and Shojaei Baghini, M. (2014). A critical review of soil moisture measurement. Measurement 54, 92–105. doi: 10.1016/j.measurement.2014.04.007
Sun, H., Zhang, X., Chen, S., Pei, D., and Liu, C. (2007). Effects of harvest and sowing time on the performance of the rotation of winter wheat–summer maize in the North China plain. Ind. Crop. Prod. 25, 239–247. doi: 10.1016/j.indcrop.2006.12.003
Sun, H., Zhang, X., Wang, E., Chen, S., Shao, L., and Qin, W. (2016). Assessing the contribution of weather and management to the annual yield variation of summer maize using APSIM in the North China plain. Field Crop Res. 194, 94–102. doi: 10.1016/j.fcr.2016.05.007
Sun, T., Zhao, C., Feng, X., Yin, W., Gou, Z., Lal, R., et al. (2021). Maize-based intercropping systems achieve higher productivity and profitability with lesser environmental footprint in a water-scarce region of Northwest China. Food Energy Secur. 10:260. doi: 10.1002/fes3.260
Wang, W., Lu, H., Yang, D., Sothea, K., Jiao, Y., Gao, B., et al. (2016). Modelling hydrologic processes in the Mekong River basin using a distributed model driven by satellite precipitation and rain gauge observations. PLoS One 11:e0152229. doi: 10.1371/journal.pone.0152229
Wang, J., Wang, E., Feng, L., Yin, H., and Yu, W. (2013). Phenological trends of winter wheat in response to varietal and temperature changes in the North China plain. Field Crop Res. 144, 135–144. doi: 10.1016/j.fcr.2012.12.020
Wang, S.-Y., Ward, R. W., Ritchie, J. T., Fischer, R. A., and Schulthess, U. (1995). Vernalization in wheat I. A model based on the interchangeability of plant age and vernalization duration. Field Crop Res. 41, 91–100. doi: 10.1016/0378-4290(95)00006-C
Wang, H., Zhang, X., Yu, X., Hou, H., Fang, Y., and Ma, Y. (2018). Maize–fababean rotation under double ridge and furrows with plastic mulching alleviates soil water depletion. Agric. Water Manag. 207, 59–66. doi: 10.1016/j.agwat.2018.04.033
Wang, Y., Zhang, Y., Zhang, R., Li, J., Zhang, M., Zhou, S., et al. (2018). Reduced irrigation increases the water use efficiency and productivity of winter wheat-summer maize rotation on the North China plain. Sci. Total Environ. 618, 112–120. doi: 10.1016/j.scitotenv.2017.10.284
Wit, A., Boogaard, H., Fumagalli, D., Janssen, S., Knapen, R., van Kraalingen, D., et al. (2019). 25 years of the WOFOST cropping systems model. Agric. Syst. 168, 154–167. doi: 10.1016/j.agsy.2018.06.018
Wu, D., Fang, S., Li, X., He, D., Zhu, Y., Yang, Z., et al. (2019). Spatial-temporal variation in irrigation water requirement for the winter wheat-summer maize rotation system since the 1980s on the North China plain. Agric. Water Manag. 214, 78–86. doi: 10.1016/j.agwat.2019.01.004
Wu, J., Gu, Y., Sun, K., Wang, N., Shen, H., Wang, Y., et al. (2023). Correlation of climate change and human activities with agricultural drought and its impact on the net primary production of winter wheat. J. Hydrol. 620:129504. doi: 10.1016/j.jhydrol.2023.129504
Wu, J., Nan, W., Hong-zheng, S., and Xiao-yi, M. (2022). Spatial–temporal variation of climate and its impact on winter wheat production in Guanzhong plain, China. Comput. Electron. Agric. 195:106820. doi: 10.1016/j.compag.2022.106820
Wu, D., Yu, Q., Lu, C., and Hengsdijk, H. (2006). Quantifying production potentials of winter wheat in the North China plain. Eur. J. Agron. 24, 226–235. doi: 10.1016/j.eja.2005.06.001
Xiao, L., Liu, L., Asseng, S., Xia, Y., Tang, L., Liu, B., et al. (2018). Estimating spring frost and its impact on yield across winter wheat in China. Agric. For. Meteorol. 260-261, 154–164. doi: 10.1016/j.agrformet.2018.06.006
Xiao, D., and Tao, F. (2014). Contributions of cultivars, management and climate change to winter wheat yield in the North China plain in the past three decades. Eur. J. Agron. 52, 112–122. doi: 10.1016/j.eja.2013.09.020
Xiao, D., Tao, F., Liu, Y., Shi, W., Wang, M., Liu, F., et al. (2013). Observed changes in winter wheat phenology in the North China plain for 1981-2009. Int. J. Biometeorol. 57, 275–285. doi: 10.1007/s00484-012-0552-8
Xu, J., Cai, H., Wang, X., Ma, C., Lu, Y., Ding, Y., et al. (2020). Exploring optimal irrigation and nitrogen fertilization in a winter wheat-summer maize rotation system for improving crop yield and reducing water and nitrogen leaching. Agric. Water Manag. 228:105904. doi: 10.1016/j.agwat.2019.105904
Yang, X., Chen, F., Lin, X., Liu, Z., Zhang, H., Zhao, J., et al. (2015). Potential benefits of climate change for crop productivity in China. Agric. For. Meteorol. 208, 76–84. doi: 10.1016/j.agrformet.2015.04.024
Yin, L., Dai, X., and He, M. (2018). Delayed sowing improves nitrogen utilization efficiency in winter wheat without impacting yield. Field Crop Res. 221, 90–97. doi: 10.1016/j.fcr.2018.02.015
You, L., Rosegrant, M. W., Wood, S., and Sun, D. (2009). Impact of growing season temperature on wheat productivity in China. Agric. For. Meteorol. 149, 1009–1014. doi: 10.1016/j.agrformet.2008.12.004
Zhang, M., Dong, B., Qiao, Y., Shi, C., Yang, H., Wang, Y., et al. (2018). Yield and water use responses of winter wheat to irrigation and nitrogen application in the North China plain. J. Integr. Agric. 17, 1194–1206. doi: 10.1016/S2095-3119(17)61883-5
Zhang, L., Lu, D., Li, Q., and Lu, S. (2018). Impacts of socioeconomic factors on cropland transition and its adaptation in Beijing, China. Environ. Earth Sci. 77, 1–10. doi: 10.1007/s12665-018-7740-8
Zhao, Y., Chen, S., and Shen, S. (2013). Assimilating remote sensing information with crop model using ensemble Kalman filter for improving LAI monitoring and yield estimation. Ecol. Model. 270, 30–42. doi: 10.1016/j.ecolmodel.2013.08.016
Zhao, J., Han, T., Wang, C., Jia, H., Worqlul, A. W., Norelli, N., et al. (2020). Optimizing irrigation strategies to synchronously improve the yield and water productivity of winter wheat under interannual precipitation variability in the North China plain. Agric. Water Manag. 240:106298. doi: 10.1016/j.agwat.2020.106298
Keywords: climate change, crop management, double cropping, water use efficiency, yield
Citation: Wu X, Wang J and Wu J (2024) Responses of potential double cropping areas expansion and appropriate crop management practices to climate change in northern China. Front. Sustain. Food Syst. 8:1441396. doi: 10.3389/fsufs.2024.1441396
Edited by:
Xueru Zhang, Hebei University of Economics and Business, ChinaReviewed by:
Xiangjin Shen, Chinese Academy of Sciences (CAS), ChinaLiujun Xiao, Nanjing Agricultural University, China
Copyright © 2024 Wu, Wang and Wu. This is an open-access article distributed under the terms of the Creative Commons Attribution License (CC BY). The use, distribution or reproduction in other forums is permitted, provided the original author(s) and the copyright owner(s) are credited and that the original publication in this journal is cited, in accordance with accepted academic practice. No use, distribution or reproduction is permitted which does not comply with these terms.
*Correspondence: Xianzhong Wu, d3V4aWFuemhvbmdAbHpjdS5lZHUuY24=
 Xianzhong Wu
 Jinxiang Wang1
 Jiujiang Wu