 Mian Shamas Murtaza1,2
 Aysha Sameen3
 Abdur Rehman1
 Nuzhat Huma4Fatma Hussain5
 Shahzad Hussain6
 Ilaria Cacciotti7
 Sameh A. Korma8,9
 Salam A. Ibrahim10*
 Yong Kun Ma1*
- 1School of Food and Biological Engineering, Jiangsu University, Zhenjiang, China
- 2Department of Food Science and Technology, MNS University of Agriculture, Multan, Pakistan
- 3Department of Food Science and Technology, Government College Women University, Faisalabad, Pakistan
- 4National Institute of Food Science and Technology, University of Agriculture, Faisalabad, Pakistan
- 5Department of Chemistry, University of Agriculture, Faisalabad, Pakistan
- 6Department of Food Science and Nutrition, College of Food and Agriculture, King Saud University, Riyadh, Saudi Arabia
- 7Department of Engineering, INSTM RU, University of Rome “Niccolò Cusano”, Rome, Italy
- 8Department of Food Science, Faculty of Agriculture, Zagazig University, Zagazig, Egypt
- 9School of Food Science and Engineering, South China University of Technology, Guangzhou, China
- 10Food Microbiology and Biotechnology Laboratory, Food and Nutritional Science Program, North Carolina A&T State University, Greensboro, NC, United States
This study aimed to investigate the physiochemical properties, techno-functional attributes, and proteolytic impacts of incorporating different hydrocolloids as fat substitutes in low-fat cheddar cheese. The effects of hydrocolloids (gums) and dietary fiber, both individually and in combination, were studied for the production of low-fat cheddar cheese with the same textural and functional attributes as full-fat cheese. Physicochemical, techno-functional attributes, organic acid, and proteolysis analyses were performed at 0 and 90-day storage intervals. The results of different combinations were compared with positive (4% fat) and negative (2% fat) controls, and it was observed that using fat replacers improved the textural and functional properties of low-fat cheddar cheese. A significant difference was observed in the meltability and flowability of low-fat cheese samples with different analytes. The proteolysis pattern in low-fat cheese also differed from that of its full-fat counterpart. Three treatments were considered the best: T2 (guar gum at 0.45%), T6 (guar gum, inulin, and resistant starch at 33%), and T7 (all analytes at equal concentrations). The findings revealed that hydrocolloids notably improved the texture, meltability, and sensory characteristics of low-fat cheddar cheese. Additionally, SEM images revealed that the microstructure variations can be attributed to changes in the hydrocolloids water retention and fat content. The Pearson correlation coefficient revealed relationships between different functional properties, contributing to understanding how hydrocolloids as fat replacers impact the overall quality of low-fat cheddar cheese. This study offers useful information for the dairy sector to manufacture low-fat cheeses that have enhanced customer acceptance and provide nutritional advantages.
1 Introduction
Recently, there has been a rising need among consumers for healthier food options, particularly low-fat dairy products, due to the growing occurrence of diet-related health problems like obesity and cardiovascular diseases. According to Yousefi and Jafari (2019), the Food and Agriculture Organization projects a 22% increase in milk output by 2027. Approximately one-third of the global milk supply is dedicated to cheese production, indicating a significant presence of cheese-making around the world. According to statistical data, 22 million tons of cheese were produced worldwide in 2022 (Zhao et al., 2023). With about 1,400 types, cheeses represent one of the most varied categories of dairy products. They are grouped according to their chemical makeup, manufacturing method, texture, form, milk source, and ripening (Schädle and Büttner, 2023). Cheese is becoming more and more popular worldwide for several reasons, including its high nutritional content, diversity in flavor and texture, and usage in a wide range of recipes. As an example, Khanal et al. (2019b) documented a rise in the demand for fast-food items such as spaghetti, sandwiches, burgers, and pizza in the last four decades. This has led to an increased requirement for cheese in processed fast food and raw consumption. There is a vast list of milk preservation techniques that have been used and cheese-making is one of them since ancient times. The basic production process of cheese consists of two steps: coagulation and dehydration to remove whey, which concentrates milk’s fat and caseins (protein) by a factor of six to ten. Fundamentally, cheese is manufactured using only a couple of basic ingredients, such as milk, rennet, and culture, while carefully controlling the temperature for the coagulation and concentration processes (Bojovic and McGregor, 2023). In the process of manufacturing cheese, fat plays a crucial role as a plasticizer, softening the texture, decreasing the mechanical strength, and significantly contributing to the formation of the cheese’s flavor. According to Wen et al. (2021), fat contributes to cheese smoothness and fills gaps in the cheese protein network. Cheddar is a hard cheese that is made by adding culture to acidify the mixture, allowing proteases to form gels, and then concentrating the mixture. The occurrence of biochemical, microbiological, and metabolic pathways, such as lipolysis, glycolysis, and proteolysis, contributes to the distinctive flavor and texture of cheddar cheese. Cheddar cheese’s high content of saturated fatty acids can cause a number of issues, including memory loss, weight gain, obesity, arthritis, and high cholesterol, which can lead to cardiovascular issues. Thus, low-fat cheese is in demand due to consumer health concerns about less fat, sugar, calories, cholesterol, and changing lifestyle choices (Caputo et al., 2023). Although there are constant dietary recommendations to reduce fat intake in their diets, consumers are reluctant to sacrifice the flavor and practicality of food. The density of the protein network in low-fat cheese is significantly increased, leading to a reduction in the moisture-to-protein ratio and ultimately resulting in a firm texture in low-fat cheddar cheese (Zhang, 2022).
Moreover, problems resulting from fat reduction include weak protein-fat gel networks, firm, rubbery textures that do not break down during mastication, less flavor development, lower yield, and lower melting properties when compared to full-fat cheese (Khanal and Bansal, 2020). To produce low-fat cheese with qualities similar to those of its full-fat counterparts, different strategies, such as the employment of fat replacers, adjunct culture, and process modification, have been applied (Loh et al., 2021). Until now, according to our best knowledge, there is no commercially available low-fat cheddar cheese fortified with diverse hydrocolloid-based fat replacers.
Developing low-fat products is a challenging task, but in recent years, many researchers have shown a particular interest in using hydrocolloids as fat replacers (Paximada et al., 2021). Gums called hydrocolloids, such as xanthan gum, locust bean gum, modified starch, guar gum, pectin, and alginate, are employed as fat substitutes, have the capacity to suppress syneresis, regulate the rheology of water-based systems, and add moisture. These polysaccharides can alter the textural qualities, consolidate the structure, and increase the viscosity of dairy products like cheese (Rehman et al., 2024). The use of carbohydrate-based fat replacers can improve several functional aspects affected by reduced fat levels (Rehman et al., 2020b).
Xanthan gum is a heteropolysaccharide that is created when Xanthomonas campestris ferments carbohydrates; guar gum, commonly known as galacto-mannans, is a non-gelling neutral polysaccharide made up of a linear (1–4)-β-D-mannan backbone with variable amounts of side chains that is derived from the Cyamopsis tetragonolobus L seeds (Schädle and Büttner, 2023). Dietary fiber like inulin has the capacity to lower calorie content while endorsing prebiotic benefits and health-promoting qualities. It is widely employed in many food items at the industrial level to substitute fat and add bulk, and it can change the texture and organoleptic qualities of the product. Thus, inulin can be utilized to create texturized, symbiotic, and low-fat cheese products. Food processors and nutritionists are increasingly interested in resistant starch because it results in higher-quality, low-fat products and has physiological advantages. It is a mixture of starch and starch-degradation products that the small intestine is unable to absorb and is characterized by poor water-holding capacity, high shear, and temperature-resistant starch stability (Rehman et al., 2020a).
The goal of the current work was to develop low-fat cheddar cheese with qualities comparable to those of full-fat cheese in response to market demand for low-fat and low-calorie products. In order to achieve this goal, various combinations of hydrocolloids and dietary fiber, such as xanthan gum, guar gum, inulin, and resistant starch, were used as fat replacers.
2 Materials and methods
2.1 Raw materials and chemicals procurement
Raw buffalo milk was purchased from the local dairy farm to prepare cheddar cheese. The coagulating enzyme rennet (Chymosin; Chy-max, SACCO company) and the freeze-dried mesophilic starter cultures (Lactococcus lactis ssp. lactis and Lactococcus lactis ssp. Cremoris) were obtained from a local supplier of Chr. Hansen Ireland Ltd., Little Island Co. Cork, Ireland. All the chemicals and reagents utilized for this study were purchased from Sigma-Aldrich and Merck. Additionally, dietary fibers (inulin (with a degree of polymerization (DP) of 34–38) and resistant starch) and hydrocolloids (xanthan gum and guar gum) were procured from scientific stores. HPLC-grade reagents (Sigma Chemical Co., St. Louis, MO) were run as standards. A schematic diagram for the preparation of low-fat cheese is presented in Figure 1.
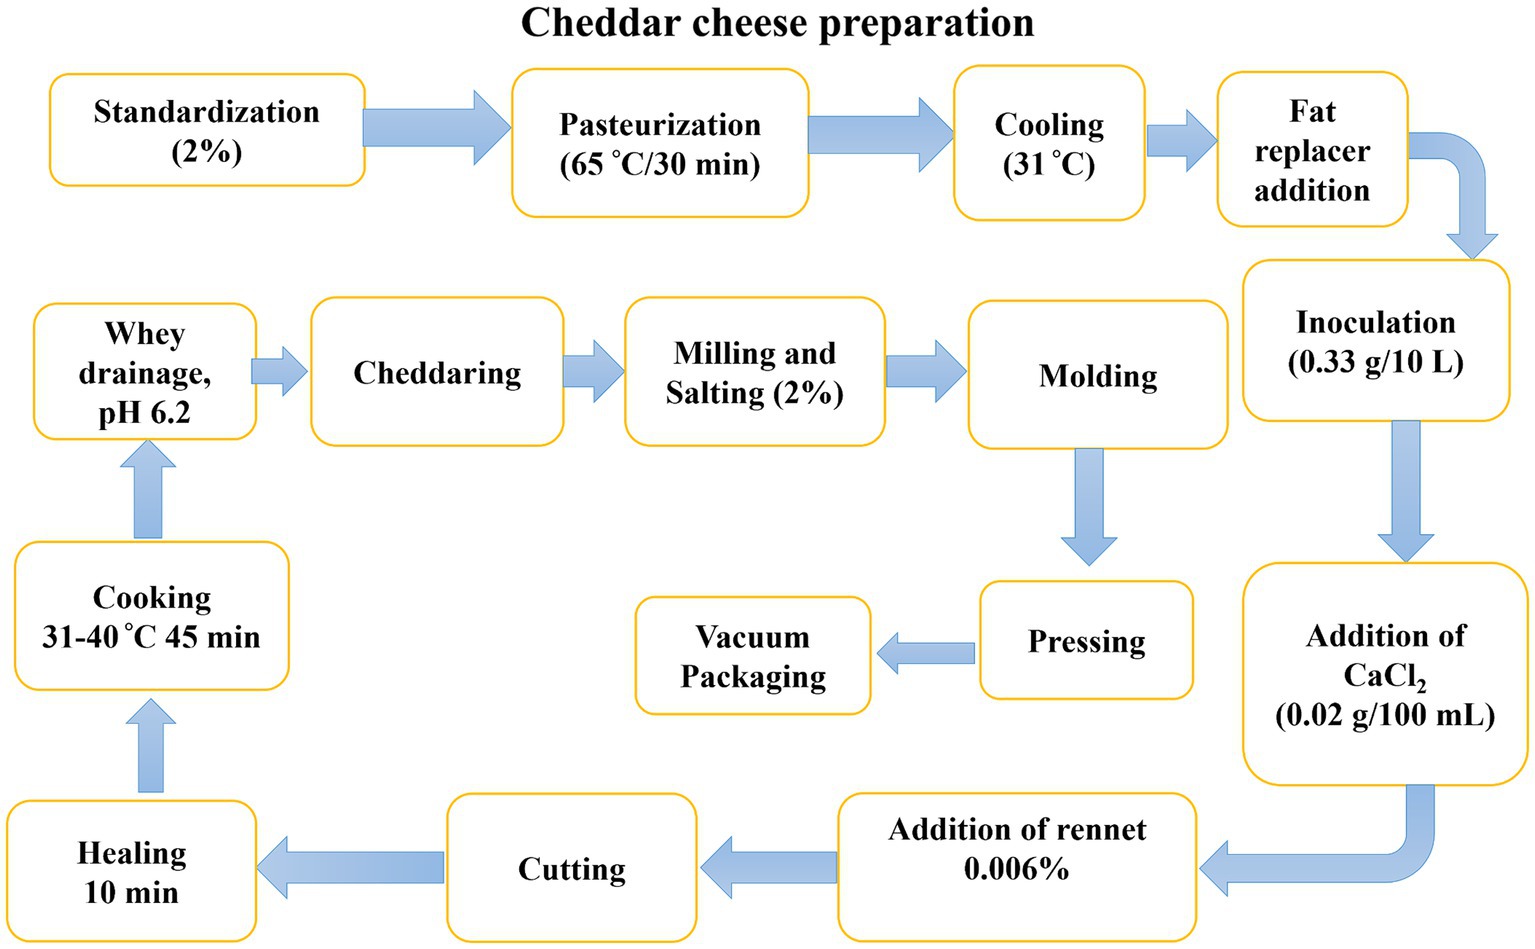
Figure 1. Flow diagram of the low-fat cheddar cheese preparation.
The optimization-based study conducted for this research was published (Murtaza et al., 2023). Based on our previous research (Murtaza et al., 2022), we selected the best hydrocolloid and dietary fiber treatments for the development of low-fat cheddar cheese, and further storage studies were conducted as indicated in Table 1.
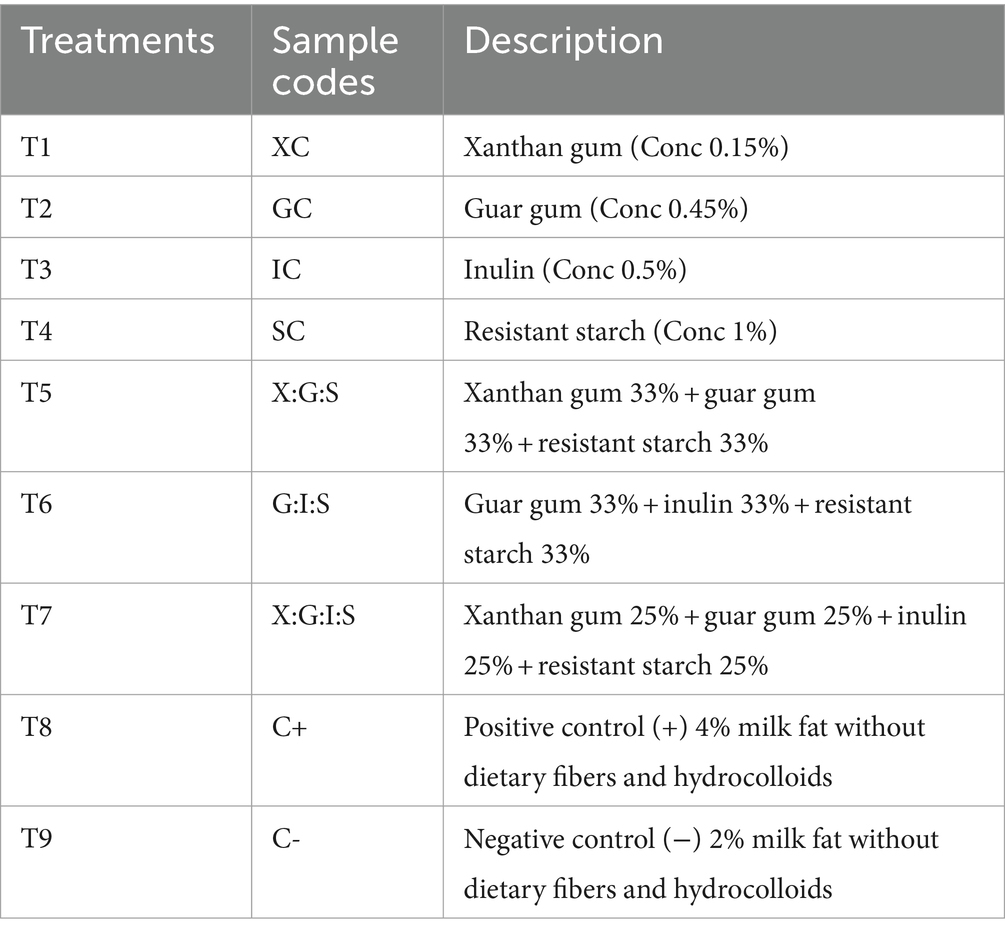
Table 1. Treatment plan of low-fat cheddar cheese with dietary fiber and hydrocolloids (gums).
2.2 Physiochemical analysis
The chemical composition of low-fat cheddar cheese was determined by adopting the methodology of Khanal et al. (2019a), including moisture content (vacuum oven, 925.10), fat content (Gerber technique, 989.05), protein content (Kjeldhal method, 2001.14), acidity content (titration method, 920.12), and pH of cheese with a pH meter (model HI99165, Hanna Instruments, Singapore).
2.3 Meltability
The meltability of the cheddar cheese samples was ascertained using the melted material length (mm) as the meltability index. Cheese samples (3 g each) were broken up into tiny pieces and squeezed using a plunger, and the length was measured with a digital Vernier caliper. After being kept in glass test tubes for 4 h at 4°C, the tubes were heated for 15 min at 110°C in a hot air oven (model no. SNOL 20/300 LFN) with warm air circulation. The melted material length was measured once more using a Vernier caliper (Zisu and Shah, 2007).
2.4 Flowability
The flowability of cheese was measured using the method described by Guinee et al. (2002), with slight amendments. The prepared cheese was cut into a disc with the required dimensions (45 mm in diameter and 6.5 mm in thickness) and heated for 4 min at 280°C. Finally, the increased diameter was measured.
2.5 Water activity
The amount of water that is available in equilibrium for hydrating materials is referred to as “water activity” (aw). The water activity of cheese samples was determined using an electronic water activity meter (Aqualab Series 3TE dewpoint, Decagon Devices, Inc., WA, United States). 5 g of grated cheese samples were incubated at 23°C, and the reading was recorded as water activity (Rulikowska et al., 2013).
2.6 Textural profile
The texture profile of cheddar cheese was evaluated using the Texture Analyzer (Stable Micro Systems, Godalming, Surrey, United Kingdom). Samples were placed for 18 h at 8°C before analysis. The samples were cut into 25-mm cubes and kept at 8°C for an additional 30 min in an incubator. The double compression was applied in two successive cycles at a rate of 1 mm/s, or 30% of their initial height (Zisu and Shah, 2007), with slighter modifications.
2.7 Proteolysis assessment
2.7.1 pH 4.6 soluble nitrogen
The homogenized cheese samples were mixed with a double amount of water to produce the slurry, kept for 30 min at room temperature, and then the pH was adjusted to 4.6 by using 1 N hydrochloric acid. The samples were immersed in a water bath for an hour at 40°C, and the pH was adjusted to 4.6. The samples were centrifuged at 4290 x for 30 min, and the supernatant was filtered using Whatman no. 113 filter paper. The nitrogen content was ascertained utilizing the Kjeldhal method of digestion, distillation, and titration (Hayaloglu, 2003).
2.7.2 Reverse phase HPLC analysis for proteolysis
The proteolysis was measured using the Verdini et al. (2004) method, with slight amendments, on the lyophilized insoluble fraction of cheddar cheeses (pH 4.6). 10 mg of each lyophilized sample were dissolved in 1.5 mL of trifluoroacetic acid (TFA/water) (50:50) and 0.5 mL of urea solution that was prepared by dissolving 48 g of urea, 1.3 g of sodium citrate, 2 g of Tris, and 300 μL of mercaptoethanol/100 mL. The mixed solution was filtered by a 0.2 μm filter (Fisher Scientific, Ireland), and the mixture (20 μL) was injected into the HPLC (Shimadzu, Japan), equipped with a Shim-pack CLC-ODS (C-18) column (Phenomenex, Macclesfield, Cheshire, United Kingdom), 4.6 mm × 250 cm, 5 μm (an SPD-10AV UV detector Shimadzu, Japan), and an LC-10AT pump (Shimadzu, Japan). The analysis was performed at room temperature, and the wavelength of detection was 214 nm. Further, 0.1% TFA in water and 0.1% TFA in acetonitrile were used as solvents A and B, respectively, in a gradient elution process with a flow rate of 1.0 mL min−1. Mobile phase B was set up with the following gradient flow: 25% B for 5 min, 35% B for 30 min, 50% B for 10 min, and an overall isocratic step at 50% for 5 min with an initial composition of 0% B.
2.8 Microstructure of cheddar cheeses
The microstructure of cheddar cheese was assessed using scanning electron microscopy (SEM), following the approach outlined by Șanlı et al. (2011). Cheese samples were prepared by cutting them into 1 × 1 × 10 mm dimensions. These samples were placed at 7°C for 48 h in glutaraldehyde (2.8 g/100 g) that was prepared with a sodium phosphate buffer (0.05 mol/L) (pH 6). The fixed cheese samples were dried in a series of graduated ethanol concentrations of 25, 50, 75, and 100/100 mL for 15 min. Subsequently, the samples were subjected to defatting for 15 min using chloroform. The defatted samples were dipped in pure ethanol three times for 15 min each to remove the fat content on the outer surface. Using carbon-based tape, the dried and fragmented cheese samples were placed on aluminum stubs and inspected under a 1.6 kV SEM.
2.9 Organic acids content
HPLC was used to measure the concentration of organic acids (citric, acetic, formic, lactic, pyruvic, and butyric acids) in cheese at different intervals such as 45 and 90 days of ripening. Some modifications were made in the method described by Akalin et al. (2002). The reverse-phase Skim-Pack C18 (LC) column was used and all the solvents and solutions were filtered with 0.45-μm membrane filter (Sartorious SM 11606). The mobile phase was an aqueous solution containing 0.5% (wt./vol.) (NH4)2HPO4 (0.038 M) and 0.2% (vol./vol.) acetonitrile (0.049 M) that was adjusted at pH 2.24. 7 g sample was mixed with 70% methanol and centrifuged for 5 min at 6000 rpm for extraction of supernatant, which was filtered with 0.45-μm and injected in HPLC sample tubes. The liquid chromatograph (LC-10 AT VP Series) was fitted with an UV–VIS detector (SPD-10AVP) and a system controller injector (SCL-10AVP) having a 20 μL sample loop. The selected wavelength of detector was set at 214 nm. The flow rate was set at 0.5 mL/min and the column at room temperature.
2.10 Statistical analysis
The acquired data from various parameters were statistically analyzed using SAS analysis and two-factor factorial completely randomized design (CRD) with analysis of variance technique (ANOVA) to individually check the variation during the storage period and among the applied treatments. Pearson’s correlation (using XLSTAT-2016 V1.0 Software) was employed to investigate the correlation between several techno-functional attributes of low-fat cheddar cheese.
3 Results and discussion
3.1 Proximate composition parameters
The most important proximate composition component for cheeses is moisture, which influences all other parameters and processes, contributes softness and other qualitative qualities, and serves as a reactant in multiple reactions. The evaluation of moisture content is not only essential for understanding the final product standards, but variations in moisture also impact cheese’s shelf life, texture, and functional qualities (Khanal and Bansal, 2020). It is clearly depicted in Table 2 that the T2 sample, containing guar gum, had the highest moisture content (45.36%), whereas the T8 sample (positive control) had the lowest moisture content (39.19%). The differences between T1, T2, T3, T4, T5, T6, and T7 samples were not statistically significant. However, all of the cheese samples presented significantly higher moisture than the T8 sample (positive control), due to the hydrocolloid’s ability to bind water and retain moisture. During the 90-day storage period, a decline in the moisture value was detected for all treatments (Table 2). The decrease in the moisture value that occurred as cheddar cheese ripened might be due to the fact that the water becomes chemically bonded during the ripening process. However, fat replacers based on polysaccharides, such as xanthan gum, guar gum, carrageenan, alginate, sodium, and β-glucan, can mechanically trap the water and prevent casein-casein crosslinks through either segregative or associative interactions (hydrogen bonds, electrostatic interactions, or hydrophobic interactions) between the polysaccharide and casein. This ultimately leads to increased moisture content, a softer texture, better lubricant, and creaminess in low-fat cheese (Ouyang et al., 2022). According to Khanal et al. (2020), the sodium alginate served as a filler particle in the protein matrix and raised the water content due to its high capability to entrap water. As a result, the sodium alginate modified low-fat cheddar cheese presented a texture, coefficient of friction, and sensory qualities that were similar to full-fat cheese control. Our experimental evidence was also consistent with those of Nateghi et al. (2012), who found that certain ingredients, such as sodium caseinate and xanthan gum, raise the cheddar cheese protein content and moisture, most likely because of their hygroscopic qualities. Similar effects on the fresh cheese moisture contents with varying starch levels were previously found by Diamantino et al. (2014).
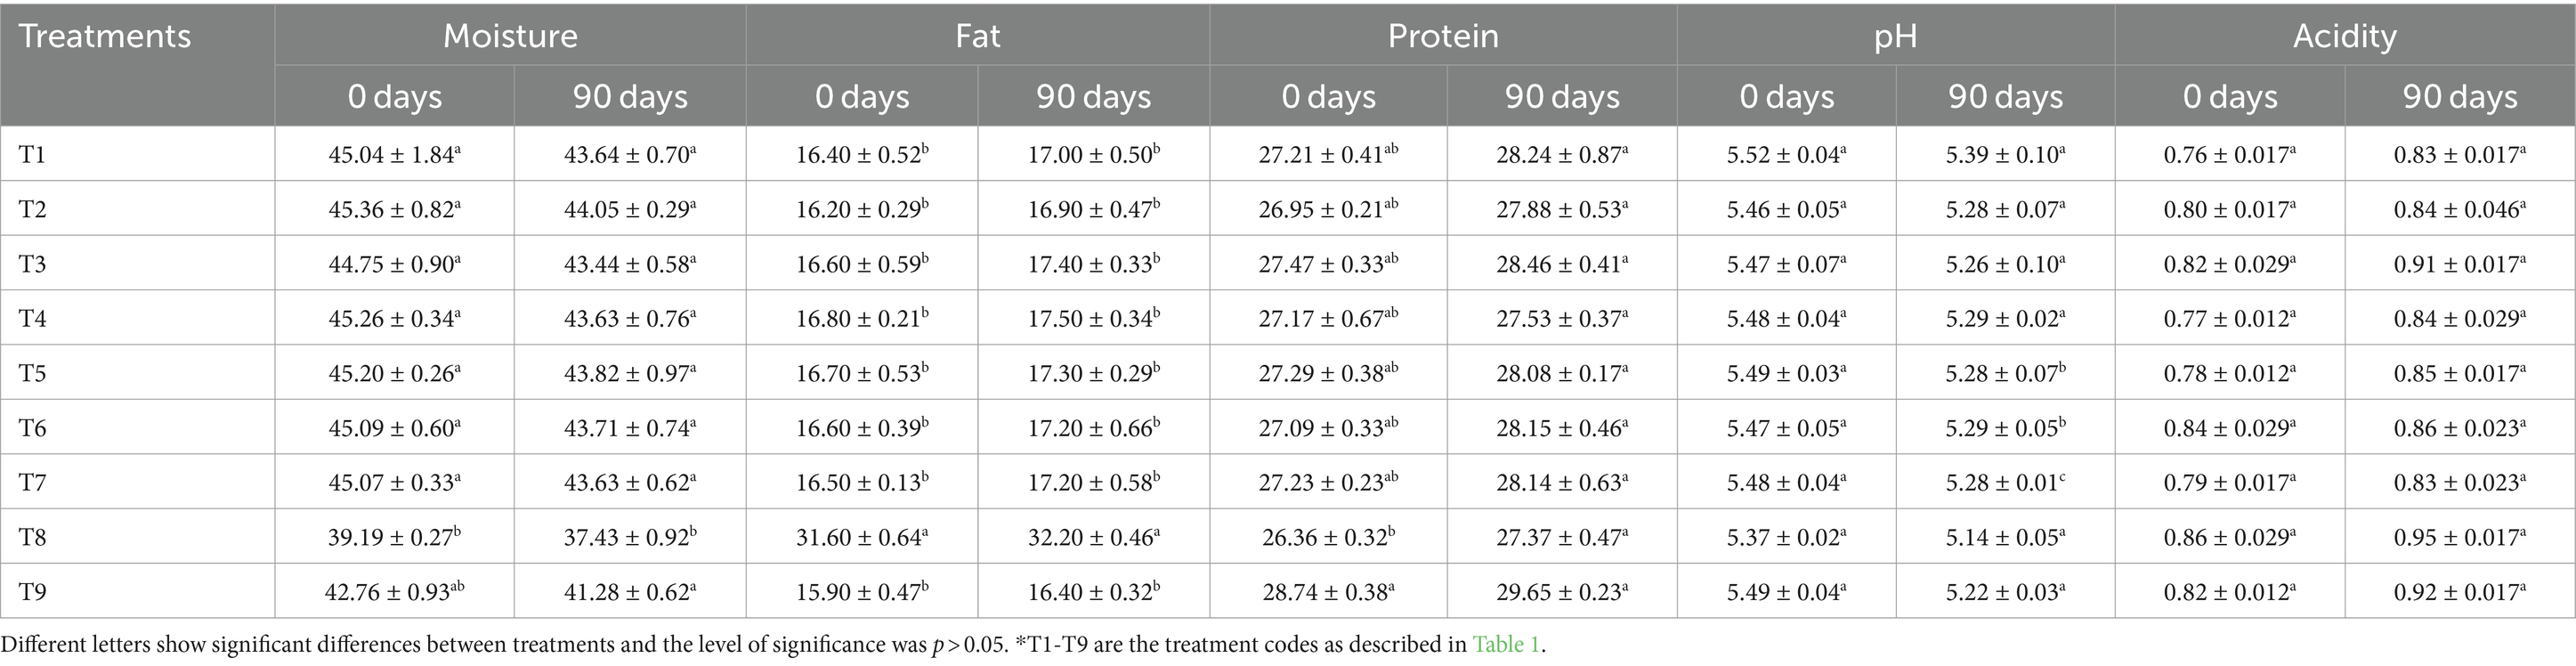
Table 2. Effect of dietary fiber and hydrocolloids on the low-fat cheddar cheese proximate composition parameters (i.e., moisture, fat, protein), pH, and acidity during ripening.
The flavor of cheddar cheese is significantly influenced by its fat content, which is another critical proximate composition parameter (Hassan et al., 2013). According to Table 2, the cheese prepared as a negative control (T9) with 2% milk fat had the lowest fat content (15.90%), while the cheese created as a positive control (T8) with 4% milk fat had the maximum fat content (32.20%). With the exception of the positive control (T8), all of the treatments demonstrated substantial differences. The low-fat cheese samples showed a higher fat content compared to the negative control (T9), which can be attributed to the hydrocolloids’ fat retention ability (Nateghi et al., 2012). The guar gum incorporation could also be responsible for this experimental evidence, as the high galactose concentration of guar gum results in its nearly complete dispersion and swelling, which aids in the retention of hydration and fat in the cheese (Saha and Bhattacharya, 2010). The addition of guar gum to cheese milk is believed to slow down the curd syneresis process, which in turn helps to retain more milk fat globules within the cheese matrix (Ghaderi-Ghahfarokhi et al., 2020).
The protein level has a significant impact on the stretching and melting properties of various cheese varieties. In Table 2, it can be observed that the positive control (T8) exhibited the lowest protein quantity, measuring at 26.36%. On the other hand, the negative control (T9) had the largest protein amount, measuring 29.65%. Noticeable disparities have been noted between the positive and negative controls in comparison to low-fat cheese with various analytes. The findings of this study align with those of Castillo et al. (2006), who discovered that excessive proteolysis in curd led to the degradation of the protein network and an increase in nitrogenous compound synthesis. The concentrations of all amino acids, particularly tryptophan, tyrosine, soluble nitrogen, total nitrogen, non-protein nitrogen, and volatile fatty acids, increased during the cheese’s ripening phase. Similarly, Moghiseh et al. (2021) also revealed that reducing fat levels increased the total protein and moisture contents; however, manipulating cheese’s fat content can alter the proportion of fat to casein.
3.2 pH and acidity
pH is one of the most important factors considered when evaluating the quality of cheese; it also affects the aggregation and enzymatic stages of milk coagulation, as well as the clotting of milk rennet (Rolet-Répécaud et al., 2013). The results depicted in Table 2 clearly show that the positive control (T8) had the lowest pH (5.14) at 90 days of storage, while the cheese (T1) had the highest pH (5.52) at 0 day. The differences between T2, T5, and T7, as well as between T3, T6, and T9, were not found to be significant. Additionally, all cheese samples had higher pH values compared to the positive control (T8). The pH values obtained in this investigation are consistent with the findings of Papetti and Carelli (2013), who reported pH ranges from 5.58 to 5.12. The pH value was observed to decrease from 5.49 to 5.14 after a storage period of 90 days (Table 2). The pH change during ripening may be attributed to variations in enzyme activity (proteases) and starter culture (bacterial culture) during storage, along with the buffering capacity of milk ions and gum. The pH decline in cheese is primarily caused by lactose fermentation, where lactic acid bacteria produce lactic acid, as well as fat deterioration during the ripening process (Widyastuti and Febrisiantosa, 2014). Moreover, the cheese composition is greatly affected by the rate of acid formation, particularly in terms of moisture content. Therefore, the acidity of cheese plays a crucial role in determining its overall quality and flavor. Table 2 clearly shows that the positive control (T8) had the highest acidity level (0.95) after 90 days of storage, while the cheese (T1) had the lowest acidity level (0.76%) at the beginning of the storage period. After 90 days of ripening, the acidity content for all treatments increased from 0.77% at 0 days to an average of 0.95% (Table 2). The increase in acidity during the ripening period is attributed to the proliferation of lactic acid bacteria and the production of lactic acid. This not only enhances the flavor of the cheese but also helps to preserve it from microbial deterioration and strengthen its structure. In addition, during the early ripening phases, lactate is released. This compound plays a crucial role in triggering various processes such as oxidation, racemization, and microbial metabolism. As a result, the cheese’s acidity undergoes changes during later stages of storage (Biegalski and Cais-Sokolińska, 2023). The variation in acidity caused by the starting cultures may be attributed to the different gum ratios of acid production to salt tolerance (Gholamhosseinpour et al., 2018).
3.3 Meltability and flowability
The quality of cheddar cheese is strongly influenced by its meltability (the range in which melted cheese flows and spreads when heated), determining its usefulness on the basis of the customer’s needs and claims. Indeed, the homogeneous melting quality of cheese is a desirable attribute for consumer acceptance. The cheese sample T6 had the highest meltability index (68.10 mm) at 90 days, whereas the negative control (T9) had the lowest (51.80 mm). In comparison to the positive control (T8), the cheese samples T2, T4, T5, T6, and T7 showed greater meltability (Table 3). The study conducted by Abbasi and Nateghi (2022) revealed that the low-fat cheese, made with 4.5% starch and 6% fat content, exhibited similar meltability, acidity, elasticity, hardness, flavor, and texture as its full-fat counterparts. After 90 days of storage, the average meltability value for all treatments increased compared to the initial measurement at 0 day. The current study confirms the results of Abdeldaiem and Blassy (2019), who discovered that low-fat mozzarella cheese becomes more meltable as it ages. The authors suggest that proteins undergo degradation into free amino acids and short peptides during ripening, leading to changes in the protein matrix. The protein-peptide level can have an impact on the melt-and-slice qualities of cheddar cheese. Cheese flowability, a crucial factor in determining cheese quality, is affected by various factors such as casein hydration, fat coalescence degree, and fat liquefaction. Table 3 indicates that the cheese sample T6 had the highest flowability at 24.80%, while the negative control (T9) had the lowest value at 18.40%. All the other treatments showed significant differences from the negative control. The results align with the study conducted by Basiony and Hassabo (2022), which reported enhanced flowability in samples with hydrocolloid gums. In addition, after 90 days of storage, the average flowability for all treatments increased to 18.70% from 24.70% at 0 day, which aligns with the findings of Sheehan et al. (2005), wherein they observed a significant increase in cheese flowability during the ripening phase.
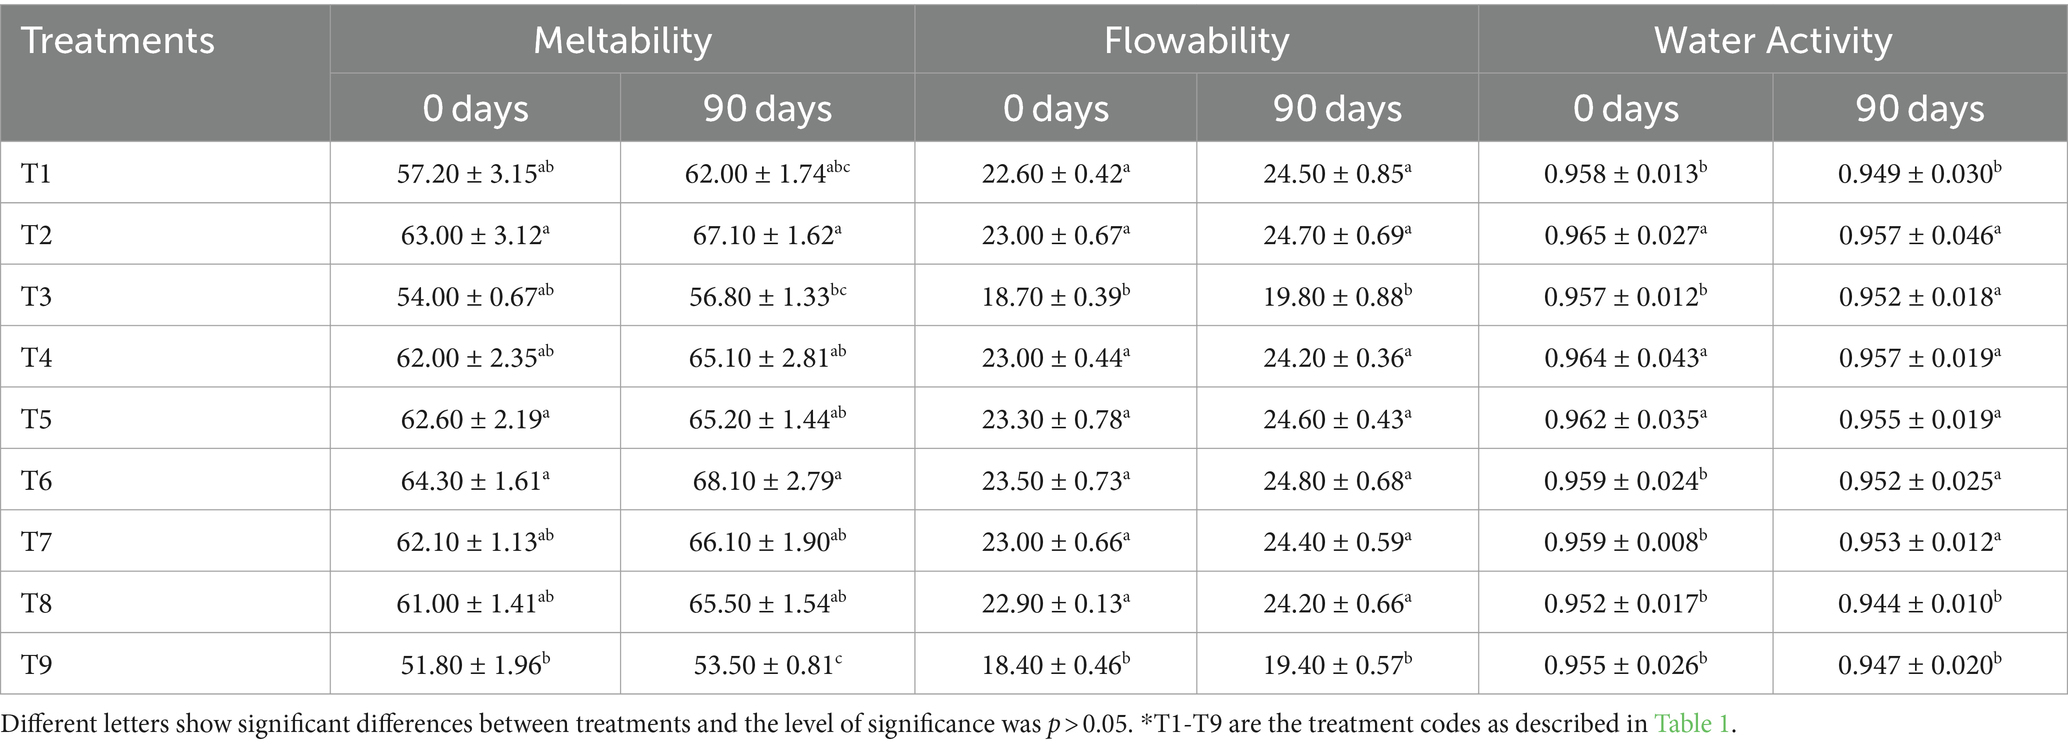
Table 3. Effect of dietary fiber and hydrocolloids on meltability, flowability, and water activity of low-fat cheddar cheese during ripening.
3.4 Water activity
The measured water activity values are presented in Table 3. At 0 day, the sample with guar gum (T2) had the highest water activity of 0.965, while the positive control (T8) had the lowest value of 0.944 at 90 days. The water activity in low-fat cheeses may be influenced by the way hydrocolloids trap water and reduce the force required to remove water from the curd (Liu et al., 2024). This phenomenon occurs when the rennet breaks down the kappa-casein, causing the previously hidden hydrophobic regions to become exposed and form a coagulated mass. As a result, the coagulation prevents water from escaping (Osorio-Arias et al., 2020). After 90 days of storage, the water activity value for all treatments decreased slightly from 0.96 to 0.944. The current study’s findings align with previous research conducted by El-Nimr et al. (2010) on Egyptian Gouda cheese and its ripening process.
3.5 Texture properties
The texture of cheese, which is derived from a combination of its physical and chemical properties that determine its sensory aspects, is the most important feature that defines its identity and quality (Borges et al., 2020). Thus, several characteristics, including springiness, hardness, chewiness, cohesiveness, and gumminess, were examined in the textural analysis. From the data in Table 4, the negative control (T9) had the highest hardness (1493.5 g), followed by the T3 (1474.1 g), whereas the T4 had the lowest value (1154.5 g). The distinction between T2 and T8 was not statistically significant. T5, T6, and T4 presented lower hardness values than the positive control (T8) because of their higher moisture content, which is associated with the hydrocolloid’s ability to bind and hold water. Thus, the hardness reduction in cheese samples containing hydrocolloids was most likely caused by changes in the protein matrix compactness (Borges et al., 2020). Moghiseh et al. (2021) discovered similar outcomes with low-fat mozzarella cheese. When compared to its low-fat control, mozzarella cheese produced with modified corn starch as a fat substitute had less firmness. In a texture examination, Al-Zarfy and Al-Bedrani (2022) reported that the cheese samples containing 1.5% gum acacia had harder texture values than the negative control sample. In similar works, using alginates as a fat replacer allowed to obtain a significantly soft texture and less gummy and chewy samples due to the alginate’s ability to hold water, increase cheese moisture, and form in situ gel-like particles when CaCl2 is present in cheese milk, leading to a decreased hardness (Paximada et al., 2021). Concerning the influence of the storage period, after 90 days of ripening, the hardness value for all treatments significantly decreased (Table 4). The values of hardness, chewiness, and gumminess were higher in the negative control at each ripening stage when compared to the full-fat cheese (positive control).
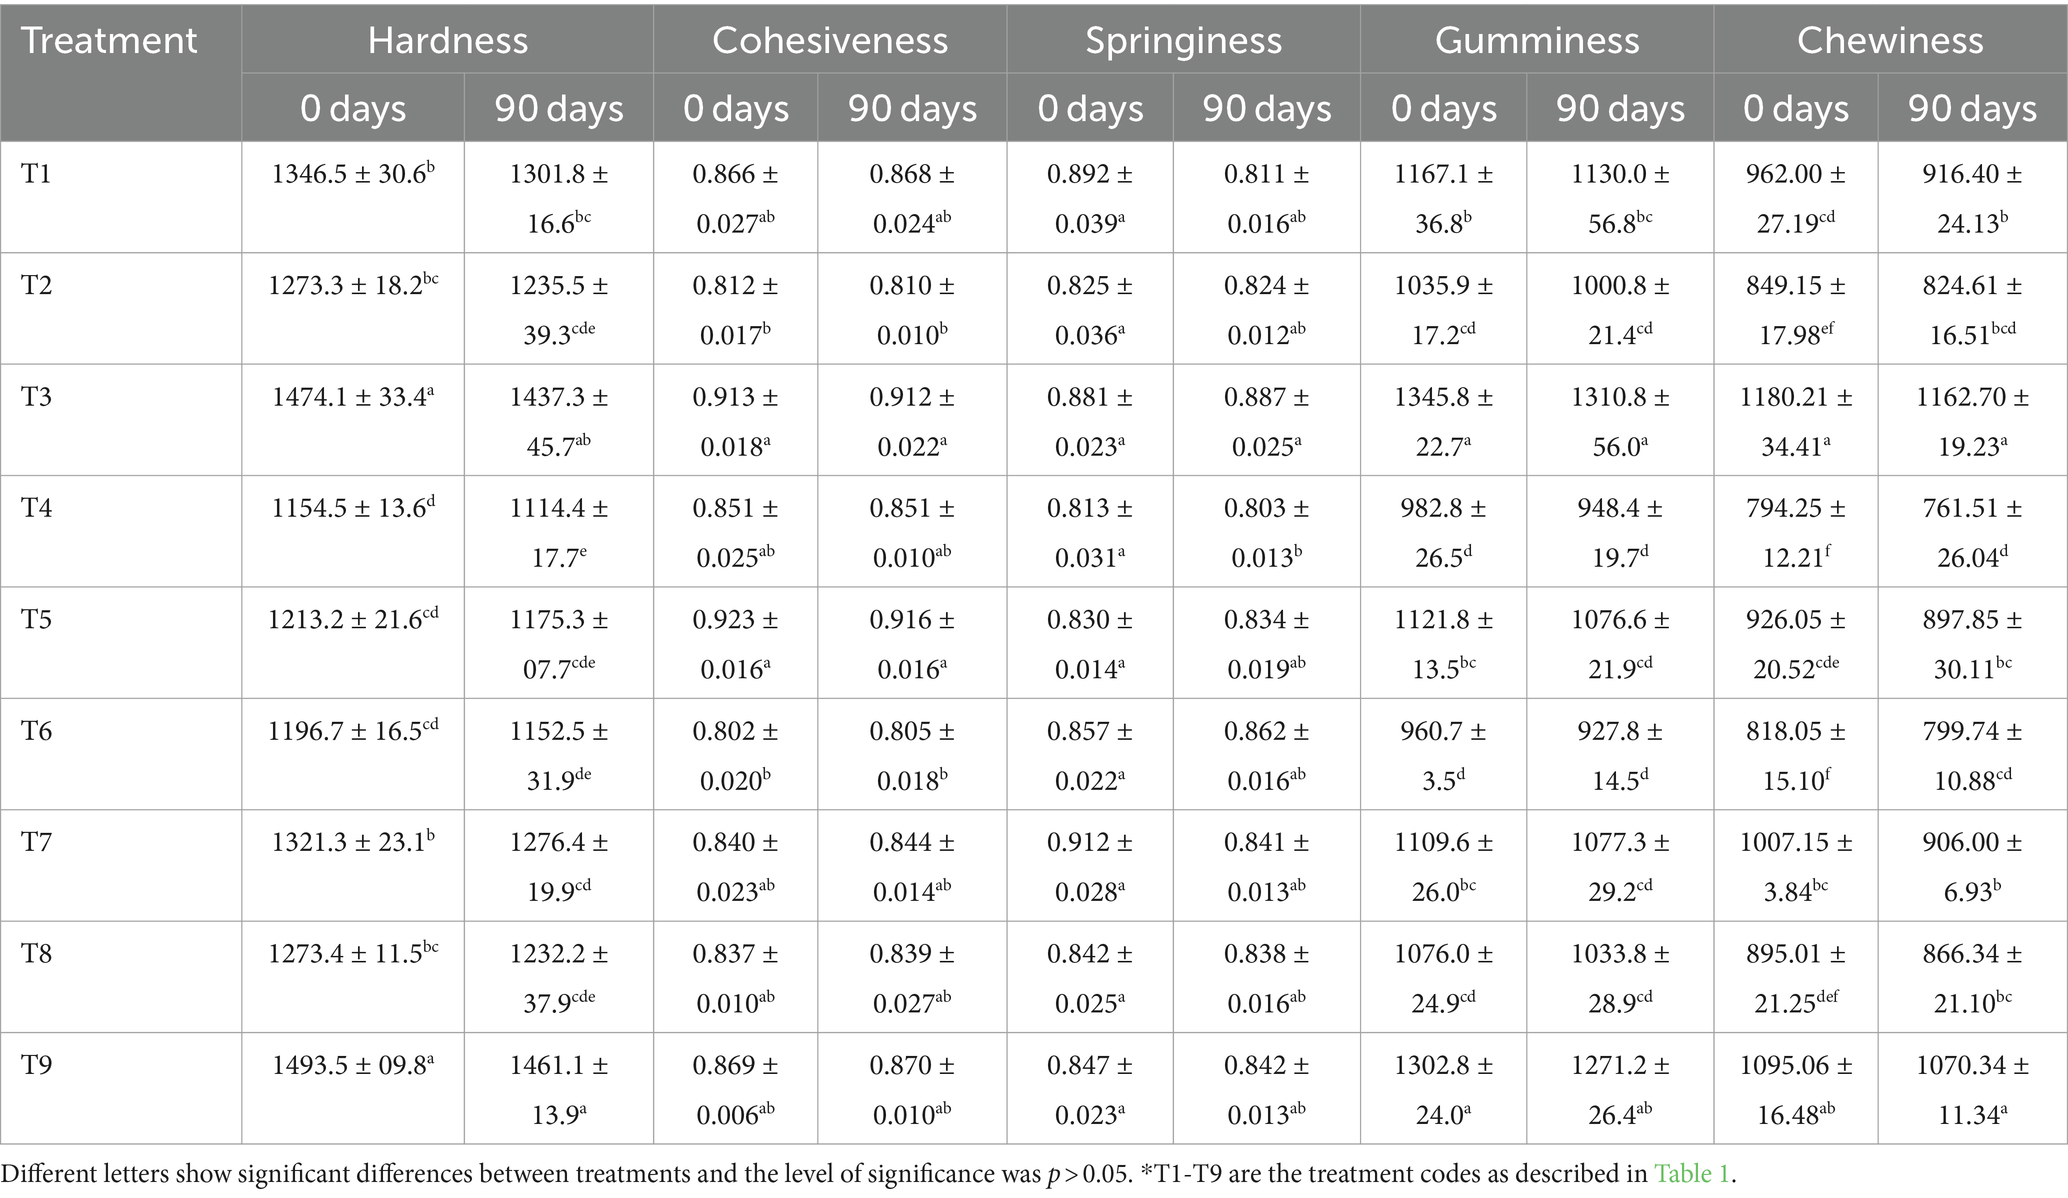
Table 4. Texture analysis effect of dietary fiber and hydrocolloids on textural parameters of low-fat cheddar cheese during ripening.
Regarding the cheese’s consistency, which is determined by how easily a sample crumbles, cohesion refers to the internal bond strength required to give the product its structure. Interestingly, T6 exhibited the lowest cohesion with a value of 0.802, while T5 demonstrated the highest cohesiveness with a value of 0.923 (Table 4). The findings of this investigation align with the study conducted by Borges et al. (2020), where various fat substitutes were employed to assess the cohesiveness of low-fat mozzarella cheese, yielding values ranging from 0.80 to 0.95. The cohesiveness of cheese increases when there is a decrease in cheese proteolysis, indicating an inverse relationship between these two factors. Although the presence of gums may affect the texture of low-fat cheeses, the reduction in fat content actually enhances it (Basiony and Hassabo, 2022).
Concerning the springiness, which consists in the ability of a sample to bounce back after multiple bites and can be regarded as the tacky feel that one gets while biting into a sample while eating (Paximada et al., 2021), T7 had the highest value (0.912) at 0 day, while T4 had the lowest (0.803) at 90 days of storage (Table 4). However, the cheese’s elasticity diminishes as it ripens due to the breakdown of the casein network via proteolysis (Basiony and Hassabo, 2022). According to Korish and Abd Elhamid (2012), a decrease in hardness, springiness, and chewiness is associated with increased moisture contents.
Moreover, the gumminess of the cheese samples was evaluated, taking into account that cheese hardness is correlated with gummy and chewy texture (Nishinari and Fang, 2018). The results showed that T3 had the highest gumminess (1345.8 g), followed by low-fat cheese without analyte (negative control) (1302.8 g), and that T6 had the lowest gumminess (960.7 g), together with T4 (982.8 g). At the end of the 90-day storage period, the gumminess for all the treatments significantly decreased as compared to the first day. Interestingly, T2, T4, and T6 exhibited less gumminess, being less hard than the positive control (T8). Chewiness is the amount of time needed to grind the sample to the point where it is ready to swallow and is correlated to its hardness. From the data in Table 4, T3 had the highest chewiness (1180.21 g), followed by low-fat cheese without analytes (negative control) (1095.06 g), and T4 had the least chewiness (794.25 g), followed by T6 (818.05 g). The interactions between polysaccharides and proteins, especially during proteolysis, are influenced by the types and charges of the polysaccharides. These interactions are essential for the formation of the product’s texture (Zhao et al., 2023). Protein and polysaccharide interactions such as volume, Van der Waals contacts, hydrogen bonds, hydrophobic interactions, electrostatic forces, covalent bonds, excluding ionic bridging, and polysaccharide linkages affect the ability of a substance to hold water and its overall texture (Zhang, 2022; Schädle and Büttner, 2023).
3.6 Proteolysis
Proteolysis, as stated by Orlyuk and Stepanishchev (2014), significantly contributes to the development of cheese flavor and taste by affecting changes in its structure. Several factors, such as plasmin induction to plasminogen, microbial culture, natural microflora in raw milk, ripening interval, industrialized procedures and technology, and ripening settings, contribute to proteolysis. Elevated proteolysis is induced by elevated temperature, increased rennet concentration, water activity in cheese, decreased salt content, and a favorable pH. As an example, Upreti et al. (2006) observed that the texture of cheddar cheese softens due to the breakdown of intact casein into small peptides and polypeptides that are soluble in water during the process of proteolysis. The process of proteolysis was carried out using two distinct approaches, mentioned in 3.6.1 and 3.6.2.
3.6.1 pH (4.6) soluble nitrogen
Small-sized residues of free amino acids are generated during secondary proteolysis and are commonly measured using the water-soluble nitrogen (WSN) assay, as shown in Figure 2A. Full-fat cheese (T8) had the highest average pH 4.6 soluble nitrogen (pH 4.6 SN) (10.03%), whereas the negative control (T9) had the lowest (7.78%), with the T8 sample having the highest pH 4.6 SN (15.03%) at 90 days and the T9 sample having the lowest pH 4.6 SN (3.22%) at 0 days. Comparing all of the cheese samples to the positive control (T8), the soluble nitrogen content is lower at pH 4.6. Ong et al. (2007) concluded that different hydrocolloid combinations and microbial cultures exhibit varying degrees of proteolysis, resulting in different levels of soluble nitrogen. The higher hydrolytic protein content of cheddar cheese may be the cause of the pH 4.6 SN increase during aging. Similar findings were reported by Ozturk et al. (2013), indicating a large rise in soluble nitrogen levels during the ripening process. During the proteolysis process, different agents like non-starter lactic acid bacteria, starter culture, and different enzymes cause the interruption of milk protein (casein) to the smaller peptides and amino acids, and eventually it increases the soluble nitrogen in cheese at pH 4.6. This process is generally reflected in the increased nitrogen fractions in aged cheeses. Coagulant and certain natural milk enzymes, such as plasmin and cathepsin D, are primarily responsible for breaking down caseins into large peptides. Microbial proteinases then convert large peptides into small peptides, while microbial peptidases hydrolyze small peptides into amino acids (Basiony and Hassabo, 2022).
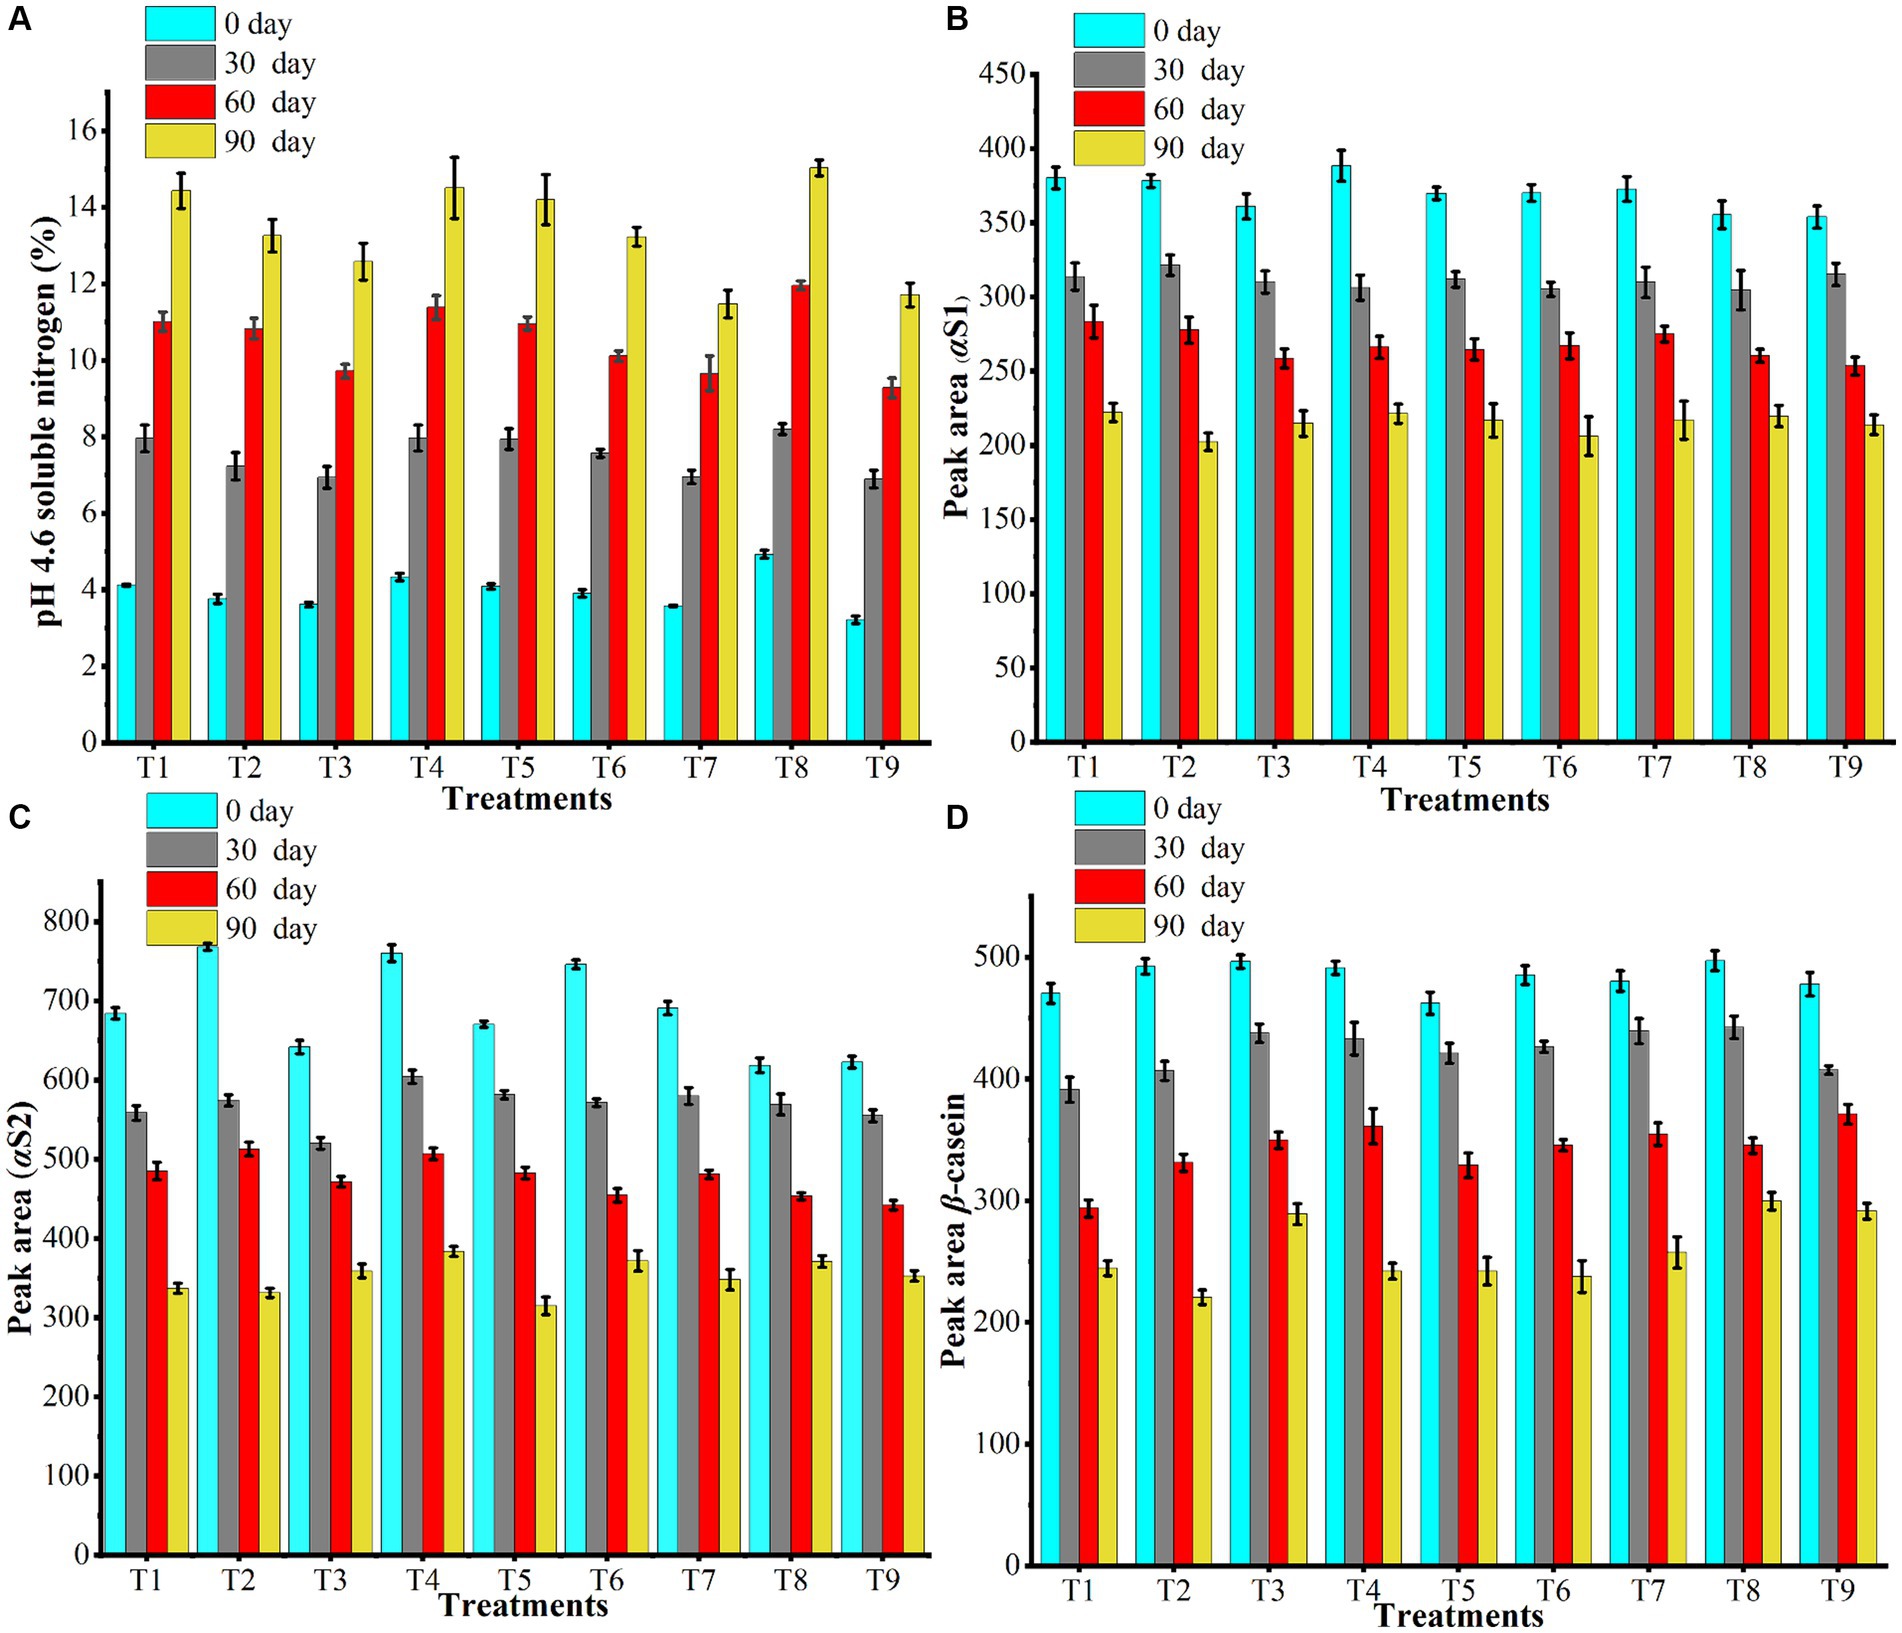
Figure 2. (A) illustrates the impact of dietary fiber and hydrocolloids on the pH 4.6 soluble nitrogen (%) and the breakdown of (B) αS-1, (C) αS-2, and (D) β-casein in low-fat cheddar cheese during the ripening process. The treatment codes T1-T9 are described in Table 1.
3.6.2 Proteolysis by RP-HPLC
The proteolysis phenomenon occurs during biochemical ripening, and it causes the breakdown of the milk proteins in the presence of water into their hydrolytic products. In the present study, the proteolysis in the produced low-fat cheddar cheeses, with hydrocolloids and dietary fiber, was monitored using casein, the main protein of milk, as standard. The casein degradation during the ripening process was investigated employing water-insoluble fractions. During hydrolysis, residual coagulants like enzymes degrade the casein into its parts, including αS-1, αS-2, and β-casein. In all the low-fat cheddar cheese samples, the αS-1, αS-2, and β-casein typical peaks were identified by comparing their retention times with the standard HPLC chromatogram of casein. Figures 2B–D showed the peak areas of αS-1, αS-2, and β-casein, respectively, for all formulated low-fat cheddar cheeses at different storage times (0, 30, 60, and 90 days). The difference in moisture to protein ratio mainly affected the protein hydrolysis and, thus, the peak areas of all these fractions of casein. The T2 sample showed higher breakdown as compared to all other treatments, due to the guar gum’s higher water retention capacity and, consequently, higher moisture content. Indeed, hydrocolloid gums and dietary fibers have different water retention capacities, as shown by the moisture analysis and pH 4.6 soluble nitrogen, and those hydrocolloids that bind more moisture are characterized by a greater breakdown of casein protein. On the other hand, the least breakdown was noticed in the positive control (full-fat cheese) in αS-1 and αS-2, and in the case of β-casein, it was found in low-fat cheese T9 without gums.
Regarding ripening, the levels of αS-1, αS-2, and β-casein in the peak areas dropped, indicating that as proteolysis progresses during storage, the amount of intact casein decreases and less is available in the later stages of ripening. The reduction of peak regions for various fractions of low-fat cheddar cheese throughout ripening was apparent. The increase in hydrolytic proteins is directly correlated with the continuous breakdown of all casein fractions during storage. This breakdown is caused by the coagulating agent or various enzymes, such as proteinases or peptidases, which are secreted by the starter culture (bacteria). As the cheese ripens, these enzymes break down the intact proteins, leading to a decrease in their levels (Paximada et al., 2021). Reduction of casein is linked with hydrolysis of αS-1 casein, which generates fractions of αS-I, and the level of α-S1 is reduced (Ceruti et al., 2012). Romeih et al. (2002) also researched the profiling of peptides in cheese that originate from the breakdown of milk protein casein, and they found that most of the peptides (protein fragments) come from αS1-casein, and the C-terminal of β-casein also produces two peptides and increases the peptides and amino acid level, reducing the intact protein. During storage, β-casein is also converted into γ-caseins, as reported by Abbasi and Nateghi (2022), thanks to the action of the enzyme plasmin.
3.7 Scanning electron microscopy
SEM micrographs of low-fat cheddar cheese with varying hydrocolloid and dietary fiber content are displayed in Figures 3, 4. The observed variations in microstructure can be attributed to the changes in water retention and fat content of the hydrocolloids. As the cheddar cheese ripens further, the protein matrix becomes more hydrated and expands. This can be observed in the SEM micrograph of low-fat cheddar cheeses (Figure 4). The control sample exhibited a higher concentration of whey within the protein network and stronger interconnections between proteins and lipids. Furthermore, increasing the calcium concentration in cheese leads to a decrease in whey entrapment within the protein matrix and promotes stronger protein–protein interactions (Satric et al., 2024). Comparable outcomes were also demonstrated by Mehraban Sangatash et al. (2024) who found that structural alterations during storage lead to protein matrix rearrangements and the flow of water inside the matrix. Microscopic study results indicate that protein type, not quantity, is the primary determinant of rheological, textural, and meltability qualities (Sołowiej et al., 2022).

Figure 3. SEM micrographs of all the treatments at 0 day.
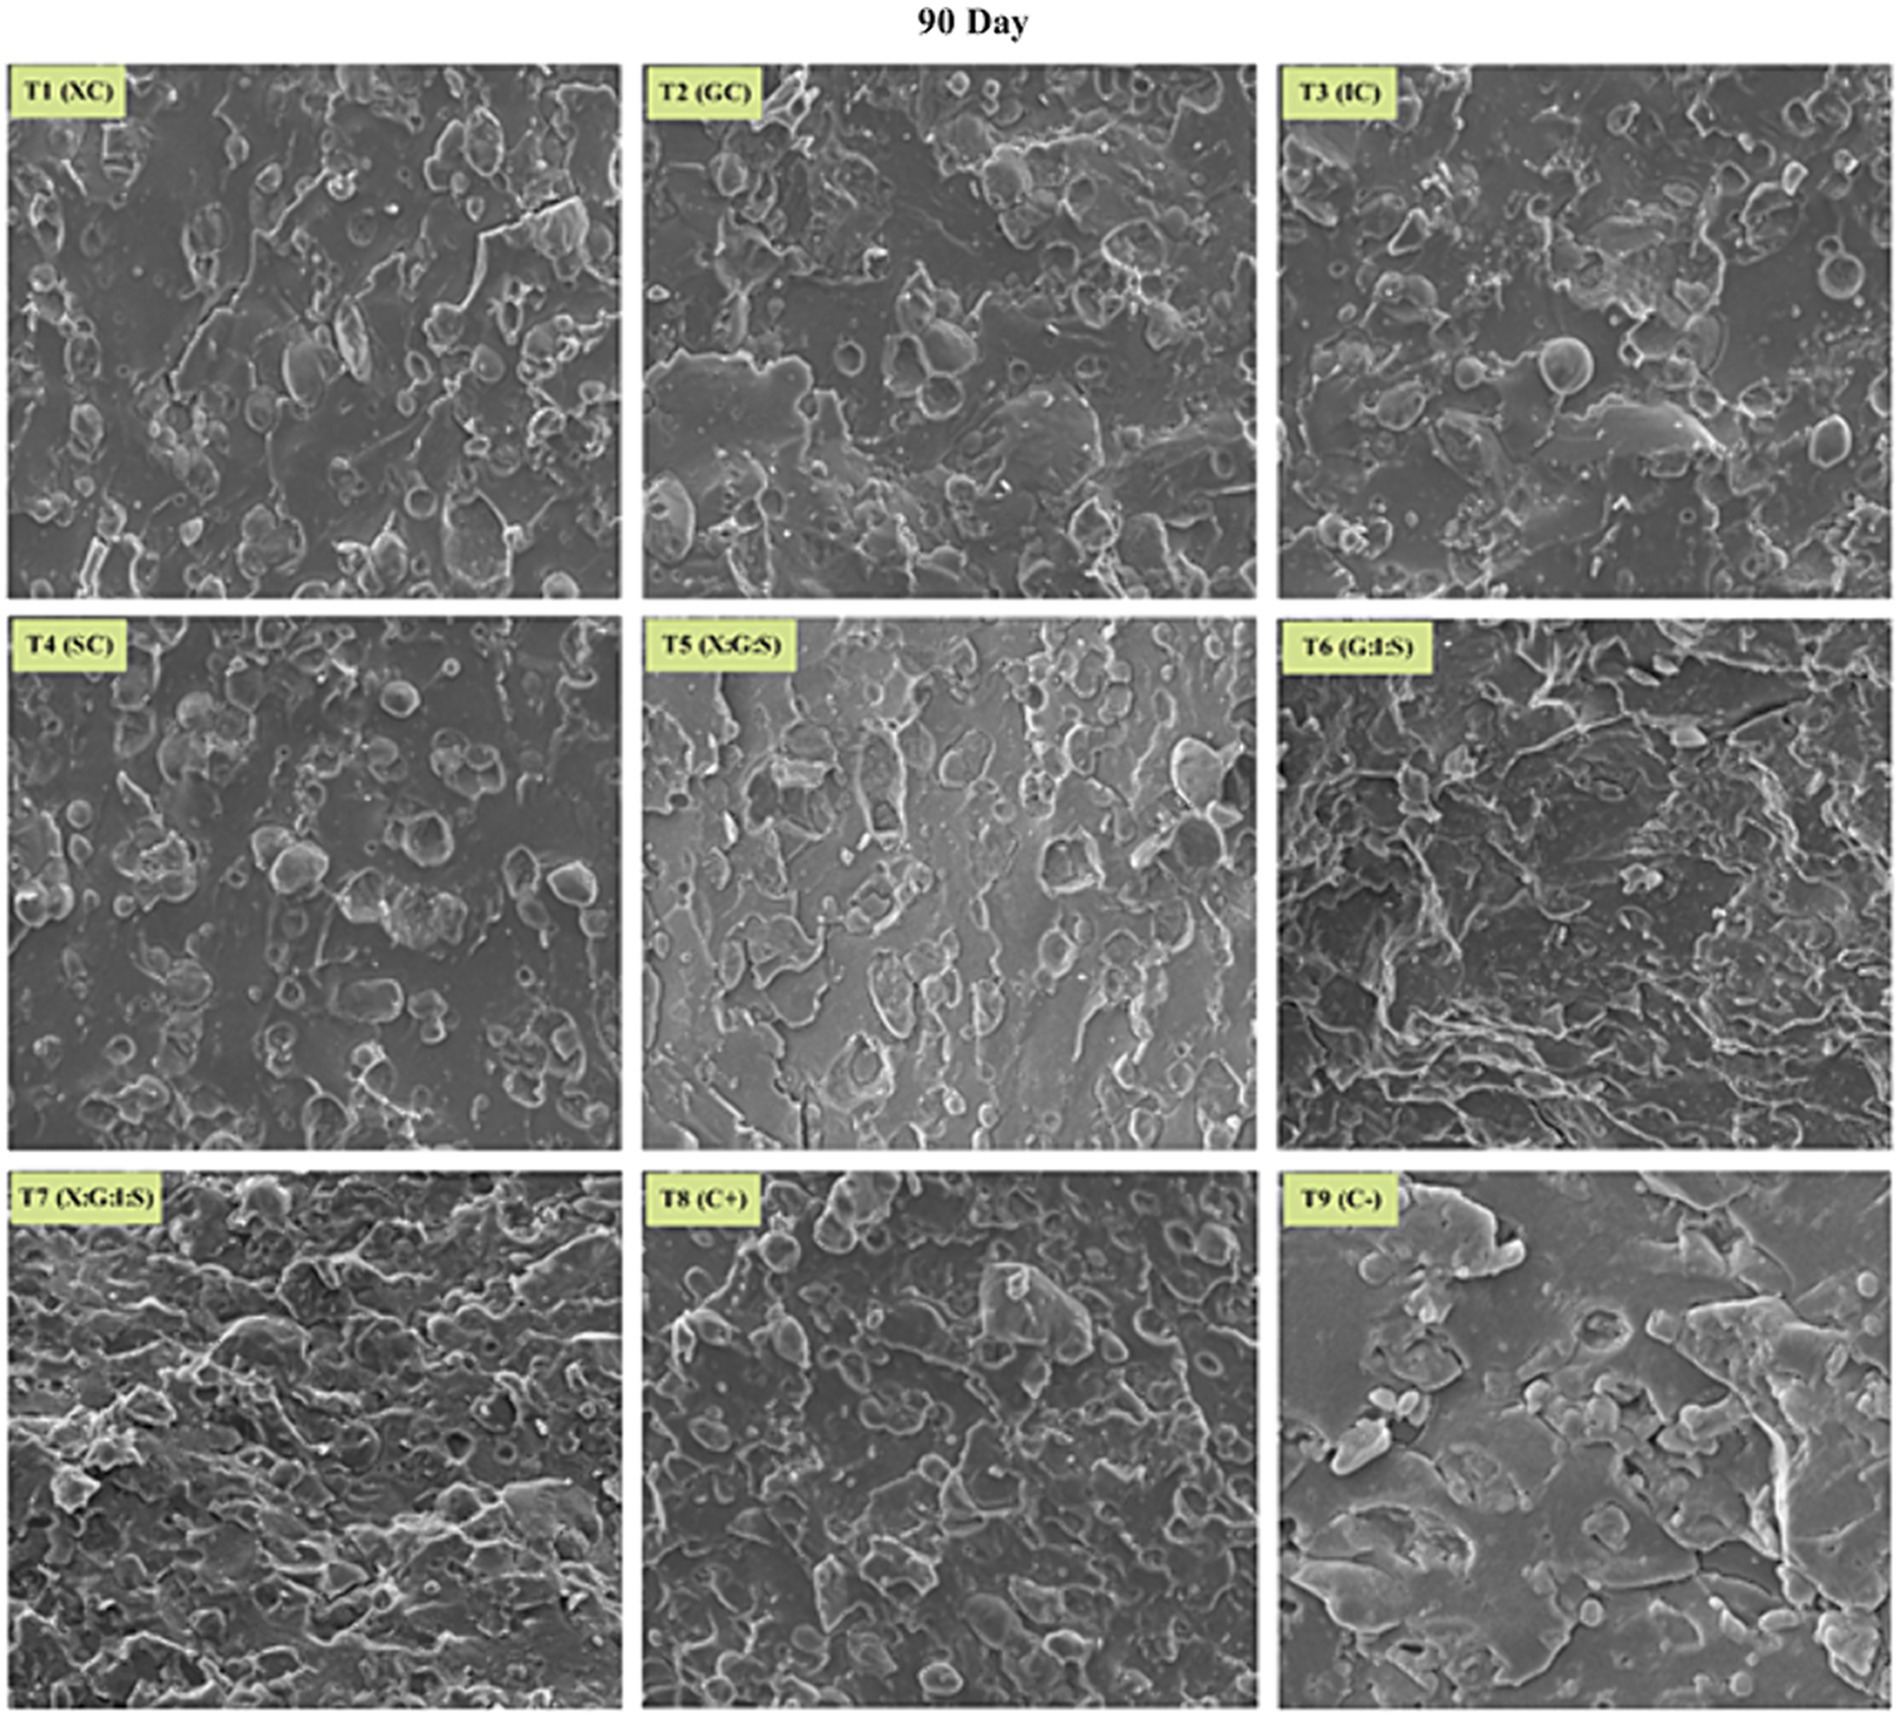
Figure 4. SEM micrographs of all the treatments at 90 days.
SEM micrographs of full-fat cheese presented a porous protein matrix with gaps filled with fat globules (Figure 3). The numerous pores in the protein matrix represent the areas where fat globules are covered. The SEM micrographs of low-fat, reduced, or fat-free cheeses were distinctly different from those of full-fat cheese since, as the quantity of milk fat globules dropped, the protein matrix grew denser. Because of the hydrocolloids ability to retain water, the incorporation of hydrocolloids resulted in the firmer texture that was readily noticeable in low-fat cheese, despite the cheese’s much higher moisture level (Saha and Bhattacharya, 2010). When compared to control cheese, the inulin-based cheese’s microstructure demonstrated improved ingredient dispersion. Due to their negative charge, hydrocolloid gums combine at low pH with positively charged proteins to generate an extremely well-organized, spongy protein network (Chen et al., 2020).
3.8 Organic acid concentrations in cheddar cheese
Organic acids, produced by acetic acid bacteria, lactic acid bacteria, and some fungi, are significant in fermented milk and cheese. According to a recent investigation by Gholamhosseinpour et al. (2018), the generation of organic acid generally rises as the ripening phase progresses. The predominant organic acid in cheese is lactic acid, which makes up over 74% of its total acid content. The starting cultures used to make cheese employ lactose as a readily available energy source to pyruvate and balance the redox potential. Lactose, or sugar, found in milk is fermented by homo-fermentative lactic acid bacteria to produce lactic acid. Lactic acid bacteria produce flavor and texture in milk by acidifying it (Santa and Srbinovska, 2023). In this study, we measured the citric, lactic, acetic, butyric, formic, and pyruvic acids at intervals of 45 to 90 days of low-fat cheddar cheese ripening, as reported in Figure 5. Full-fat cheese showed the maximum concentration of lactic acid (16682.0 mg/kg), followed by T6 (16127.0 mg/kg) at 90 days, while cheese made with xanthan gum (T1) had the lowest amount (14297.7 mg/kg), followed by cheese with inulin T3 (14688.0 mg/kg). The values revealed in the present paper are in agreement with those reported in the previous work of Sullivan et al. (2023), who found that cheddar cheese had 21,852 mg/kg of lactic acid while Mexican cheeses had 17,300 ppm and 18,900 mg/kg of lactic acid. Lactose is converted to lactate, which is then used by microbiological metabolism, oxidation, or racemization to create organic acids (Santa and Srbinovska, 2023). Additionally, when there are fermentable carbohydrates present, citrate is rapidly broken down to create acetic acid, diacetyl, and carbon dioxide. Higher quantities of acetic acid may result from the metabolism of lactic acid: lactose is converted to lactic acid by enzymes such as pyruvate-formate lyase and lactic dehydrogenase, which then use pyruvate metabolism to produce acetic acid (Fox et al., 2017). Thus, the acetic acid levels were measured for all the formulations (Figure 5). The positive control (T8) had the highest acetic acid level (456.20 mg/kg), followed by cheese with xanthan, guar gum, and starch (T5) (416.10 mg/kg), while the lowest content (320.20 mg/kg) was found in T4, followed by T1 (327.40 mg/kg). The differences between low-fat cheese without analytes and T2, T3, and T7 were not statistically significant. The acetic acid values found in this study are similar to those found by Izco et al. (2002) (434.00 mg/kg in cheddar cheese), Desfossés-Foucault et al. (2012) (400 mg/kg in cheddar cheese), and Caro et al. (2014) (300–600 mg/kg in Mexican cheeses). All treatments had higher levels of acetic acid after 90 days of storage (406.59 mg/kg) than after 45 days (347.00 mg/kg). Moreover, the main byproduct of lactic acid bacteria’s catabolism of carbohydrates is citric acid. Citric acid and iso-citric acid are synthesized when the culture moves from the logarithmic phase to the retardation phase (El-Aidie et al., 2019). Citric acid generation increases acidity, which in turn slows the growth of pathogenic germs and spoilage, improving the hygienic quality of cheese. Concerning the measured citric acid amounts, the positive control (T8) had the highest concentration of citric acid (939.60 mg/kg), followed by T6 (890.20 mg/kg), whereas T5 had the lowest concentration (742.30 mg/kg), followed by T1 (749.60 mg/kg) (Figure 5).
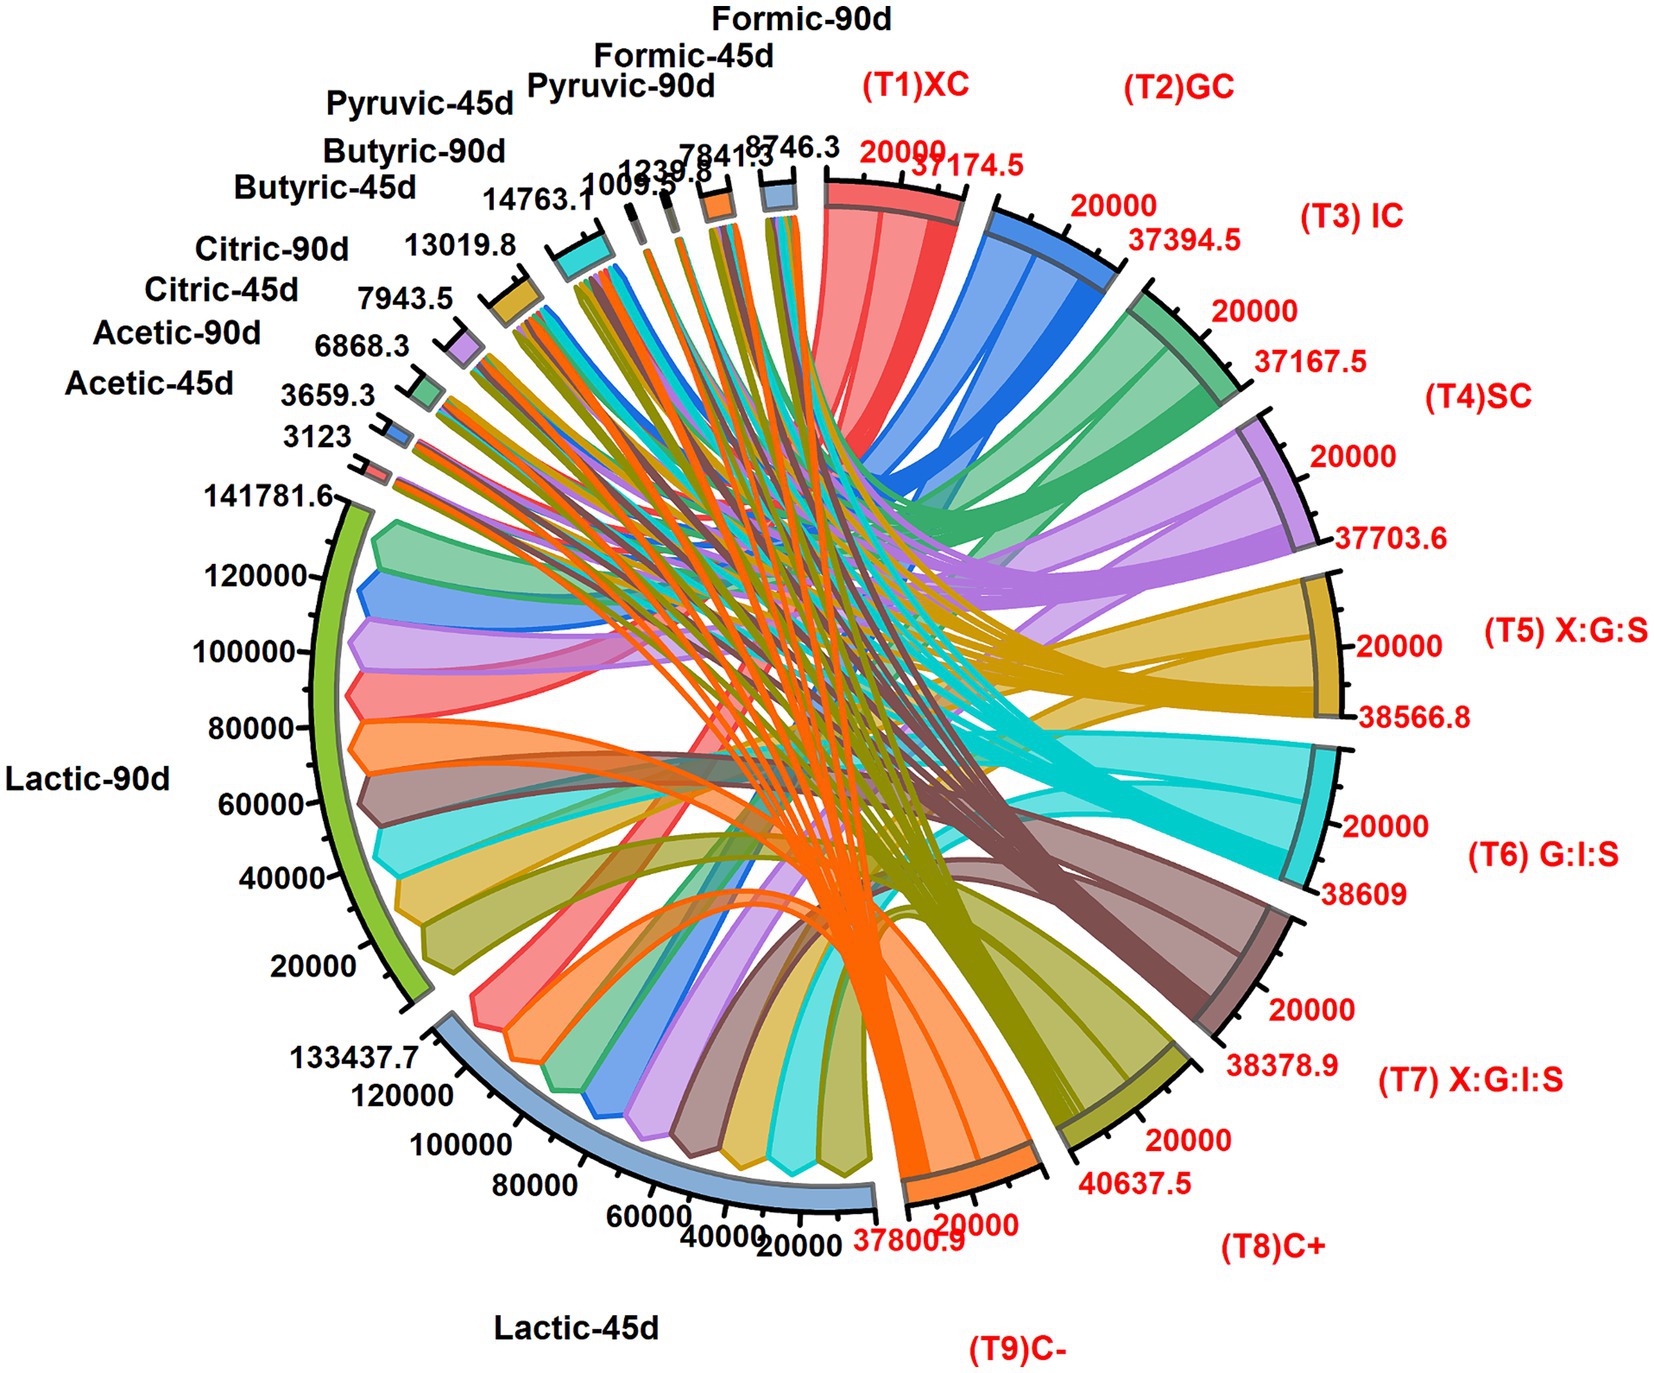
Figure 5. Effect of dietary fiber and hydrocolloids on organic acids contents of low-fat cheddar cheese during ripening.
All treatments differ non-significantly from one another, with the exception of T5 and the positive control (T8). These results are consistent with those by Murtaza (2016), who reported citric acid concentrations between 740 and 940 mg/kg for cheddar cheese. Considering the influence of storage, citric acid contents increased from 763.15 mg/kg at 45 days to 882.61 mg/kg during 90 days of storage. According to Lues and Bekker (2002), the citric acid decreased up to 40 days into ripening and then sharply surged at the end of ripening. Another relevant organic acid is butyric acid, which is not only produced by lipids but also by proteolysis and the deamination of protein degradation products (Akalin et al., 2002). As evident from the results collected in Figure 5, every treatment showed no discernible difference, with the exception of the positive control (T8). Positive control (T8) had the greatest butyric acid level (1989.70 mg/kg). The results of this study closely resemble those of Murtaza (2016), who found that butyric acid ranged from 1,500 to 2000 ppm in cheddar cheese. From 45 days of storage (1446.64 mg/kg) to 90 days of storage (1640.30 mg/kg), the butyric acid level of all the treatments rose, in agreement with the research conducted by Kara et al. (2014) which revealed a highly significant increase in butyric acid in cheese over a 90-day period. Indeed, the concentration of the primary lipolytic agent in raw milk cheeses, namely the lipase, determines the considerable increase in short-chain fatty acids (capric acid, C6:0, caprylic acid, C8:0, and butyric acid, C4:0) during the ripening process (Ozcan and Kurdal, 2012). Galactose and fructose are fermented by homo-fermentative lactic acid bacteria, which then go through glycolysis to create pyruvic acid. Cheese produces pyruvate via a variety of carbon-based metabolic pathways, including the metabolism of nucleotides, citrate, lactate, and amino acids (Lazzi et al., 2014). In our study, the positive control (T8) had the highest pyruvic acid content (156.40 mg/kg), followed by T5 (141.50 mg/kg). In contrast, T3 had the lowest pyruvic acid content (103.70 mg/kg), followed by T1 (106.60 mg/kg). The current results are aligned with the findings of Akalin et al. (2002) who reported for the pickled white cheese a mean pyruvic acid concentration between 100 and 180 ppm. During ripening, the pyruvic acid content of all treatments increased from 112.17 mg/kg to 137.76 mg/kg. Similarly, throughout the course of a classic Italian cheese’s 90-day ripening process, the related pyruvic acid concentration fluctuated from 38 to 303 ppm. Pyruvic acid production is irregular during the early stages of ripening; however, cheeses with high Ca and P content show an enhanced pyruvic acid concentration during storage, as demonstrated in a study on buffalo milk cheese (Upreti et al., 2006). Regarding the formic acid, conversely, the negative control (T9) had the lowest formic acid content (861.30 mg/kg), followed by T3 (863.5 mg/kg). Our findings agreed with those of Kumar (2012), who found that formic acid content in low-fat cheese with Novagel was often higher than in other low-fat and full-fat cheeses. Nevertheless, the primary component of Novagel is microcrystalline cellulose, which might disintegrate during the ripening process.
3.9 Correlation analysis
A thorough examination of the relationships among several techno-functional attributes of low-fat cheddar cheese, such as moisture, fat, protein, pH, acidity, meltability, flowability, water activity (WA), hardness, cohesiveness, springiness, gumminess, chewiness, and soluble nitrogen, is provided by the correlation matrix that is displayed in Figure 6. The correlations’ direction and strength are indicated by the color scale, which runs from −1.0 to 1.0. Warm colors (yellow to red) indicate positive correlations, whereas cool colors (green to purple) indicate negative correlations (Figure 6). There is a noteworthy inverse relationship between moisture and protein (r = −0.5), indicating that food samples with higher moisture content also have lower protein contents. On the other hand, food items with a higher fat content generally have higher pH values, as indicated by a significant positive correlation between fat and pH. Moreover, there is a strong positive association between acidity and meltability, suggesting that foods with higher acidity levels will melt more easily. A strong correlation (r = 0.8) has been found between WA and flowability, suggesting that increased water activity is associated with better flowability, a critical factor in food handling and processing. There is a noteworthy positive association (r = 0.6) between cohesiveness and hardness, indicating that foods with higher hardness have a tendency to be more cohesive. Knowing this link is essential to comprehending food product sensory profiles. Furthermore, there is a strong positive association (r = 0.7) between gumminess and springiness, as well as between chewiness and springiness (r ≈ 0.5), suggesting that foods with higher springiness are also typically chewier and gummier. The relationship between soluble nitrogen content and chewiness is negatively correlated (r = −0.4), indicating that lower soluble nitrogen content is linked to poorer chewiness, which can affect the sensory qualities of food. Relevant to the nutritional profile, the positive association (r = 0.3) between protein and fat further suggests that diets with higher protein content also typically have higher fat content. The association between moisture and pH (r = −0.3) is negative, indicating that lower pH values are linked to increased moisture levels, which can affect food safety and preservation. Understanding these correlations enables the enhancement of dietary attributes to achieve preferred qualities, such as consistency and mouthfeel. For example, changing the amount of moisture can affect the protein content, and changing the water’s activity can affect the flowability. As a result, this correlation analysis offers insightful information that can direct the creation and enhancement of food products.
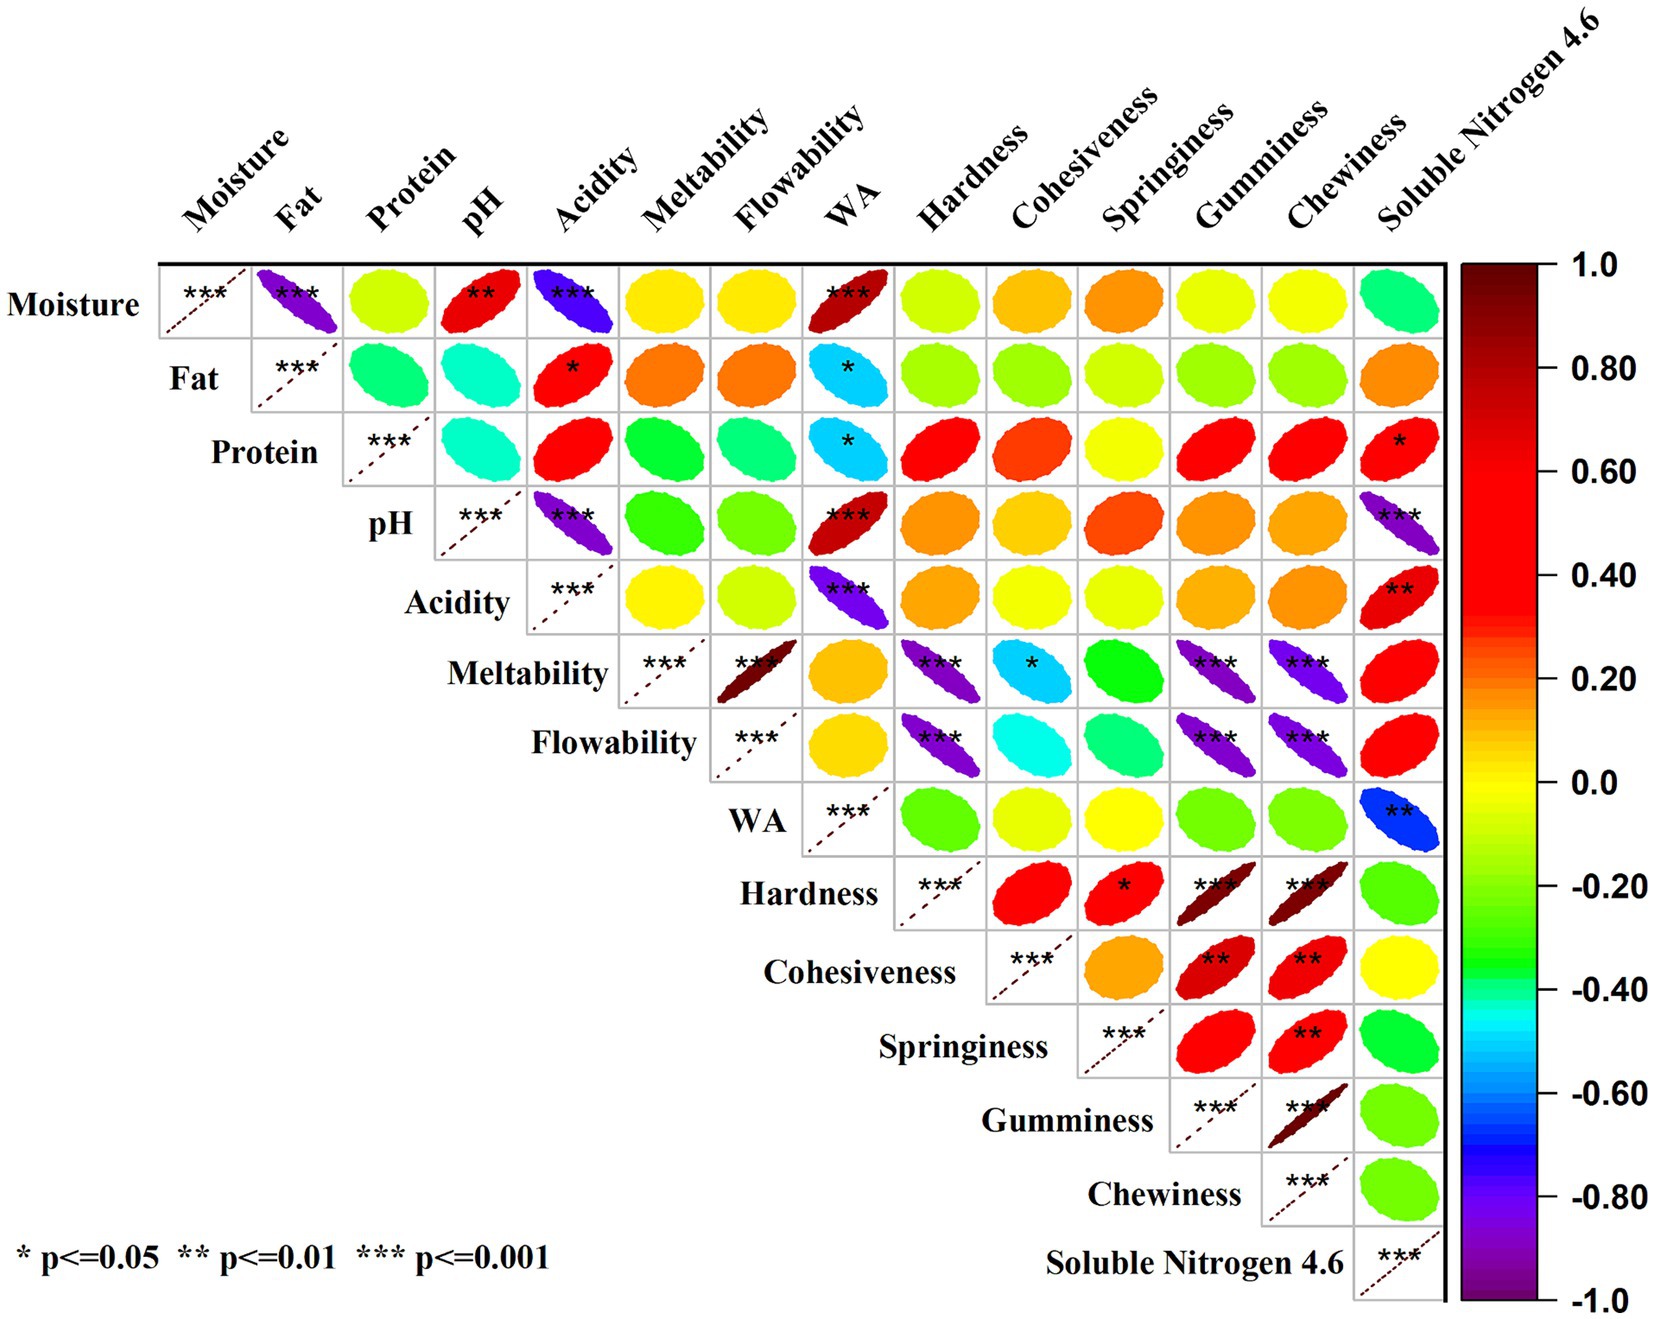
Figure 6. Pearson correlation analysis among several techno-functional attributes of low-fat cheddar cheese. The depth of colors ranging from yellow to red and green to purple represents the magnitude of the correlation. Significant correlations are marked with *p < 0.05, **p < 0.01, and ***p < 0.001.
4 Conclusion
In this work, different formulations of low-fat cheddar cheese based on the addition of hydrocolloids (gums) and dietary fibers were successfully obtained, and the influence of the fat replacers on the cheddar cheese’s physiochemical, textural, and functional features was investigated. Our results indicated that diverse hydrocolloids and dietary fibers had a remarkable impact on the quality of low-fat cheddar cheese. It was observed that a combination of hydrocolloids and dietary fibers has a beneficial impact, resulting in reduced hardness in low-fat cheeses. Furthermore, the current study’s findings demonstrated that these analytes could improve cheese meltability and flowability. Overall, an enhancement in the techno-functional and textural properties was recorded. Guar gum at a concentration of 0.45% has been shown to be highly effective in producing the finest low-fat cheddar cheese. Furthermore, a blend of guar gum, resistant starch, and inulin at a concentration of 33% could also be used to achieve the desired results. At a concentration of 25%, all four fat replacers (guar gum, xanthan gum, resistant starch, and inulin) demonstrated promising results that were similar to those of full-fat cheese. This study examined the correlations between low-fat cheddar cheese’s techno-functional attributes, finding an inverse relationship between moisture and protein, a positive correlation between fat and pH, and a strong association between acidity, water activity, cohesiveness, hardness, gumminess, springiness, chewiness, and moisture. Overall, the use of dietary fibers and hydrocolloids as natural fat replacers opens up new avenues for the commercial production of low-fat cheddar cheese.
Data availability statement
The datasets presented in this study can be found in online repositories. The names of the repository/repositories and accession number(s) can be found in the article/supplementary material.
Author contributions
MM: Conceptualization, Investigation, Methodology, Validation, Visualization, Writing – original draft. AS: Formal analysis, Investigation, Validation, Writing – review & editing. AR: Formal analysis, Resources, Writing – review & editing. NH: Formal analysis, Software, Writing – review & editing. FH: Resources, Validation, Writing – review & editing. SH: Investigation, Software, Writing – review & editing. IC: Data curation, Visualization, Writing – review & editing. SK: Conceptualization, Data curation, Resources, Writing – review & editing. SI: Funding acquisition, Project administration, Supervision, Resources, Writing – review & editing. YM: Funding acquisition, Project administration, Resources, Supervision, Writing – review & editing.
Funding
The author(s) declare financial support was received for the research, authorship, and/or publication of this article. The authors appreciate the support from the Researchers Supporting Project number (RSPD2024R1073), King Saud University, Riyadh, Saudi Arabia.
Acknowledgments
This publication was made possible by grant number NC.X-267-5-12-170-1 from the National Institute of Food and Agriculture (NIFA) and the Department of Family and Consumer Sciences and the Agriculture Research Station at North Carolina Agriculture and Technical State University (Greensboro, NC, United States 27411).
Conflict of interest
The authors declare that the research was conducted in the absence of any commercial or financial relationships that could be construed as a potential conflict of interest.
Publisher’s note
All claims expressed in this article are solely those of the authors and do not necessarily represent those of their affiliated organizations, or those of the publisher, the editors and the reviewers. Any product that may be evaluated in this article, or claim that may be made by its manufacturer, is not guaranteed or endorsed by the publisher.
References
Abbasi, S., and Nateghi, L. (2022). The feasibility of manufacturing low fat pizza cheese by use of pre-gelatinized corn starch. J. Food Biosci. Technol. 12, 51–66. doi: 10.30495/jfbt.2022.19731
Abdeldaiem, A., and Blassy, K. (2019). Effect of imulin and simplesse® as fat replacers on low fat mozzarella cheese properties. Egyptian J. Dairy Sci. 47, 51–60.
Akalin, A., Gönç, S., and Akbaş, Y. (2002). Variation in organic acids content during ripening of pickled white cheese. J. Dairy Sci. 85, 1670–1676. doi: 10.3168/jds.S0022-0302(02)74239-2
Al-Zarfy, Z. H. A. H., and Al-Bedrani, D. I. J. (2022). Study the effect of adding arabic gum as a fat replacer on quality characteristics of low-fat processed cheese. J. Hyg. Eng. Des.
Basiony, M., and Hassabo, R. (2022). Composition and quality of low-fat halloumi cheese made using modified starch as a fat replacer. Starch Stärke 74:2100211. doi: 10.1002/star.202100211
Biegalski, J., and Cais-Sokolińska, D. (2023). Production of sensorily acceptable pasta filata cheese with partial substitution of sheep’s milk powder in different forms. Food Secur. 12:1766. doi: 10.3390/foods12091766
Bojovic, M., and McGregor, A. (2023). A review of megatrends in the global dairy sector: what are the socioecological implications? Agric. Hum. Values 40, 373–394. doi: 10.1007/s10460-022-10338-x
Borges, A. R., Pires, A. F., Marnotes, N. G., Gomes, D. G., Henriques, M. F., and Pereira, C. D. (2020). Dairy by-products concentrated by ultrafiltration used as ingredients in the production of reduced fat washed curd cheese. Food Secur. 9:1020. doi: 10.3390/foods9081020
Caputo, V., Sogari, G., and Van Loo, E. J. (2023). Do plant-based and blend meat alternatives taste like meat? A combined sensory and choice experiment study. Appl. Econ. Perspect. Policy 45, 86–105. doi: 10.1002/aepp.13247
Caro, I., Soto, S., Fuentes, L., Gutiérrez-Méndez, N., García-Islas, B., Monroy-Gayosso, K. E., et al. (2014). Compositional, functional and sensory characteristics of selected Mexican cheeses. Food Nutr. Sci. 5, 366–375. doi: 10.4236/fns.2014.54044
Castillo, M., Lucey, J., Wang, T., and Payne, F. (2006). Effect of temperature and inoculum concentration on gel microstructure, permeability and syneresis kinetics. Cottage cheese-type gels. Int. Dairy J. 16, 153–163. doi: 10.1016/j.idairyj.2005.02.004
Ceruti, R. J., Zorrilla, S. E., and Sihufe, G. A. (2012). The influence of elevated initial ripening temperature on the proteolysis in Reggianito cheese. Food Res. Int. 48, 34–40. doi: 10.1016/j.foodres.2012.02.011
Chen, Y., MacNaughtan, W., Jones, P., Yang, Q., and Foster, T. (2020). The state of water and fat during the maturation of Cheddar cheese. Food Chem. 303:125390. doi: 10.1016/j.foodchem.2019.125390
Desfossés-Foucault, É., Dussault-Lepage, V., Le Boucher, C., Savard, P., LaPointe, G., and Roy, D. (2012). Assessment of probiotic viability during Cheddar cheese manufacture and ripening using propidium monoazide-PCR quantification. Front. Microbiol. 3:350. doi: 10.3389/fmicb.2012.00350
Diamantino, V. R., Beraldo, F. A., Sunakozawa, T. N., and Penna, A. L. B. (2014). Effect of octenyl succinylated waxy starch as a fat mimetic on texture, microstructure and physicochemical properties of Minas fresh cheese. LWT-Food Sci. Technol. 56, 356–362. doi: 10.1016/j.lwt.2013.12.001
El-Aidie, S. A., Ghita, E. I., El-Dieb, S. M., and El-Garhi, H.-E. M. (2019). Physicochemical, microstructural and sensory impact of fat replacers on low-fat Edam cheese manufactured from buffalo’s milk. Int. J. Adv. Life Sci. Res. 2, 11–21. doi: 10.31632/ijalsr.2019v02i03.002
El-Nimr, A., Eissa, H. A., El-Abd, M., Mehriz, A., Abbas, H. M., and Bayoumi, H. M. (2010). Water activity, color characteristics and sensory properties of egyptian gouda cheese during ripening. J. Am. Sci. 6, 447–453.
Fox, P. F., Guinee, T. P., Cogan, T. M., and McSweeney, P. L. (2017). Fundamentals of cheese science. New York: Springer Science+Business Media LLC.
Ghaderi-Ghahfarokhi, M., Yousefvand, A., Ahmadi Gavlighi, H., Zarei, M., and Farhangnia, P. (2020). Developing novel synbiotic low-fat yogurt with fucoxylogalacturonan from tragacanth gum: investigation of quality parameters and Lactobacillus casei survival. Food Sci. Nutr. 8, 4491–4504. doi: 10.1002/fsn3.1752
Gholamhosseinpour, A., Mazaheri Tehrani, M., and Razavi, S. M. A. (2018). Optimization of textural characteristics of analogue UF-feta cheese made from dairy and non-dairy ingredients. Iran. J. Food Sci. Technol. Res. 13, 80–91. doi: 10.22067/ifstrj.v1396i0.59349
Guinee, T., Feeney, E., Auty, M., and Fox, P. (2002). Effect of pH and calcium concentration on some textural and functional properties of mozzarella cheese. J. Dairy Sci. 85, 1655–1669. doi: 10.3168/jds.S0022-0302(02)74238-0
Hassan, F. A., Abd El-Gawad, M. A. M., and Enab, A. (2013). Flavour compounds in cheese. Res. Precis. Instrum. Mach. 2, 15–29.
Hayaloglu, A. (2003). Influence of the strains of Lactococcus used as a starter on the characteristics and ripening properties of Turkish white cheese. PhD Thesis.
Izco, J., Tormo, M., and Jiménez-Flores, R. (2002). Rapid simultaneous determination of organic acids, free amino acids, and lactose in cheese by capillary electrophoresis. J. Dairy Sci. 85, 2122–2129. doi: 10.3168/jds.S0022-0302(02)74290-2
Kara, R., Bulut, S., and Akkaya, L. (2014). Determination of fatty acid composition of Afyon Tulum cheese. J. Food Nutr. Res. 2, 17–20. doi: 10.12691/jfnr-2-1-3
Khanal, B. K. S., and Bansal, N. (2020). “Dairy fat replacement in low-fat cheese (LFC): A review of successful technological interventions” in Dairy fat products and functionality: Fundamental science and technology. Eds. T. Truong, C. Lopez, B. Bhandari and S. Prakash. (Switzerland: Springer Nature), 549–581.
Khanal, B. K. S., Bhandari, B., Prakash, S., and Bansal, N. (2020). Simulated oral processing, in vitro digestibility and sensory perception of low fat Cheddar cheese containing sodium alginate. J. Food Eng. 270:109749. doi: 10.1016/j.jfoodeng.2019.109749
Khanal, B. K. S., Budiman, C., Hodson, M. P., Plan, M. R., Prakash, S., Bhandari, B., et al. (2019a). Physico-chemical and biochemical properties of low fat Cheddar cheese made from micron to nano sized milk fat emulsions. J. Food Eng. 242, 94–105. doi: 10.1016/j.jfoodeng.2018.08.019
Khanal, B. K. S., Pradhan, M., and Bansal, N. (2019b). Cheese: importance and introduction to basic technologies. J. Food Sci. Technol. Nepal 11, 14–24. doi: 10.3126/jfstn.v11i0.29666
Korish, M., and Abd Elhamid, A. M. (2012). Improving the textural properties of Egyptian kariesh cheese by addition of hydrocolloids. Int. J. Dairy Technol. 65, 237–242. doi: 10.1111/j.1471-0307.2011.00818.x
Kumar, R. (2012). An investigation into improvement of low fat cheddar cheese by the addidtion of hydrocolloids. A PhD thesis in the faculty of the graduate school of the university of Minnesota.
Lazzi, C., Turroni, S., Mancini, A., Sgarbi, E., Neviani, E., Brigidi, P., et al. (2014). Transcriptomic clues to understand the growth of Lactobacillus rhamnosus in cheese. BMC Microbiol. 14, 28–14. doi: 10.1186/1471-2180-14-28
Liu, T., Wu, J., Aziz, T., Xue, R., Khowdiary, M. M., and Yang, Z. (2024). Changes of physicochemical and functional properties of processed cheese made with natural cheddar and mozzarella cheeses during refrigerated storage. Sci. Rep. 14:3714. doi: 10.1038/s41598-024-53748-z
Loh, H. C., Seah, Y. K., and Looi, I. (2021). The COVID-19 pandemic and diet change. Prog. Microb. Molecul. Biol. 4:203. doi: 10.36877/pmmb.a0000203
Lues, J., and Bekker, A. (2002). Mathematical expressions for organic acids in early ripening of a Cheddar cheese. J. Food Compos. Anal. 15, 11–17. doi: 10.1006/jfca.2001.1039
Mehraban Sangatash, M., Dadras-Moghadam, M., Mortazavi, S. A., and Yarabbi, H. (2024). Evaluation of physicochemical and textural properties of low-fat and low sodium imitation pizza cheese. Iran. Food Sci. Technol. Res. J. 19, 143–166. doi: 10.22067/ifstrj.2023.84481.1283
Moghiseh, N., Arianfar, A., Salehi, E. A., and Rafe, A. (2021). Effect of inulin/kefiran mixture on the rheological and structural properties of mozzarella cheese. Int. J. Biol. Macromol. 191, 1079–1086. doi: 10.1016/j.ijbiomac.2021.09.154
Murtaza, M. A. (2016). Cheddar-type cheeses. Ref. Mod. Food Sci. 1, 1–8. doi: 10.1016/B978-0-08-100596-5.00659-4
Murtaza, M. S., Sameen, A., Rafique, S., Shahbaz, M., Gulzar, N., Murtaza, M. A., et al. (2022). Impact of dietary fiber (inulin and resistant starch) on the quality parameters of low fat cheddar cheese from buffalo milk. Pakistan J. Zool. 55, 855–862. doi: 10.17582/journal.pjz/20200630120620
Murtaza, M. S., Sameen, A., Rafique, S., Shahbaz, M., Gulzar, N., Murtaza, M. A., et al. (2023). Impact of dietary fiber (inulin and resistant starch) on the quality parameters of low fat cheddar cheese from buffalo milk. Pakistan J. Zool. 55, 855–862.
Nateghi, L., Roohinejad, S., Totosaus, A., Rahmani, A., Tajabadi, N., Meimandipour, A., et al. (2012). Physicochemical and textural properties of reduced fat Cheddar cheese formulated with xanthan gum and/or sodium caseinate as fat replacers. J. Food Agr. Environ. 10, 59–63.
Nishinari, K., and Fang, Y. (2018). Perception and measurement of food texture: solid foods. J. Texture Stud. 49, 160–201. doi: 10.1111/jtxs.12327
Ong, L., Henriksson, A., and Shah, N. P. (2007). Chemical analysis and sensory evaluation of Cheddar cheese produced with Lactobacillus acidophilus, Lb. casei, Lb. paracasei or Bifidobacterium sp. Int. Dairy J. 17, 937–945. doi: 10.1016/j.idairyj.2007.01.002
Orlyuk, Y. T., and Stepanishchev, M. I. (2014). Assessment of proteolysis and lipolysis intensity in Pechersky cheese ripening in the presence of Penicillium camemberti and Penicillium roqueforti molds. Foods Raw Mat. 2, 31–35. doi: 10.12737/4128
Osorio-Arias, J., Pérez-Martínez, A., Vega-Castro, O., and Martínez-Monteagudo, S. I. (2020). Rheological, texture, structural, and functional properties of Greek-style yogurt fortified with cheese whey-spent coffee ground powder. LWT 129:109523. doi: 10.1016/j.lwt.2020.109523
Ouyang, H., Kilcawley, K. N., Miao, S., Fenelon, M., Kelly, A., and Sheehan, J. J. (2022). Exploring the potential of polysaccharides or plant proteins as structuring agents to design cheeses with sensory properties focused toward consumers in east and Southeast Asia: a review. Crit. Rev. Food Sci. Nutr. 62, 4342–4355. doi: 10.1080/10408398.2021.1874869
Ozcan, T., and Kurdal, E. (2012). The effects of using a starter culture, lipase, and protease enzymes on ripening of Mihalic cheese. Int. J. Dairy Technol. 65, 585–593. doi: 10.1111/j.1471-0307.2012.00868.x
Ozturk, M., Govindasamy-Lucey, S., Jaeggi, J. J., Johnson, M. E., and Lucey, J. A. (2013). The influence of high hydrostatic pressure on regular, reduced, low and no salt added Cheddar cheese. Int. Dairy J. 33, 175–183. doi: 10.1016/j.idairyj.2013.01.008
Papetti, P., and Carelli, A. (2013). Composition and sensory analysis for quality evaluation of a typical Italian cheese: influence of ripening period. Czech J. Food Sci. 31, 438–444. doi: 10.17221/447/2012-CJFS
Paximada, P., Howarth, M., and Dubey, B. N. (2021). Double emulsions fortified with plant and milk proteins as fat replacers in cheese. J. Food Eng. 288:110229. doi: 10.1016/j.jfoodeng.2020.110229
Rehman, A., Jafari, S. M., Tong, Q., Karim, A., Mahdi, A. A., Iqbal, M. W., et al. (2020a). Role of peppermint oil in improving the oxidative stability and antioxidant capacity of borage seed oil-loaded nanoemulsions fabricated by modified starch. Int. J. Biol. Macromol. 153, 697–707. doi: 10.1016/j.ijbiomac.2020.02.292
Rehman, A., Liang, Q., Karim, A., Assadpour, E., Jafari, S. M., Rasheed, H. A., et al. (2024). Pickering high internal phase emulsions stabilized by biopolymeric particles: from production to high-performance applications. Food Hydrocoll. 150:109751. doi: 10.1016/j.foodhyd.2024.109751
Rehman, A., Tong, Q., Jafari, S. M., Assadpour, E., Shehzad, Q., Aadil, R. M., et al. (2020b). Carotenoid-loaded nanocarriers: a comprehensive review. Adv. Colloid Interf. Sci. 275:102048. doi: 10.1016/j.cis.2019.102048
Rolet-Répécaud, O., Berthier, F., Beuvier, E., Gavoye, S., Notz, E., Roustel, S., et al. (2013). Characterization of the non-coagulating enzyme fraction of different milk-clotting preparations. LWT Food Sci. Technol. 50, 459–468. doi: 10.1016/j.lwt.2012.08.021
Romeih, E. A., Michaelidou, A., Biliaderis, C. G., and Zerfiridis, G. K. (2002). Low-fat white-brined cheese made from bovine milk and two commercial fat mimetics: chemical, physical and sensory attributes. Int. Dairy J. 12, 525–540. doi: 10.1016/S0958-6946(02)00043-2
Rulikowska, A., Kilcawley, K., Doolan, I., Alonso-Gomez, M., Nongonierma, A., Hannon, J., et al. (2013). The impact of reduced sodium chloride content on Cheddar cheese quality. Int. Dairy J. 28, 45–55. doi: 10.1016/j.idairyj.2012.08.007
Saha, D., and Bhattacharya, S. (2010). Hydrocolloids as thickening and gelling agents in food: a critical review. J. Food Sci. Technol. 47, 587–597. doi: 10.1007/s13197-010-0162-6
Șanlı, T., Sezgin, E., Șenel, E., and Benli, M. (2011). Effects of using transglutaminase on properties of Ayran in traditional production of Ayran. GIDA - Journal of Food. 4, 217–244.
Santa, D., and Srbinovska, S. (2023). “Whey: source of bioactive peptides, probiotics, organic acids, aromatic compounds and enzymes” in Whey valorization: Innovations, technological advancements and sustainable exploitation. Eds. A. Poonia and A. T. Petkoska. (Singapore: Springer), 239–258.
Satric, A., Tomasevic, I., Djekic, I., Pavlovic, V., Levic, S., and Miocinovic, J. (2024). Evaluation of low sodium Kačkavalj cheese properties using 3D scanning, scanning electron microscopy and computer vision system. Int. J. Dairy Technol. 77, 586–593. doi: 10.1111/1471-0307.13046
Schädle, C., and Büttner, A. (2023). Impact of fat replacers on the rheological, Tribological, and aroma release properties of reduced-fat model emulsion systems and processed cheese. Lebensmittelchemie 77, S2-024–S022-025. doi: 10.1002/lemi.202352206
Sheehan, J. J., Huppertz, T., Hayes, M. G., Kelly, A. L., Beresford, T. P., and Guinee, T. P. (2005). High pressure treatment of reduced-fat mozzarella cheese: effects on functional and rheological properties. Innovative Food Sci. Emerg. Technol. 6, 73–81. doi: 10.1016/j.ifset.2004.10.003
Sołowiej, B. G., Nastaj, M., Szafrańska, J. O., Terpiłowski, K., Małecki, J., and Mleko, S. (2022). The effect of fat replacement by whey protein microcoagulates on the physicochemical properties and microstructure of acid casein model processed cheese. Int. Dairy J. 131:105385. doi: 10.1016/j.idairyj.2022.105385
Sullivan, R. C., Nottage, S., Makinwa, F., Oruna-Concha, M. J., Fagan, C. C., and Parker, J. K. (2023). Characterisation of cooked cheese flavour: non-volatile components. Food Secur. 12:3749. doi: 10.3390/foods12203749
Upreti, P., McKay, L., and Metzger, L. (2006). Influence of calcium and phosphorus, lactose, and salt-to-moisture ratio on Cheddar cheese quality: changes in residual sugars and water-soluble organic acids during ripening. J. Dairy Sci. 89, 429–443. doi: 10.3168/jds.S0022-0302(06)72107-5
Verdini, R. A., Zorrilla, S., and Rubiolo, A. C. (2004). Characterisation of soft cheese proteolysis by RP-HPLC analysis of its nitrogenous fractions. Effect of ripening time and sampling zone. Int. Dairy J. 14, 445–454. doi: 10.1016/j.idairyj.2003.09.002
Wen, P., Zhu, Y., Luo, J., Wang, P., Liu, B., Du, Y., et al. (2021). Effect of anthocyanin-absorbed whey protein microgels on physicochemical and textural properties of reduced-fat Cheddar cheese. J. Dairy Sci. 104, 228–242. doi: 10.3168/jds.2020-18450
Widyastuti, Y., and Febrisiantosa, A. (2014). The role of lactic acid bacteria in milk fermentation. Food Nutr. Sci. 5, 435–442. doi: 10.4236/fns.2014.54051
Yousefi, M., and Jafari, S. M. (2019). Recent advances in application of different hydrocolloids in dairy products to improve their techno-functional properties. Trends Food Sci. Technol. 88, 468–483. doi: 10.1016/j.tifs.2019.04.015
Zhang, D. (2022). Improving quality and functionality of low-fat mozzarella cheese using whey proteins and plant proteins. HKU Theses Online (HKUTO).
Zhao, Y., Khalesi, H., He, J., and Fang, Y. (2023). Application of different hydrocolloids as fat replacer in low-fat dairy products: ice cream, yogurt and cheese. Food Hydrocoll. 138:108493. doi: 10.1016/j.foodhyd.2023.108493
Keywords: low fat cheese, xanthan gum, guar gum, inulin, resistant starch
Citation: Murtaza MS, Sameen A, Rehman A, Huma N, Hussain F, Hussain S, Cacciotti I, Korma SA, Ibrahim SA and Ma YK (2024) Physicochemical, techno-functional, and proteolytic effects of various hydrocolloids as fat replacers in low-fat cheddar cheese. Front. Sustain. Food Syst. 8:1440310. doi: 10.3389/fsufs.2024.1440310
Edited by:
Feng Xue, Nanjing University of Chinese Medicine, ChinaReviewed by:
Xinye Liu, Jiangsu Academy of Agricultural Sciences (JAAS), ChinaYufan Sun, Northeast Agricultural University, China
Liang Guo, Nanjing University of Chinese Medicine, China
Copyright © 2024 Murtaza, Sameen, Rehman, Huma, Hussain, Hussain, Cacciotti, Korma, Ibrahim and Ma. This is an open-access article distributed under the terms of the Creative Commons Attribution License (CC BY). The use, distribution or reproduction in other forums is permitted, provided the original author(s) and the copyright owner(s) are credited and that the original publication in this journal is cited, in accordance with accepted academic practice. No use, distribution or reproduction is permitted which does not comply with these terms.
*Correspondence: Yong Kun Ma, bWF5b25na3VuQHVqcy5lZHUuY24=; Salam A. Ibrahim, aWJyYWgwMDFAbmNhdC5lZHU=