 Ernest Obeng Chuku
 Steven Allen Rust1
 Gregory George Smith
 Andrew James Trotter
- 1Institute for Marine and Antarctic Studies (IMAS), University of Tasmania, Hobart, TAS, Australia
- 2Australian Nuclear Science and Technology Organisation, Lucas Heights, NSW, Australia
The Pacific oyster is prominent in global food security and the blue economy. As an unfed aquaculture species, the oyster offers substantial potential to contribute to United Nations Sustainable Development Goals related to hunger, health, and employment. By capitalising on its biophysical attributes, the industry can enhance production efficiency and economic sustainability. This study advances critical insights into commercially important biophysical traits of the Pacific oyster across its supply chains in southern Australia (South Australia and Tasmania). Applying quantitative analysis to qualitative data using proportional odds logit modelling, reflexive thematic analysis (with theme salience), Fleiss’ Kappa analyses, and a novel Industry-Acclaimed Trait Importance (IATI) Index, we identify non-specific survival, uniform growth, and shell integrity (hard, dense, and less chalky) as primary determinants of production success. The meat quality, shell appearance, and size consistency are also of prime importance for marketability. Notably, we discover the shell, which is not eaten and often overlooked in the oyster production economy, as a critical factor impacting 78% of identified biophysical traits, revealing a potential avenue for production and sales optimisation. By delineating the characteristics of a model oyster, we provide a blueprint for selective breeding and farm management practices to enhance product quality and foster sustainable Pacific oyster aquaculture.
1 Introduction
Global food insecurity is increasingly apparent, partly due to expanding human populations and a nexus of global environmental and socio-political phenomena but also notably due to inefficiencies in the food production and consumption process (Smil, 2004; Alexander et al., 2017; The Economist Group, 2022). Innovations in aquaculture can enhance production efficiency, accelerating efforts to mitigate the depletion of wild-harvest food resources and better safeguarding economic and environmental sustainability. Here, we focus on Pacific oyster aquaculture in Australia to explain the intricacies of production and marketing that are fundamentally dependent on the biophysical traits of the oyster.
Already, oyster aquaculture produces approximately six million tons of seafood, accounting for 9% of global marine and coastal aquaculture and 35% of mollusc production in 2020 (FAO, 2022). In Australia, oysters dominate mollusc aquaculture, contributing 69% of the total output in 2021 (Tuynman and Dylewski, 2022). As an unfed aquaculture species, it holds significant potential to contribute further to sustainable food production from the ocean. However, the Pacific oyster has faced production setbacks globally from unfavourable environmental conditions (disease) and limitations on production expansion due to competition for coastal space, which has consequences for the economic sustainability of the industry and food security (Barbosa Solomieu et al., 2015; Petton et al., 2021; Schrobback et al., 2021; Mazaleyrat et al., 2022; FAO, 2023). To sustain the growth and overall success of Australian aquaculture, developments are underway to improve farming technology and production inefficiencies and to cope better with market volatility (Schrobback et al., 2021; FAO, 2023).
The success of aquaculture depends on various production and market factors that affect profit (Adams et al., 2001; Zhang et al., 2009). Greater production amplifies economies of scale, lowering the average cost per unit of output and increasing profit margins (Hossain et al., 2022). Achieving a balance between increasing seafood availability and affordability, consumer satisfaction, and profitability requires optimising production across a multifaceted interplay of site selection, husbandry, farming systems, and selective breeding. The biophysical traits of the oyster are intrinsic to farming success and successful trading of production. These traits can be a complex array of biological and consumer-preferred traits.
However, to date, there is no comprehensive account of the most economically important biophysical traits of the Pacific oyster for aquaculture in Australia and other countries where this species is farmed. The best available data is fragmented and targeted towards specific traits, such as shell colour (Ky et al., 2017; Stenger et al., 2019), shape (Rankin et al., 2018; Mizuta and Wikfors, 2019), meat quality (Yuan et al., 2023), sensory attributes (Pennarun et al., 2002; Turchini et al., 2004; Aaraas et al., 2006; Songsaeng et al., 2009; Buzin et al., 2011; Fratini et al., 2012), and consumption safety (Ortega et al., 2011; Loose et al., 2013; Wongprawmas and Canavari, 2015; Kecinski et al., 2017; Li et al., 2017). A clearly defined model Pacific oyster would provide a benchmark for all aspects of farming and could be used to guide innovation in supply chain nodes, including farm management practices, quality standardisation, freight and cold chain management, and breeding toward economic sustainability and future food security. Yet, such a model oyster does not exist.
Our study identifies and examines this model oyster from a production and sales standpoint and with a southern Australian aquaculture industry context, drawing on extensive insight from stakeholders at multiple stages. We assess the importance of the biophysical traits to enhancing production and maximising sales of the Pacific oyster from producers (hatcheries, farmers) and traders (wholesalers, retailers, and chefs/restaurateurs). We gain an in-depth yet simplified insight by developing an Industry-Acclaimed Trait Importance (IATI) Index through a novel combination of Proportional Odds Logit Models (POLM; McCullagh, 1980; Agresti, 2019), Fleiss’ Kappa Analysis of concordance (Fleiss et al., 2003), and our theme salience metric from an extended Reflexive Thematic Analysis (RTA; Braun and Clarke, 2022; Byrne, 2022).
2 Methods
2.1 The survey
For a comprehensive insight into the economically sustainable biophysical traits of the Pacific oyster, we interviewed key stakeholders (farmers and traders) of the industry in southern Australia (South Australia and Tasmania) using a quasi-structured questionnaire (i.e., in-depth key informant interviews). These states are Australia’s primary Pacific oyster-producing jurisdictions and comprise almost all of the country’s output of Pacific oysters in most years (Tuynman and Dylewski, 2022). The questionnaire was designed with expert inputs from Australian Seafood Industries (ASI) – an industry-led collective established to undertake the selective breeding program for the Australian Pacific oyster. The existing structure of the Pacific oyster supply chain in Australia provided a basis for categorising respondents as producers (input and production) and traders (wholesale and retail) while considering processing and consumption as cross-cutting segments (Schrobback et al., 2021; Schrobback and Rolfe, 2021). Relevant oyster traits were identified both in the literature and during industry consultation on the questionnaire design. These were categorised into production- and market-related traits, and questions were formulated about their contribution to losses, enhancing production output, and maximising the volume of sales.
A stratified random sampling technique guided the recruitment of stakeholders from southern Australia, as well as an open solicitation to industry collectives, including Oysters Tasmania, Oysters Australia, and the South Australian Oyster Growers Association, coupled with web searches for traders/restaurateurs. Emails, telephone calls, and walk-ins were employed to reach out to the identified individual participants pursuant to the approved protocols on advertisement and inclusion criteria. All participants consented to partake in the study by signing a written consent form before an interview schedule and giving verbal consent during the interview. Participants were above 18 years of age and were involved in the production or handling of Pacific oysters. Thirty-four participants, each representing a unique Pacific oyster business entity, were interviewed over the period of June 2021 to November 2022. These stakeholder groups (Supplementary Table 1), by their location and segment of operation, represent a diverse range of experiences throughout the supply chain. Interviews were conducted both online via Zoom Conferencing and in person. Interviews were recorded live and subsequently text-transcribed manually and collated via a digital data collection system by the lead author.
Recruitment was inadvertently prolonged by a combination of restrictions on person-to-person interactions in response to the COVID-19 pandemic in 2021, as well as the schedules of the target respondents compounded by the time commitment to complete each interview (average of 45 min for traders and up to 1 h for producers), and a generally low response rate from traders. Participants were offered non-enticing compensation, and recruitment continued until a sufficient number of responses was reached from the pool of 74 trading and 44 producer businesses shortlisted. Ethical approval for the study was granted by the University of Tasmania Human Research Ethics Committee (Project ID 24815).
2.2 Data and analytical techniques
A mix of analytical methods was applied due to varying response data types elicited from the interviews – in-depth verbal responses and ranking of traits. A deidentified summary of stakeholders’ background information can be found in Supplementary Table 1. There were 34 respondents in total (All Producers = 22; All Traders = 20; Producer only = 14; Trader only = 12; Producer-Traders = 8). ‘All Producers’ and ‘All Traders’ included respondents engaged in production and trading, respectively, whereas ‘Producer only’ and ‘Trader only’ respondents were exclusively into production or trading, respectively. ‘Producer-Traders’ engaged in both production and trading. A summary of variables used for the proportional odds logit models is presented in Supplementary Table 2.
2.2.1 Proportional odds logit modelling
Proportional odds logit models (POLMs) were developed to explain the responses to Pacific oyster trait rankings (ordinal responses) across State and supply chain segments with R program version 4.3.1 using R Studio 2023.09.1 [Build 494 © 2009–2023 Posit Software, PBC “Desert Sunflower” Release (cd7011dc, 2023-10-16) for macOS]. POLM was used due to its statistical appropriateness and superiority for analysing ordinal outcomes (McCullagh, 1980; Allison and Christakis, 1994; Agresti, 2019). Drawing on the random utility framework that underlies the standard multinomial logit model (McCullagh, 1980), we assumed that an industry stakeholder (respondent) faces the choice of placing a trait on the lower or higher end of an ordinal scale with categories, be it by raking or agreeance, as presented in the questionnaire. Let be the rank or agreeance assigned to a trait ( by respondent . Suppose the magnitude of the importance assigned to a trait by the respondent is driven by the utility ( ) derived from that trait, then the measure can be expressed as a sum of a measurable and random component (Equation 1). In this case, a respondent’s greater ranking of or agreeance to trait than trait is then occasioned by .
is theorised as the importance value respondent places on a specified TRAIT over others. has an extreme value (Gumbel) distribution, and is independent and identically distributed, which implies a resultant logit model (Allison and Christakis, 1994). Thus, for ordinal categories assigned to a set of traits, we estimated a parsimonious logit (the POLM) that simultaneously integrates all cumulative binomial logits, with each cumulative logit having its own intercept , and for which is the cumulative probability of less than or equal to a specific category . is the maximum likelihood parameter estimate for a specified trait (Equation 2). In this model, is assumed to be invariant with , and with the same effect of for each cumulative logit (McCullagh, 1980; Allison and Christakis, 1994; Agresti, 2019). The proportional odds assumption was checked with the Brant-Wald test (Supplementary Table 3) and an accompanying graphical assessment of the linear predictions from the POLM (provided in the codes) and adjudged satisfactory for the model application.
For each individual stakeholder interviewed, the likelihood function based on Equation 2, where are binary indicators of the stakeholder’s response, was:
Equation 2 is interpreted as the log odds of respondents assigning lower categories than higher categories to a trait. The function from the package (Ripley et al., 2023) employed for the POLM in R has a specification with cumulative distribution function of the form for the latent variable resulting in the linear predictor instead of As a result, the model interpretation presented in this paper is inverse, that is, the log odds of assigning higher categories of the ordinal outcomes than lower categories. Odds were estimated by raising and its bias-reduced variant where the former produced extreme odds. is the estimated variance for
2.2.2 Fitting the Pacific oyster trait POLMs and handling interaction terms
Three models each were compared in a restricted modelling procedure to select the best POLM for production-related and market-related traits (General market traits = Mktrait;Ideal shell shape = Shp;Premium shell colour = Col) of the Pacific oyster using likelihood ratio tests (Supplementary Table 4). Model 1 was the simplest with only as the predictor, Model 2 had the predictors and either or and Model 3 included respective interaction terms. Model 3 was selected because there was enough evidence to determine an interaction of model terms, at least at the α = 10% level. Because the predictors in the model are all categorical with more than two categories, except for , the estimates for the interaction terms had indirect interpretations. We address this by concatenating the two variables in the interaction term to form a single predictor variable (e.g., “State|Pdtrait”) in an alternative model to Model 3, presented as Model 4. The parameter estimates and effects for Model 3 and Model 4 were identical (see, for example, Supplementary Figures 1, 2). Hence the final POLMs were formed by replacing in Equation 2 with the concatenated variables to give Equations 3–6:
In the expanded model summaries shown in the results section, the first columns are the predictors (model terms/variables), the second columns contain the maximum likelihood estimates or slopes with standard errors in parenthesis, and the corresponding significances from p-values are shown in the last columns. Note that these significances are only in contrast with the omitted variables ( . Other contrasts were estimated as the difference in with associated p-values using the function from the Estimated Marginal Means package (Lenth et al., 2023) in R. The model summaries also show intercepts ( ), which, in practice, represent the binomial models constrained to have the same slope for the predictors. Generally, the intercepts are not of great interest in interpreting the model but were used in calculating the probabilities of assigning each rank to a trait. The goodness-of-fit parameters are also presented at the bottom of the tables. The predicted mean ranks for each trait were also presented in this article for easy comprehension.
2.2.3 Fleiss’ kappa analysis of concordance
Fleiss’ Kappa ( ; Fleiss et al., 2003; Equation 7) was applied to measure the concordance (inter-rater agreement) among stakeholder groups (raters) in their importance ordering of Pacific oyster biophysical traits from the POLMs. The analysis was implemented in R program with the function from the package (Matthias Gamer and Matthias Gamer, 2022). The measure of concordance allowed for an empirical inference of industry-wide (inter-rater) coherence in importance rating (rank ordering) of the biophysical traits, on a scale of . The results were examined at three levels; the overall concordance on production-and market-related traits, the coherence between pairs of industry stakeholder (supply chain) groups for the market-related traits, and the concordance on specific traits, presented in Supplementary Table 5. The higher the , the greater the coherence, and vice-versa. Positive values show harmony, whereas negative values indicate conflicting coherence in the ordering of all traits or positioning of a specific trait among raters.
Where, = the proportion of observed agreement, and.
= the proportion of chance-expected agreement.
2.2.4 Reflexive thematic analysis and estimation of theme salience
A six-stage reflexive thematic analysis (RTA; Braun and Clarke, 2006, 2022; Byrne, 2022) using the NVivo software [version 1.7.1(4844)] coupled with our arithmetic estimation of theme salience was used to analyse qualitative responses. Here, themes were generated from text transcripts of verbal responses from producers to the question of how specific shell traits such as brittleness, closure, hardness, and thickness contribute to losses during the production and harvesting of the Pacific oyster. Producers particularly suggested that these shell traits were essential for productivity during production and harvesting at the industry consultation phase of the questionnaire development.
The RTA process involved an initial familiarisation with the complete text from all responses, followed by a systematic data coding stage where 51 unique code references were identified. The codes were synthesised for themes which were reviewed and refined. Six high-level themes emerged as the most referenced issues by the producers for each shell trait assessed. Additionally, the coding process yielded two important numerical frequency data for each theme: the total number of references, which reveals the stress on a theme, and the number of respondents, which reveals the spread of a theme. We, therefore, extend the RTA with a reference intensity (or theme salience) metric to enable deeper comparative reflection on the salience of the emerging themes, which we find to be robust and quantitatively more verifiable, using Equation 8.
Where, = the intensity of reference to a theme (theme salience),
= the relative frequency of references to a specific theme,
= the relative frequency of respondents referring to a specific theme,
The reference intensity (theme salience) equation can be further expanded as
where, = the frequency of references to a specific theme,
= the sum of the frequencies of references to all identified themes,
= the number of respondents referring to the specific theme, and.
= the total number of respondents answering the question.
2.2.5 Industry-acclaimed trait importance index
An Industry-Acclaimed Trait Importance (IATI) index was developed from (i) the theme salience on shell-specific traits from the RTA, (ii) the parameter estimates on traits from the POLMs, and (iii) the Fleiss’ Kappa ( ) values on traits. Four stages of numerical iterations were applied to standardise (i and ii). Initially, a listing and grouping of all traits and the assignment of corresponding trait importance estimates (“param”) was completed. For the shell-specific traits group, param was a sum of for all identified themes in the RTA for each trait. For production-and market-related trait groups, param was an average of the parameter estimates from the POLMs, across State and supply chain segments, respectively. Secondly, each param was scaled down as a ratio of the absolute total params in each trait group (“paraSUM”). And subsequently as a ratio of the average paraSUMs (“paraAVG”). Thirdly, adjusted trait importance values were calculated by raising , similar to the odds estimator (“O.param.adj”). Lastly, trait groups with low O.param.adj values (shell-specific traits, market-related traits, and colour) were adjusted by a factor of 10 to improve the visibility of the graphed values. The IATI index for each trait was then computed as . Note that k values for shell-specific traits were taken to be the average k for brittleness, cup depth, and hardness (=0.0427). A stack bar plot was used to visualise the level of trait importance O.param.adj and the inter-rater agreement k on the established importance. The data generated is included in Supplementary Table 6.
3 Results
3.1 Importance of biophysical traits in Pacific oyster production
The Pacific oyster industry acclaimed highly the importance of survival, disease resistance, and uniform growth to production success (Figure 1). However, there was heterogeneity in the importance of production-related biophysical traits among South Australian and Tasmanian producers. We found that Tasmanian producers prioritise high non-specific survival and disease resistance, placing both traits in the number one position out of the six production-related traits ranked (Table 1). The corresponding maximum likelihood estimates, however, imply a marginal difference of 27% higher odds in favour of high non-specific survival over disease resistance. Uniform growth would emerge as the third most important trait for Pacific oyster production in Tasmania, with 371% higher odds of influencing production success than the only other growth trait listed, fast growth (Table 2).

Figure 1. Adjusted trait importance and corresponding cross-industry agreement for the assessed Pacific oyster traits in southern Australia. The two parameters are used in the computation of an Industry-Acclaimed Trait Importance (IATI) index for each trait. The chart area with negative scales has a lighter shade and depicts low relative adjusted importance (O.param.adj.) and disharmony in the industry’s agreement on the trait importance (Fleiss’ Kappa). Comparisons are within trait groups.
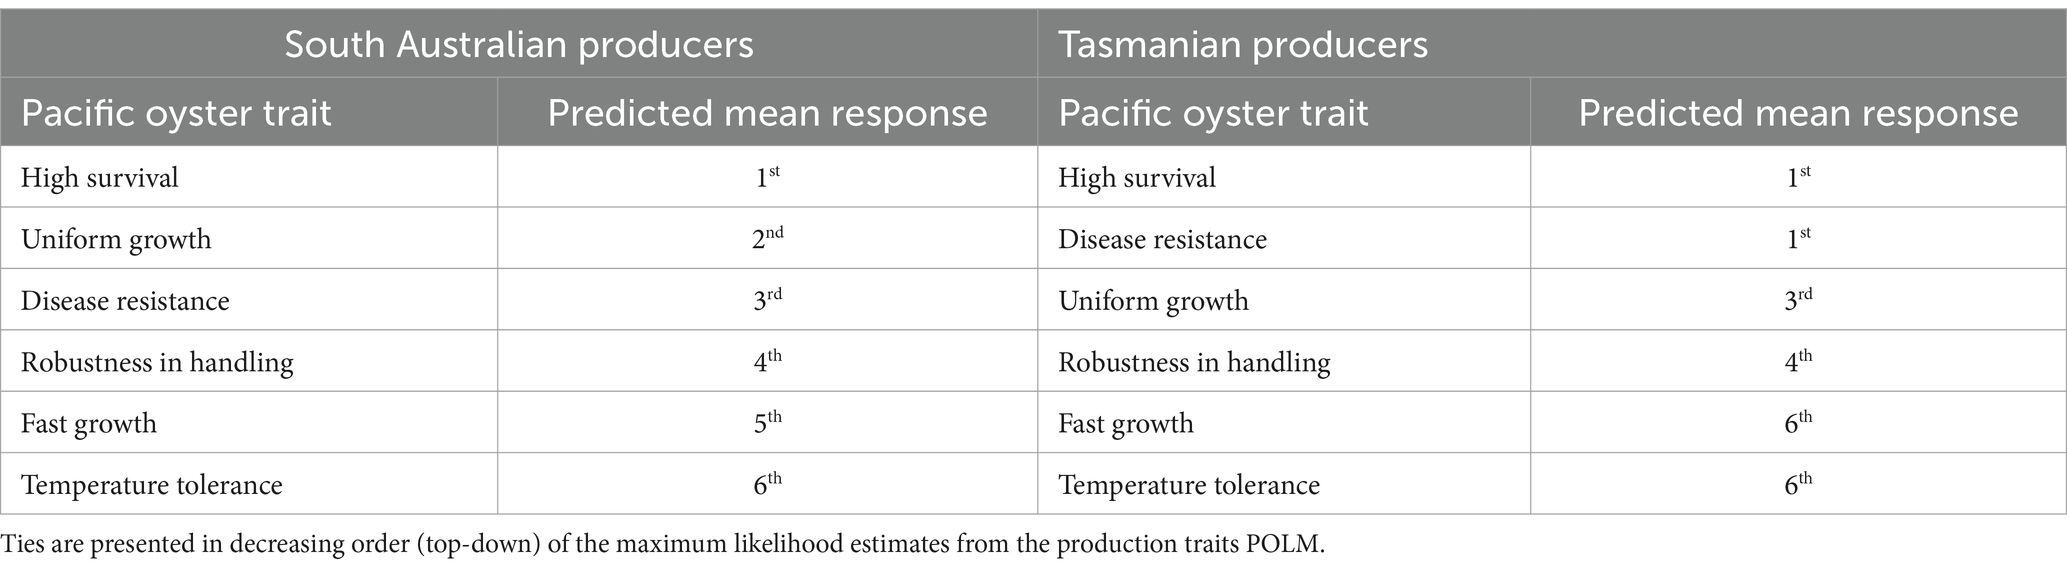
Table 1. Predicted mean ranks, in order of importance, of the assessed production-related traits of the Pacific oyster among South Australian and Tasmanian producers using the fitted proportional odds logit model (POLM).

Table 2. Proportional odds logit model for the effect of production-related traits of the Pacific oyster on enhancing production operations by importance ranking among South Australian and Tasmanian producers.
South Australian producers shared a similar experience of trait importance to their Tasmanian counterparts in relation to high survival being the topmost trait, albeit at a lesser conviction. The second important trait in South Australia was uniform growth rather than disease resistance, as was the case for Tasmanian producers, with 25% fewer odds of driving production success than high survival. Like Tasmanian producers, uniform growth was 490% more likely perceived as influential on production success than fast growth by South Australian producers. Disease resistance was ranked third, with 84% fewer odds than high survival to be considered to enhance production success. In both states, the robustness of the Pacific oyster in terms of physical handling, fast growth, and tolerance to wide temperature variations, in that order, had a lower likelihood of being perceived to impact production success. Nonetheless, South Australian producers had a greater leaning towards these three traits than Tasmanian producers.
3.2 Shell-specific production-related traits
Six themes emerged from the quantitative synthesis of the RTA of producers’ responses (Tasmania and South Australia combined) about the contribution of shell-related traits to either causing or avoiding losses during the production and harvest stages of Pacific oyster farming. These themes included discards due to shell damage, contamination of meat by shell fragments, loss of oyster liquid reducing freshness, mortalities during production, reduced shelf life during transportation, and increased susceptibility to environmental stress and predation. Producers were primarily concerned about losses from mortalities and discards, evidenced in their high reference intensity ( ) scores (we introduce this score as a metric for theme salience) in three of the four shell traits (Table 3). The IATI indices show superior acclaim for the importance of shell hardness/density and brittleness/chalkiness among the assessed shell traits. This is substantiated by producers’ preference for hard, dense, strong, and thick shells with a firm seal and less chalk and their aversion for soft, thin, and brittle shells, as well as excessively thick shells.
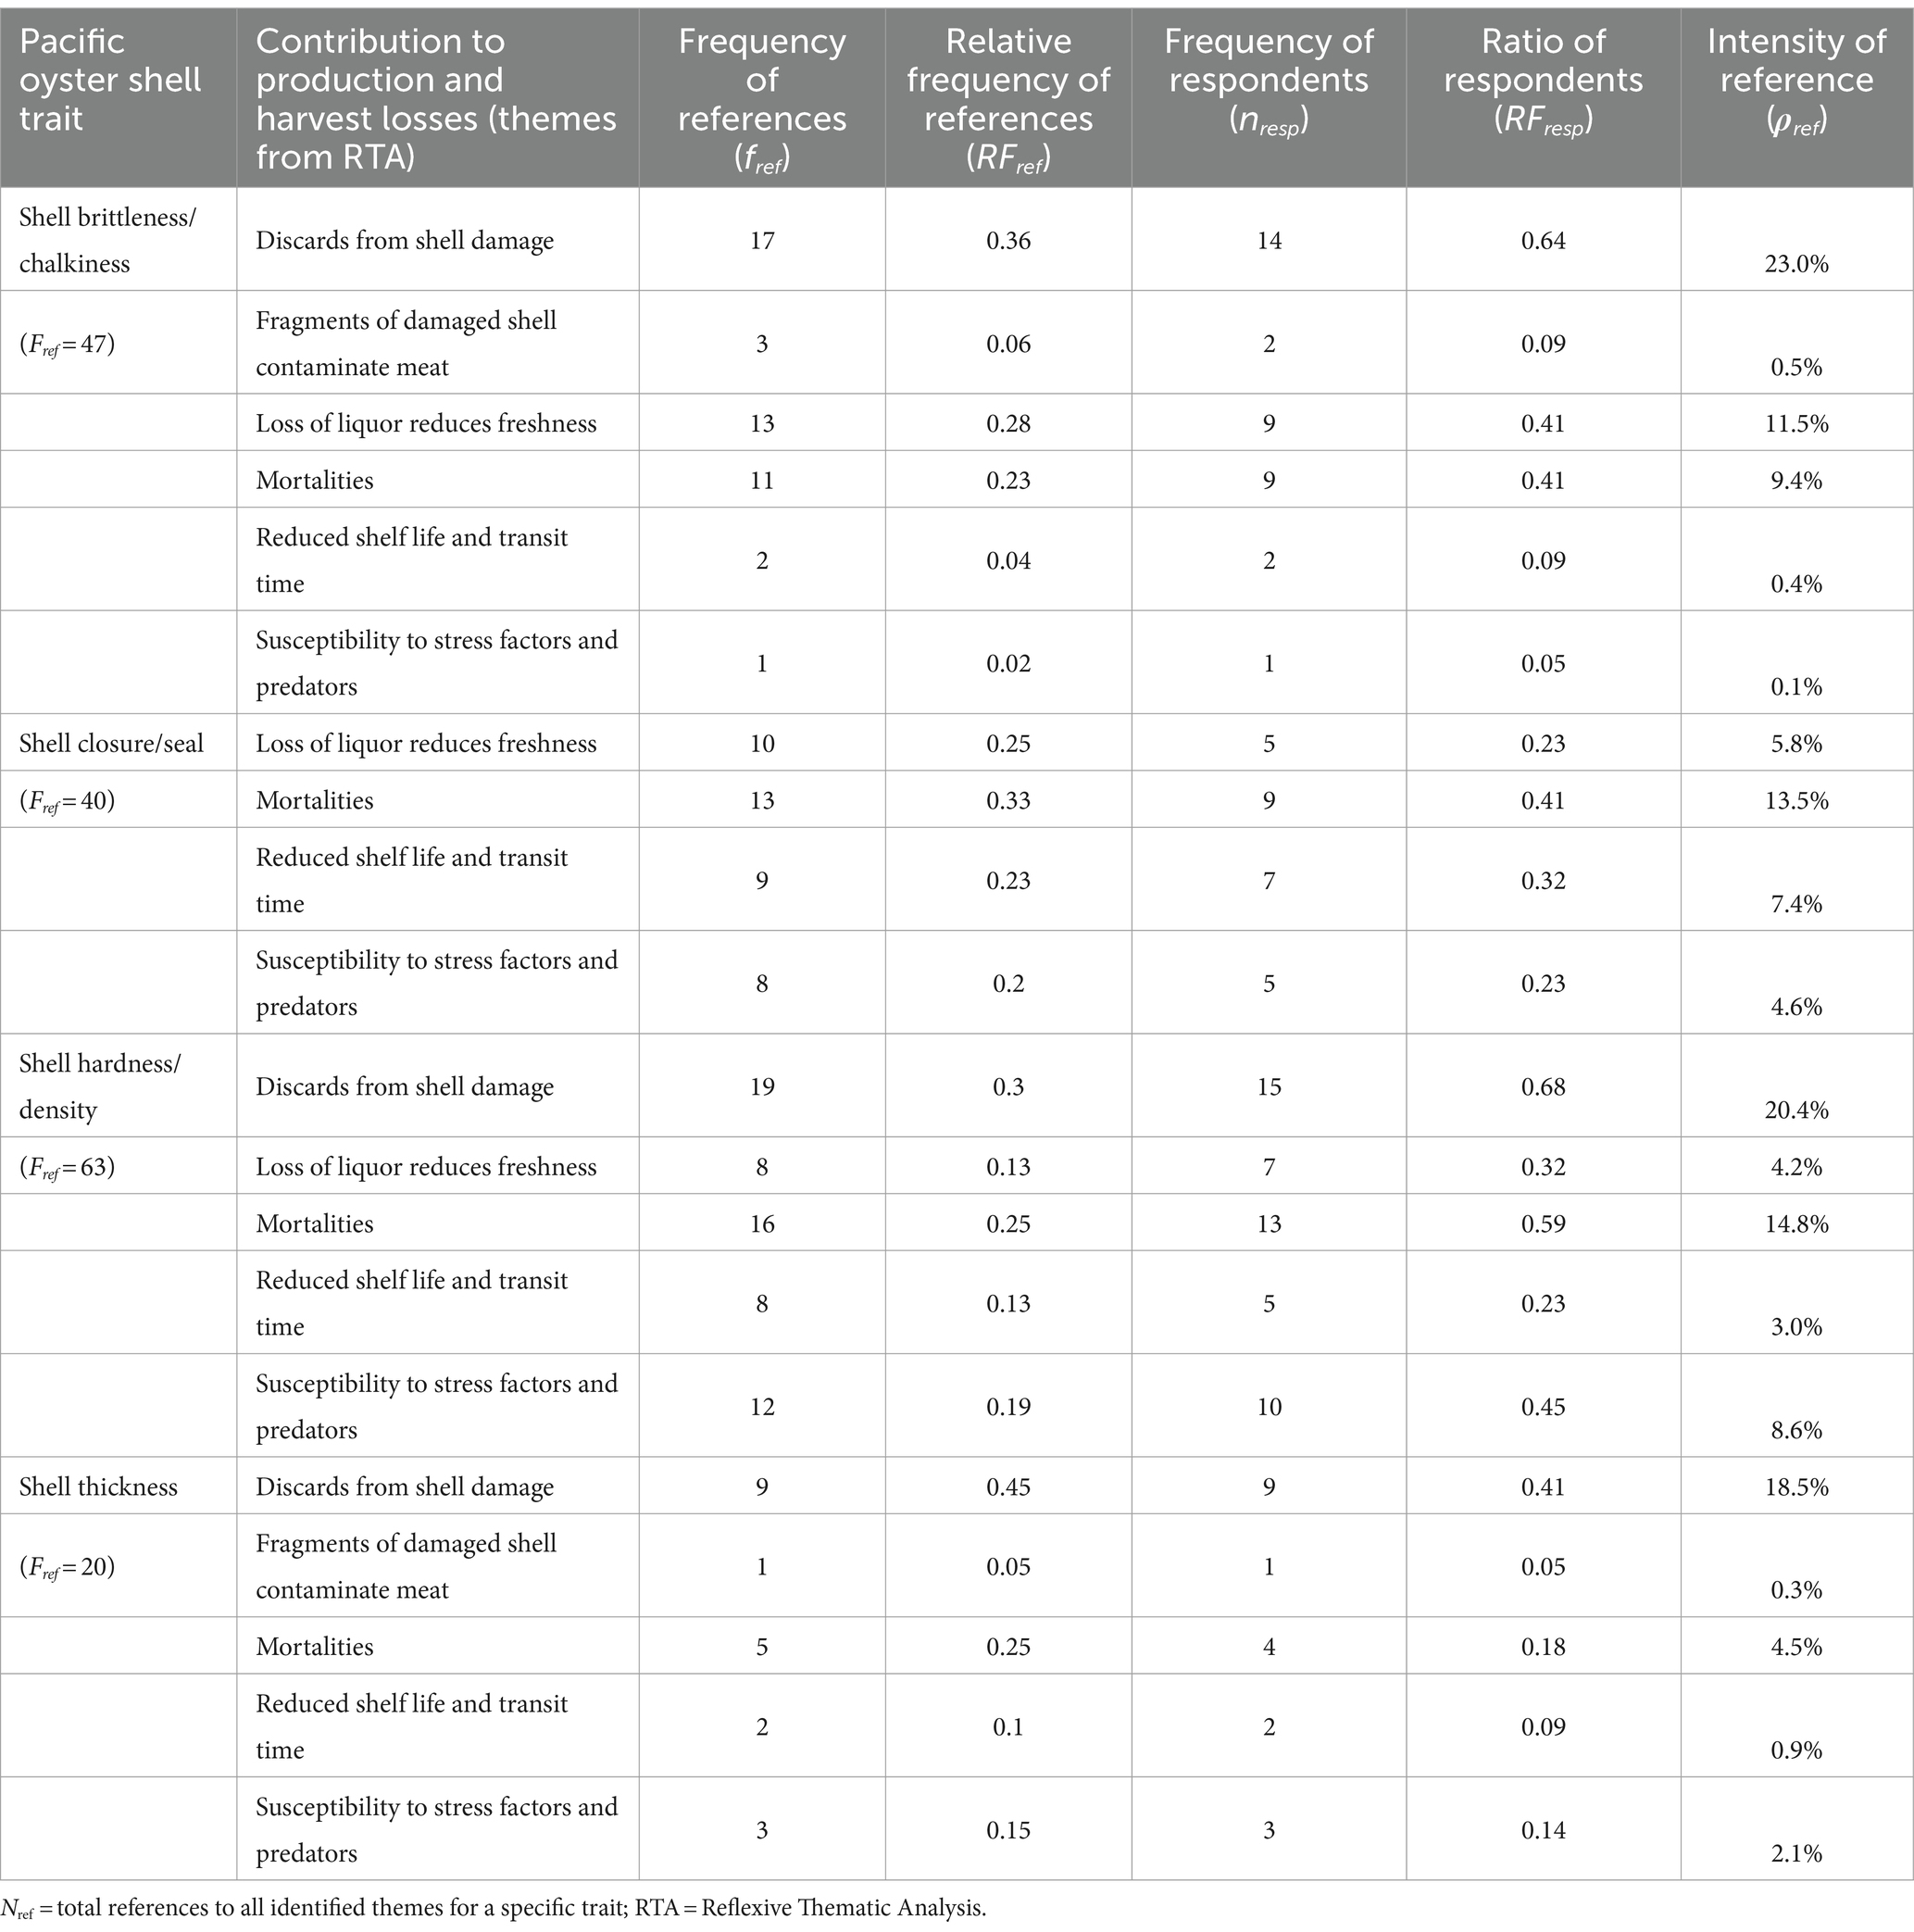
Table 3. Quantitative synthesis from the reflexive thematic analysis of survey responses from producers on the contribution of shell-related traits to losses during the production and harvesting of the Pacific oyster.
3.3 Importance of biophysical traits in Pacific oyster trading
3.3.1 General market-related traits
The ordered parameter estimates in the POLM for market-related traits show the top quarter of traits as meat quality indicators, followed by shell characteristics in the middle and sensory attributes in the bottom quarter. Meat quality traits were the most important in maximising sales volume, with meat condition, meat size, and meat-to-shell condition index having the highest agreement (Table 4; see predicted mean responses in Table 5). Meat condition had an exceptional IATI index compared to all other market-related traits (Figure 1). Insight from the survey showed the industry favoured a creamy, veined filling meat in the left shell valve with decent liquid/brine coverage.
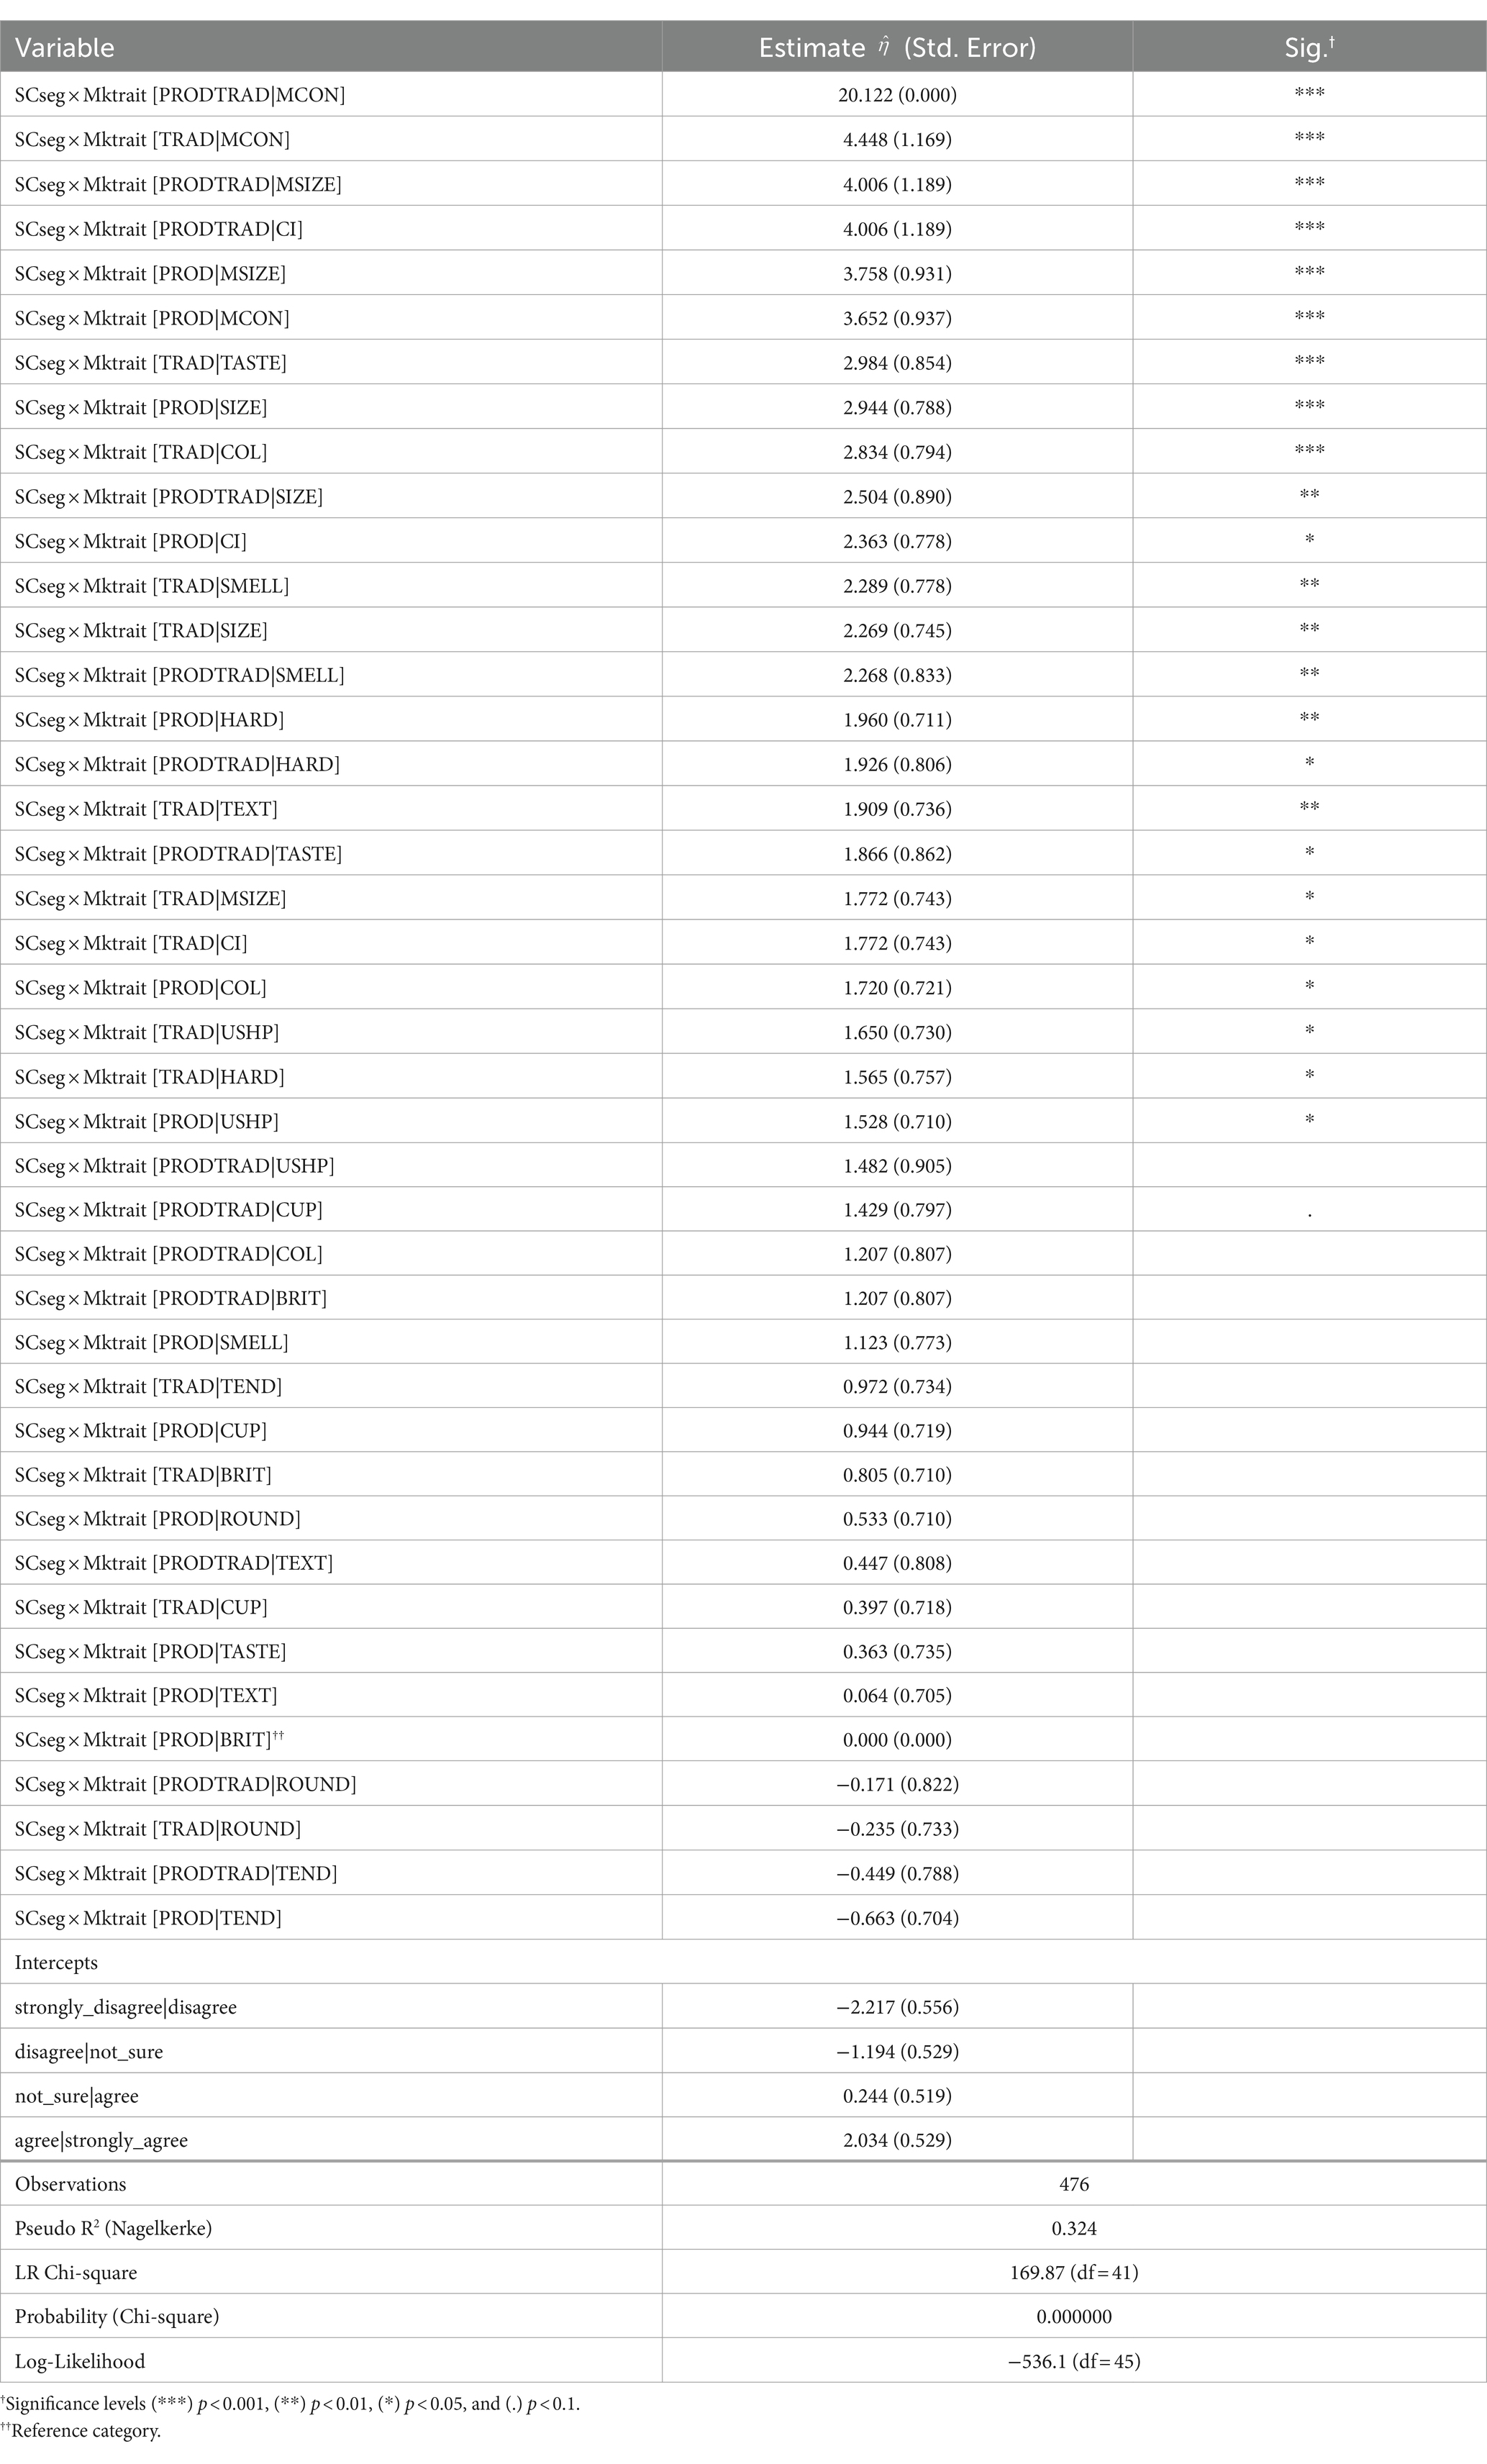
Table 4. Proportional odds logit model for the effect of market-related traits “Mktrait” of the Pacific oyster on maximising sales volume by agreeance among supply chain segment “SCseg” stakeholders.
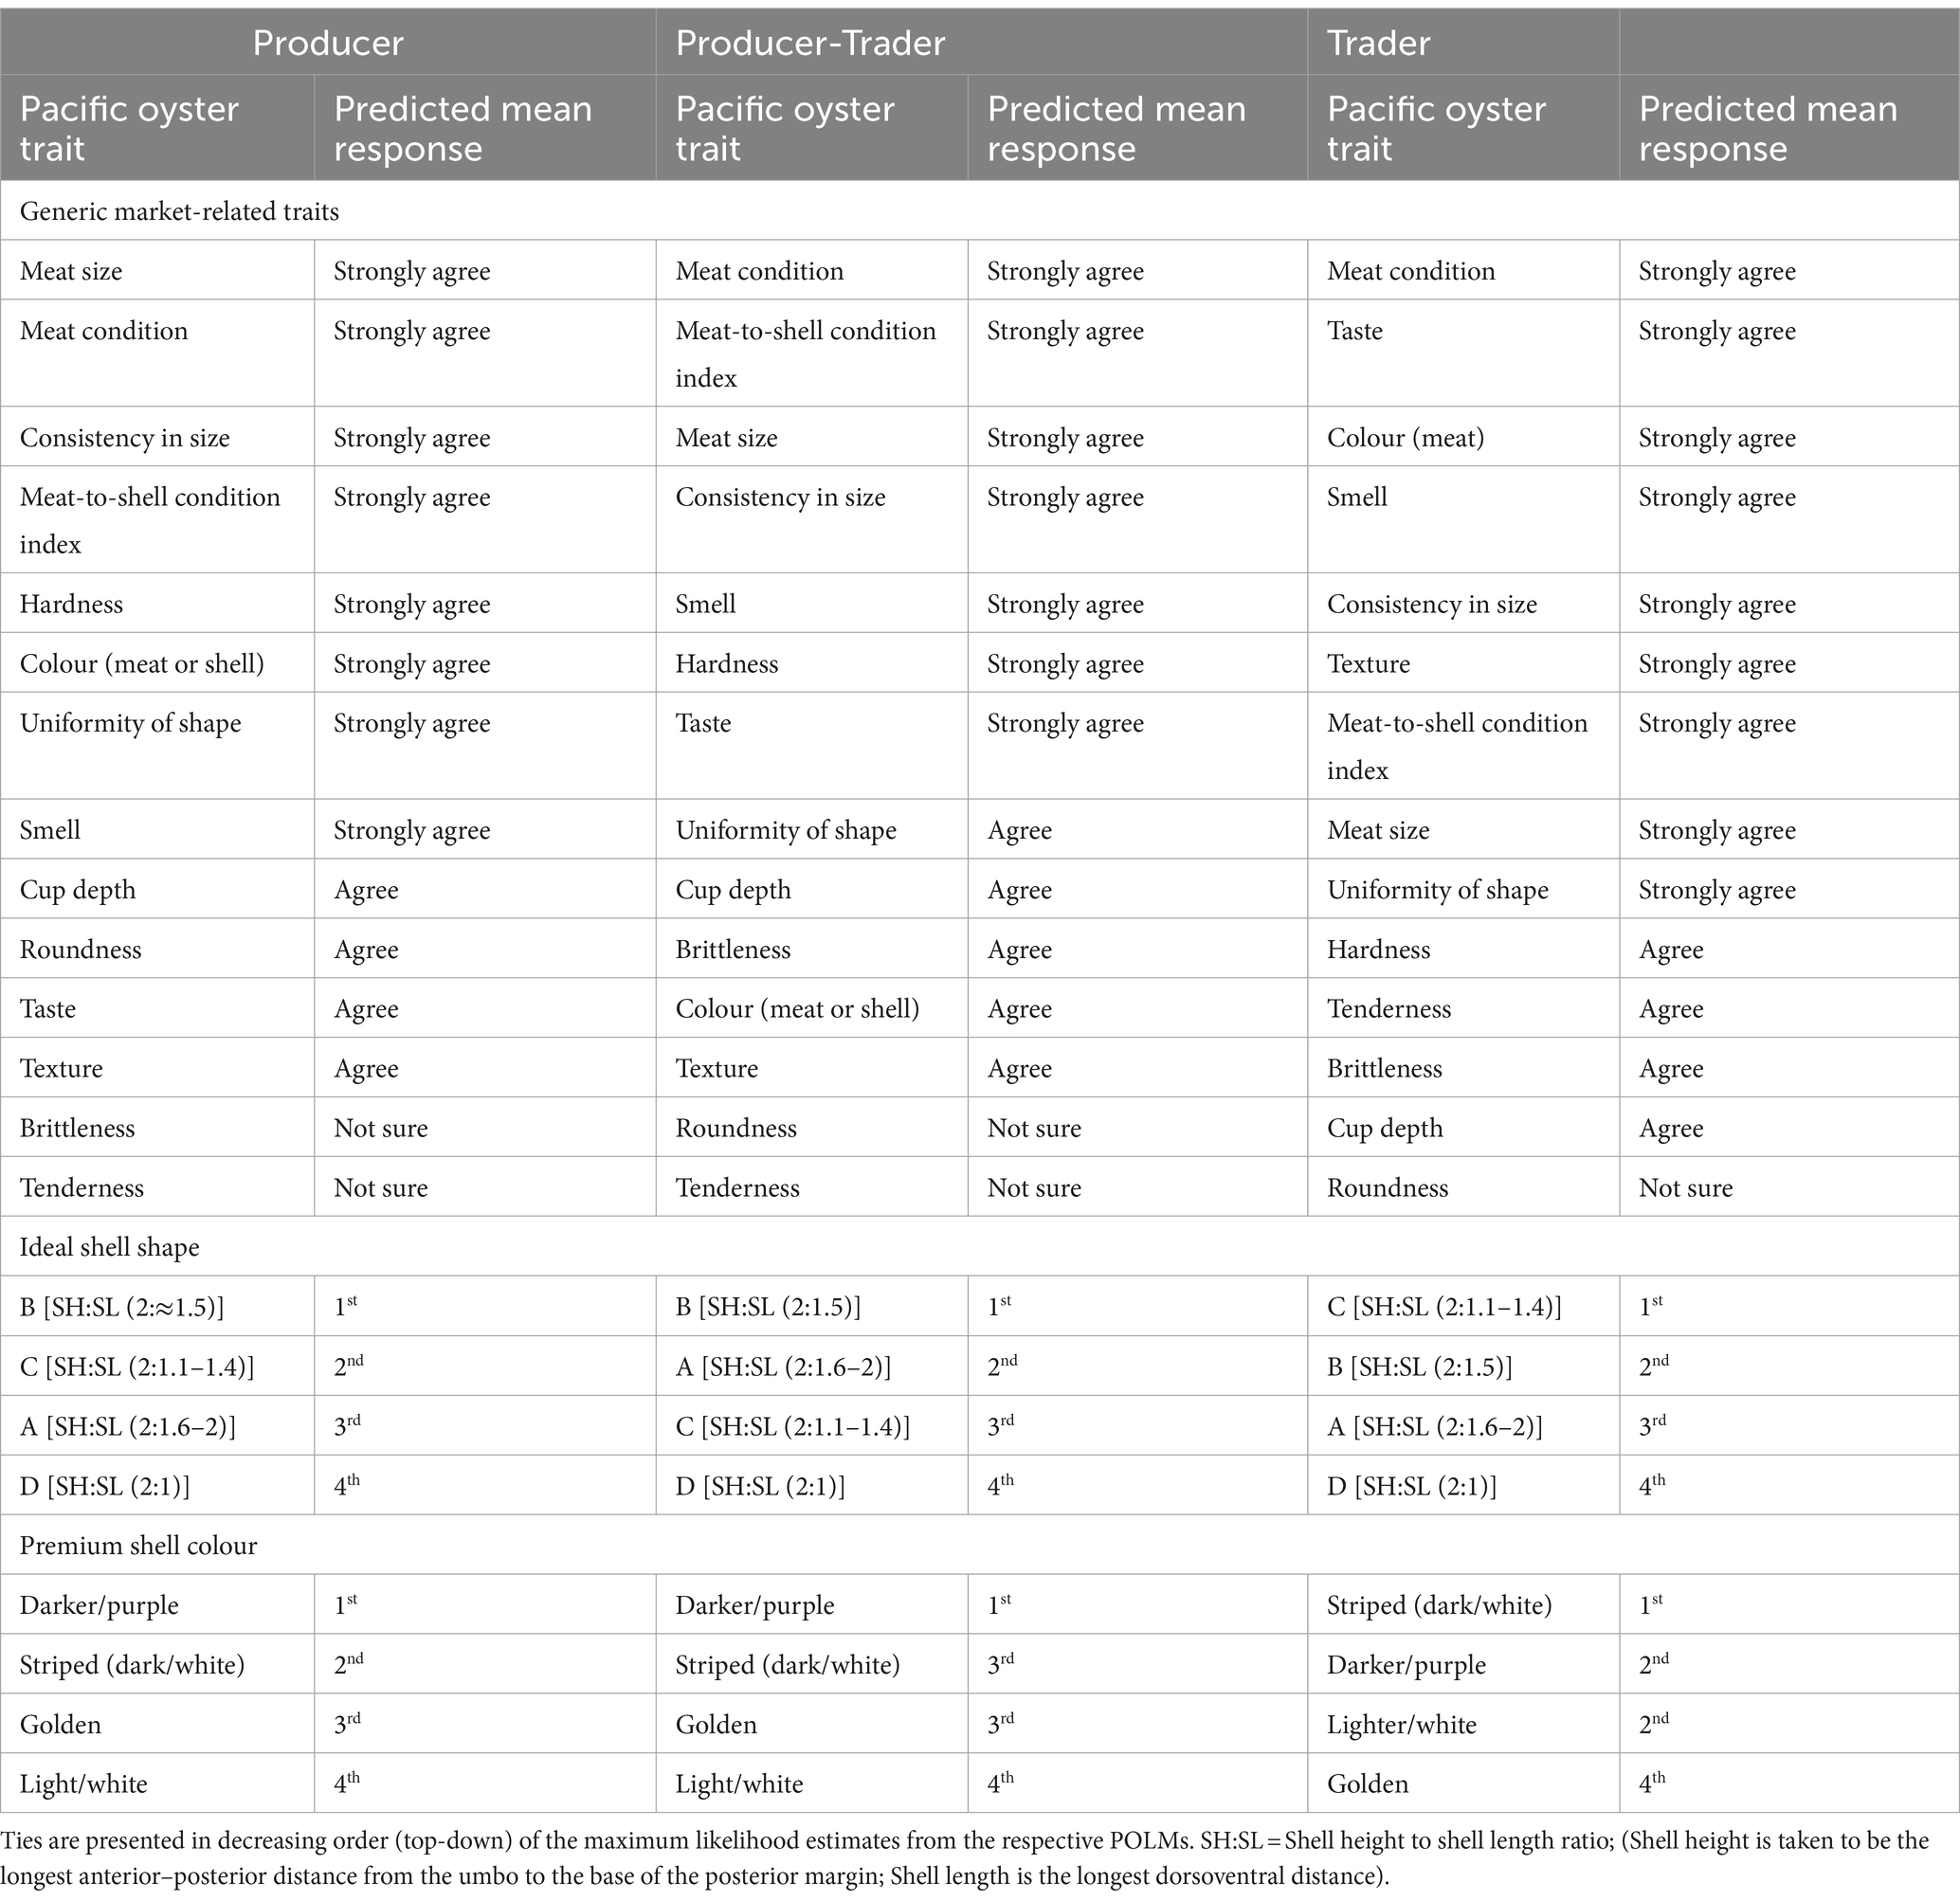
Table 5. Predicted mean responses, in order of importance (either by agreeance or ranking), of the assessed market-related traits of the Pacific oyster among supply chain segments using the fitted proportional odds logit model (POLM).
We find that consistency in size, shape, hardness, colour, cup depth, brittleness, roundness, and meat-to-shell condition index are essential shell traits in the marketability of oysters. Among these traits, the industry considered consistency in size to have the biggest impact on trade. Note that the meat-to-shell condition index was primarily a meat trait but intimately linked to the shell. Producers had a more positive view of the influence of size consistency on sales than producer-traders and traders (by 55 and 96%, respectively; Table 4). Hardness followed in importance, with both producers and producer-traders closely aligned on its importance for maximising the volume of oysters sold. Cup depth, brittleness, and roundness are likely to have little impact on sales, as indicated by all supply chains, especially traders (Table 5).
Traders and producers held contrasting experiences with the importance of colour. Traders tended to favour a noticeable contrast between the meat and a pearly white colour and darkened margins of the inner shell. On the other hand, producers believe that both the shell and meat colours are of equal importance. Consequently, while the exterior shell colour may significantly influence sales at the farmgate, the meat and inner shell colours could be more advantageous for maximising sales in restaurants and oyster bars. We observed a low industry acclaim for the importance of sensory traits in maximising sales. Among the sensory traits, taste stood out in its importance for sales maximisation, and this trait was popular amongst traders. Fifty per cent of the top six ranked traits for traders were sensory, whereas, for producer-traders and producers, this number was just 16 and 0%, respectively. Producer-traders and producers, the latter particularly, perceived smell to be more important than taste (Tables 4, 5).
3.3.2 Ideal shell shape
Of the four shell shapes (Supplementary Figure 3) assessed to represent the ideal shape of the Pacific oyster based on shell height (SH) and length (SL), Shape B (2SH:≈1.5SL) was the industry’s mainstay. Producers’ perception of the importance of Shape B was the highest among supply chain segments. Producer-traders were similarly inclined, whereas traders favoured Shape C (2SH:1.1–1.4SL). Shape D was the least likely to enhance Pacific oyster sales in all supply chain segments (Tables 5, 6).
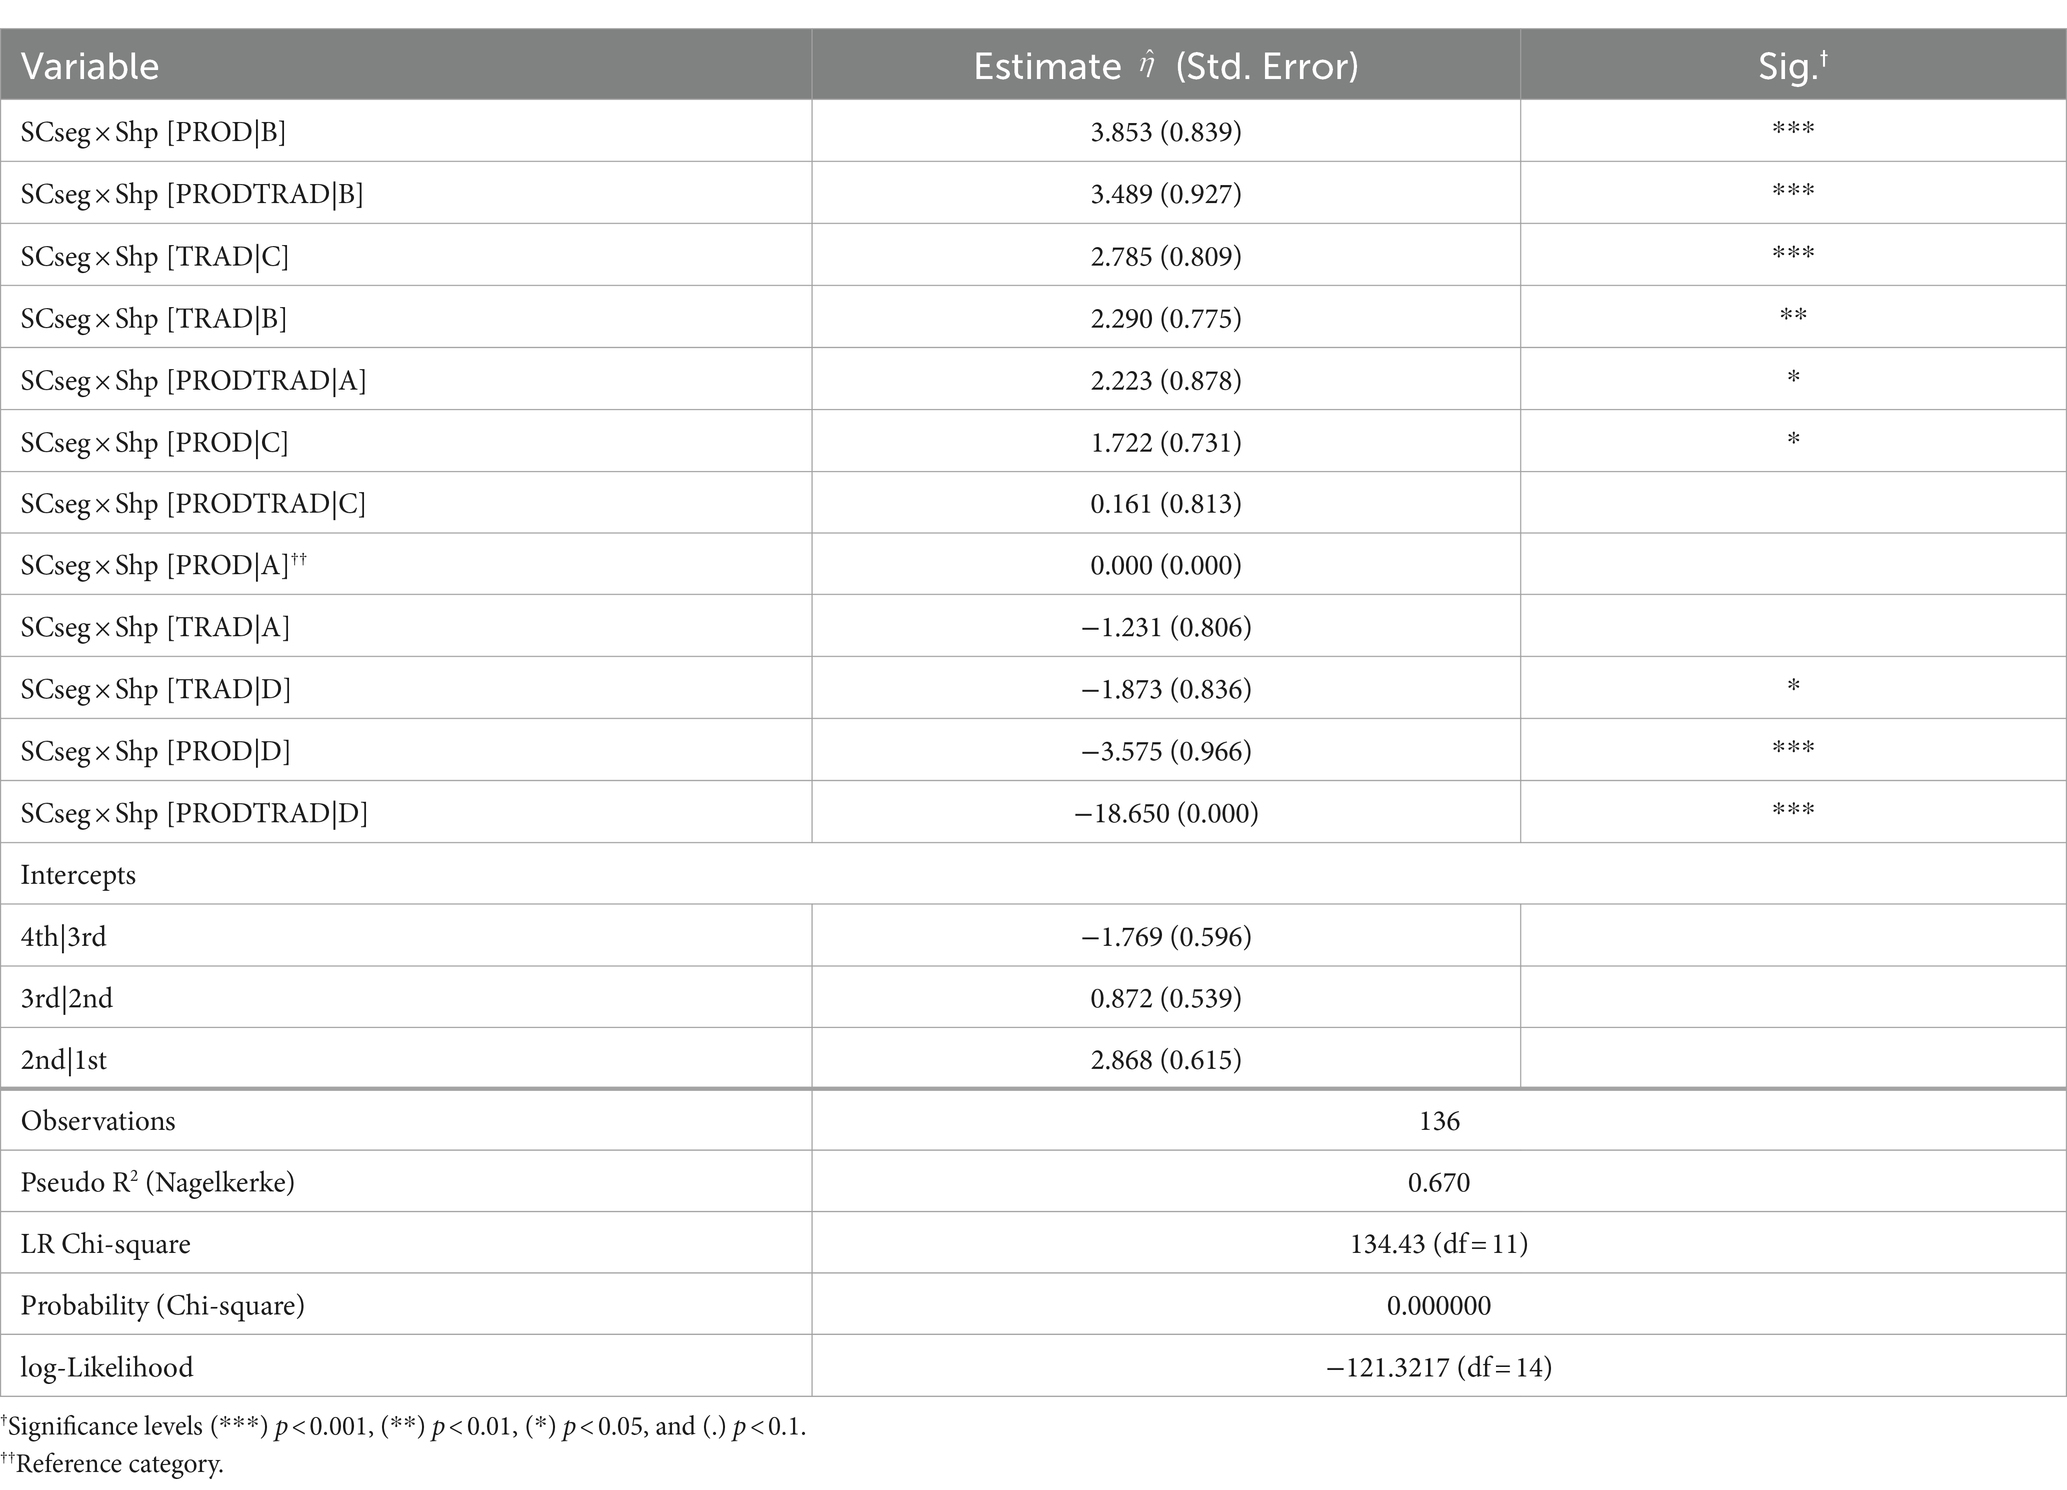
Table 6. Proportional odds logit model for the preferential ordering of ideal shell shape “Shp” of the Pacific oyster by agreeance among supply chain segment “SCseg” stakeholders.
3.3.3 Premium shell colour
The highest propensity of associating shell colour to premium price was demonstrated in producer-traders’ ranking of darker- or purple-coloured shells, followed by producers’ ranking of the same colour. Traders attached 58% less importance to darker- or purple-coloured shells but had a greater experience with the importance of striped (dark/light) shells. Lighter or white shells and golden oysters were generally placed lower than dark and striped shells in all supply chain segments. Producers associated lighter colours with poor growth and poor condition of the oyster. Respondents engaged in production preferred golden oysters compared to lighter/white-coloured oysters. Producer-traders particularly had experience attracting premium prices for golden oysters in farmgate retailing. Traders believed the opposite with greater conviction (Tables 5, 7).
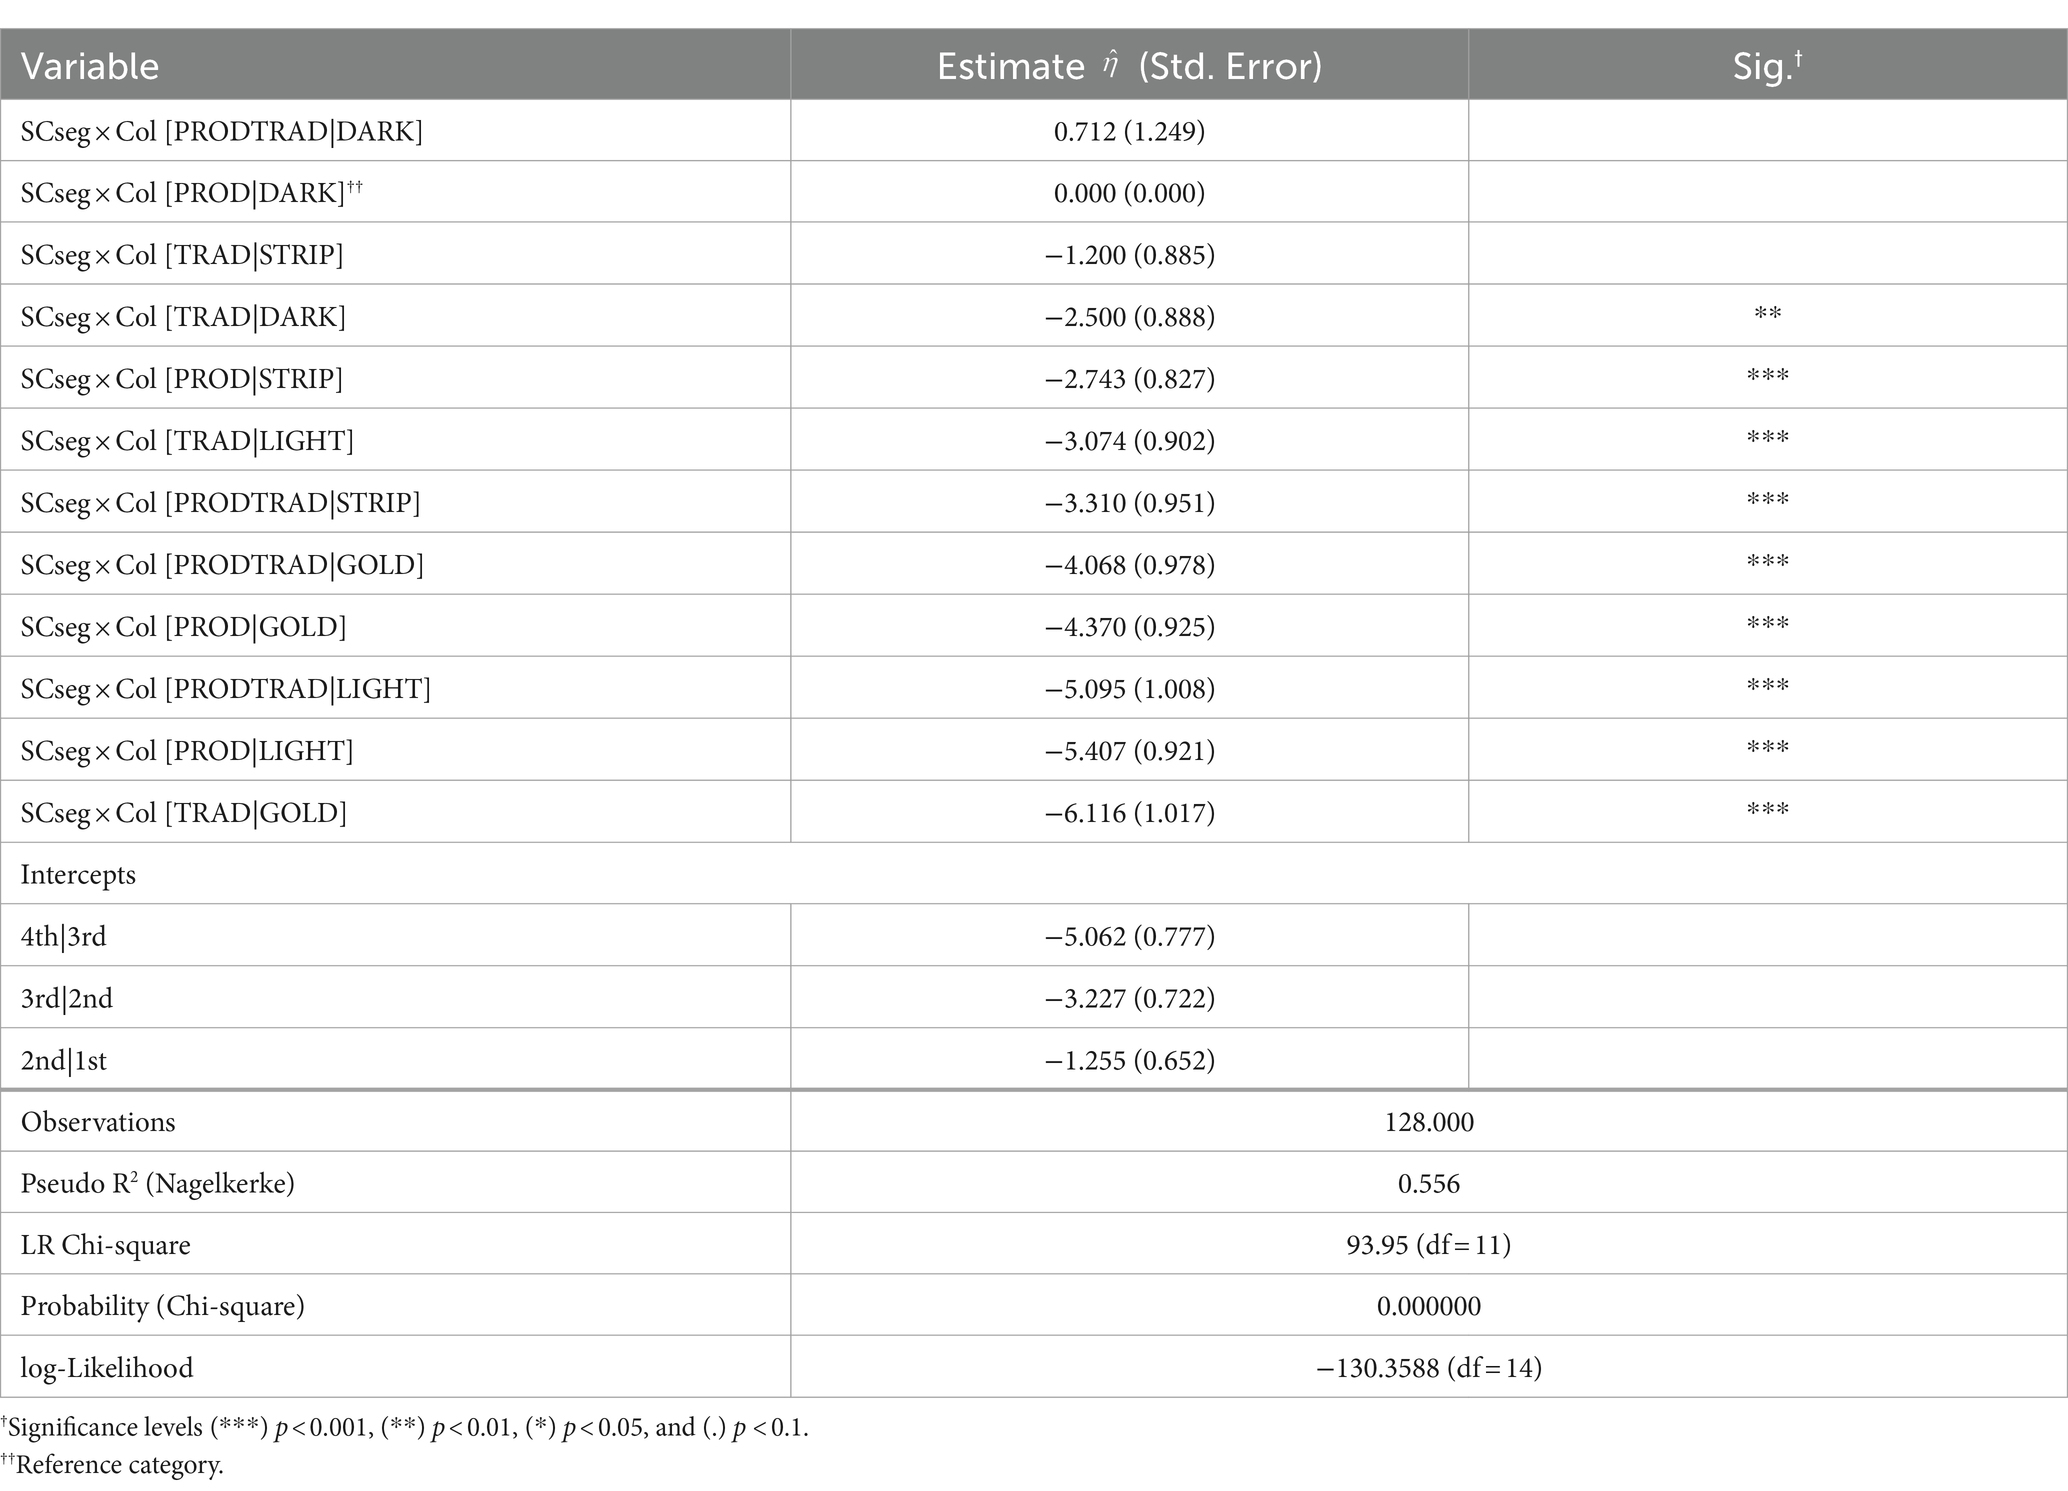
Table 7. Proportional odds logit model for the effect of shell colour “Col” of the Pacific oyster on attracting premium price by importance ranking among stakeholders of the supply chain segments “SCseg.”
3.4 The shell’s interrelation with farming and marketing of Pacific oysters
Seventy-eight per cent of the biophysical traits assessed were found to be shell or shell-connected traits. They include shell-specific traits (closure/seal, brittleness/chalkiness, density/hardness, thickness), production-related shell traits (fast growth, high survival, robustness, uniform growth), market-related shell traits (brittleness/chalkiness, colour, meat-to-shell condition index, cup depth, meat size, roundness, shell hardness, size consistency, uniform shape), shell shape traits (A, B, C, D; defined in Table 5), and shell colour traits (dark, golden, light/white, striped).
3.5 A model Pacific oyster for aquaculture production and sales optimisation
We depict a model Pacific oyster for aquaculture industry success using our IATI indices estimated by combining the results of adjusted trait importance (from POLM and RTA) and the matching concordance (from Fleiss’ Kappa analysis). The remarkable details in industry behaviour based on experiences with the assessed traits revealed in cumulative probabilities from the POLM are summarised in Figure 2. This provides depth and signifies a need for broadly integrated consideration of traits in developing a sustainable industry-sensitive oyster. Producers from South Australia and Tasmania had a good concordance in their experiences on the importance of the six production-related traits of Pacific oysters. On the other hand, there was generally weak agreement among supply chain segments for market-related traits, ideal shell shape, and premium colour, indicating that these segments largely drove the importance ordering of some traits. Analysis of concordance among pairs of supply chain segments showed greater alignment between producers and producer-traders, as explained by superior Fleiss’ Kappa (k; Table 8).
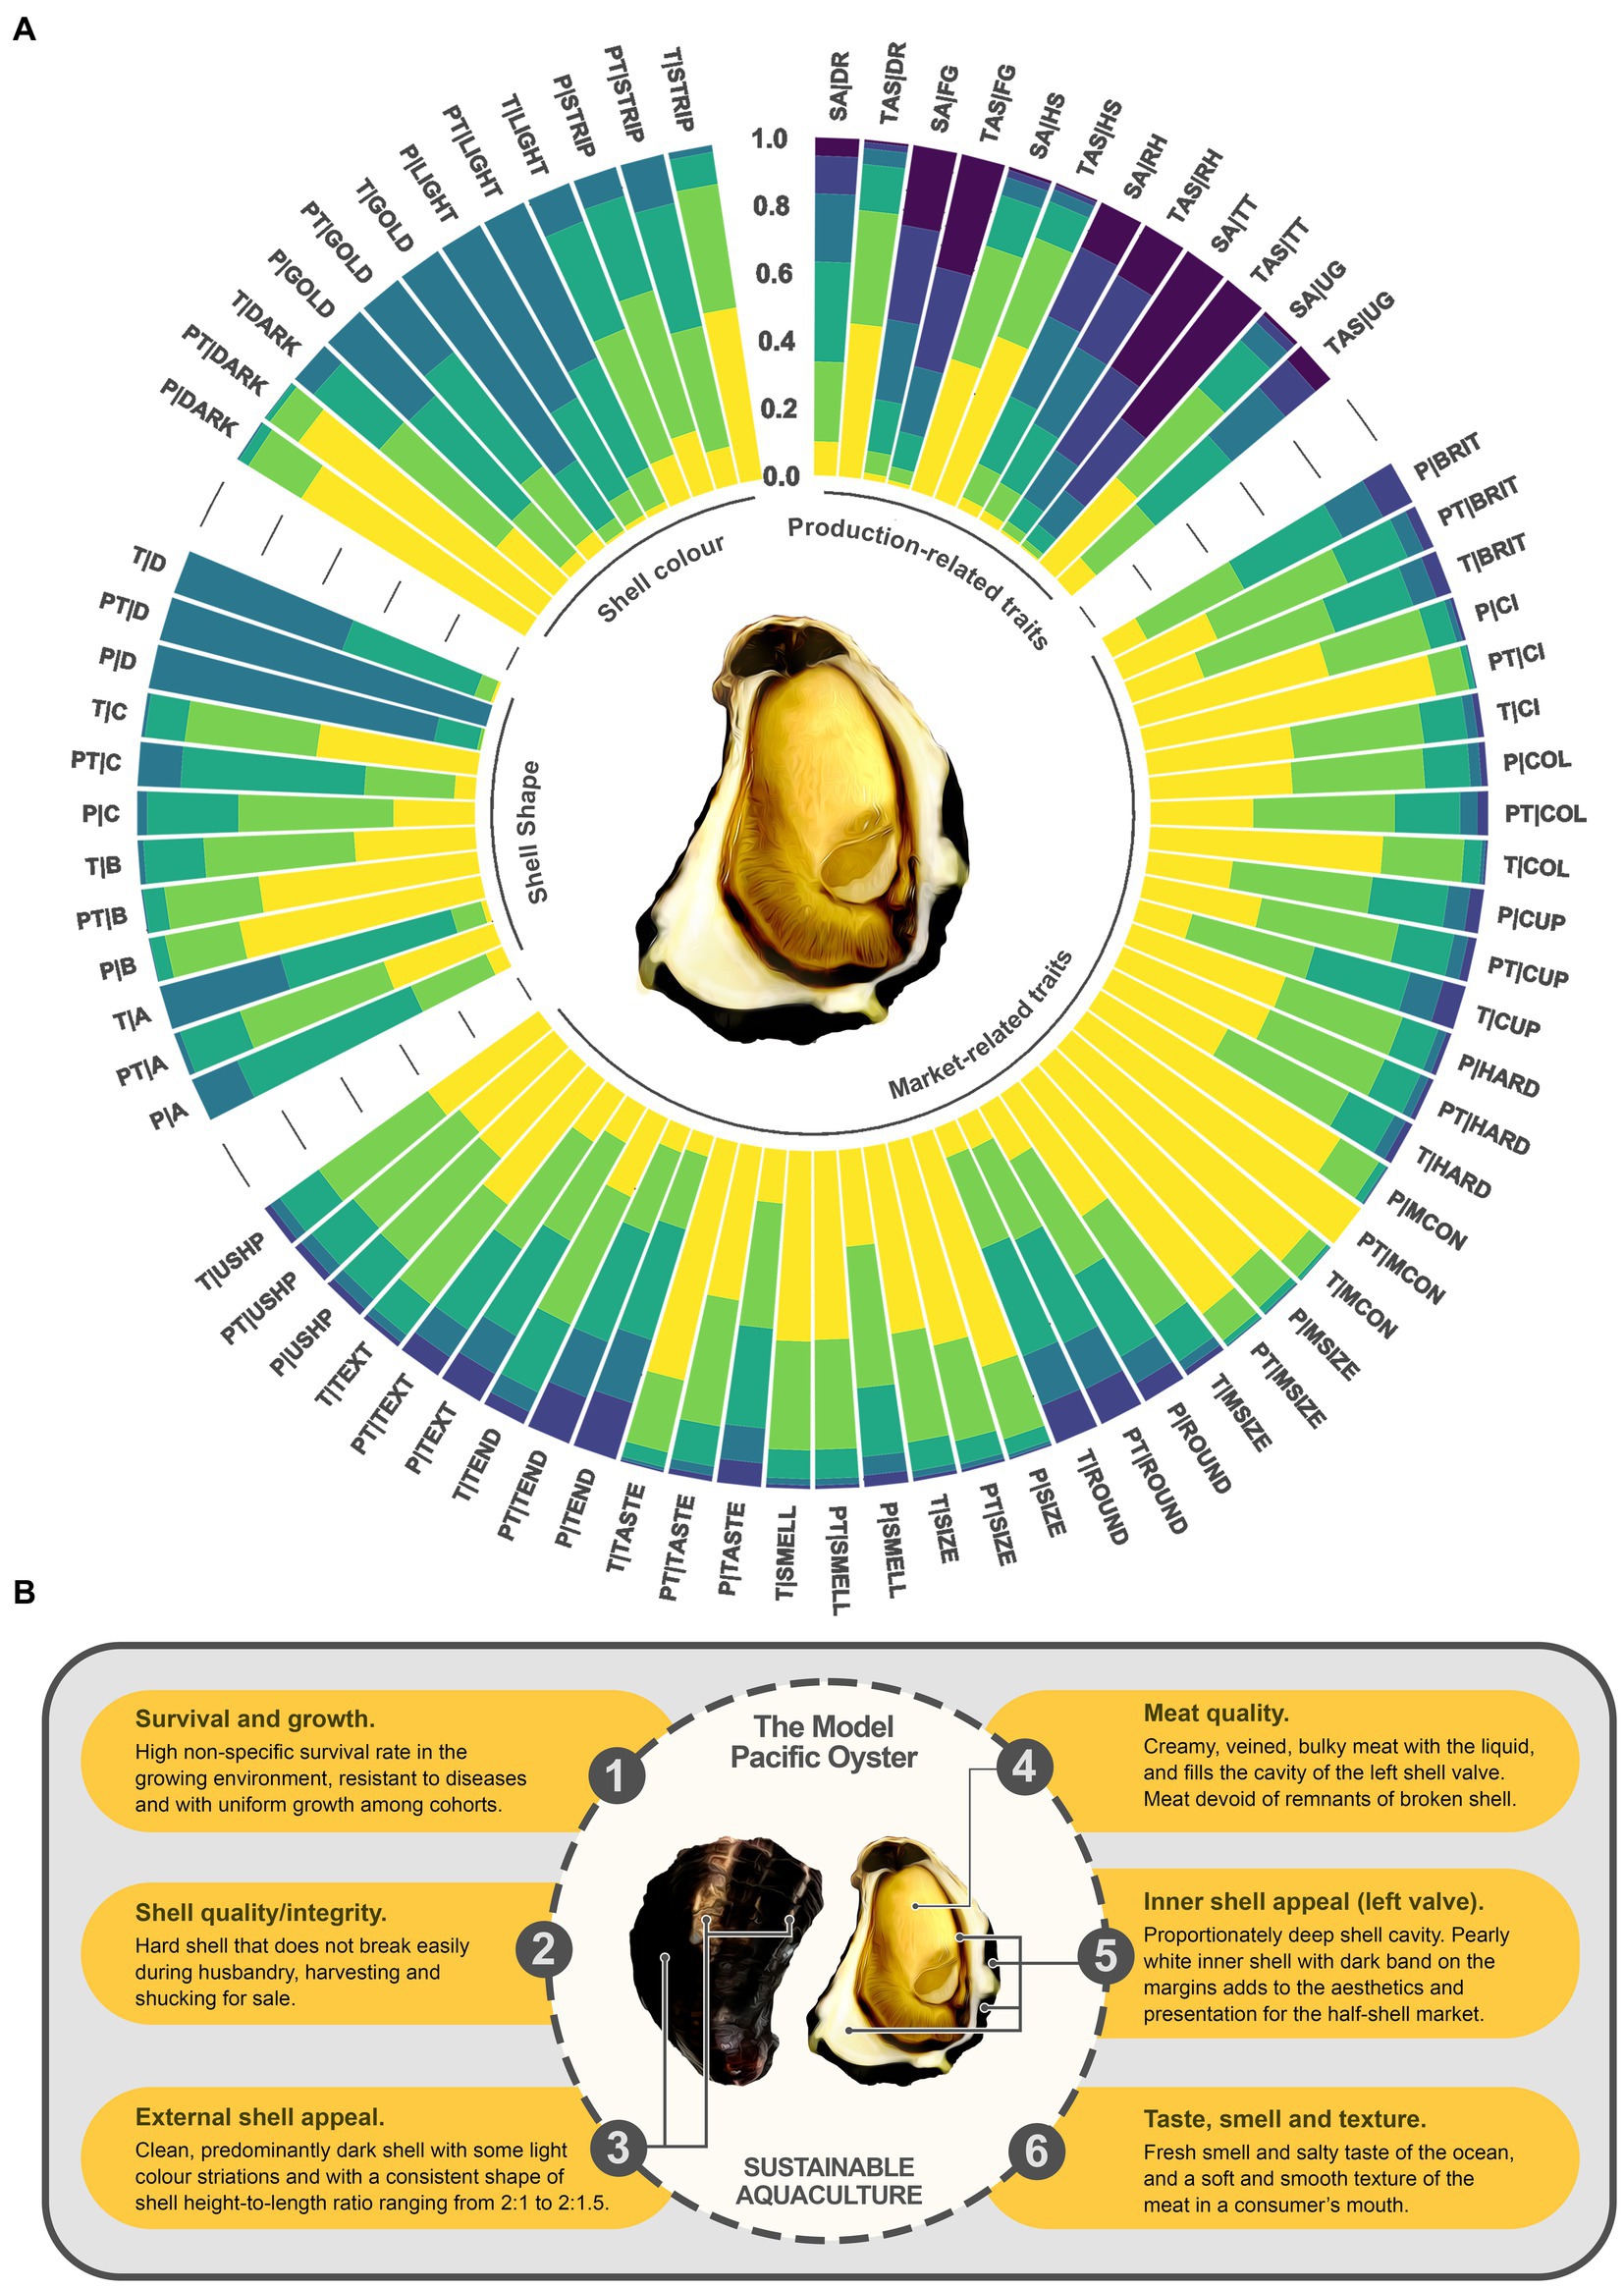
Figure 2. A model oyster for optimising Pacific oyster aquaculture production and sales in southern Australia. (A) Cumulative probability estimates for the ordinal response categories from the fitted proportional odds logit models. The colour gradients of the stacked columns, from yellow/light to purple/dark regions, represent rankings from first to last for production-related biophysical traits (across State; SA = South Australia, TAS = Tasmania), shell shape and colour, and agreeance from strongly agree to strongly disagree for market-related biophysical and sensory traits [across supply chain segments (P = Producer, PT = Producer-trader, and T = Trader)]. BRIT = brittleness/chalkiness, COL = colour of the meat or shell, CI = meat-to-shell cavity condition index, CUP = cup depth, HARD = shell hardness, MEATC = meat condition, MSIZE = meat size, ROUND = roundness, SIZE = size consistency, SMELL = smell, TASTE = taste, and USHP = consistency/uniformity of shape. (B) Annotated summary illustration of the model Pacific oyster as described by the survey respondents.
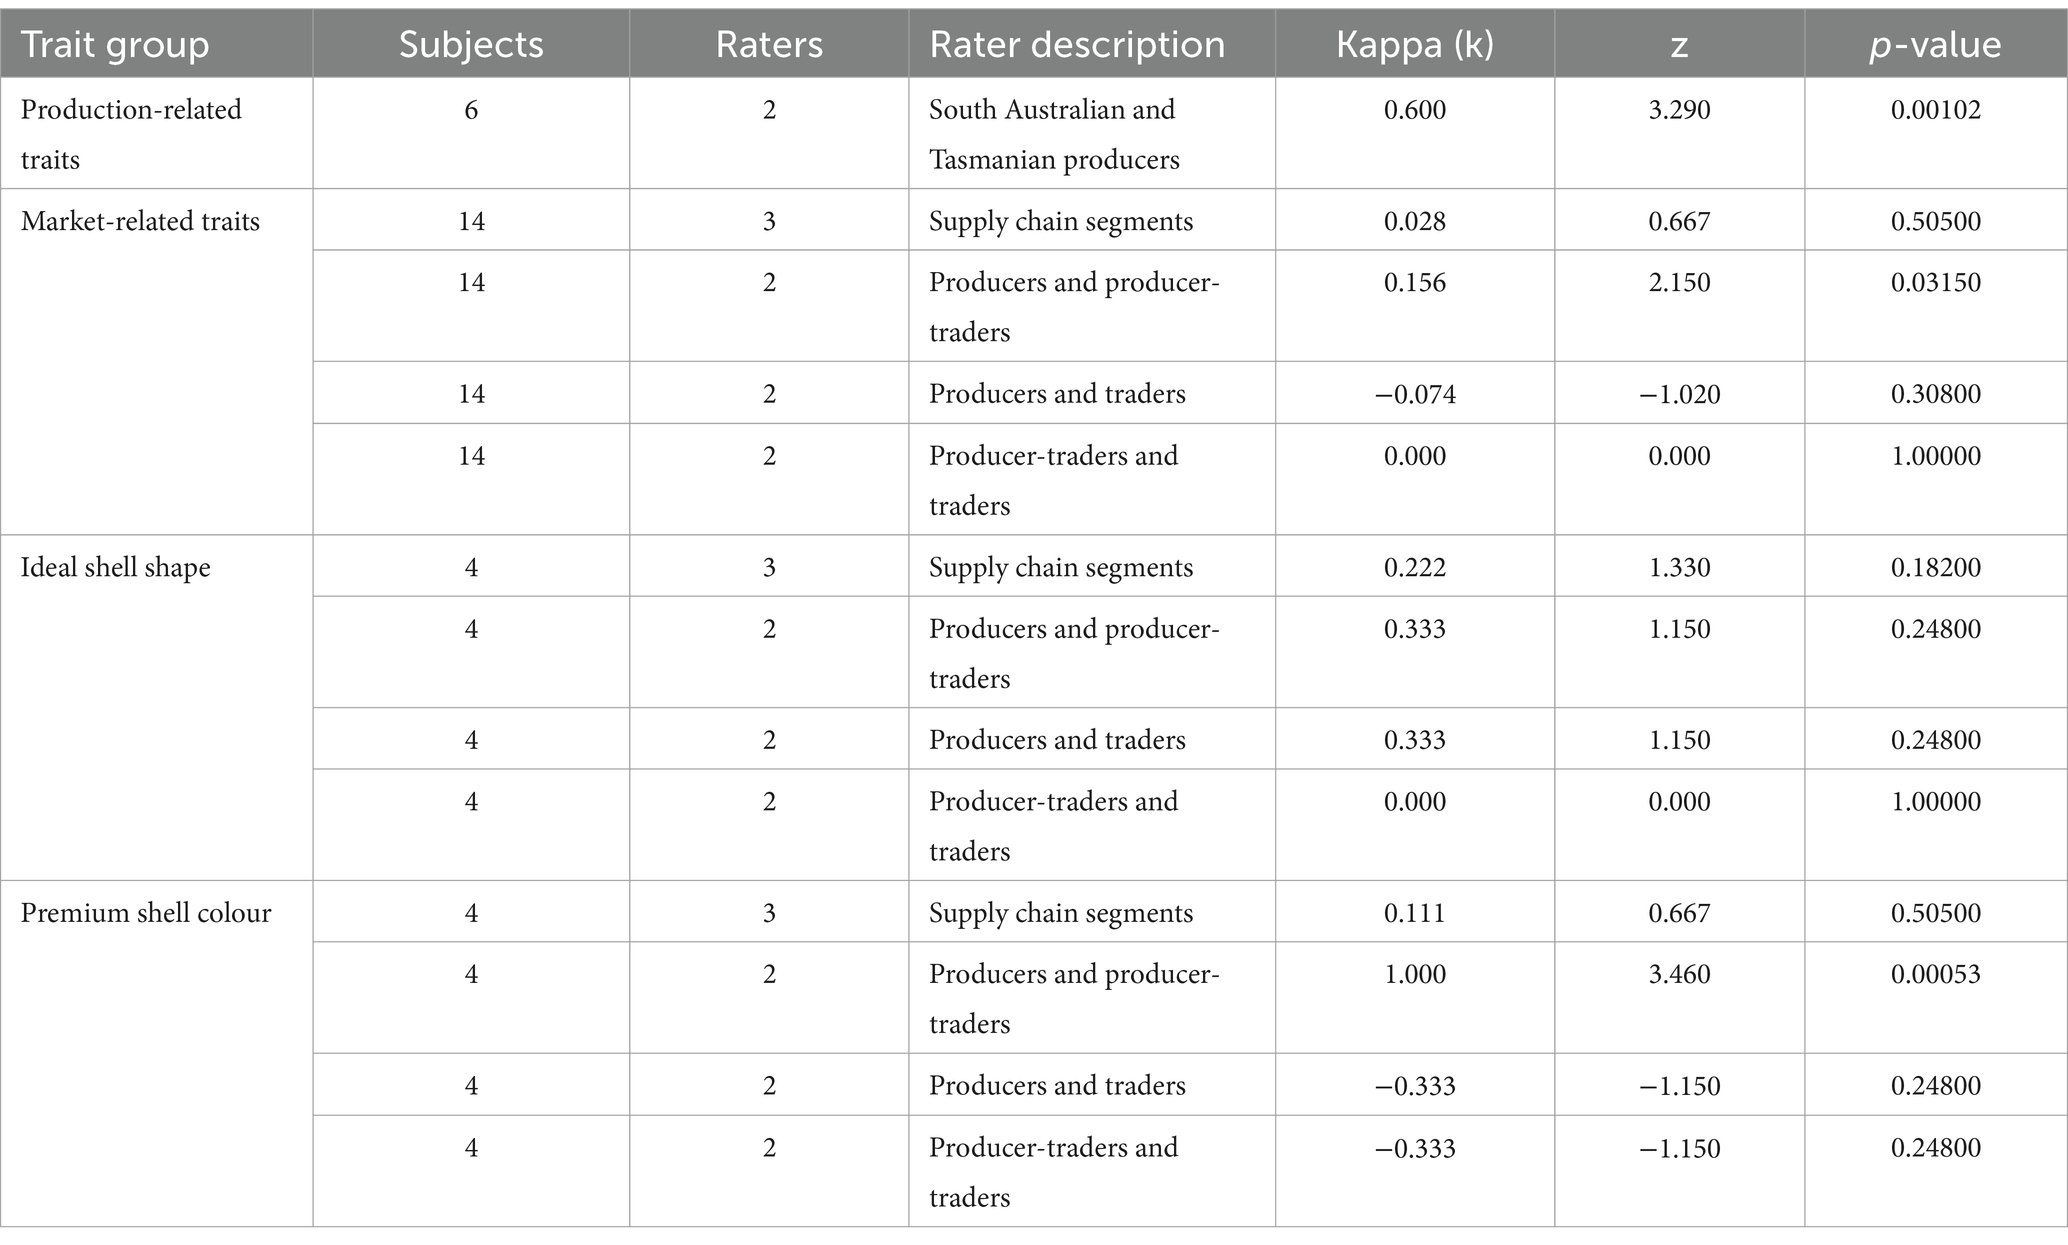
Table 8. Results of Fleiss’ Kappa analysis of concordance in the importance-ordering of traits among stakeholder groups (m Raters).
There was also clarity on the importance of specific traits to the industry, regardless of supply chain segment. For instance, with a perfect concordance on the low predicted mean ranks in all three supply chain segments, which also culminated in a low IATI index, we infer that shell Shape D is not valuable to the aquaculture industry (Tables 5, 8; Supplementary Table 5). Similar empirical deductions on trait importance can be made on all other assessed traits. The IATI indices highlighted other low-ranking traits, such as temperature tolerance, robustness in handling, and fast growth. High survival was a universally high-ranking trait. Shell hardness, disease resistance, uniform growth, meat condition, dark shell colour, and Shape B had reasonable industry concordance (Supplementary Table 6). Consequently, the model Pacific oyster for industry success is one that can survive the stress of the environment and rigorous husbandry while developing the right shell traits that support the production of a highly marketable oyster (Figure 2).
4 Discussion
This study contributes comprehensive analysis toward enhancing the production and sale of an essential seafood by maximising production while keeping a focus on economically sustainable biophysical traits. Seafood preferences are commonly evaluated through consumer choice surveys (Loose et al., 2013; Kecinski et al., 2017; van Houcke et al., 2018; Yuan et al., 2023). However, consumer choices may not adequately capture all factors related to the wider success of food production. Here, we have utilised the results of a compendious survey of multiple supply chain segments in both major Pacific oyster-producing states in Australia (South Australia and Tasmania) to develop a model oyster for the Pacific oyster industry. We apply a ranking-based model approach, which enhances the insight obtained from parameter estimates and their reliability for smaller sample sizes in contrast to the common single-choice approach (Mondal and Bhat, 2022). Thereby providing a nuanced cognition of the essential traits as well as the idiosyncrasies among producers and supply chain segments.
The fundamental role of Pacific oyster shells in farming success and marketability is revealed. Despite not being consumed, the shell was strongly represented in 78 % of the biophysical traits assessed. Shell also accounted for high industry-acclaimed trait importance (IATI) indices. The industry’s acclaim for the importance of shell-connected biophysical traits is intrinsically linked to the centrality of the shell in the physiology and survival of the oyster and reflects on the unique farming and marketing needs of this species. Shell development was central to the narrative of industry-preferred traits in Pacific oysters for survival, hardness, growth rate, size, colour, freshness, or the presentation of served oysters.
Our results clearly demonstrate that improving survival via the management of non-specific mortality is key to increasing productivity. The shell is fundamental to protecting against non-specific mortality during farming, protecting the soft tissue from environmental and husbandry stressors in the growing site. Analysis of the shell’s importance in production and harvest losses reveals high relative IATI indices for shell hardness and brittleness/chalkiness among producers. These are indicators of the industry’s concern about losses incurred from mechanical handling in production and processing for the market. The machinery employed in grading, cleaning, and drying processes exposes oysters to considerable mechanical stress. Producers express heightened concern regarding shell damage, as oysters with compromised shells are frequently discarded during the marketing process.
Disease management, or a resilient oyster that reduces this need, is also essential to increasing productivity. In recent years, the Australian Pacific oyster aquaculture industry has suffered significant setbacks due to repeated outbreaks of POMS (de Kantzow et al., 2017; Trotter et al., 2021). Tasmanian producers have been hit hard by POMS and are now hypervigilant about this disease. Even in South Australia, where POMS is limited to one feral population in Port River and absent in growing areas (Trotter et al., 2021), producers remain cautious of the potential economic consequences of disease outbreaks. Selective breeding for POMS resistance and biosecurity measures are in place to ameliorate the impact of POMS, as well as curb its spread. Meanwhile, there is a known greater risk for mortality in juvenile oysters 40 mm (de Kantzow et al., 2017). Clarity is required on whether the epizootics and virulence of POMS have any relationship with shell physiology or are, for other reasons, a case of inferior immunity of the juvenile compared to adult oysters.
Size uniformity is demonstrably more important for production and market supply than rapid growth rates. A typical response from the survey was, “… I do not care if things grow slowly, but I want everything to grow slowly. Or I do not care if things grow fast, I want everything to grow fast….” Uniformly growing cohorts of oysters have similar-paced shell growth in individual oysters, reducing the need to grade more frequently. While producers want rapid growth for a shorter time to market, they are sceptical because excessive growth can lead to thin, frilly, and misshapen shells, requiring corrective efforts such as moving stocks between intertidal areas or growing heights and frequent flipping of baskets, spacing, and density management prior to harvesting for market. Corrective measures are additional costs that can affect product pricing and profitability and add to environmental impact through fuel and electricity consumption.
Pacific oysters are typically sold at restaurants, oyster bars, retail vans, and farmgate shops. In these outlets, the quality of meat, pertaining to the meat’s colour and size in the shell, is the most crucial sales factor. The oyster meat is preferably creamy, veined, and bulky, filling the cavity of the shell. This preference is accentuated in farmgate retail, as producer-traders associate sales maximisation with good meat condition at infinitely high odds. The contrasting IATI indices for meat size (high) and shell cup depth (low), however, suggest the industry should pay more attention to cup depth, a trait which creates latitude for decent meat development in cupped oysters. Closely linked to meat condition is the high aesthetic value for the colour contrast between the meat and the pearly white inner shell colour, along with its blend with the darkened margins.
The industry’s impression of inner shell aesthetics could partly emanate from the general preference for dark-shelled oysters and the perceived connection to shell hardness. Dark shell exteriors are highly valued by producers, whereas traders prefer dark shells with a touch of light stripes. Generally, dark shells were perceptively hard and dense, implying an ability to withstand damage. A plausible theory here is that dark shells must be strong enough to maintain the darkened margins or frills (new shell growths) through production to the table to produce that ultimate aesthetic appeal. However, unlike producers who incur great losses for fragile shells, traders have alternative markets for oysters with damaged shells and may not incur the same level of losses. Hence, although traders agree on the importance of shell hardness to sales, they are not as interested in this trait as producers are. The major disadvantage to traders is the lost market value for the fresh half-shell product. Shells with more foliated than chalky layers are known to be harder (Mouchi et al., 2016; Checa et al., 2018; Strąg et al., 2020), and any association with shell colour is worth investigating for future advancements in oyster production. Noteworthy also is an emerging niche Golden oyster market that attracts premium value driven by consumer curiosity, currently popular at farmgate retail shops.
The shape of the oyster was important in production and sales. A slightly oblong teardrop shape, like Shape B or C, received high IATI indices for the ideal shape analysis. Here again, producers and traders were at odds with the importance associated with Shapes B and C, respectively. For producers, Shape B is the traditional industry shape achieved from good commercial farming practices. Their preference for Shape B was based on the need for a balance between an oyster that can contain enough meat and yet occupy optimal space in freight packaging. Traders preferred Shape C for similar reasons of space but mainly in relation to appeal in serving on a plate and fitting the consumer’s mouth in the half-shell market. Oysters with proportionate growth rates of height, length, and width are preferred, and producers aim for a 3:2:1 shell height-length-width ratio (cf. length-width-depth as per Australian industry convention). The industry does not rule out the more rounded Shape A as it perceptively holds the biggest meat. An extremely oblong-shaped oyster (Shape D) is of very minimal value to the industry and may be sold at a discounted price.
5 Conclusion
This study investigates the perceived bioeconomic significance of Pacific oyster biophysical traits among Australian Pacific oyster producers and traders. These perceptions are hypothesized to directly correlate with, or be a consequence of, prevailing product end-use and consumption patterns within the region. Our novel approach offers valuable information for all stakeholders in the Pacific oyster industry seeking to optimise production and sales outcomes and better understand the traits that contribute broadly to successful oyster farming. The intricacy unveiled here extends beyond the market’s appreciation for high-quality oyster meat, revealing the shell’s imperceptible yet indispensable role in the overarching economic sustainability of the industry. With this critical position intertwined with all other production and market-related traits, the shell, although not eaten and often overlooked in the oyster production economy, needs to be considered among all avenues used to optimise production and sales in the Pacific oyster aquaculture industries. Shell-connected biophysical traits including high non-specific survival, uniform growth, good integrity (hard, dense, and less chalky), size (and its consistency), shape (moderately oblong), cup depth, appealing outer shell (dark/striped), and inner shell aesthetics (pearly white with dark margins) are the unique characteristics of a model oyster for its sustainable food provisioning. These findings are potentially directly relevant to other Pacific oyster-growing regions than Australia, as well as to cupped oyster farming generally. However, as observed in this study, there are likely to be regional and supply chain-specific idiosyncrasies regarding economically important oyster traits that need assessment, where our approach can be applied. We encourage future comparisons with other Pacific oyster (and oysters generally) aquaculture regions of varied scales and trade dynamics. While the insights gleaned from key industry stakeholders provide valuable indications of sustainability drivers and, by proxy, consumer inclinations, a direct assessment of consumer preferences for Pacific oysters within the study region is recommended. Such an investigation, employing the present study’s sales (trading) parameters, could corroborate or refine industry perspectives, potentially informing transformative shifts in Pacific oyster aquaculture sustainability practices.
Data availability statement
The datasets presented in this study can be found in online repositories. The names of the repository/repositories and accession number(s) can be found below: https://github.com/eochuku/pacific_oyster_traits_survey.
Ethics statement
The studies involving humans were approved by University of Tasmania Human Research Ethics Committee. The studies were conducted in accordance with the local legislation and institutional requirements. The participants provided their written informed consent to participate in this study.
Author contributions
EOC: Resources, Writing – review & editing, Writing – original draft, Visualization, Project administration, Methodology, Investigation, Formal analysis, Data curation, Conceptualization. SAR: Writing – review & editing, Writing – original draft, Validation, Supervision, Methodology, Investigation, Conceptualization. GGS: Writing – review & editing, Validation, Supervision. DM: Writing – review & editing, Validation, Supervision. AJT: Writing – review & editing, Validation, Supervision, Resources, Project administration, Methodology, Investigation, Conceptualization.
Funding
The author(s) declare that financial support was received for the research, authorship, and/or publication of this article. This research was supported by an Australian Government Research Training Program Scholarship (Tasmanian Graduate Research Scholarship) and Australian Institute of Nuclear Science and Engineering (AINSE) Residential Student Scholarship.
Acknowledgments
The authors thank Australian Seafood Industries for providing logistical and technical support for this study. Special recognition is given to Matt Cunningham, John Wright, Nick Griggs, and Ian Duthie for their invaluable input during the questionnaire development and testing. We are grateful to Oysters Tasmania, Oysters Australia, and the South Australian Oyster Growers Association for their assistance in recruiting participants for the study.
Conflict of interest
The authors declare that the research was conducted in the absence of any commercial or financial relationships that could be construed as a potential conflict of interest.
Publisher’s note
All claims expressed in this article are solely those of the authors and do not necessarily represent those of their affiliated organizations, or those of the publisher, the editors and the reviewers. Any product that may be evaluated in this article, or claim that may be made by its manufacturer, is not guaranteed or endorsed by the publisher.
Supplementary material
The Supplementary material for this article can be found online at: https://www.frontiersin.org/articles/10.3389/fsufs.2024.1440214/full#supplementary-material
References
Aaraas, R., Hernar, I. J., Vorre, A., Bergslien, H., Lunestad, B. T., Skeie, S., et al. (2006). Sensory, histological, and bacteriological changes in flat oysters, Ostrea edulis L., during different storage conditions. J. Food Sci. 69, S205–S210. doi: 10.1111/J.1365-2621.2004.TB11006.X
Adams, C. M., Sturmer, L., Sweat, D., Blake, N., and Degner, B. (2001). The economic feasibility of small-scale, commercial culture of the southern bay scallop (Argopecten irradians concentricus). Aquac. Econ. Manag. 5, 81–97. doi: 10.1080/13657300109380279
Agresti, A. (2019). An introduction to categorical data analysis. Third ed. Hobokenn, New Jersey: John Wiley & Sons, Inc.
Alexander, P., Brown, C., Arneth, A., Finnigan, J., Moran, D., and Rounsevell, M. D. A. (2017). Losses, inefficiencies and waste in the global food system. Agric. Syst. 153, 190–200. doi: 10.1016/j.agsy.2017.01.014
Allison, P. D., and Christakis, N. A. (1994). Logit models for sets of ranked items. Sociol. Methodol. 24, 199–228. doi: 10.2307/270983
Barbosa Solomieu, V., Renault, T., and Travers, M. A. (2015). Mass mortality in bivalves and the intricate case of the Pacific oyster, Crassostrea gigas. J. Invertebr. Pathol. 131, 2–10. doi: 10.1016/j.jip.2015.07.011
Braun, V., and Clarke, V. (2006). Using thematic analysis in psychology. Qual. Res. Psychol. 3, 77–101. doi: 10.1191/1478088706qp063oa
Braun, V., and Clarke, V. (2022). Conceptual and design thinking for thematic analysis. Qual. Psychol. 9, 3–26. doi: 10.1037/qup0000196
Buzin, F., Baudon, V., Cardinal, M., Barillé, L., and Haure, J. (2011). Cold storage of Pacific oysters out of water: biometry, intervalval water and sensory assessment. Int. J. Food Sci. Technol. 46, 1775–1782. doi: 10.1111/j.1365-2621.2011.02686.x
Byrne, D. (2022). A worked example of Braun and Clarke’s approach to reflexive thematic analysis. Qual. Quant. 56, 1391–1412. doi: 10.1007/s11135-021-01182-y
Checa, A. G., Harper, E. M., and González-Segura, A. (2018). Structure and crystallography of foliated and chalk shell microstructures of the oyster Magallana: the same materials grown under different conditions. Sci. Rep. 8, 1–12. doi: 10.1038/s41598-018-25923-6
de Kantzow, M. C., Hick, P. M., Dhand, N. K., and Whittington, R. J. (2017). Risk factors for mortality during the first occurrence of Pacific oyster mortality syndrome due to Ostreid herpesvirus – 1 in Tasmania, 2016. Aquaculture 468, 328–336. doi: 10.1016/j.aquaculture.2016.10.025
FAO (2022). The state of world fisheries and aquaculture 2022. Towards blue transformation. Rome: FAO.
Fleiss, J. L., Levin, B., and Paik, M. C. (2003) Statistical methods for rates and proportions. eds. D. J. Balding, N. A. C. Cressie, N. I. Fisher, I. M. Johnstone, J. B. Kadane, and L. M. Ryan, et al. Third ed (Hobokenn, New Jersey: John Wiley & Sons, Inc).
Fratini, G., Lois, S., Pazos, M., Parisi, G., and Medina, I. (2012). Volatile profile of Atlantic shellfish species by HS-SPME GC/MS. Food Res. Int. 48, 856–865. doi: 10.1016/j.foodres.2012.06.033
Hossain, M. E., Khan, M. A., Saha, S. M., and Dey, M. M. (2022). Economic assessment of freshwater carp polyculture in Bangladesh: profit sensitivity, economies of scale and liquidity. Aquaculture 548:737552. doi: 10.1016/j.aquaculture.2021.737552
Kecinski, M., Messer, K. D., Knapp, L., and Shirazi, Y. (2017). Consumer preferences for oyster attributes: field experiments on brand, locality, and growing method. Agric. Resour. Econ. Rev. 46, 315–337. doi: 10.1017/age.2017.21
Ky, C. L., Lo, C., and Planes, S. (2017). Mono-and polychromatic inner shell phenotype diversity in Pinctada margaritifera donor pearl oysters and its relation with cultured pearl colour. Aquaculture 468, 199–205. doi: 10.1016/j.aquaculture.2016.10.017
Lenth, R. V., Bolker, B., Buerkner, P., Giné-Vázquez, I., Herve, M., Jung, M., et al. (2023). Package ‘emmeans’: estimated marginal means, aka least-squares means. Am. Stat. 34, 216–221. doi: 10.1080/00031305.1980.10483031
Li, T., Kecinski, M., and Messer, K. D. (2017). Heterogeneous preferences for oysters: evidence from field experiments. Agric. Resour. Econ. Rev. 46, 296–314. doi: 10.1017/age.2017.16
Loose, S. M., Peschel, A., and Grebitus, C. (2013). Quantifying effects of convenience and product packaging on consumer preferences and market share of seafood products: the case of oysters. Food Qual. Prefer. 28, 492–504. doi: 10.1016/j.foodqual.2012.11.004
Matthias Gamer, A., and Matthias Gamer, M. (2022). Package ‘irr’: Various Coefficients of Interrater Reliability and Agreement (pp. 1–32). Available at: https://cran.r-project.org/web/packages/irr/irr.pdf (Accessed May 01, 2024).
Mazaleyrat, A., Normand, J., Dubroca, L., and Fleury, E. (2022). A 26-year time series of mortality and growth of the Pacific oyster C. gigas recorded along French coasts. Sci. Data 9:392. doi: 10.1038/s41597-022-01511-2
McCullagh, P. (1980). Regression models for ordinal data. J. R. Stat. Soc. Ser. B Methodol. 42, 109–127. doi: 10.1111/j.2517-6161.1980.tb01109.x
Mizuta, D. D., and Wikfors, G. H. (2019). Seeking the perfect oyster shell: a brief review of current knowledge. Rev. Aquac. 11, 586–602. doi: 10.1111/raq.12247
Mondal, A., and Bhat, C. R. (2022). A spatial rank-ordered probit model with an application to travel mode choice. Transp. Res. B Methodol. 155, 374–393. doi: 10.1016/j.trb.2021.12.008
Mouchi, V., Lartaud, F., Guichard, N., Immel, F., de Rafélis, M., Broussard, C., et al. (2016). Chalky versus foliated: a discriminant immunogold labelling of shell microstructures in the edible oyster Crassostrea gigas. Mar. Biol. 163, 1–15. doi: 10.1007/s00227-016-3040-6
Ortega, D. L., Wang, H. H., Wu, L., and Olynk, N. J. (2011). Modeling heterogeneity in consumer preferences for select food safety attributes in China. Food Policy 36, 318–324. doi: 10.1016/j.foodpol.2010.11.030
Pennarun, A.-L., Prost, C., and Demaimay, M. (2002). Identification and origin of the character-impact compounds of raw oyster Crassostrea gigas. J. Sci. Food Agric. 82, 1652–1660. doi: 10.1002/jsfa.1236
Petton, B., Destoumieux-Garzón, D., Pernet, F., Toulza, E., de Lorgeril, J., Degremont, L., et al. (2021). The Pacific oyster mortality syndrome, a Polymicrobial and multifactorial disease: state of knowledge and future directions. In Front. Immunol. 12:630343. doi: 10.3389/fimmu.2021.630343
Rankin, C., Moltschaniwskyj, N., Morton, J., and Wilkie, E. (2018). Shell shape and meat condition in selectively bred Sydney rock oysters, Saccostrea glomerata (Gould, 1850): the influence of grow-out methods. Aquac. Res. 49, 1189–1199. doi: 10.1111/are.13572
Ripley, B., Venables, B., Bates, D. M., Hornik, K., Gebhardt, A., and Firth, D. (2023). Package ‘MASS’: support functions and datasets for Venables and Ripley’s MASS (7.30-60; pp. 1–170). Available at: http://www.stats.ox.ac.uk/pub/MASS4/ (Accessed May 01, 2024).
Schrobback, P., and Rolfe, J. (2021). Methodological and ideological options exploring supply chain models for Sydney rock oysters. Aquaculture 534:736270. doi: 10.1016/j.aquaculture.2020.736270
Schrobback, P., Rolfe, J., Rust, S., and Ugalde, S. (2021). Challenges and opportunities of aquaculture supply chains: case study of oysters in Australia. Ocean Coast. Manag. 215:105966. doi: 10.1016/j.ocecoaman.2021.105966
Smil, V. (2004). Improving efficiency and reducing waste in our food system. Environ. Sci. 1, 17–26. doi: 10.1076/evms.1.1.17.23766
Songsaeng, S., Sophanodora, P., Kaewsrithong, J., and Ohshima, T. (2009). Changes in lipids of white-scar oyster (Crassostrea belcheri) during chilled storage under different salt concentrations. Available at: https://www.semanticscholar.org/paper/ef2455b049c66bd94d3631a89e256802e64ac0d2 (Accessed May 01, 2024).
Stenger, P. L., Vidal-Dupiol, J., Reisser, C., Planes, S., and Ky, C. L. (2019). Colour plasticity in the shells and pearls of animal graft model Pinctada margaritifera assessed by HSV colour quantification. Sci. Rep. 9, 7520–7510. doi: 10.1038/s41598-019-43777-4
Strąg, M., Maj, Ł., Bieda, M., Petrzak, P., Jarzębska, A., Gluch, J., et al. (2020). Anisotropy of mechanical properties of pinctada margaritifera mollusk shell. Nanomaterials (Basel) 10:634. doi: 10.3390/nano10040634
The Economist Group (2022). Global Food Security Index 2022. Available at: https://impact.economist.com/sustainability/project/food-security-index/ (Accessed May 01, 2024).
Trotter, A. J., Vignier, J., Wilson, T. K., Douglas, M., Adams, S. L., King, N., et al. (2021). Case study of vertical transmission of ostreid herpesvirus-1 in Pacific oysters and biosecurity management based on epidemiological data from French, New Zealand and Australian hatchery-propagated seed. Aquac. Res. 52, 4012–4017. doi: 10.1111/are.15219
Turchini, G. M., Giani, I., Caprino, F., Moretti, V. M., and Valfrè, F. (2004). Discrimination of origin of farmed trout by means of biometrical parameters, fillet composition and flavor volatile compounds. Ital. J. Anim. Sci. 3, 123–140. doi: 10.4081/ijas.2004.123
Tuynman, H., and Dylewski, M. (2022). Australian fisheries and aquaculture statistics 2021. doi: 10.25814/amdt-x682
van Houcke, J., Altintzoglou, T., Linssen, J., and Luten, J. (2018). Quality perception, purchase intention, and the impact of information on the evaluation of refined Pacific cupped oysters (Crassostrea gigas) by Dutch consumers. J. Sci. Food Agric. 98, 4778–4785. doi: 10.1002/jsfa.9136
Wongprawmas, R., and Canavari, M. (2015). Heterogeneity in consumer preferences for food safety label in Thailand. EAAE-AAEA joint seminar “consumer behavior in a changing world: food, culture, society. 30 pp. Available at: https://ageconsearch.umn.edu/record/202744/files/236.pdf (Accessed May 01, 2024).
Yuan, B., Cui, Y., Liu, W., Sheng, W., Xu, H., and Yang, L. (2023). Consumer preferences for oyster trait attributes in China: a choice experiment. Aquaculture 571:739471. doi: 10.1016/j.aquaculture.2023.739471
Keywords: oyster, sustainable aquaculture, production and marketing, biophysical trait, proportional odds logit, Fleiss’ kappa, thematic analysis
Citation: Chuku EO, Rust SA, Smith GG, Mazumder D and Trotter AJ (2024) Discovering a model Pacific oyster for sustainable aquaculture production and sales optimisation in southern Australia. Front. Sustain. Food Syst. 8:1440214. doi: 10.3389/fsufs.2024.1440214
Edited by:
Roberto Anedda, Parco Scientifico e Tecnologico della Sardegna, ItalyReviewed by:
Linda Adzigbli, University of Rostock, GermanyGulnihal Ozbay, Delaware State University, United States
Copyright © 2024 Chuku, Rust, Smith, Mazumder and Trotter. This is an open-access article distributed under the terms of the Creative Commons Attribution License (CC BY). The use, distribution or reproduction in other forums is permitted, provided the original author(s) and the copyright owner(s) are credited and that the original publication in this journal is cited, in accordance with accepted academic practice. No use, distribution or reproduction is permitted which does not comply with these terms.
*Correspondence: Ernest Obeng Chuku, ZXJuZXN0LmNodWt1QHV0YXMuZWR1LmF1