 Yuping Tan1,2
 Zhiqiang Wang1,2*
- 1School of Geography, Faculty of Geographical Science, Beijing Normal University, Beijing, China
- 2State Key Laboratory of Earth Surface Processes and Resource Ecology, Faculty of Geographical Science, Beijing Normal University, Beijing, China
Soybean yield is affected by soil, terrain, biology, and other factors. However, few studies have considered the main and secondary influencing factors of soybean yield and the interaction mechanisms among these factors within a catchment area in the black soil region. This study aims to explore the main influencing factors and the coupling mechanisms affecting soybean yield in China’s northeast black soil region. Using 46 samples from Heshan Farm, Nenjiang City, a driving factor model for soybean yield was developed using PLS-SEM, incorporating latent variables such as soybean yield, topographic characteristics, soil physical properties, soil chemical properties, and biological factors. The main factors, secondary factors, and their interactions affecting soybean yield were discussed. Topographic factors, soil physical properties, and soil chemical properties had positive total effects on soybean yield, while biological factors had a direct negative impact on soybean yield, with the total effects ranging from soil physical properties > biological factors > topographic factors > soil chemical properties. In terms of soil physical properties, the load value of soil bulk density was the largest (−0.917). This was followed by saturated water content (0.886), total porosity (0.855), capillary water holding capacity (0.837), field water holding capacity (0.763), black soil thickness (0.695), sand particle size (−0.664), clay particle size (0.450), and gravel ratio (−0.439). These findings demonstrate soil physical properties are the key factors affecting soybean yield. Thus, soil improvement in small catchment, by reducing bulk density, increasing porosity, and improving soil water retention capacity are key to improving soybean yield.
1 Introduction
Soybean is rich in nutrients and is one of the important sources of human protein and oil. With the increased demand for soybeans, the gap between soybean production and demand in our country continues to expand. Therefore, increasing soybean production is crucial to ensuring national food security and human health. The northeast black soil region is the main grain production base in China, and soybean is one of the main cultivated crops in this region, its soybean output accounts for half of the total national production (Hao et al., 2019). However, no corresponding soil and water conservation measures have been taken in the northeast black soil region throughout its farming history of more than 100 years. Due to high-intensity predatory exploitation and utilization, the soil in the black soil region has been continuously eroded (Xie et al., 2023). In addition, the improvement of mechanization and the use of chemical fertilizers and pesticides in recent years have seriously affected soil quality. This is difficult to reverse in a short time, resulting in a continuous decline in soil productivity and threatening national food security. Clarifying the influencing factors of soybean yield in the northeast black soil region is of great significance for maintaining and improving soybean yield and ensuring national food security.
To date, both domestic and international scholars have conducted extensive research on crop yield and its influencing factors. Kaspar et al. (2003) explored the relationship between crop yield and topographic factors and believed that the relationship between the two was affected by precipitation. When the precipitation was lower than in normal years, the yield was negatively correlated with elevation, slope curvature, etc., and when the precipitation was higher than in normal years, the yield was positively correlated. Sam et al. (2021) also reached the same conclusion. Asadu et al. (2002) studied the effects of soil physical properties on crop yield and found that macroporosity, microporosity, total porosity, and bulk density contributed the most to cassava root yield, while pH, total exchangeable acidity, and microporosity were important factors affecting maize yield. Wang et al. (2009) studied the effect of soil erosion on soybean yield and found that the increase in soil erosion depth led to a decrease in soil organic matter, total nitrogen, total phosphorus, and other nutrients, which further led to a decrease in soybean yield. Zhang et al. (2021) also reached the same conclusion and found a nonlinear relationship between crop yield and erosion depth. When the thickness of soil layer A is less than 25 cm, crop yield decreases significantly. Liu et al. (2015) found that soil moisture, nitrogen, phosphorus, and potassium all affect soybean yield, and the intensity of the effects varies with the thickness of soil erosion. Additionally, there is a nonlinear relationship between soybean yield and soil moisture, nitrogen, phosphorus, and potassium. Usowicz and Lipiec (2017) measured the field changes of soil physicochemical properties of oats, rye, and other grains and soil, and found that grain yield was significantly positively correlated with clay content and surface soil water content, and significantly negatively correlated with bulk density. Feng et al. (2018) quantified the effects of surface layer thickness and sediment deposition thickness of black soil on corn yield and found that corn yield decreased with the decrease of surface layer thickness, and decreased with the increase of sediment deposition depth during the planting period. Although there have been studies on the factors affecting crop yield, these studies tend to focus on the relationship between a single factor and crop yield. Crop yield is affected by climate, terrain, soil, biology, agricultural management measures, and other factors (Green et al., 2007; Bogunovic et al., 2018; Luo et al., 2019; Faé et al., 2020; Kang et al., 2022), each factor has different degrees of influence on yield, and there are complex interactions among these factors (Wang C. et al., 2023), which makes the primary and secondary factors affecting crop yield and how they influence yield remain uncertain. It is very important for the management and improvement of crop production to clarify the main and secondary factors affecting soybean yield in black soil area and the interaction between them.
In existing relevant studies, scholars have mostly used factor analysis, principal component analysis, correlation coefficient, linear regression, and other methods to analyze the influencing factors of crop yield. Olivares et al. (2022) used multiple regression analysis to explore the relationship between banana yield and soil characteristics and found that soil texture, structure type, and dry consistency were significantly correlated with banana productivity. Yang et al. (2022) used multiple linear regression to study the relationship between winter wheat yield and soil bulk density. Asadu et al. (2002) used the stepwise regression method to study the contribution of soil physical properties to the yield changes of cassava, yam, maize, and dal. Jagadamma et al. (2008) used variance analysis, correlation analysis, principal component analysis, multiple regression analysis, and other methods to study the effects of nitrogen fertilizer on corn and soybean yield in Illinois, United States. Tian et al. (2016) used variance analysis to explore the responses of crop yield and soil carbon to different tillage methods in northern China. These traditional methods have limitations in assessing the relationship between crop yields and influencing factors. They can only calculate the single relationship between the independent variable and the dependent variable, and cannot explore the direct influence, indirect influence, and influence degree of each factor on the output, as well as the complex interaction between factors (Sha et al., 2017; Wang M. et al., 2023; Wang W. et al., 2023).
The structural equation model (SEM) estimates and tests the structural relationship between variables and the causal relationship between multiple variables by establishing a hypothesis model combining the index system and providing the strength of each relationship. It includes both measurement variables that can be directly observed and latent variables that are difficult to directly observe. The partial least squares Structural equation modeling (PLS-SEM) is an SEM technique based on iterative methods to maximize the interpretive variance of endogenous structures. In addition, PLS-SEM has the advantages of being suitable for data with non-normal distribution, small sample size, and formed measurement structure. It reduces the requirement for data to meet the normal distribution and better solves the multicollinearity problem between index factors, which is advantageous in exploratory research with fewer samples and more complex models (Hair et al., 2014). At present, some scholars have applied this method to geography and other related fields to explore the influencing factors of research objects. Wang M. et al. (2023) used the partial least squares structural equation model to explore the driving factors of cultivated land quality in the northeast black soil region and found that soil properties had the greatest driving force on cultivated land quality, while the social economy had the least driving force on cultivated land quality. Wang W. et al. (2023) studied the main influencing factors of nutrient concentration in arid rivers in Northwest China based on partial least squares structural equation model and found that land use type, meteorological elements, and soil were the main factors affecting total phosphorus and total nitrogen change. Dong et al. (2023) made an empirical study on the influencing factors of soybean yield of high-standard farmland projects in Hanzhong City by using a partial least squares structural equation model and found that soil nutrients, irrigation, and soil properties were the main factors affecting cultivated land productivity, and had direct or indirect positive effects on cultivated land productivity. The overall effect size was soil property (0.587) > farmland water conservancy (0.552) > soil nutrient (0.464). Therefore, PLS-SEM was chosen in this study to explore the influencing factors of soybean yield in the northeast black soil region.
This study explores the effects of terrain, soil, and biology on soybean yield at a small catchment scale. The main purpose of the study was to 1) establish a model of influencing factors of soybean yield by using PLS-SEM, and 2) clarify the direct factors, indirect factors, major factors, minor factors, influence degree of each factor, and interaction among factors. The results of this research aim to provide basic scientific insights for the management of black soil cultivated land and the sustainable improvement of soybean yield.
2 Materials and methods
2.1 Study area
The study area is located in the No. 8 drainage catchment (48° 46ˈN, 124° 53ˈE and 49° 21ˈN, 125° 27ˈE) in Hebei Catchment, Nenjiang City, Heilongjiang Province, covering an area of 2.3 km2 (Figure 1). The area is situated at the southwest foot of the Lesser Khingan Mountains, in the transition zone from the Lesser Khingan Mountains to the Nenjiang Valley, with an elevation ranging from 333 to 391 m. The topography is relatively flat, with long and gentle slopes. The slope of the cultivated land varies from 0.1 to 4.2° with an average of 2.3°, and the slope length ranges from 800 to 1,500 m. The climate is a medium-temperate continental monsoon climate. The annual average temperature is 0.4°C, with a maximum of 37.9°C and a minimum of −46.5°C (Li and Duan, 2014). The annual average precipitation is 544.1 mm, mainly concentrated between June and August, accounting for 66.8% of the annual precipitation. The natural vegetation belongs to the temperate semi-humid meadow grassland, the soil is classified as black soil in the Chinese genetic classification and as homosaprophytic soil in the Chinese soil systematic classification. The parent material is mostly Quaternary fluvial lacustrine sand and loessial clay sediment. In the catchment, the soybean high and low yield zones are caused by erosion and sedimentation, as well as differences in soil, topographic conditions, and field management.
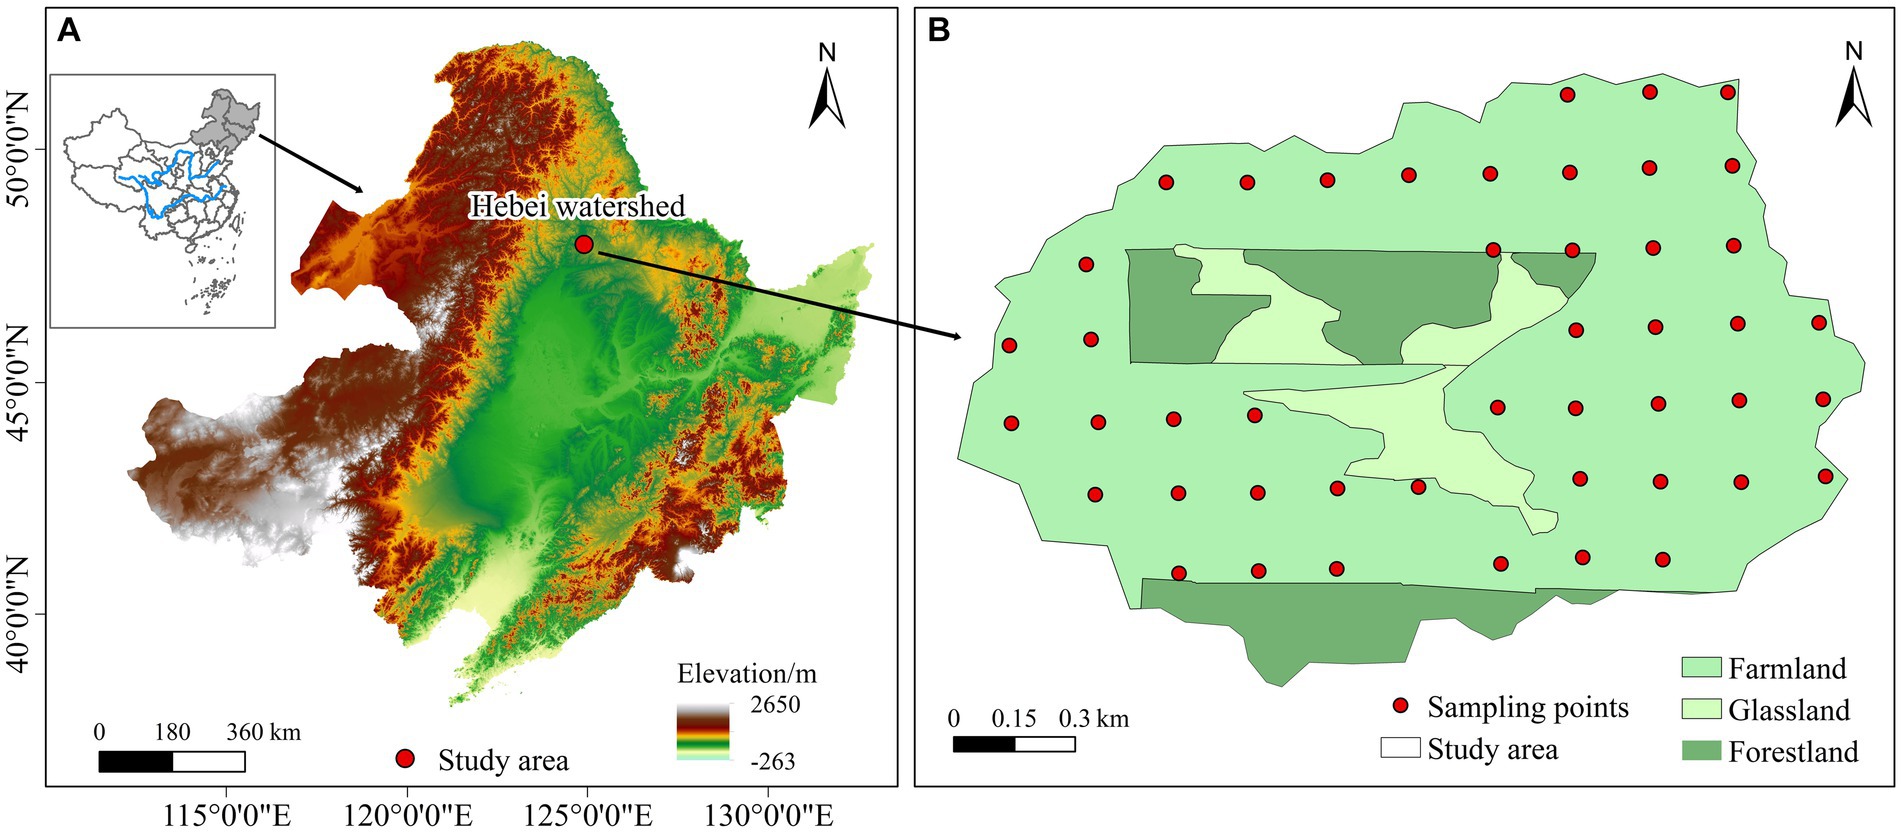
Figure 1. (A) The location of the study area in Northeast China; (B) sample point layout in the study area.
2.2 Data sources
Before planting in 2022, an image with a resolution of 25 cm × 25 cm was obtained using surveying and mapping UAVs. The DEM data of the study area was then obtained through indoor splicing, clipping, and resampling. Finally, the elevation, slope, slope curvature, and plane curvature were extracted, and the slope index and topographic position index were calculated. In August 2022, 46 farmland sampling sites were established in the catchment to collect soil samples and determine soil physical, chemical properties, and biological factors. Specifically, a soil drill with a diameter of 6.5 cm and a bit length of 30 cm was used to drill the original soil column, and the thickness of the black soil was determined using a Munsell standard colorimetric card. A ring knife with a diameter of 7 cm and a height of 5.2 cm was used to collect undisturbed soil samples at depths of 0–10 cm and 10–20 cm at each sample site. The bulk density, total porosity, saturated water conductivity, capillary water capacity, field water capacity, and saturated water content of 0–10 cm and 10–20 cm were measured in the laboratory. At the same time, soil samples from the same soil layer were collected, three samples were collected at each sample point, mixed in a sample bag, and analyzed for gravel ratio, mechanical composition, organic carbon, pH value, total nitrogen, total phosphorus, total potassium, alkali-hydrolyzed nitrogen, available phosphorus, rapidly available potassium, ammonium nitrogen, nitrate nitrogen, hydroxides, and β-glucoside enzyme. All samples were analyzed according to relevant national standards (Nanjing Institute of Soil Science, Chinese Academy of Sciences, 1978).
Soybeans of the Heihe 43 variety were sown in early May 2022. In early August, urea, diammonium phosphate, and potassium sulfate were applied by spraying foliar fertilizer. In early October 2022, a 1 m × 1 m quadrat was used to collect soybean plants, with three quadrats sampled at each sample point. After collection, the samples were processed indoors and adjusted to a 13% water content to obtain the soybean yield per unit area at various points in the study area.
2.3 Partial least squares structural equation model (PLS-SEM)
Structural equation models, which integrate path analysis and confirmatory factor analysis, can analyze structural relationships between variables that cannot be directly measured and causal relationships between multiple variables, providing the strength of each relationship. These models consist of measurement models and structural models. The measurement model describes the relationship between the observed variables and the latent variables, and its expression is as follows:
In Equation 1 where x is the exogenous observed variable; ζ is the exogenous latent variable, which explains other variables in the model. Λx is the factor load matrix of the exogenous observed variable on the exogenous latent variable; δ is the error term vector of the exogenous variable; in Equation 2 y is the endogenous observed variable; η is an endogenous latent variable that explains or is explained by other variables in the model. Λy is the factor load matrix of the endogenous observed variable on the endogenous latent variable; ε is the error vector of the endogenous variable. In this study, topographic factors are exogenous latent variables, while soil physical properties, soil chemical properties, and biological factors are endogenous latent variables. The topographic index, elevation, slope, and black soil layer thickness are all observed variables (Table 1).
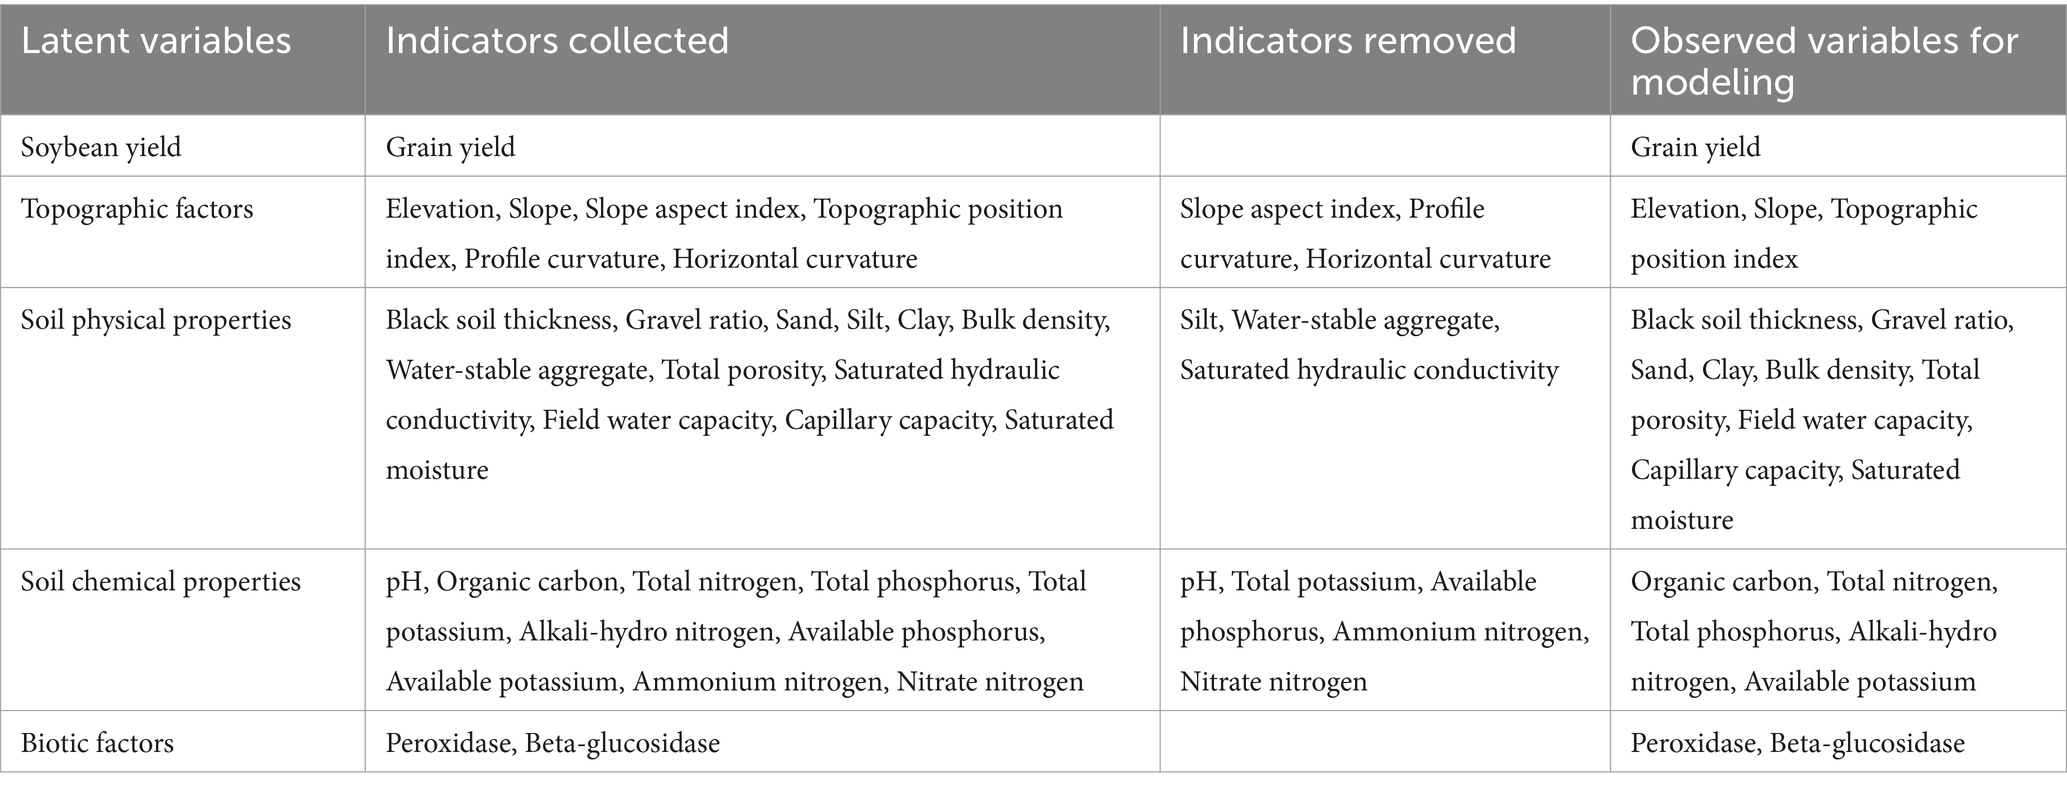
Table 1. Influencing factors of soybean yield in the study area.
A structural model describes the relationship between latent variables that cannot be directly measured or observed, expressed as:
In Equation 3 where B and Г are path coefficients, B represents the relationship between endogenous latent variables, Г represents the influence of exogenous latent variables on the value of endogenous latent variables, and ξ is the error term of the structural equation.
SEM is divided into Hierarchical SEM, Bayesian SEM, and Partial least-squares SEM. Compared with other methods, PLS-SEM requires less prior knowledge, is suitable for non-normal distribution and small sample size data, and has good performance when considering multicollinearity (Fan et al., 2016). Therefore, in this study, four indexes affecting soybean yield were selected from the aspects of terrain factors, soil physical properties, soil chemical properties, and biological factors, and PLS-SEM was chosen for this study to analyze the driving factors of soybean yield in the northeast black soil region of China. Since this study was conducted on a small catchment scale, factors such as policy, temperature, and precipitation, which have insignificant differences, were not taken into account. Based on the influence of each factor on soybean yield and their interrelationships, a conceptual model of the soybean yield driving factor was constructed (Figure 2). The plspm package in R 4.2.1 is used to realize partial least square structural equation modeling and model verification. During the process of model construction and improvement, after testing the reliability, validity, and prediction accuracy of the model, measurement indexes with low loadings between the latent variables that affected the accuracy of the model were removed. Finally, 5 latent variables and 19 observed variables were determined (Table 1).
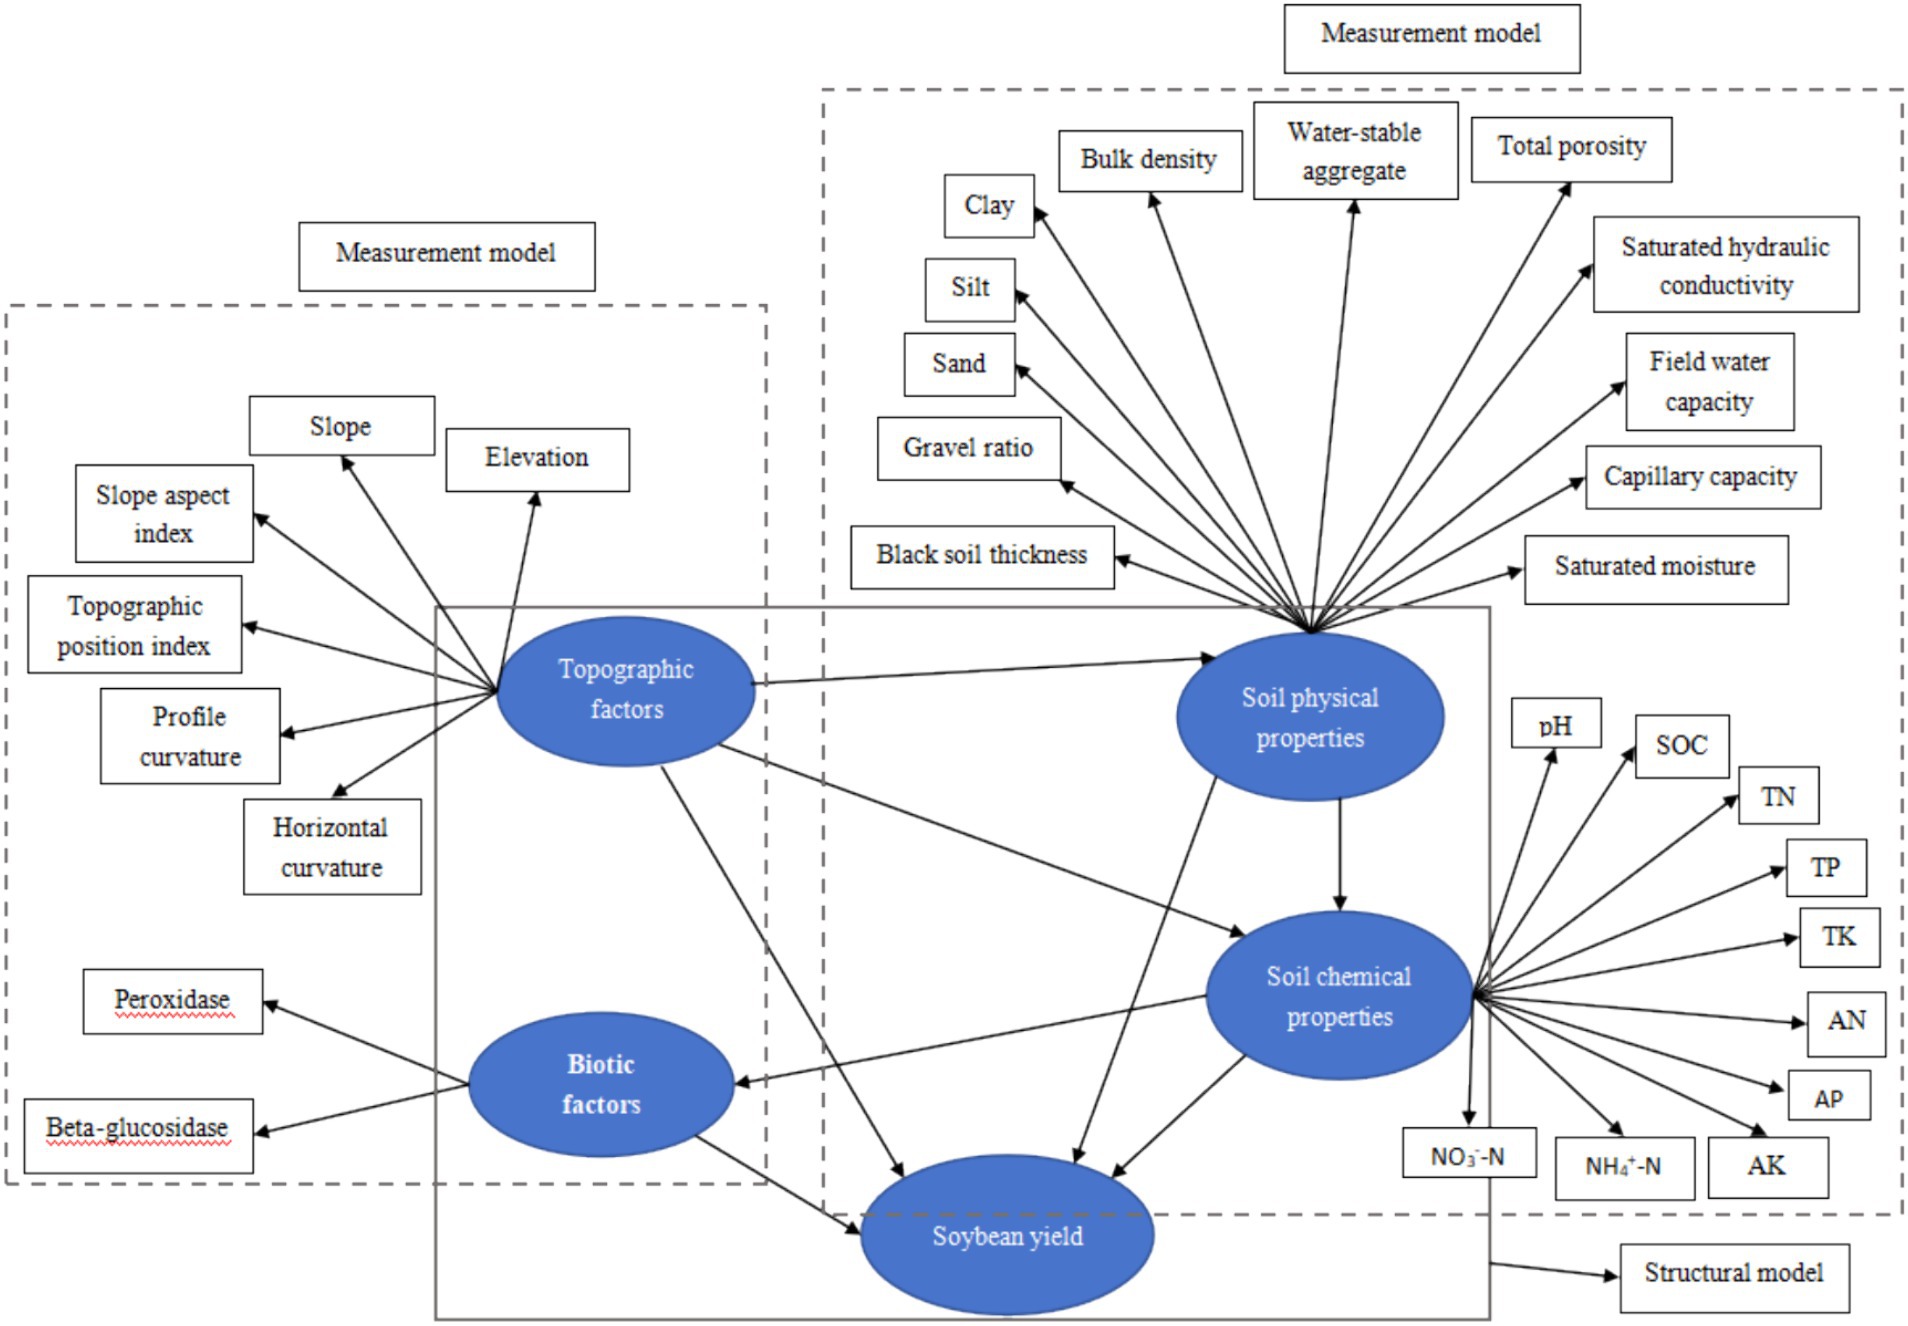
Figure 2. PLS-SEM model framework, the rectangle represents observed variables, the ellipse represents potential variables, and the arrow represents the relationship between observed variables and potential variables or the influence path between potential variables. SOC, organic carbon; TN, total nitrogen; TP, total phosphorus; TK, total potassium; AN, alkali hydrolyzed nitrogen; AP, available phosphorus; AK, quick available potassium; NH4 + -N, ammonium nitrogen; NO3--N, nitrate nitrogen.
The coefficient of determination (R2) and goodness-of-fit (GoF) were used to test the constructed PLS-SEM model. R2 < 0.19, 0.19 < R2 < 0.33, 0.33 < R2 < 0.67 represent weak, medium, and strong prediction accuracy levels, respectively (Wang Y. et al., 2021; Wang M. et al., 2023). GoF values higher than 0.1, 0.25, and 0.36 indicate weak, medium, and strong, respectively (Tenenhaus et al., 2004; Wang M. et al., 2023).
2.4 Yield classification
The soybean yield in the study catchment ranged from 950.4 to 3782.4 kg·ha−1, and 90% of the samples concentrated between 2179.0 and 3579.0 kg·ha−1. The 5th percentile (2179.0 kg·ha−1) and 95th percentile (3579.0 kg·ha−1) of soybean yield were used as the lowest and highest limits of the range, respectively, creating a range of 1400.0 kg·ha−1, and the range was divided into 5 intervals with equal yield ranges of 466.7 kg·ha−1. Soybean yield grades were divided into the following categories: lowest (<2179.0 kg·ha−1), low (2179.0–2645.7 kg·ha−1), medium (2645.7–3112.4 kg·ha−1), high (3112.4–3579.0 kg·ha−1), and highest (>3579.0 kg·ha−1).
3 Results
3.1 Characteristics of soybean yield
The average yield of soybean in each grade was 1729.3, 2430.9, 2863.1, 3250.9, and 3688.0 kg·ha−1. 50.0% of the 46 samples showed high yield, while 13.0 and 6.5% of the samples showed low and lowest yield, respectively (Figure 3). It could be seen that the variation of soybean yield per unit area was large in the small catchment of study, and the soybean yield per unit area in most samples was concentrated in the medium and high levels.
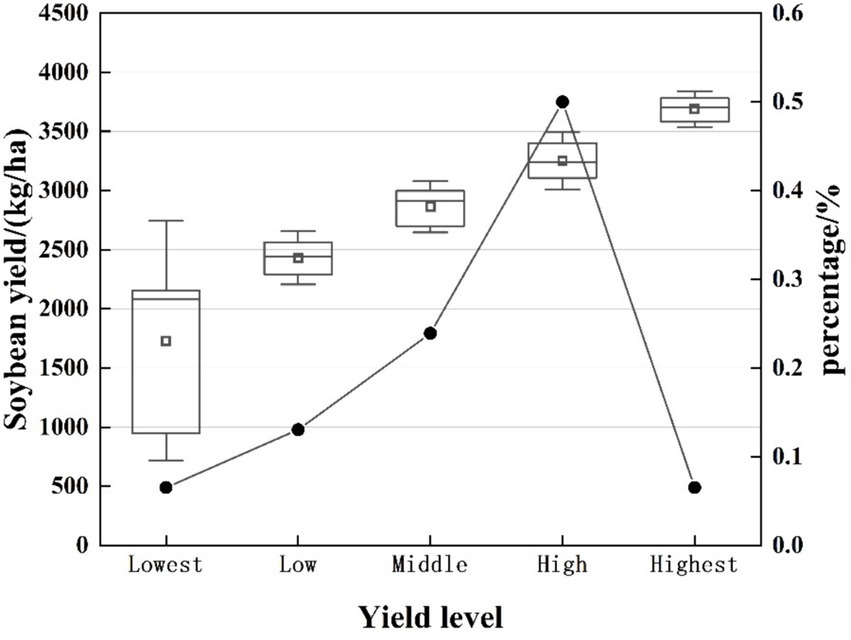
Figure 3. Soybean yield in the study area.
Soybean yield varied across different landforms, and the study area was divided into upper slope, middle slope, and lower slope. The proportion of upper slope sample sites accounted for 32.6%, middle slope sample sites accounted for 50.0%, and lower slope sample sites accounted for 17.4% (Table 2). The average soybean yield was highest on the lower slope, followed by the upper slope, and lowest on the middle slope.
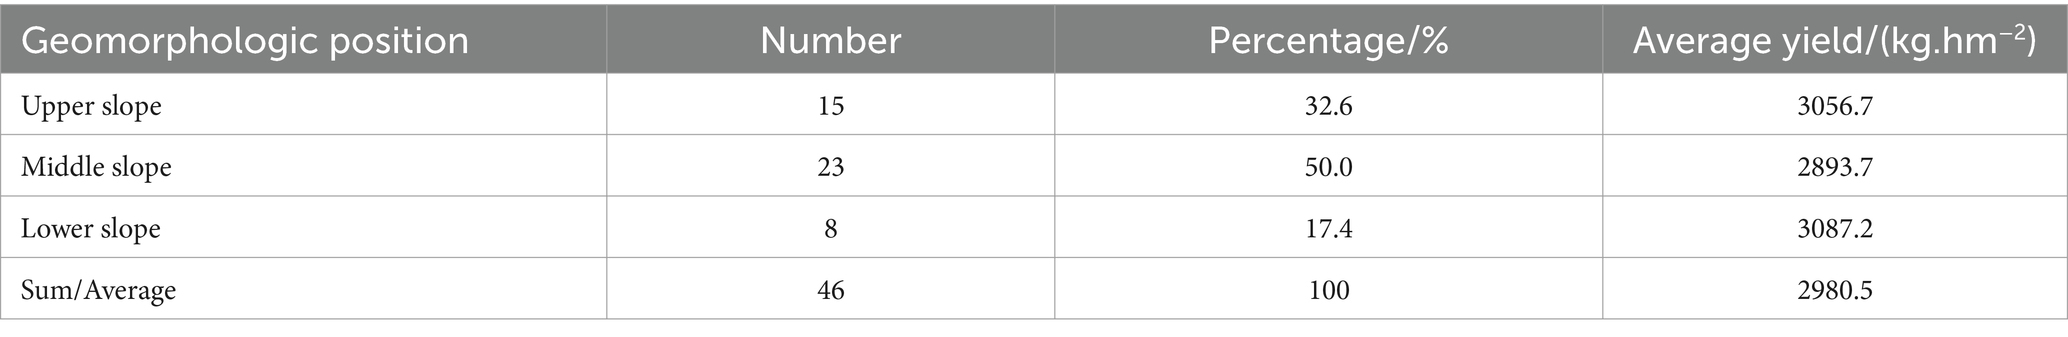
Table 2. Statistics of soybean yield at different slope sites.
3.2 Model validation
Cronbach’s Alpha value, Dillon-Goldstein’s rho value, and component reliability (CR) were used to test the internal consistency reliability of the model. In this study, each latent variable’s Cronbach’s Alpha value was greater than 0.60, and both Dillon-Goldstein’s rho and CR values were greater than 0.70 (Table 3), indicating that the measurement model had good reliability (Hair et al., 2019). The convergent validity of each latent variable was evaluated using the average variance extracted (AVE), and the discriminant validity was evaluated by the Fornell-Larcker criteria and cross-loading of indicators. In this study, AVE values were all greater than 0.50 (Table 3), indicating that the model had convergent validity (Hair et al., 2014). The square root of the AVE value of each latent variable is greater than the correlation coefficient between that latent variable and other latent variables (Table 4) (Hair et al., 2014). The loading value of each indicator on its latent variable is greater than its cross-loading on other latent variables (Table 5) (Henseler et al., 2009). It shows that this research model has discriminant validity.
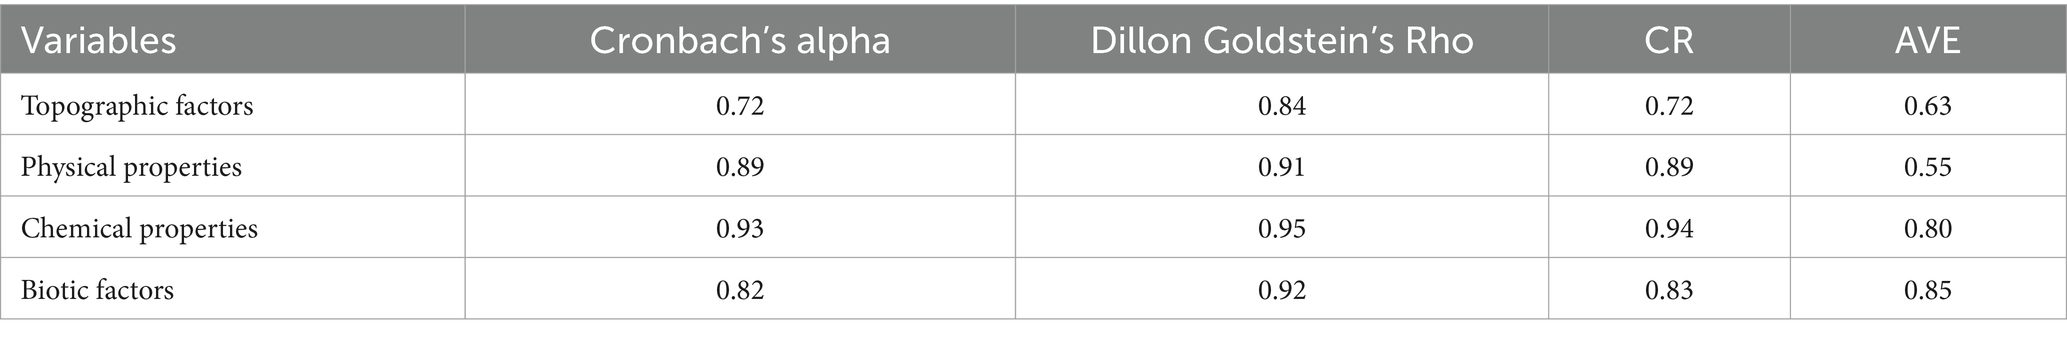
Table 3. Evaluation of the external model’s singleness principle.
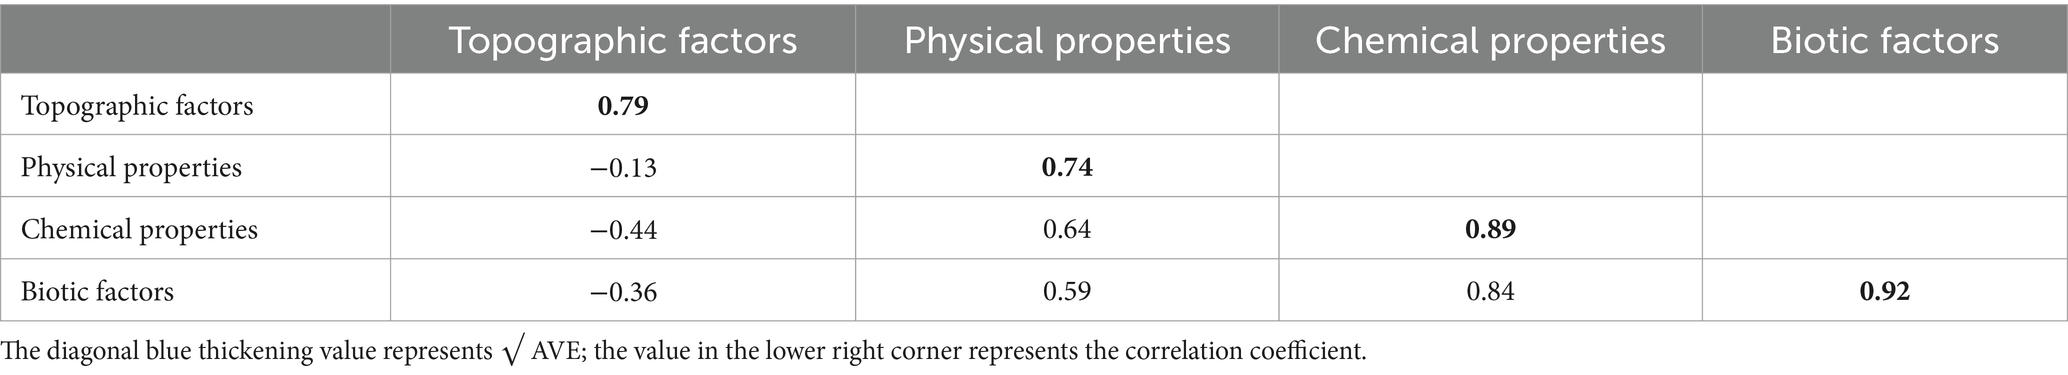
Table 4. Fornell-Larcker criteria.
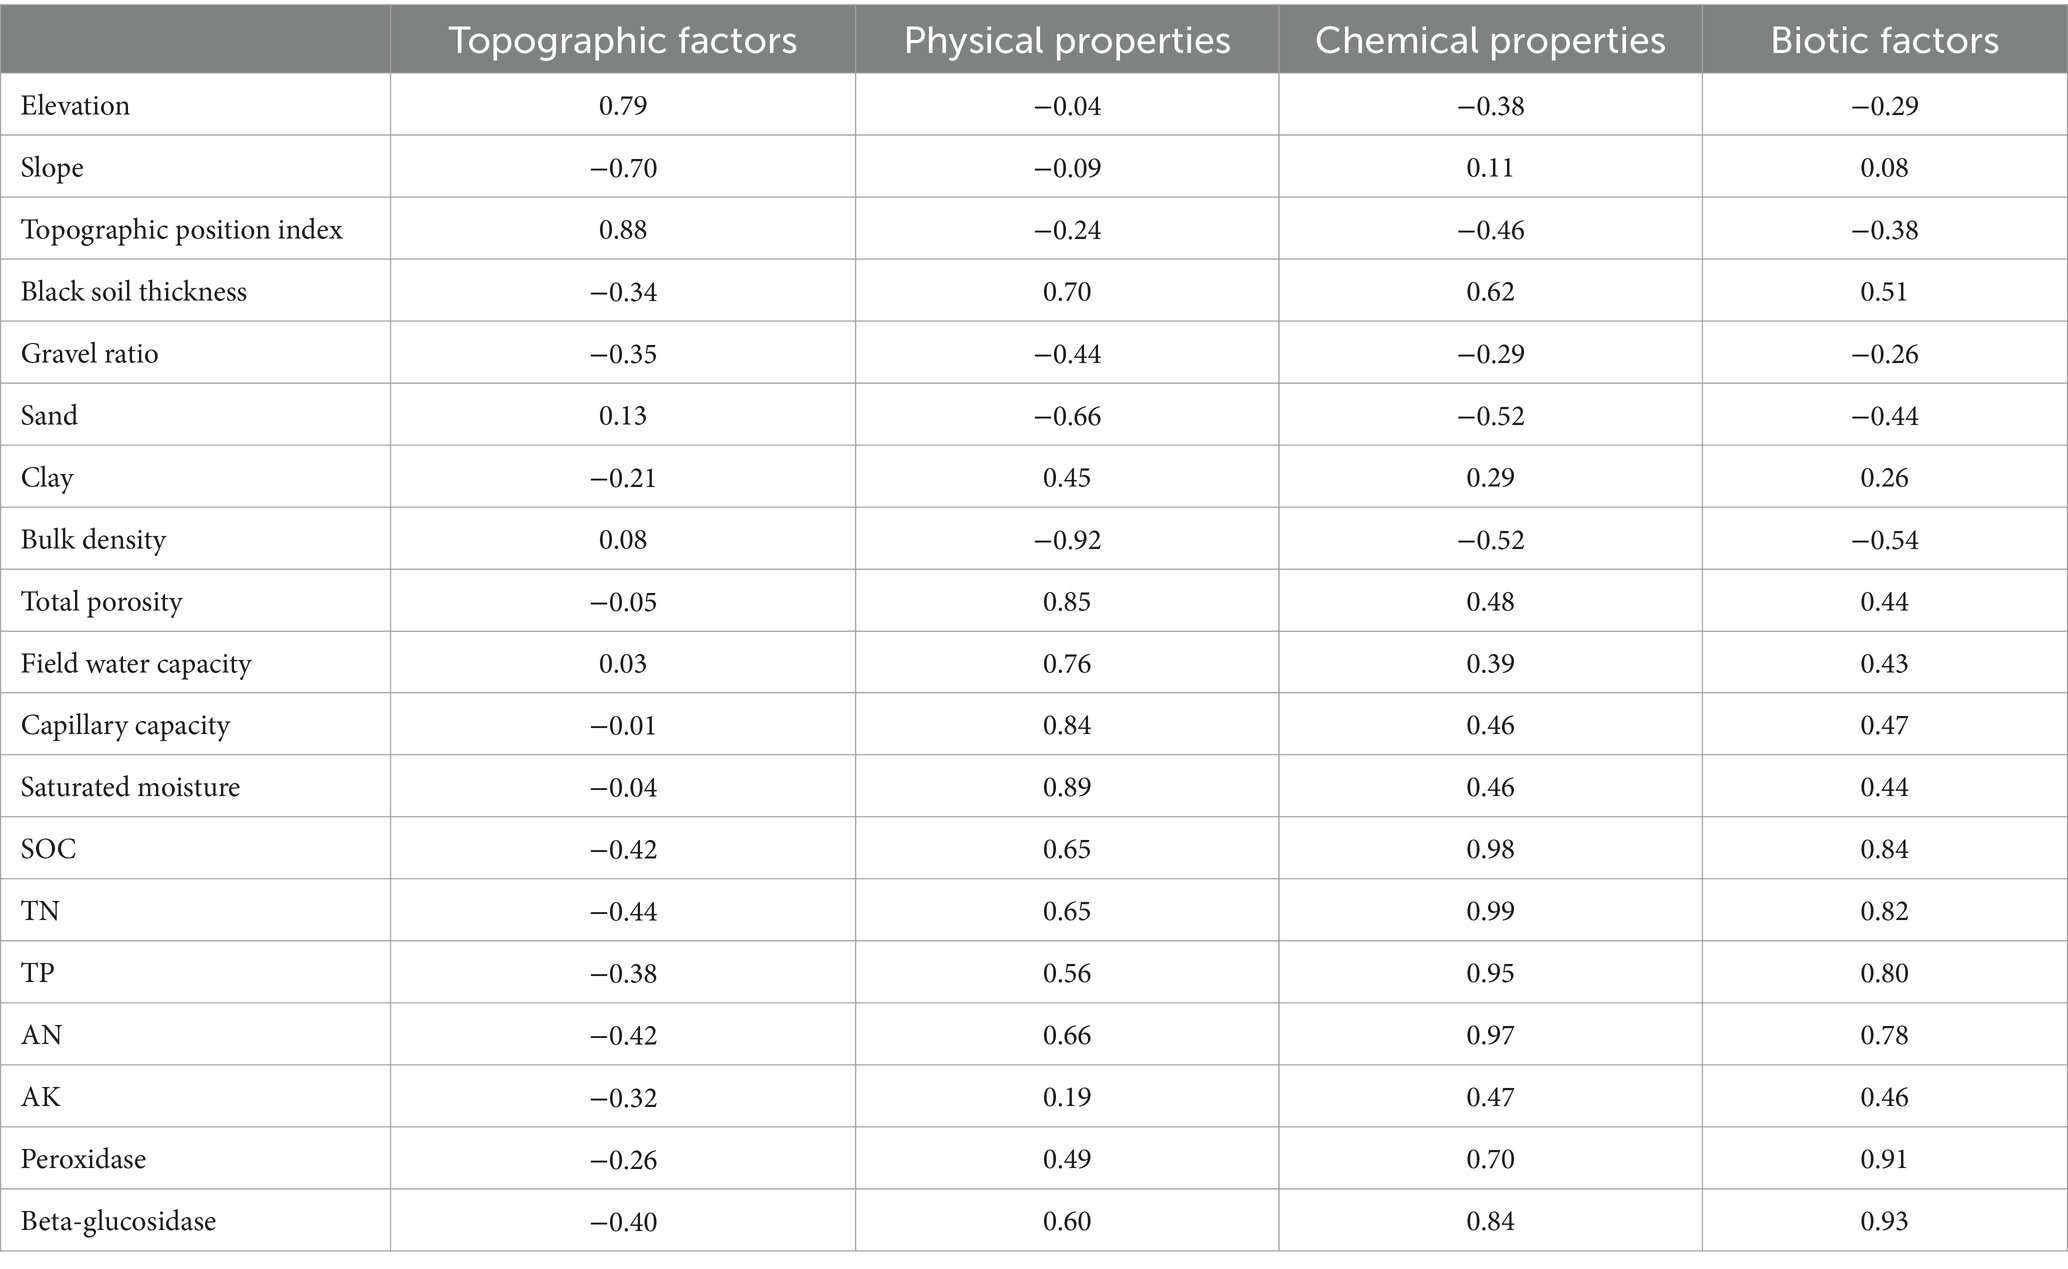
Table 5. Cross loadings between measured and latent variables.
The determination coefficient (R2) and goodness-of-fit (GoF) were used to evaluate the predictive accuracy and quality of the model. In this study, soil chemical properties explain 57.0% of the variance, and biological factors explain 70.0% of the variance in the model, indicating that the explanatory ability of the model meets the requirements. The GoF value is used to evaluate the quality of the model. The GoF value of the research model is 0.507 (Figure 4), indicating that the model quality is good.
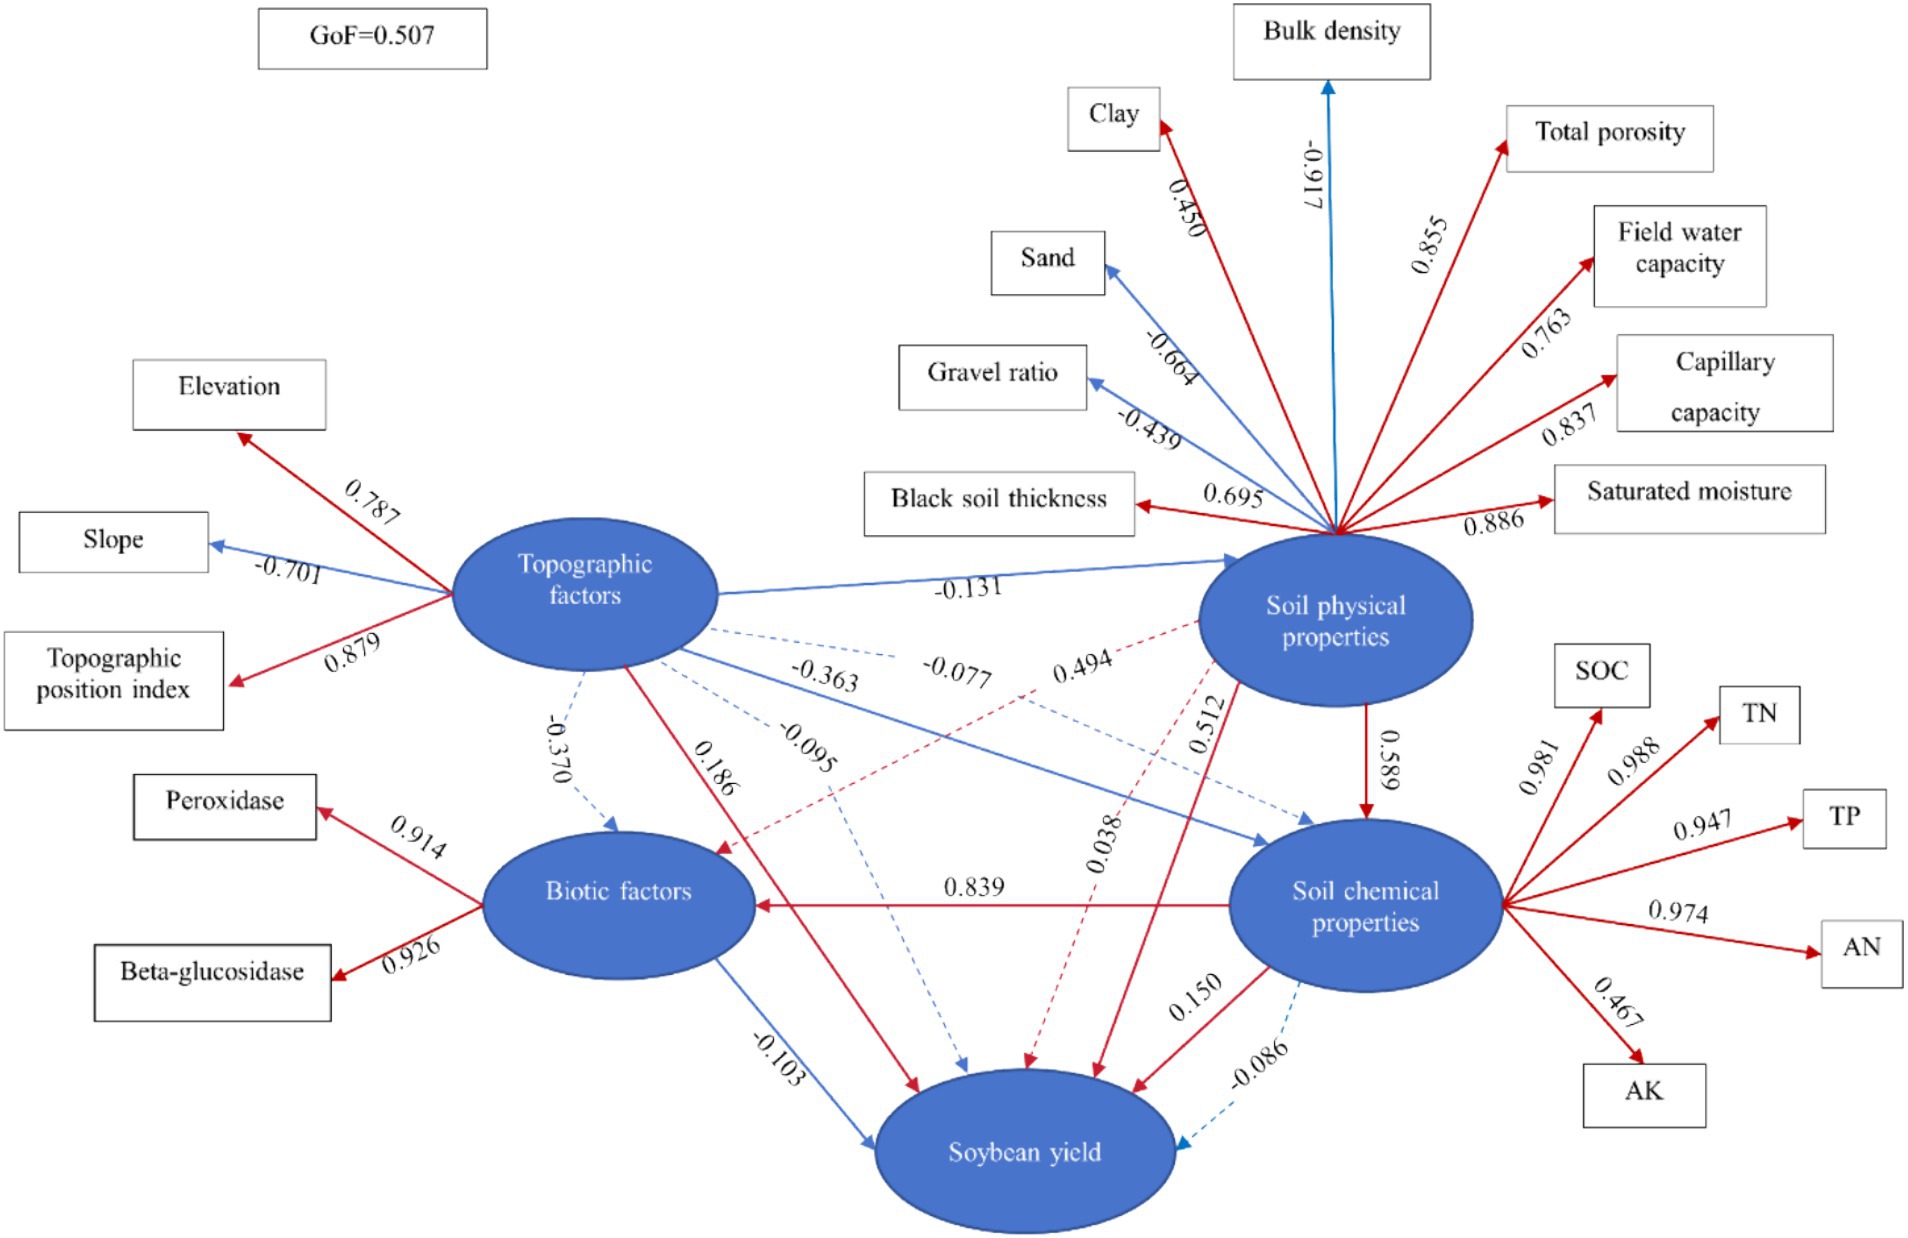
Figure 4. PLS-SEM of soybean yield driving relationship. → indicates the path by which the former affects the latter; The solid line represents the path coefficient and the dashed line represents the indirect effect. Red indicates positive influence and blue indicates negative influence.
3.3 The influence of explanatory variables on soybean yield
The PLS-SEM model shows the influence paths and degrees of topographic factors, soil physicochemical properties, and biological factors on soybean yield, interaction paths among all factors, and the relationship between latent variables and measured variables (Figure 4). The path coefficient shows the direction and intensity between the explanatory variable and the response variable. Topographic factors (0.186), soil physical properties (0.512), and soil chemical properties (0.150) had positive effects on soybean yield, whereas biological factors (−0.103) had negative effects on soybean yield. Additionally, topographic factors had negative effects on soil physical properties (−0.131) and soil chemical properties (−0.363), which further affected soybean yield. Soil physical properties had a positive effect on soil chemical properties (0.589), which in turn affected soybean yield. Soil chemical properties had a positive effect on biological factors (0.839), which further affected soybean yield.
Among the topographic factors, the topographic position index is the key factor (0.879), followed by elevation (0.787) and slope (−0.701). Among soil physical properties, soil bulk density is the key factor (−0.917), followed by saturated water content (0.886), total porosity (0.855), capillary water holding capacity (0.837), field water holding capacity (0.763), black soil thickness (0.695), sand particle size (−0.664), clay particle size (0.450), and gravel ratio (−0.439). In soil chemical properties, total nitrogen (0.988) was the key factor, followed by organic carbon (0.981), alkali-hydrolyzed nitrogen (0.974), total phosphorus (0.947), and available potassium (0.467). Among biological factors, β-glucosidase (0.926) was the key factor, followed by catalase (0.914).
Figure 5 shows the total, direct, and indirect effects of each latent variable on soybean yield, as well as the effects among the latent variables. All kinds of factors have a direct or indirect influence on soybean yield, and the effect size of each path is different. In terms of the total effect, soil physical properties were the main driving factors of soybean yield, followed by biological factors, topographic factors, and soil chemical properties. In terms of direct influence, the size of each latent variable’s effect is soil physical properties > topographic factors > soil chemical properties > biological factors. The total effect of topographic factors on soybean yield was positive (0.090), the direct effect was positive (0.186), the indirect effect was negative (−0.095), and the direct effect was greater than the indirect effect. Soil physical properties had positive effects on soybean yield (0.549), mainly direct effects (0.512). The total effect of soil chemical properties on soybean yield was positive (0.150), and the indirect effect was negative (−0.086). The biological factors had a direct negative effect on soybean yield (−0.103). Furthermore, there are complex interactions among the latent variables. Topographic factors had direct negative effects on soil physical properties (−0.131), total negative effects on soil chemical properties (−0.441), and indirect negative effects on biological factors (−0.370). Soil physical properties had a direct positive effect on soil chemical properties (0.589) and an indirect positive effect on biological factors (0.494). Soil chemical properties had a direct positive effect on biological factors (0.839).
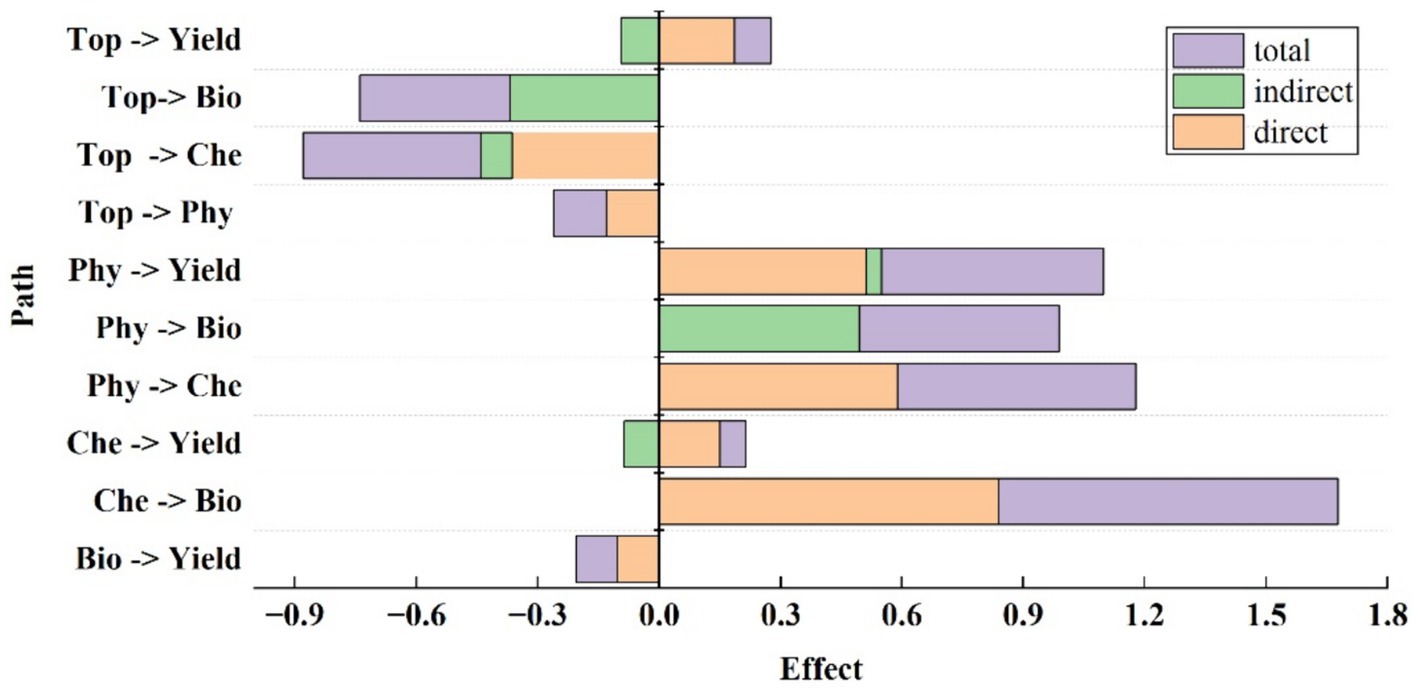
Figure 5. The total, direct, and indirect effects of explanatory variables on soybean yield in PLS-SEM. Top, topographic factors; Phy, Soil physical properties; Che, Soil chemical properties; Bio, Biotic factors.
Figure 6 shows the relative contribution ratio of each latent variable to the soybean yield. The relative contribution of soil physical properties to soybean yield was 68.1%, that of biological factors was 12.7%, that of topographic factors was 11.2%, and that of soil chemical properties was 7.9%. The relative contribution ratio of soil physical properties to soybean yield is more than 50%, making it the main factor affecting soybean yield.
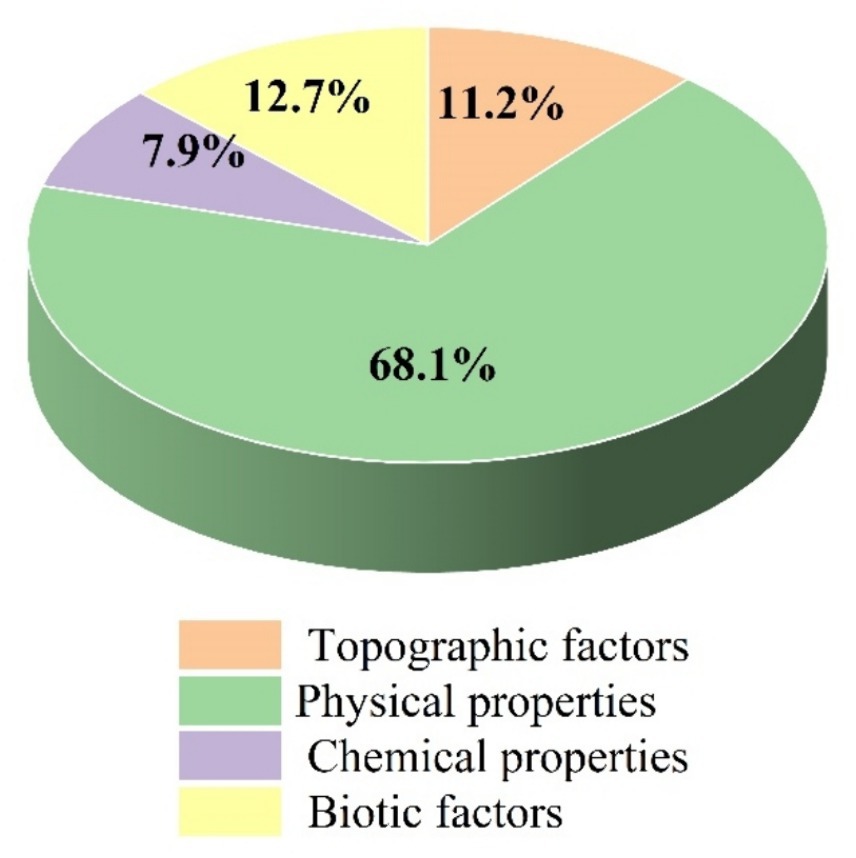
Figure 6. The relative proportion of total influence of various factors on soybean yield.
4 Discussions
4.1 Model evaluation
In this study, through field sampling, sample testing, and PLS-SEM modeling of influencing factors of soybean yield, the main and secondary factors affecting soybean yield were identified, along with the influence degree and direction of each factor, and the relationships between variables were clarified. PLS-SEM has advantages over traditional methods such as correlation analysis, principal component analysis, and regression analysis in analyzing the influencing factors of soybean yield. Additionally, the goodness-of-fit of the model is 0.507, which indicates that the precision of the model in this study is better than that of related studies using this method (Liu and Zhao, 2023; Wang M. et al., 2023), demonstrating that this model is suitable for exploring the influencing factors of soybean yield. Since this study has not discussed the relationships between indicators within each latent variable, more detailed modeling is needed in future research to explore the interaction paths between indicators within each type of factor.
4.2 Effect of topography on soybean yield
Terrain is one of the factors affecting soybean yield, and topographic factors in the small catchment have a direct positive impact on soybean yield (Figure 4), in which the loadings of the topographic index and elevation on the topographic factor are positive and greater than the negative loading of slope on the topographic factor. In addition, the yield in the lower slope area of the small catchment is the highest, followed by the upper slope and middle slope (Table 2). Thus, the yield is higher in the flatter areas at the bottom and top of the catchment. In addition, topographic factors have indirect negative effects on the yield of the small catchment. Previous studies have shown that the yield at the lower slope is greater than that at the middle or upper slope, and the yield at the higher elevation, slope, and curvature is lower (Sam et al., 2021). Under the regulation of precipitation, when the precipitation is lower than the normal year, the yield is negatively correlated with elevation, slope curvature, etc., while when the precipitation is greater than in normal years, it is positively correlated (Kaspar et al., 2003). The monthly precipitation in the study area was lower than the annual average monthly precipitation, and the topographic factors had indirect negative effects on soybean yield, which is consistent with the results of previous studies. The terrain in this study area further affected the yield of soybeans by influencing the soil physical properties and the migration and distribution of nutrient elements. Topographic attributes influence soil development, erosion, and deposition (Pennock and Dejong, 1987; Walker et al., 1968), which in turn affects crop yields. The soil sand content at the top of the slope is high and the soil layer is thin, while the soil deposit at the bottom of the slope is thick. Especially in years with less precipitation, these characteristics can make the top of the slope less able to provide adequate water and nutrients to the crop, resulting in lower yields. Elevation and slope affect soybean yield by influencing the infiltration and runoff of surface water and groundwater (Hou et al., 2020). Due to gravity, water moves from higher elevations to lower elevations, and an increase in slope reduces water infiltration. Terrain attributes affect the redistribution of water flow and nutrients and thus affect the soybean yield. The precipitation in this study year is lower than the average annual precipitation, and the effect of topography on the redistribution of water and fertilizer is small. Therefore, the indirect effect of topographic factors on soybean yield by influencing soil physicochemical properties was minimal (−0.10) (Figure 4).
4.3 Effects of soil physical properties on soybean yield
In this study, soil physical properties had the greatest impact on soybean yield (Figure 4). The loadings of black soil thickness, clay, total porosity, field water capacity, capillary water capacity, and saturated water content on soil physical properties were positive, and these factors had a positive impact on soybean yield. The loadings of gravel ratio, sand particle size, and bulk density on soil physical properties were negative, which had a negative effect on soybean yield. This is consistent with previous research results (Asadu et al., 2002; de Marins et al., 2018; Lin et al., 2022; Yang et al., 2022). Among these factors, soil bulk density had the largest loading value, followed by saturated water content and total porosity. According to the results of this study, soil improvement in the small catchment is the key to yield improvement. The study area has a high degree of mechanization, so it is necessary to consider the compaction of soil by large-scale agricultural machinery, reduce soil bulk density, increase soil porosity, and improve soil water retention. The black soil layer thickness is an important material basis for crop growth, which is closely related to soil fertility and has a significant positive correlation with crop yield (Duan et al., 2011; Moonilall et al., 2023). On the one hand, it affects crop yield by affecting the expansion space of crop roots; on the other hand, it affects crop growth by affecting the available nutrients of black soil. The thinner the soil, the fewer soil nutrients and the lower its water and fertilizer supply capacity (Wang et al., 2009; Feng et al., 2018; Zhang et al., 2021), thus resulting in lower crop yield. Furthermore, the relationship between soil topsoil thickness or erosion depth and crop yield is not linear (Wang et al., 2009; Zhang et al., 2021), which means that in eroded soils, there may be a threshold for the thickness of the black soil layer that supports sustainable soil production. Therefore, the determination of this threshold value will be of great significance for soil and water conservation and sustainable agricultural production. The influence of soil mechanical composition on crop growth is mainly achieved through soil water retention, aeration performance, and organic matter retention, which have a significant relationship with crop yield (Olivares et al., 2022). In addition, soil mechanical composition affects crop yield by affecting soil porosity. Soil water constant reflects the retention and movement of water in the soil, the degree and grade of moisture, and the extent to which it can be absorbed and utilized by plants. Too wet or too dry soil is not conducive to the absorption of water and nutrients by crops, and soil water status is a key factor affecting crop yield.
The soil physical properties in the study area had direct and indirect effects on soybean yield (Figure 5). It affects crop growth directly by influencing soil nutrient retention and soil thermal properties, and indirectly by influencing soil chemical properties, which in turn affect soil biology and crop yield. There is a direct or indirect relationship between soil physical properties, soil chemical properties, and biological factors, which is consistent with previous research results (Wang C. et al., 2023; Wang et al., 2009). The black soil layer contains a lot of nutrients, and the thickness of the soil layer affects the amount of nutrients in the soil. The thinner the black soil layer, the less the nutrient content in the soil layer, and the less nutrients available for soybeans. Clay particles in the soil can absorb and retain nutrients in the soil, and prevent nutrient loss so that nutrients can be effectively maintained and recycled in the soil. Therefore, clay content in soil can affect soybean yield by affecting nutrient retention and release. Additionally, soil water is the raw material and solvent in the physiological processes of soybeans. The soil water condition not only directly affects the growth of soybeans but also influences their yield by affecting nutrient absorption.
4.4 Effects of soil chemical properties on soybean yield
Soil chemical properties in the study area had a positive overall effect on soybean yield, with organic carbon, total nitrogen, total phosphorus, alkali-hydrolyzed nitrogen, and available potassium being the key factors, which is consistent with previous findings (Liu and Zhao, 2023). Soil organic carbon, nitrogen, phosphorus, and other elements are essential nutrients for soybean growth, and there is a significant relationship between soybean yield and the amount of these nutrients, which directly affect the growth of soybeans. Previous studies have shown that soil nutrient elements further influence crop yield by affecting soil enzyme activity (Wang J. et al., 2021; Cheng et al., 2023), which is consistent with the results of this study. Soil nutrient content affects the metabolic activities of soil microorganisms, and thus affects the activity of soil enzymes, which in turn affects the yield of soybean. Among them, organic carbon, total nitrogen, and available potassium are significantly positively correlated with catalase and β-glucosidase, which can influence the release of root exudates, thus affecting enzyme activity and ultimately influencing crop yield per unit area (Wu et al., 2020; Cheng et al., 2023; Xie et al., 2024). In this study, the relative contribution of nutrient elements to soybean yield was 7.9% (Figure 6), which was the smallest among the four types of influencing factors. This is because the nutrient elements in the black soil are supplemented by applying base fertilizer before soybean sowing and by adding urea and phosphate fertilizer during soybean growth. In addition, the rainfall in the study year was less than the average annual precipitation in the region, the migration of soil nutrients was limited, and the spatial distribution of nutrients was more uniform compared to other years. Therefore, the influence of nutrients on soybean growth in the study area was not the greatest.
4.5 Effects of biological factors on soybean yield
Soil enzymes are mainly synthesized and secreted by microorganisms and living animals and plants, which can promote the decomposition of organic matter, improve nutrient availability, and subsequently promote crop growth and yield. These enzymes are indicators of soil biological activity. Catalase can decompose and transform peroxides in soil, eliminating their adverse effects on soil quality, promoting crop growth, and increasing yield. β-glucosidase can decompose cellulose to produce glucose, which is the main energy source for the survival of soil microorganisms. Its activity directly affects the decomposition of soil organic carbon and its complexes. In this study, biological factors had a direct negative effect on soybean yield. Previous studies have shown that soil catalase and β-glucosidase are significantly positively correlated with crop yield (Wang J. et al., 2021; Xie et al., 2024), contrary to the results of this study. This discrepancy may be due to soil enzyme activity being influenced not only by soil nutrients but also by soil hydrothermal conditions, crop type, and other factors, and it may also change with nutrient content and crop growth stages (Zhou et al., 2013). Soil enzyme activity is coordinated with the crop’s fertilizer demand. When the nutrient demand of crops decreases, enzyme activity also decreases. In this study, soil samples were mainly collected in August, During August, soybeans in this area entered the seed formation stage, where reproductive growth dominates, and there is a rapid transfer of nutrients to seeds. Although soybeans need a lot of nutrients and water at this stage, the absorption capacity of the root system is seriously decreased. Coupled with the spraying of foliar fertilizer, soybeans show a decreased demand for soil nutrients, which in turn reduces soil enzyme activity.
5 Conclusion
In this study, a sample site was established in Hebei Catchment, Nenjiang City, Heilongjiang Province, and soybean yield and its influencing factors, including terrain, soil physical properties, soil chemical properties, and biological factors, were collected and measured, including terrain, soil physical properties, soil chemical properties, and biological factors. The PLS-SEM model was used to study the effects of these explanatory variables on soybean yield at a small catchment scale, and the path relationships between them were fitted. The results showed that the total effects of topographic factors, soil physical properties, and soil chemical properties on soybean yield were positive, whereas the total effects of biological factors on soybean yield were negative. Regarding total effects, soil physical properties had the greatest impact on soybean yield, followed by biological factors, topographic factors, and soil chemical properties. The relative contributions of soil physical properties, biological factors, topographic factors, and soil chemical properties to soybean yield were 68.1, 12.7, 11.2, and 7.9%, respectively. It was concluded that soil physical properties were the key factors affecting soybean yield, with black soil thickness, gravel ratio, sand, clay, bulk density, total porosity, field water capacity, capillary water capacity, and saturated water content being the most significant factors. Soil physical properties primarily affected soybean yield directly and indirectly by influencing soil chemical properties and biological factors. On one hand, soil physical properties directly affected soybean yield; on the other hand, they affected soybean yield by influencing soil chemical properties. Additionally, soil physical properties influenced soil chemical properties, which in turn affected biological factors, ultimately impacting soybean yield. The research results have important theoretical and practical significance for understanding the driving factors of soybean yield in a small catchment in the Northeast Black Soil Region and have practical implications for soil management decision-making.
Data availability statement
The original contributions presented in the study are included in the article/supplementary material, further inquiries can be directed to the corresponding author.
Author contributions
YT: Conceptualization, Formal analysis, Investigation, Methodology, Software, Validation, Visualization, Writing – original draft, Writing – review & editing. ZW: Conceptualization, Data curation, Funding acquisition, Investigation, Project administration, Resources, Supervision, Validation, Writing – review & editing.
Funding
The author(s) declare that financial support was received for the research, authorship, and/or publication of this article. This work was funded by the National Key Research and Development Program of China (2022YFE011530004), and the National Key Research and Development Program of China (2021YFD1500803). The authors also thank Ruoxuan Liu for his contribution to soil sampling.
Conflict of interest
The authors declare that the research was conducted in the absence of any commercial or financial relationships that could be construed as a potential conflict of interest.
Publisher’s note
All claims expressed in this article are solely those of the authors and do not necessarily represent those of their affiliated organizations, or those of the publisher, the editors and the reviewers. Any product that may be evaluated in this article, or claim that may be made by its manufacturer, is not guaranteed or endorsed by the publisher.
References
Asadu, C. L. A., Dixon, A. G. O., and Okechukwu, R. (2002). Comparative evaluation of the contributions of soil physicochemical properties to variations in the yields of four major staple food crops in eastern Nigeria. Soil Tillage Res. 65, 141–155. doi: 10.1016/s0167-1987(01)00276-8
Bogunovic, I., Pereira, P., Kisic, I., Sajko, K., and Sraka, M. (2018). Tillage management impacts soil compaction, erosion, and crop yield in Stagnosols (Croatia). Catena 160, 376–384. doi: 10.1016/j.catena.2017.10.009
Cheng, X., Zhuangzhuang, Q., Bo, W., Tao, Y., Zeyang, L., Di, T., et al. (2023). Effects of poplar agroforestry systems on soil nutrient and enzyme activity in the coastal region of eastern China. J. Soils Sediments 23, 3108–3123. doi: 10.1007/s11368-023-03553-4
de Marins, A. C., Reichert, J. M., Secco, D., Rosa, H. A., and Veloso, G. (2018). Crambe grain yield and oil content are affected by spatial variability in soil physical properties. Renew. Sust. Energ. Rev. 81, 464–472. doi: 10.1016/j.rser.2017.08.003
Dong, H., Han, J., Zhang, Y., Chen, T., Fan, H., and Wang, C. (2023). Research on influencing factors of cultivated land productivity of high-standard farmland projects in Hanzhong city of China – an empirical study based on PLS-SEM. Front. Sustain. Food Syst. 7:1176426. doi: 10.3389/fsufs.2023.1176426
Duan, X., Xie, Y., Ou, T., and Lu, H. (2011). Effects of soil erosion on long-term soil productivity in the black soil region of northeastern China. Catena 87, 268–275. doi: 10.1016/j.catena.2011.06.012
Faé, G. S., Kemanian, A. R., Roth, G. W., White, C., and Watson, J. E. (2020). Soybean yield in relation to environmental and soil properties. Eur. J. Agron. 118:126070. doi: 10.1016/j.eja.2020.126070
Fan, Y., Chen, J., Shirkey, G., John, R., Wu, S. R., Park, H., et al. (2016). Applications of structural equation modeling (SEM) in ecological studies: an updated review. Ecol. Process. 5, 1–12. doi: 10.1186/s13717-016-0063-3
Feng, Z., Zheng, F., Hu, W., Li, G., and Xu, X. (2018). Impacts of mollic epipedon thickness and overloaded sediment deposition on corn yield in the Chinese Mollisol region. Agric. Ecosyst. Environ. 257, 175–182. doi: 10.1016/j.agee.2018.02.010
Green, T. R., Salas, J. D., Martinez, A., and Erskine, R. H. (2007). Relating crop yield to topographic attributes using spatial analysis neural networks and regression. Geoderma 139, 23–37. doi: 10.1016/j.geoderma.2006.12.004
Hair, J. F., Risher, J. J., Sarstedt, M., and Ringle, C. M. (2019). When to use and how to report the results of PLS-SEM. Eur. Bus. Rev. 31, 2–24. doi: 10.1108/ebr-11-2018-0203
Hair, J. F., Sarstedt, M., Hopkins, L., and Kuppelwieser, V. G. (2014). Partial least squares structural equation modeling (PLS-SEM): an emerging tool in business research. Eur. Bus. Rev. 26, 106–121. doi: 10.1108/EBR-10-2013-0128
Hao, C., Xiao, W., Zhou, Y., and Wang, Y. (2019). Phosphorus balance in typical rainfield of black soil region in Northeast China. Geosci. J. 23, 637–648. doi: 10.1007/s12303-018-0069-1
Henseler, J., Ringle, C. M., and Sinkovics, R. R. (2009). The use of partial least squares path modeling in international marketing. Adv. Int. Mark. 20, 277–320. doi: 10.1108/S1474-7979(2009)0000020014
Hou, S., Cui, Y., Meng, L., Wu, D., Qian, L., Bao, Y., et al. (2020). Effects of terrain on soybean yields in rolling hilly black soil areas. Trans. Chin. Soc. Agri. Eng. 36, 88–95.
Jagadamma, S., Lal, R., Hoeft, R. G., Nafziger, E. D., and Adee, E. A. (2008). Nitrogen fertilization and cropping system impacts on soil properties and their relationship to crop yield in the central Corn Belt, USA. Soil Tillage Res. 98, 120–129. doi: 10.1016/j.still.2007.10.008
Kang, X., Qi, J., Li, S., and Meng, F.-R. (2022). A watershed-scale assessment of climate change impacts on crop yields in Atlantic Canada. Agric. Water Manag. 269:107680. doi: 10.1016/j.agwat.2022.107680
Kaspar, T. C., Colvin, T. S., Jaynes, D. B., Karlen, D. L., James, D. E., Meek, D. W., et al. (2003). Relationship between six years of corn yields and terrain attributes. Precis. Agric. 4, 87–101. doi: 10.1023/A:1021867123125
Li, A., and Duan, X. (2014). Productivity assessment for black soil region in northeastern China using black soil thickness – a case study of Hebei watershed. J. Soil Water Conserv. 34, 154–159. doi: 10.13961/j.cnki.stbctb.2014.01.044
Lin, L., Han, S., Zhao, P., Li, L., Zhang, C., and Wang, E. (2022). Influence of soil physical and chemical properties on mechanical characteristics under different cultivation durations with Mollisols. Soil Tillage Res. 224:105520. doi: 10.1016/j.still.2022.105520
Liu, H., Wei, Y., Wang, L., and Wu, X. (2015). Influence of soil Erosion thickness on soybean yield and coupling mode of water and fertilizers of black soil in Northeast China. Int. J. u- e-Ser. Sci Technol. 8, 189–200. doi: 10.14257/ijunesst.2015.8.3.18
Liu, M., and Zhao, H. (2023). Maize-soybean intercropping improved maize growth traits by increasing soil nutrients and reducing plant pathogen abundance. Front. Microbiol. 14:1290825. doi: 10.3389/fmicb.2023.1290825
Luo, G., Ling, N., Xue, C., Dippold, M. A., Firbank, L. G., Guo, S., et al. (2019). Nitrogen-inputs regulate microbial functional and genetic resistance and resilience to drying–rewetting cycles, with implications for crop yields. Plant Soil 441, 301–315. doi: 10.1007/s11104-019-04120-y
Moonilall, N. I., Sklenka, K. A., Nocco, M. A., and Lal, R. (2023). Rehabilitative capacity of amendments to restore maize productivity following artificial topsoil erosion/ deposition. Field Crop Res. 304:109178. doi: 10.1016/j.fcr.2023.109178
Nanjing Institute of Soil Science, Chinese Academy of Sciences (1978). Soil physical and chemical analysis. Shanghai: Shanghai Science and Technology Press.
Olivares, B. O., Calero, J., Rey, J. C., Lobo, D., Landa, B. B., and Gómez, J. A. (2022). Correlation of banana productivity levels and soil morphological properties using regularized optimal scaling regression. Catena 208:105718. doi: 10.1016/j.catena.2021.105718
Pennock, D. J., and Dejong, E. (1987). The influence of slope curvature on soil-erosion and deposition in Hummock terrain. Soil Sci. 144, 209–217. doi: 10.1097/00010694-198709000-00007
Sam, J. L., Ole, W., Montserrat, S., and Hanna, P. (2021). Weather-dependent relationships between topographic variables and yield of maize and soybean. Field Crop Res. 276:108368. doi: 10.1016/j.fcr.2021.108368
Sha, Z., Xie, Y., Tan, X., Bai, Y., Li, J., and Liu, X. (2017). Assessing the impacts of human activities and climate variations on grassland productivity by partial least squares structural equation modeling (PLS-SEM). J. Arid. Land 9, 473–488. doi: 10.1007/s40333-017-0022-6
Tenenhaus, M., Amato, S., and Vinzi, E. V. (2004). A global goodness-of-fit index for PLS structural equation modelling. Proc. XLII SIS Sci. Meet. vol. 1.
Tian, S., Ning, T., Wang, Y., Liu, Z., Li, G., Li, Z., et al. (2016). Crop yield and soil carbon responses to tillage method changes in North China. Soil Tillage Res. 163, 207–213. doi: 10.1016/j.still.2016.06.005
Usowicz, B., and Lipiec, J. (2017). Spatial variability of soil properties and cereal yield in a cultivated field on sandy soil. Soil Tillage Res. 174, 241–250. doi: 10.1016/j.still.2017.07.015
Walker, P. H., Hall, G. F., and Protz, R. (1968). Relation between landform parameters and soil properties. Soil Sci. Soc. Am. Proc. 32:101. doi: 10.2136/sssaj1968.03615995003200010026x
Wang, C., Chu, L., Yang, Z., Yang, Z., Zhang, X., Wang, T., et al. (2023). Spatial heterogeneity and determinants of soybean yield in Northeast China. Trans. Chin. Soc. Agric. Eng. 39, 108–119. Available at: https://link.cnki.net/urlid/11.2047.S.20231213.1320.036
Wang, M., Liu, X., Liu, Z., Wang, F., Li, X., Hou, G., et al. (2023). Evaluation and driving force analysis of cultivated land quality in black soil region of Northeast China. Chin. Geogr. Sci. 33, 601–615. doi: 10.1007/s11769-023-1361-1
Wang, Z., Liu, B., Wang, X., Gao, X., and Liu, G. (2009). Erosion effect on the productivity of black soil in Northeast China. Sci. China Ser. D Earth Sci. 52, 1005–1021. doi: 10.1007/s11430-009-0093-0
Wang, Y., Liu, X., Wang, T., Zhang, X., Feng, Y., Yang, G., et al. (2021). Relating land-use/land-cover patterns to water quality in watersheds based on the structural equation modeling. Catena 206:105566. doi: 10.1016/j.catena.2021.105566
Wang, J., Wang, L., Liu, Y., Li, J., Zhang, M., and Zhang, Y. (2021). Effects of long-term different types of organic fertilizer application on sweet potato yield and soil biological trait. J. Soil Water Conserv. 35, 184–192. doi: 10.13870/j.cnki.stbcxb.2021.02.025
Wang, W., Zhang, F., Zhao, Q., Liu, C., Jim, C. Y., Johnson, V. C., et al. (2023). Determining the main contributing factors to nutrient concentration in rivers in arid Northwest China using partial least squares structural equation modeling. J. Environ. Manag. 343:118249. doi: 10.1016/j.jenvman.2023.118249
Wu, J., Wang, H., Li, G., Ma, W., Wu, J., Gong, Y., et al. (2020). Vegetation degradation impacts soil nutrients and enzyme activities in wet meadow on the Qinghai-Tibet plateau. Sci. Rep. 10:21271. doi: 10.1038/s41598-020-78182-9
Xie, Y., Tang, J., Gao, Y., Gu, Z., Liu, G., and Ren, X. (2023). Spatial distribution of soil erosion and its impacts on soil productivity in Songnen typical black soil region. Int. Soil Water Conserv. Res. 11, 649–659. doi: 10.1016/j.iswcr.2023.01.002
Xie, J., Zhang, H., Luo, Y., Meng, H., Zhang, J., Hong, J., et al. (2024). Driving factors of improving fertility and maize yields in the reclaimed soils by seven years of applied organic manure and chemical fertilizer. J. Soil Water Conserv., 1–11. Available at: https://link.cnki.net/urlid/11.2047.S.20240126.1904.036
Yang, P. P., Reijneveld, A., Lerink, P., Qin, W., and Oenema, O. (2022). Within-field spatial variations in subsoil bulk density related to crop yield and potential CO2 and N2O emissions. Catena 213:106156. doi: 10.1016/j.catena.2022.106156
Zhang, L., Huang, Y., Rong, L., Duan, X., Zhang, R., Li, Y., et al. (2021). Effect of soil erosion depth on crop yield based on topsoil removal method: a meta-analysis. Agron. Sustain. Dev. 41:63. doi: 10.1007/s13593-021-00718-8
Zhou, C., Li, F., Li, M., and Yang, L. (2013). Effect of application of organic manure and chemical fertilizers on soil enzymic activities in greenhouse cucumber field. J. Shenyang Agri. Univ. 44, 634–638. Available at: https://kns.cnki.net/kcms2/article/abstract?v=9CXCstbk-tv6lJBlp77_tFOd2fw4hP6R8WMeVt4_qHa Nn2NxEuwtbt6gyccsFjIef5WznIfUA9doWIc9p5DhBuHdBu9pmXG7bejanCfTKZycHEpBS7xrNJ8tIpRzn4yYLqPW1lrVQ0k=&uniplatform=NZKPT&language=CHS
Keywords: soybean yield, soil physical properties, PLS-SEM, small catchment, northeast black soil region
Citation: Tan Y and Wang Z (2024) Research on influencing factors of soybean yield in China’s northeast black soil region based on PLS-SEM. Front. Sustain. Food Syst. 8:1436224. doi: 10.3389/fsufs.2024.1436224
Edited by:
Mohamed Shokr, Tanta University, EgyptReviewed by:
Kolima Peña Calzada, University of Sancti Spiritus, CubaAntonio Soares Da Silva, Rio de Janeiro State University, Brazil
George Awuni, Mississippi State University, United States
Copyright © 2024 Tan and Wang. This is an open-access article distributed under the terms of the Creative Commons Attribution License (CC BY). The use, distribution or reproduction in other forums is permitted, provided the original author(s) and the copyright owner(s) are credited and that the original publication in this journal is cited, in accordance with accepted academic practice. No use, distribution or reproduction is permitted which does not comply with these terms.
*Correspondence: Zhiqiang Wang, d2FuZ3poaXFpYW5nQGJudS5lZHUuY24=