 Siyu Jing
 Guixin Fu
 Zhi Zhou2*
 Li Zhao
 Pengtao Zhang
- 1College of Resources and Environmental Sciences, Hebei Agricultural University, Baoding, China
- 2College of Land and Resources, Hebei Agricultural University, Baoding, China
- 3Research Center of Local Culture and Rural Governance, Hebei Agricultural University, Baoding, China
- 4Key Laboratory for Farmland Eco-environment of Hebei Province, Baoding, China
Agricultural spatial division and suggestions for the optimization of the partition space were obtained by constructing a recognition system of the dominant agricultural space. The prerequisite was to master natural economic development in agriculture. It was vital to maintain national food security and promote healthy and sustainable agriculture. The suitability evaluation of agricultural production and the dominance evaluation of agricultural development were incorporated to recognize the dominant agricultural space in Cangzhou, Hebei, China in 2020. Besides, priority scenarios were set, e.g., economic development, low-carbon protection, and coordinated development of a low-carbon economy. The NSGA-II genetic algorithm model was used to optimize the quantitative structure of cultivated lands in the agricultural space of Cangzhou in three scenarios in 2030. The research results are as follows: (1) Cangzhou had the largest number of general suitable areas for agricultural production in 2020, accounting for 27.04%; suitable areas were the least, accounting for 10.99%. The proportion of current cultivated lands in unsuitable agricultural production areas still stood at 11.26%; (2) The dominance of agricultural development in 2020 in Cangzhou was mainly at Tier III, accounting for 33.60% with the general dominance of agricultural development; (3) The total area of the dominant agricultural space in Cangzhou was 238208.75 hm2, accounting for 16.72% of the national territorial area of Cangzhou. It included 35 villages and towns beyond ecological red lines, mainly distributed in the western part of Cangzhou; (4) The agricultural space of Cangzhou in 2030, optimized by the multi-objective NSGA-II genetic algorithm model, exhibited decreased cultivated lands across three scenarios. The total amount of cultivated lands was the largest under the priority scenario of economic development, and that was the smallest under the priority scenario of coordinated development of a low-carbon economy. Meanwhile, agricultural economic benefits and carbon emission density were reduced under three scenarios. The benefits and density were moderate under the coordinated development of low carbon and economy. The work provides a reference for further formulating and improving the policies of the agricultural space in various regions.
1 Introduction
The national-land space is divided into the functional spaces of cities and towns, agriculture, and ecology based on the requirements of the main functional area (Wang et al., 2019). The food production function in the dominant function of the national-land space corresponding to the agricultural space is the basic demand for human-society development. The 2030 Agenda for Sustainable Development of the United Nations was officially launched on January 1, 2016, to ensure food security and improve the quality and competitiveness of agriculture. The objective of eradicating hunger, achieving food security, and improving nutrition and agriculture ranks second among 17 sustainable development goals, which shows the importance of food security. As a large agricultural country, China is facing food security issues and a series of environmental challenges. The economic contributions of agriculture are significant, yet it exerts both carbon source and carbon sink impacts. On the one hand, the carbon emissions caused by agricultural production account for about 25% of the global total (Federici et al., 2015; Le Quéré et al., 2018); on the other hand, agriculture has great potential for emission reduction. Reducing carbon emissions has become a common goal pursued by people around the world with the improvement of low-carbon awareness. The rapid development of China’s urbanization leads to the decreased resources of cultivated lands and the non-grain cultivation of cultivated lands. Related to food security, the issue has a dynamic and nonlinear coupling relationship with resource and ecological and livelihood security (Cao et al., 2022). The demand for agricultural lands in certain regions has expanded beyond traditional food production, encompassing the needs for food and clothing. Various new formats represented by profitable agriculture and ecological agriculture are emerging (Ma and Yan, 2016). Therefore, optimizing the spatial arrangement of agricultural production has become an important measure closely related to the national food security strategy and spatial multi-functional planning. Then, agricultural development and national food security can be guaranteed, with the dominant agricultural space recognized. Ecological agriculture, reflecting the space for innovation in the business model, has great potential for innovation in technology and methods. In terms of technical methods, reducing carbon emissions in arable land is closely related to the carbon emission density.
There are fewer studies on the dominant agricultural space. Gu and Cao (2019) proposed permanent rural areas, focusing on determining the most suitable areas with high yield and stable production potential for agricultural development. Besides, the concept of the superior agricultural space is expanded. Su et al. (2020) introduced the evaluation of agricultural infrastructure and village protection areas based on the suitability evaluation of agricultural production. The dominant agricultural space is divided into protection zones for farmland production, village, and agricultural infrastructure. It emphasizes the assessment of farming style, agricultural facilities, and agricultural production level. The agricultural production space is expanded, with the elements of agroecological environmental protection included.
Most research complies with the Guide for Resource and Environmental Carrying Capacity and the Suitability Evaluation of National Land Space Development (hereinafter referred to as the Dual Evaluation Guide). The suitability of production is evaluated based on the resource endowment of the land. However, the economic and ecological functions of land are ignored. The evaluation system constructed based on natural factors is one-sided and lacks further subdivision of the agricultural space. The recognition of the dominant agricultural space aims to optimize resource allocation, rural economy, and ecological environment. Important support is provided for food security and rural revitalization. Therefore, the construction of a complete, unified, and comprehensive evaluation system has gradually become the research focus.
Existing research focuses on single-target space optimization based on the optimization of the national land space. They ignore that the national land space is an extremely complex system covering various elements (e.g., capital, labor, and land). The optimized allocation of the national land space is to coordinate the contradictions of multiple parties and realize the rational allocation of resources. Intelligent algorithms for solving multi-objective problems have become a hot research topic with the rapid development of computer technology. Some researchers used optimization algorithms (e.g., the multi-objective particle swarm) to study the optimal configuration of land use structures from multi-objective trade-offs and synergy (Ghoseiri and Ghannadpour, 2010).
The suitability evaluation of agricultural production is an important part of the suitability evaluation of the national land space in the Dual Evaluation Guide. It underwent multiple rounds of evolution from January 2019 to January 2020. The continuous improvement of its index system is of great significance to the layout optimization of the national land space. Researchers divided the construction of its evaluation system into two parts. One part includes topography, climate, soil, water sources, and meteorological disasters (Pan et al., 2022). The other part is to add socioeconomic indicators based on natural resources (Akpoti et al., 2019). The indicator system is enhanced; however, the selection of socioeconomic indicators remains incomplete. Evaluation methods evolve from subjective judgments (e.g., the fuzzy analytical method (Budak et al., 2024) and AHP method (Budak et al., 2024)) to 3S technology (remote sensing, geographic information system, and GPS) (Amini et al., 2020; Hossen et al., 2021). The suitability evaluation is more scientific, accurate, and objective.
A dominant evaluation of agricultural development based on the evaluation of economic, social, and ecological factors is introduced due to the imperfect selection of socioeconomic indicators. The dominance of agricultural development is considered to be the comprehensive embodiment of various advantages such as location (Branco et al., 2021), production (Rana et al., 2023), resources (Fu et al., 2022), and market (Hernández-Cruz et al., 2023). On the one hand, agricultural dominance is reflected in the selection and planting of dominant crops (Konefal et al., 2023) because of previous research on the dominance of agricultural development. Increased output of agricultural products promotes agricultural production and agriculture. On the other hand, it is reflected in the external environment as influencing factors such as location (Branco et al., 2021), agricultural economy (Ngwira et al., 2012), and agroecology (Pradeleix et al., 2022). The former conducts a more micro-evaluation of the dominant agriculture development, which is suitable for the precise analysis and improvement of certain major crops. The latter focuses on evaluating economic and ecological factors, filling the shortcomings of the Dual Evaluation Guide. The use of mathematical analysis and intelligent algorithms (Nguyen et al., 2020; Ayoub Shaikh et al., 2022) in the evaluation method enhances the evaluation process.
Located in the heart of circum-Bohai-Sea, Cangzhou is an open first-tier area of the two circles (Beijing-Tianjin Circle and circum-Bohai-Sea) determined by Hebei Province. Meanwhile, it is also the main cotton grain-grain-producing area in Hebei Province (Song et al., 2018). The continuous economic development has made it the largest salinized soil area with the poorest land production conditions in Hebei Province, caused by both natural and human factors. President Xi Jinping proposed to implement the strategy of cultivated land protection and using technology in agriculture when he visited the saline-alkali fields of Cangzhou on May 11, 2023. It is crucial to strengthen cultivated land protection, make every effort to improve cultivated land quality and fully tap the potential of comprehensive utilization of saline and alkaline lands. Then, the agricultural production space can be expanded, and the comprehensive agricultural production capacity can be improved. A definitive path is provided for agricultural developments in the future.
The dominant agricultural space is recognized, and the agricultural space pattern is optimized based on the natural economic development in agriculture in Cangzhou. It holds great guiding significance for the sustainable and healthy development of agriculture and coordinates food security and socioeconomic and ecological development in the future. Therefore, the suitability evaluation of agricultural production is incorporated into the dominant evaluation of agricultural development. The multi-element comprehensive evaluation matrix is used to recognize the dominant agricultural space in Cangzhou in 2020 beyond ecological red lines. Agricultural economic benefits and carbon emission density are calculated with the multi-objective NSGA-II genetic algorithm model. Then, the optimized quantitative structure of cultivated lands in each village and town will be obtained in Cangzhou in 2030.
2 Data sources and methods
2.1 Overview of the research area
Located in the southeast of Hebei Province, Cangzhou borders the Bohai Sea to the east, Beijing and Tianjin to the north, and Shandong to the south (Figure 1). It is located between north latitude 37°29′–38°57′ and east longitude 115°42′–117°50′. It lies in the eastern part of the vast and expansive Central Hebei Plain, characterized by a relatively flat topography with minimal undulations. The predominant soil types are moisture soil and salinized moisture soil. The organic matter content in the soil is low, which leads to insufficient fertility. The climate is manifested as warm temperate continental monsoon, with four distinct seasons and abundant sunshine. The annual average temperature is 12.5°C, and the mean annual precipitation is 581 mm. The permanent population of Cangzhou reached 7.3148 million, with a rural permanent population of 3.4496 million by the end of 2022. Besides, the per capita disposable income for rural residents amounted to 18,617 CNY.
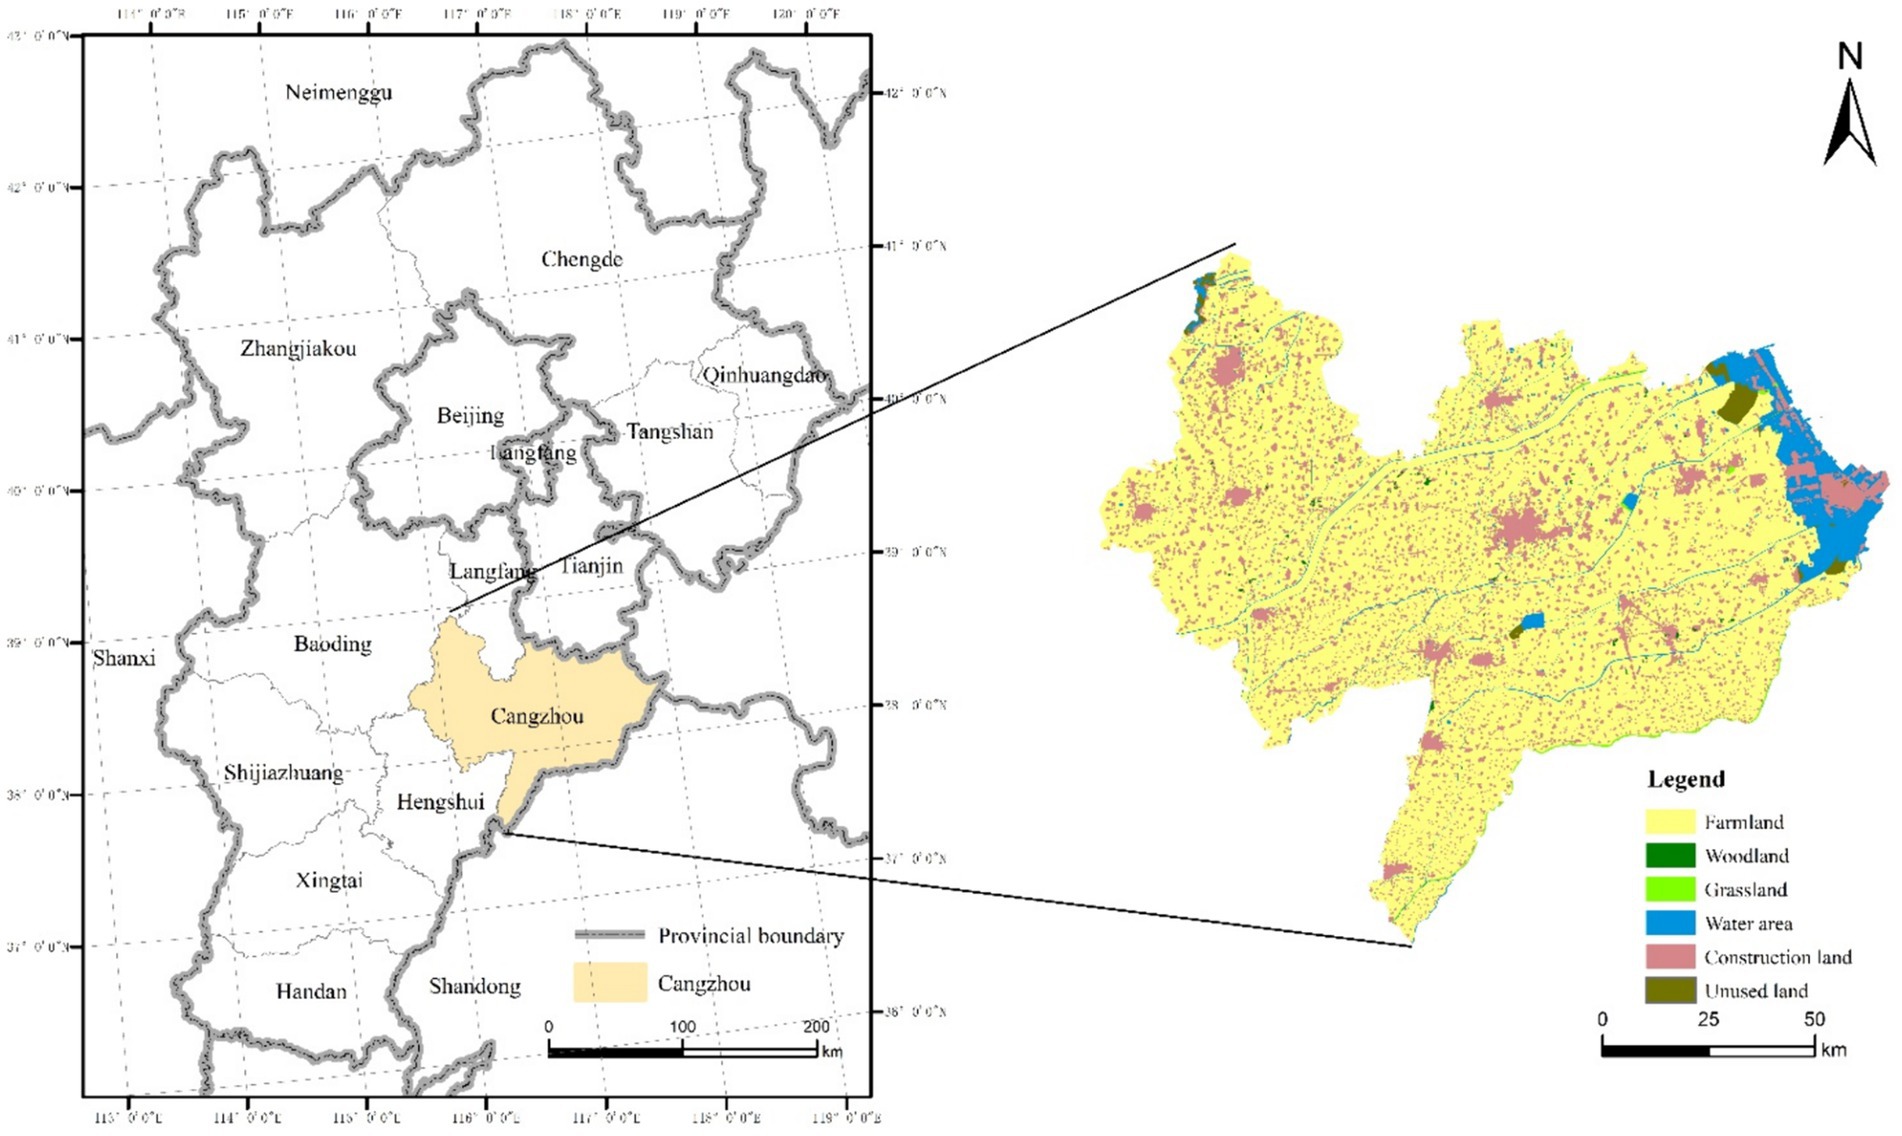
Figure 1. Location plan of the research area.
2.2 Data sources
The land use data and soil erosion data for 2000, 2010, and 2020 were derived from the Resource and Environment Data Center of the Chinese Academy of Sciences (CAS).1 Lands were categorized as cultivated land, woodland, grassland, water, construction land, and unused land, with a spatial resolution of 30 × 30 m. The categorization referred to the remote sensing monitoring and classification system of the CAS and the actual situation. Soil texture data were obtained from the World Soil Database.2 DEM data were derived from the geospatial data cloud platform,3 and the slope database was obtained through ArcGIS processing. Soil salinization data were obtained from the global salinity data set under GEE pretreatment.4 Precipitation data were derived from the National Earth System Science Data Center.5 Data on agricultural socioeconomic development were obtained from the Cangzhou County-level statistical yearbook.
2.3 Methods
This research framework is mainly divided into the following four steps (Figure 2). Step 1 is to construct an agricultural-production suitability evaluation system through field research and obtain the results of the suitability evaluation of agricultural production in Cangzhou City in 2020. In step 2, an agricultural development advantage evaluation system is constructed based on a large number of township’s agricultural data to obtain the dominant evaluation of agricultural development in Cangzhou City in 2020. In step 3, the evaluation results of steps 1 and 2 are used to identify the dominant agricultural space that is suitable for agricultural production and has great development potential. Step 4 is to calculate the carbon emission density and agricultural economic benefits, which is used as a future optimization goal. The multi-objective genetic algorithm model is used to obtain the quantitative structure of cultivated land in Cangzhou City in 2030 under the priority scenarios of economic development and low-carbon protection as well as the coordinated development scenario of low-carbon and economy.
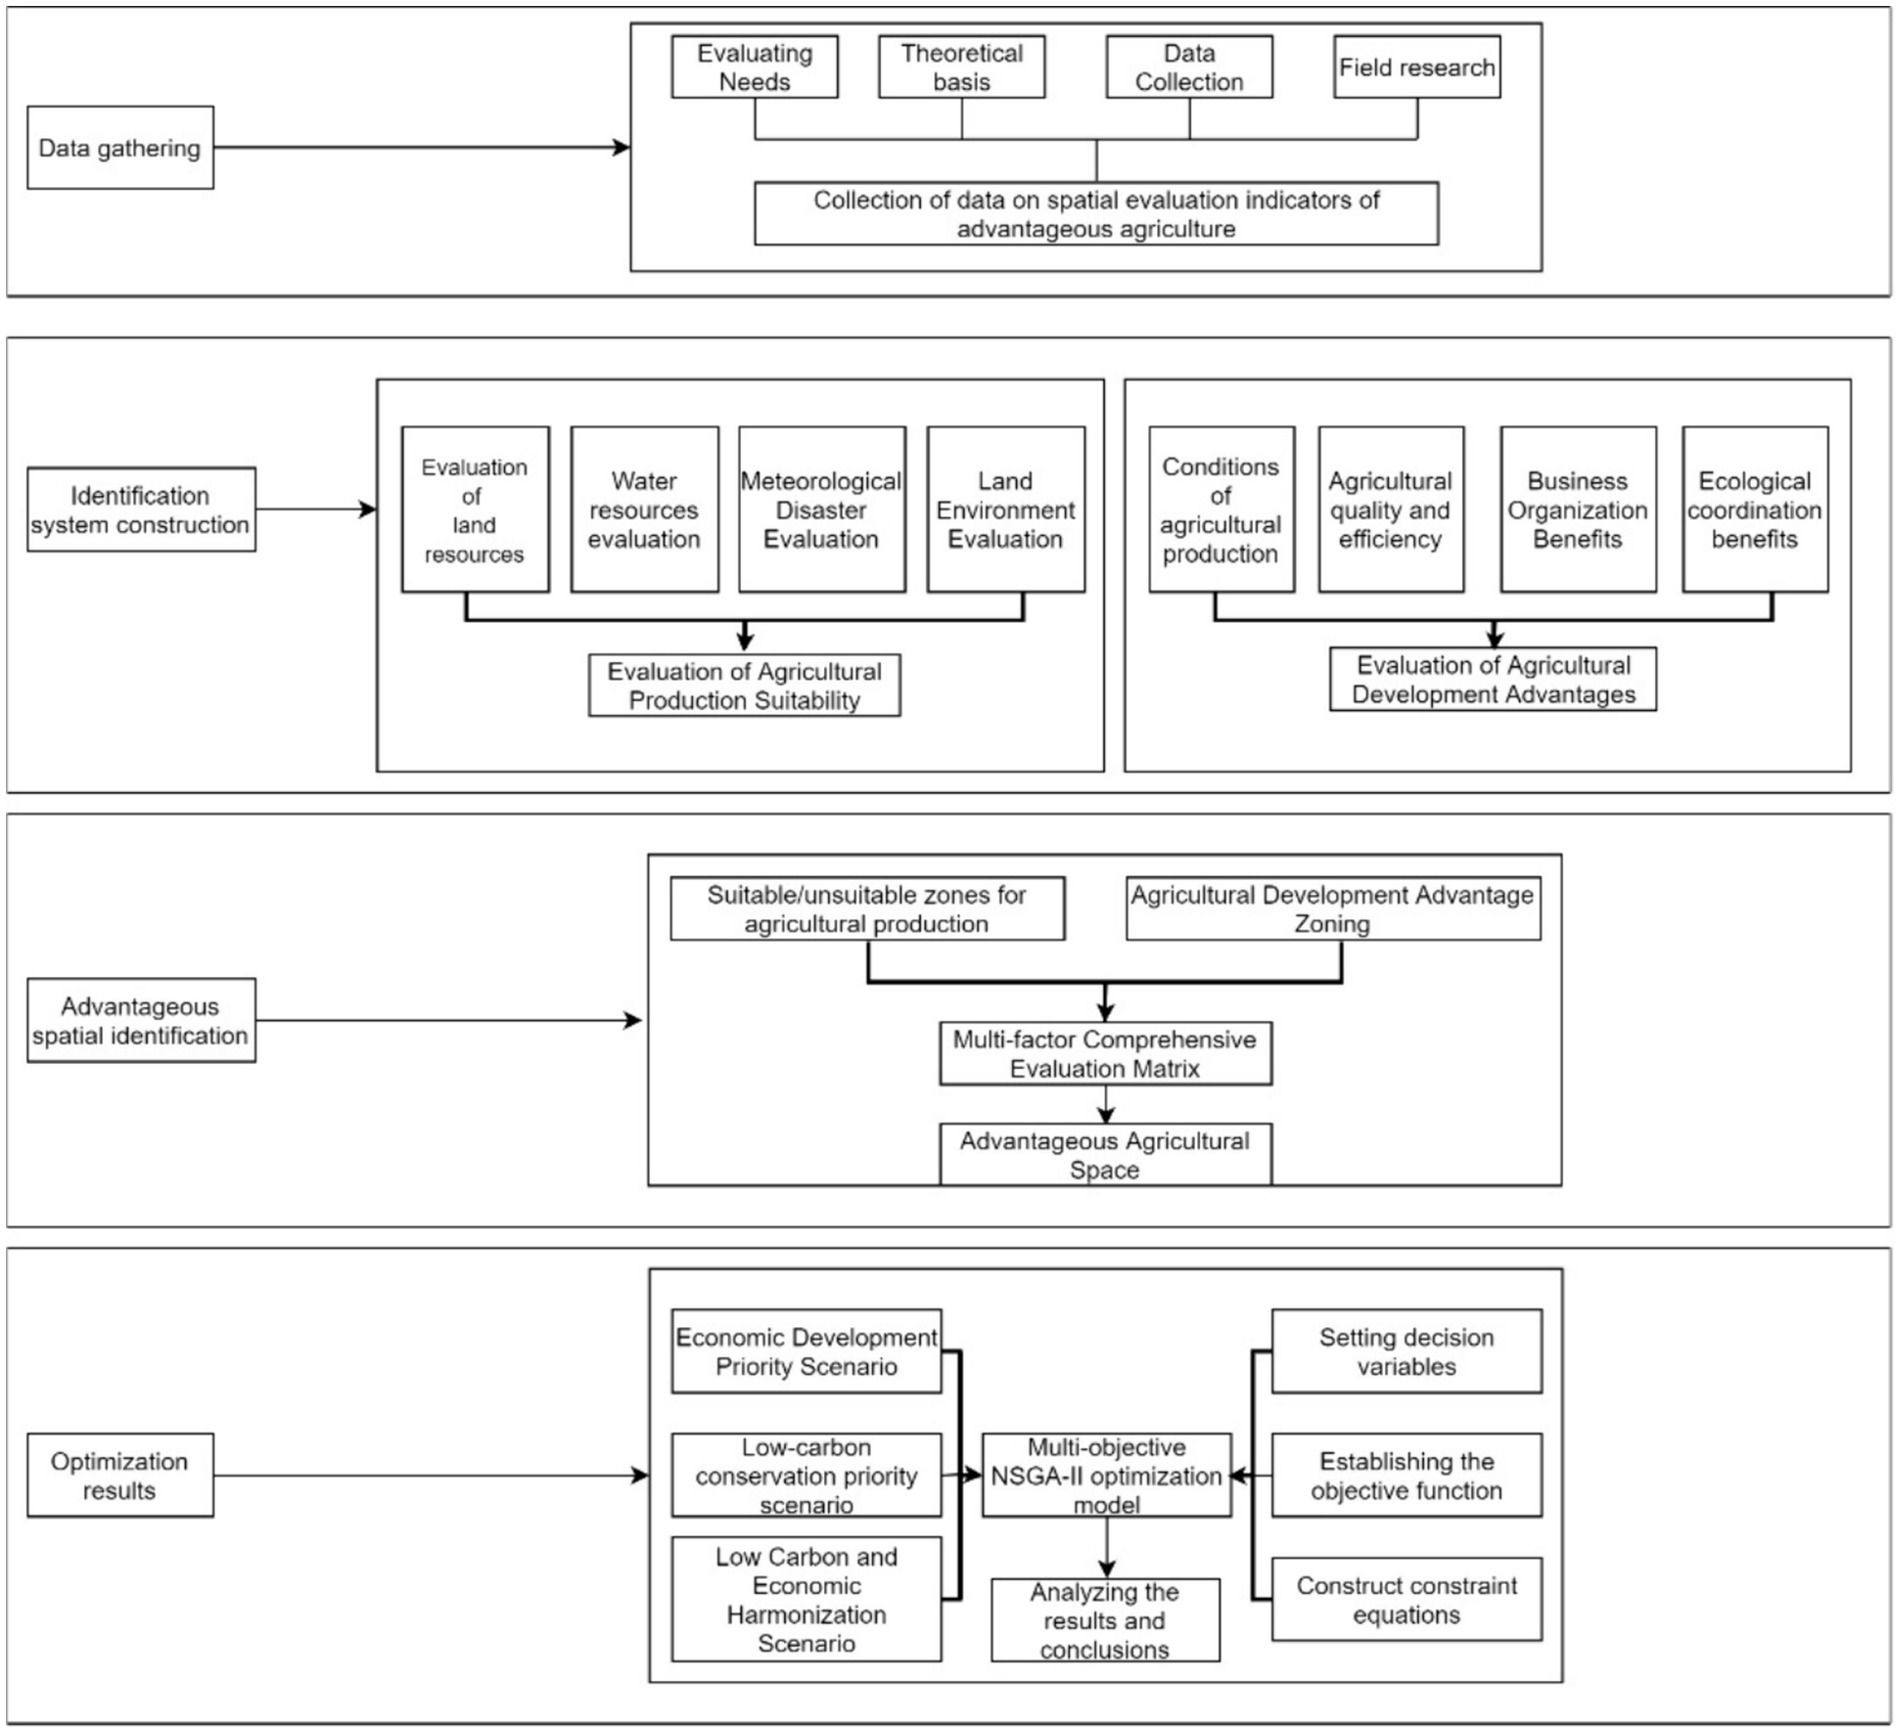
Figure 2. Logical framework and flow chart.
2.3.1 Construction of suitability evaluation system for agricultural production
The work evaluated the suitability of agricultural production from the perspective of natural resource endowment with the Dual Evaluation Guide as the main basis for selecting evaluation factors. The selection of evaluation indicators fails to adequately consider numerous socioeconomic factors (Author, 2022). Therefore, the evaluation of land resources (slope, soil texture), water resources (mean annual precipitation), land environment (soil conservation), and meteorological disasters (drought, flood) were carried out, respectively, by considering the reality and pertinence of agricultural production. Figure 3 shows evaluation indices. The preliminary results of Cangzhou’s 2020 suitability evaluation of agricultural production were obtained. There were most of the saline-alkaline lands in the eastern part of Cangzhou according to field research, which accounted for a large proportion of cultivated lands. It caused waste and destruction of cultivated land resources. Therefore, the corresponding weight of each index was obtained using the analytic hierarchy process by correcting the first step result through the correction index (soil salinization). Finally, the suitability evaluation of agricultural production was obtained.
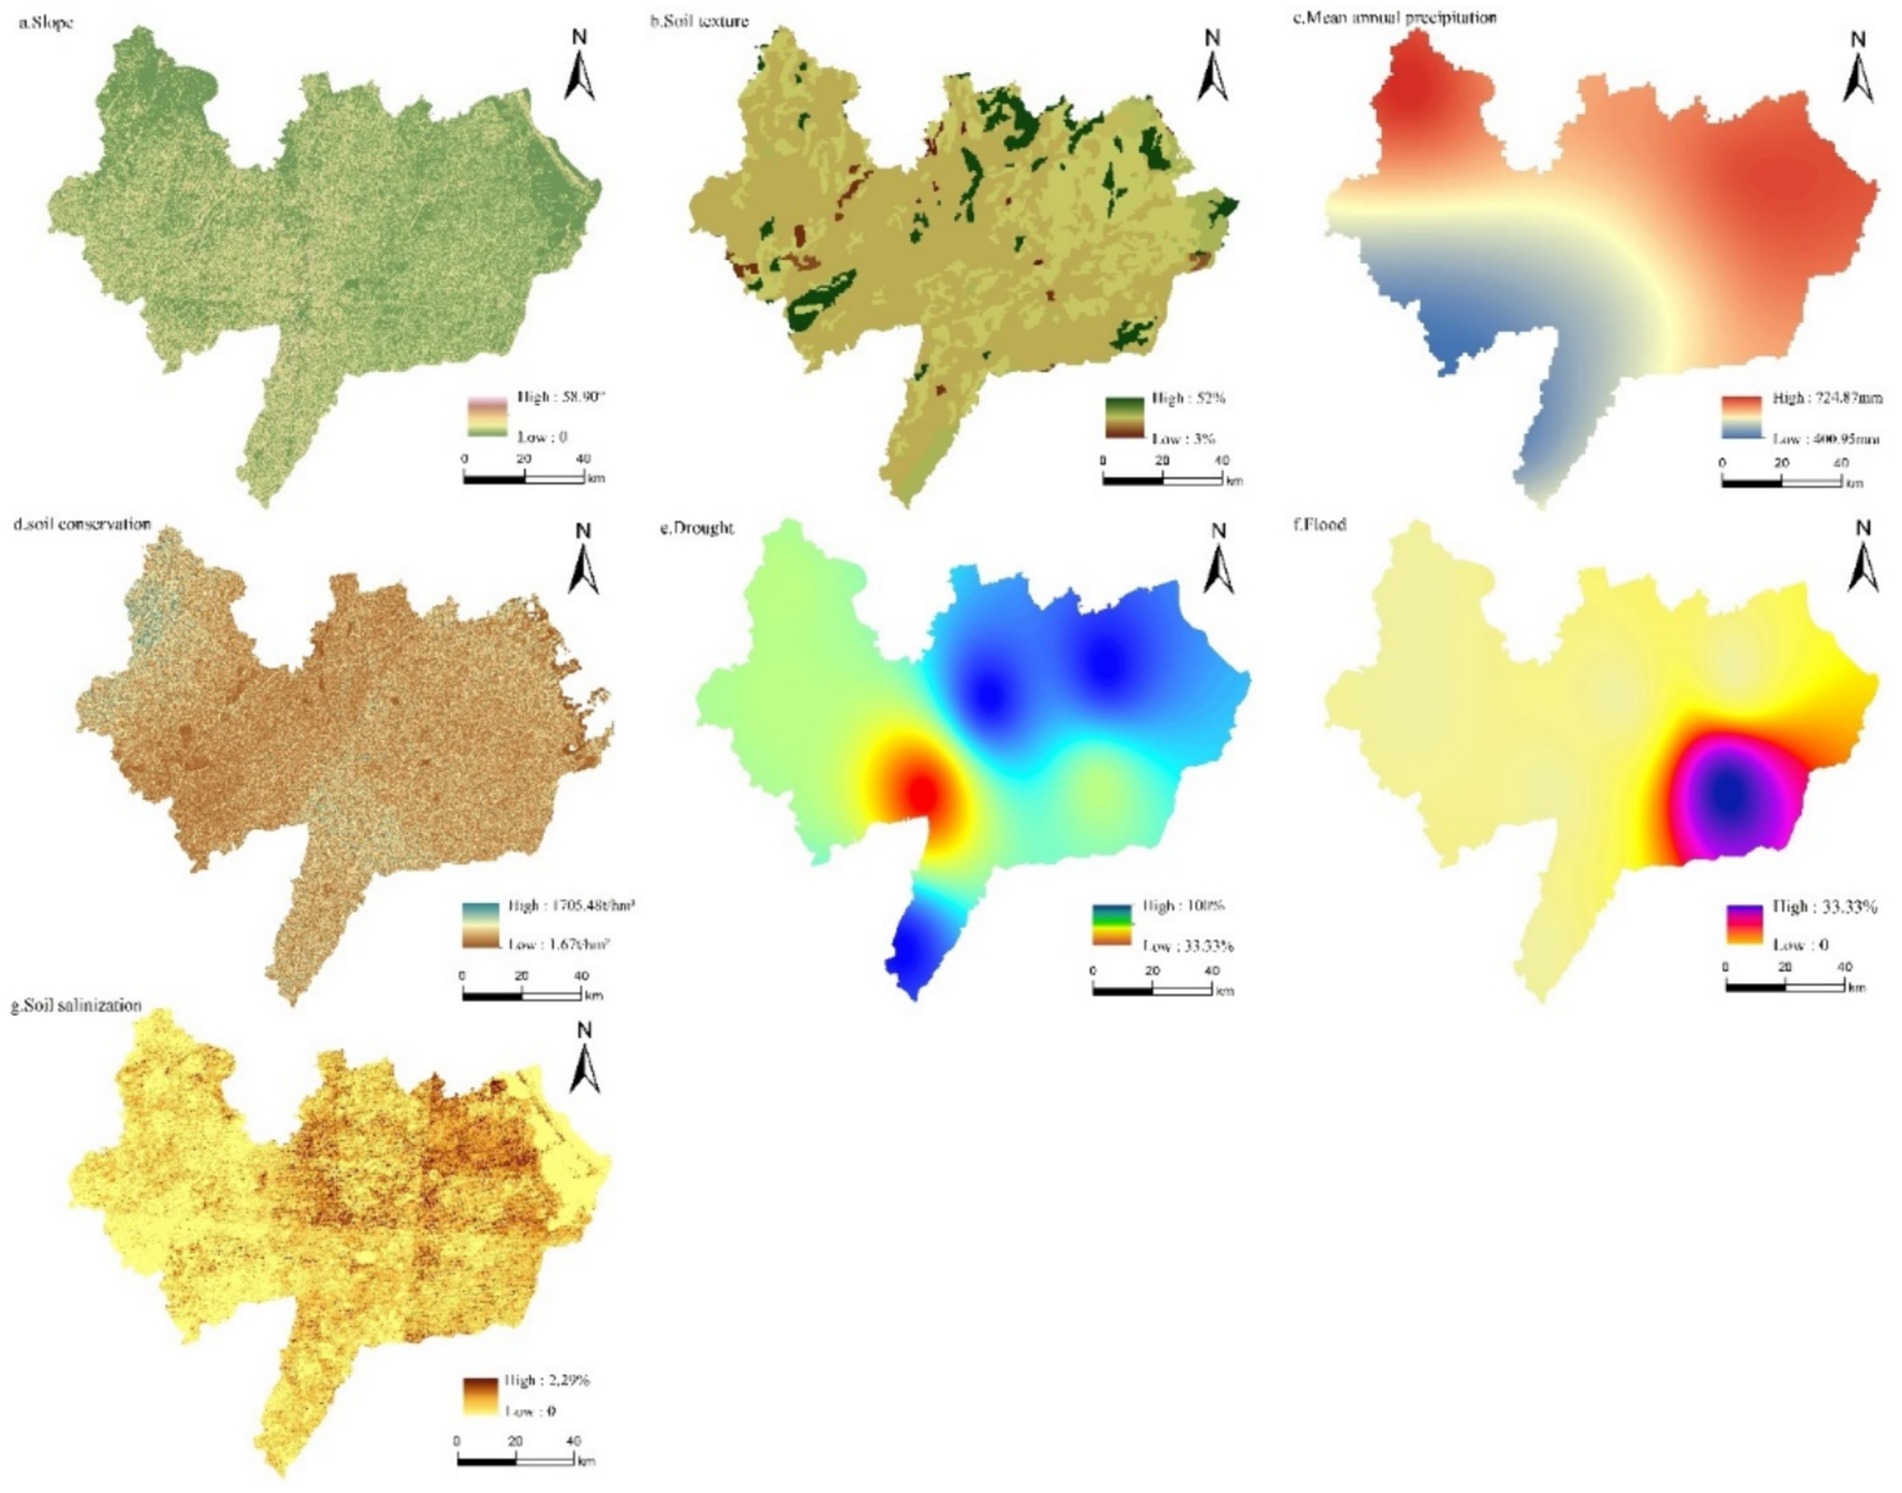
Figure 3. Suitability evaluation index of agricultural production.
2.3.2 Construction of the dominant evaluation system of agricultural development
In terms of the allocation and input of the basic elements of agricultural production, agricultural development dominance aims to pursue the high quality and high efficiency of the agricultural economy. This concept covers Cangzhou’s multiple advantages such as natural resource endowment, economic and industrial foundation, agricultural production input, and modernization level, reflecting comprehensive advantages in the agricultural production process. Based on agricultural modernization (Zapata et al., 2023), sustainable agricultural development (Ren et al., 2022), high-quality agricultural development (Cui et al., 2022), agricultural competitiveness (Schaller et al., 2018), and agricultural suitability (Budak et al., 2024), the work adheres to typicality, scientificity, systematicness, and operability.
Ten indicators (Figure 4) were selected from agricultural production conditions (effective irrigation rate, agricultural mechanization level, and concentrated contiguous degree), agricultural quality and benefits (average agricultural output per land and average agricultural output per worker), benefits of operating organization (farmers’ per capita disposable income, agricultural industrialization rate, and the proportion of employees in the primary industry), and ecological coordination ability (agricultural plastic film load, fertilizer, and pesticide load). A comprehensive evaluation index system was constructed for agricultural development dominance. Data for each index of villages and towns were extracted into a table. The entropy weight method was then applied in SPSS to calculate index weight within the evaluation system of agricultural development dominance. Finally, the evaluation index system of agricultural development dominance for Cangzhou was obtained.

Figure 4. Evaluation indicators of agricultural development dominance.
2.3.3 Recognition of the dominant agricultural space
The work defined the dominant agricultural space as a specific regional area with suitability for agricultural production and high agricultural development dominance. It was recognized through a comprehensive assessment of natural conditions, agricultural production potential, and ecological environment. These areas were suitable for specific crop cultivation, livestock breeding, or other agricultural activities under natural conditions. Meanwhile, these specific regional areas boasted favorable market prospects, policy support, and resource conditions under socioeconomic conditions, with the potential to prioritize agricultural industries.
Based on the comprehensive analysis of the suitability evaluation of agricultural production and the evaluation of the superiority of agricultural development, the multi-element comprehensive evaluation matrix is used outside the red line of ecological protection to make qualitative decisions and delineate the dominant agricultural space. Single-element evaluation levels I-V for agricultural production suitability and agricultural development dominance were classified into weak, medium, and strong based on levels I-II, III, and IV-V. A 2D matrix of 3 × 3 was constituted and theoretically offered 9 combinations for elements.
The dominant agricultural space includes the following aspects: (1) units with level-V agricultural development dominance in a suitable area for agricultural production; (2) units with a level-V agricultural development dominance in a relatively suitable area for agricultural production; (3) units with level-IV agricultural development dominance in a relatively suitable area for agricultural production. Besides, the agricultural space units other than the dominant agricultural space are divided into the potential area and unfavorable development area for agriculture.
2.3.4 Construction of multi-objective NSGA-II genetic algorithm model
Considering the agricultural economic benefit target and the low-carbon target, the work used a multi-objective NSGA-II genetic algorithm for optimization. The genetic algorithm evolves the entire population based on natural selection and genetic mechanisms in the biological world through large-scale calculations and parallel searches. Traditional genetic algorithms transform the multi-objective optimization problem into a single-objective problem by the fitness function. The selection of the fitness function affects the convergence speed of the algorithm and whether the optimal solution can be obtained. Improper selection of the fitness function will cause local optimization during the solving process.
An improved genetic algorithm (NSGA-II) is used in the work. The algorithm can solve nonlinear optimization. Traditional multi-objective optimization methods (the weight-adding summation method, linear programming method, and ε-constraining method) are ineffective or even counterproductive without experience (Bu et al., 2021). Three major advantages of the algorithm in solving multi-objective problems include fast non-dominated sorting, individual congestion degree, and elitist strategy. The purpose of genetic algorithms is to find the individual with the highest fitness value, that is, the optimal solution to the fitness function. According to the objective function for solving the problems, the fitness function is designed under normal circumstances to reflect the merits of the individual. The fitness function only needs to accurately reflect the merits of the individual. Its crossover probability is 0.9; the crossover-distribution index is 20; mutation probability is 0.1; the variation-distribution index is 20; the population quantity is 100; the iteration number is 200. Matlab programming is used to obtain the Pareto-optimal solution set (Figure 5).
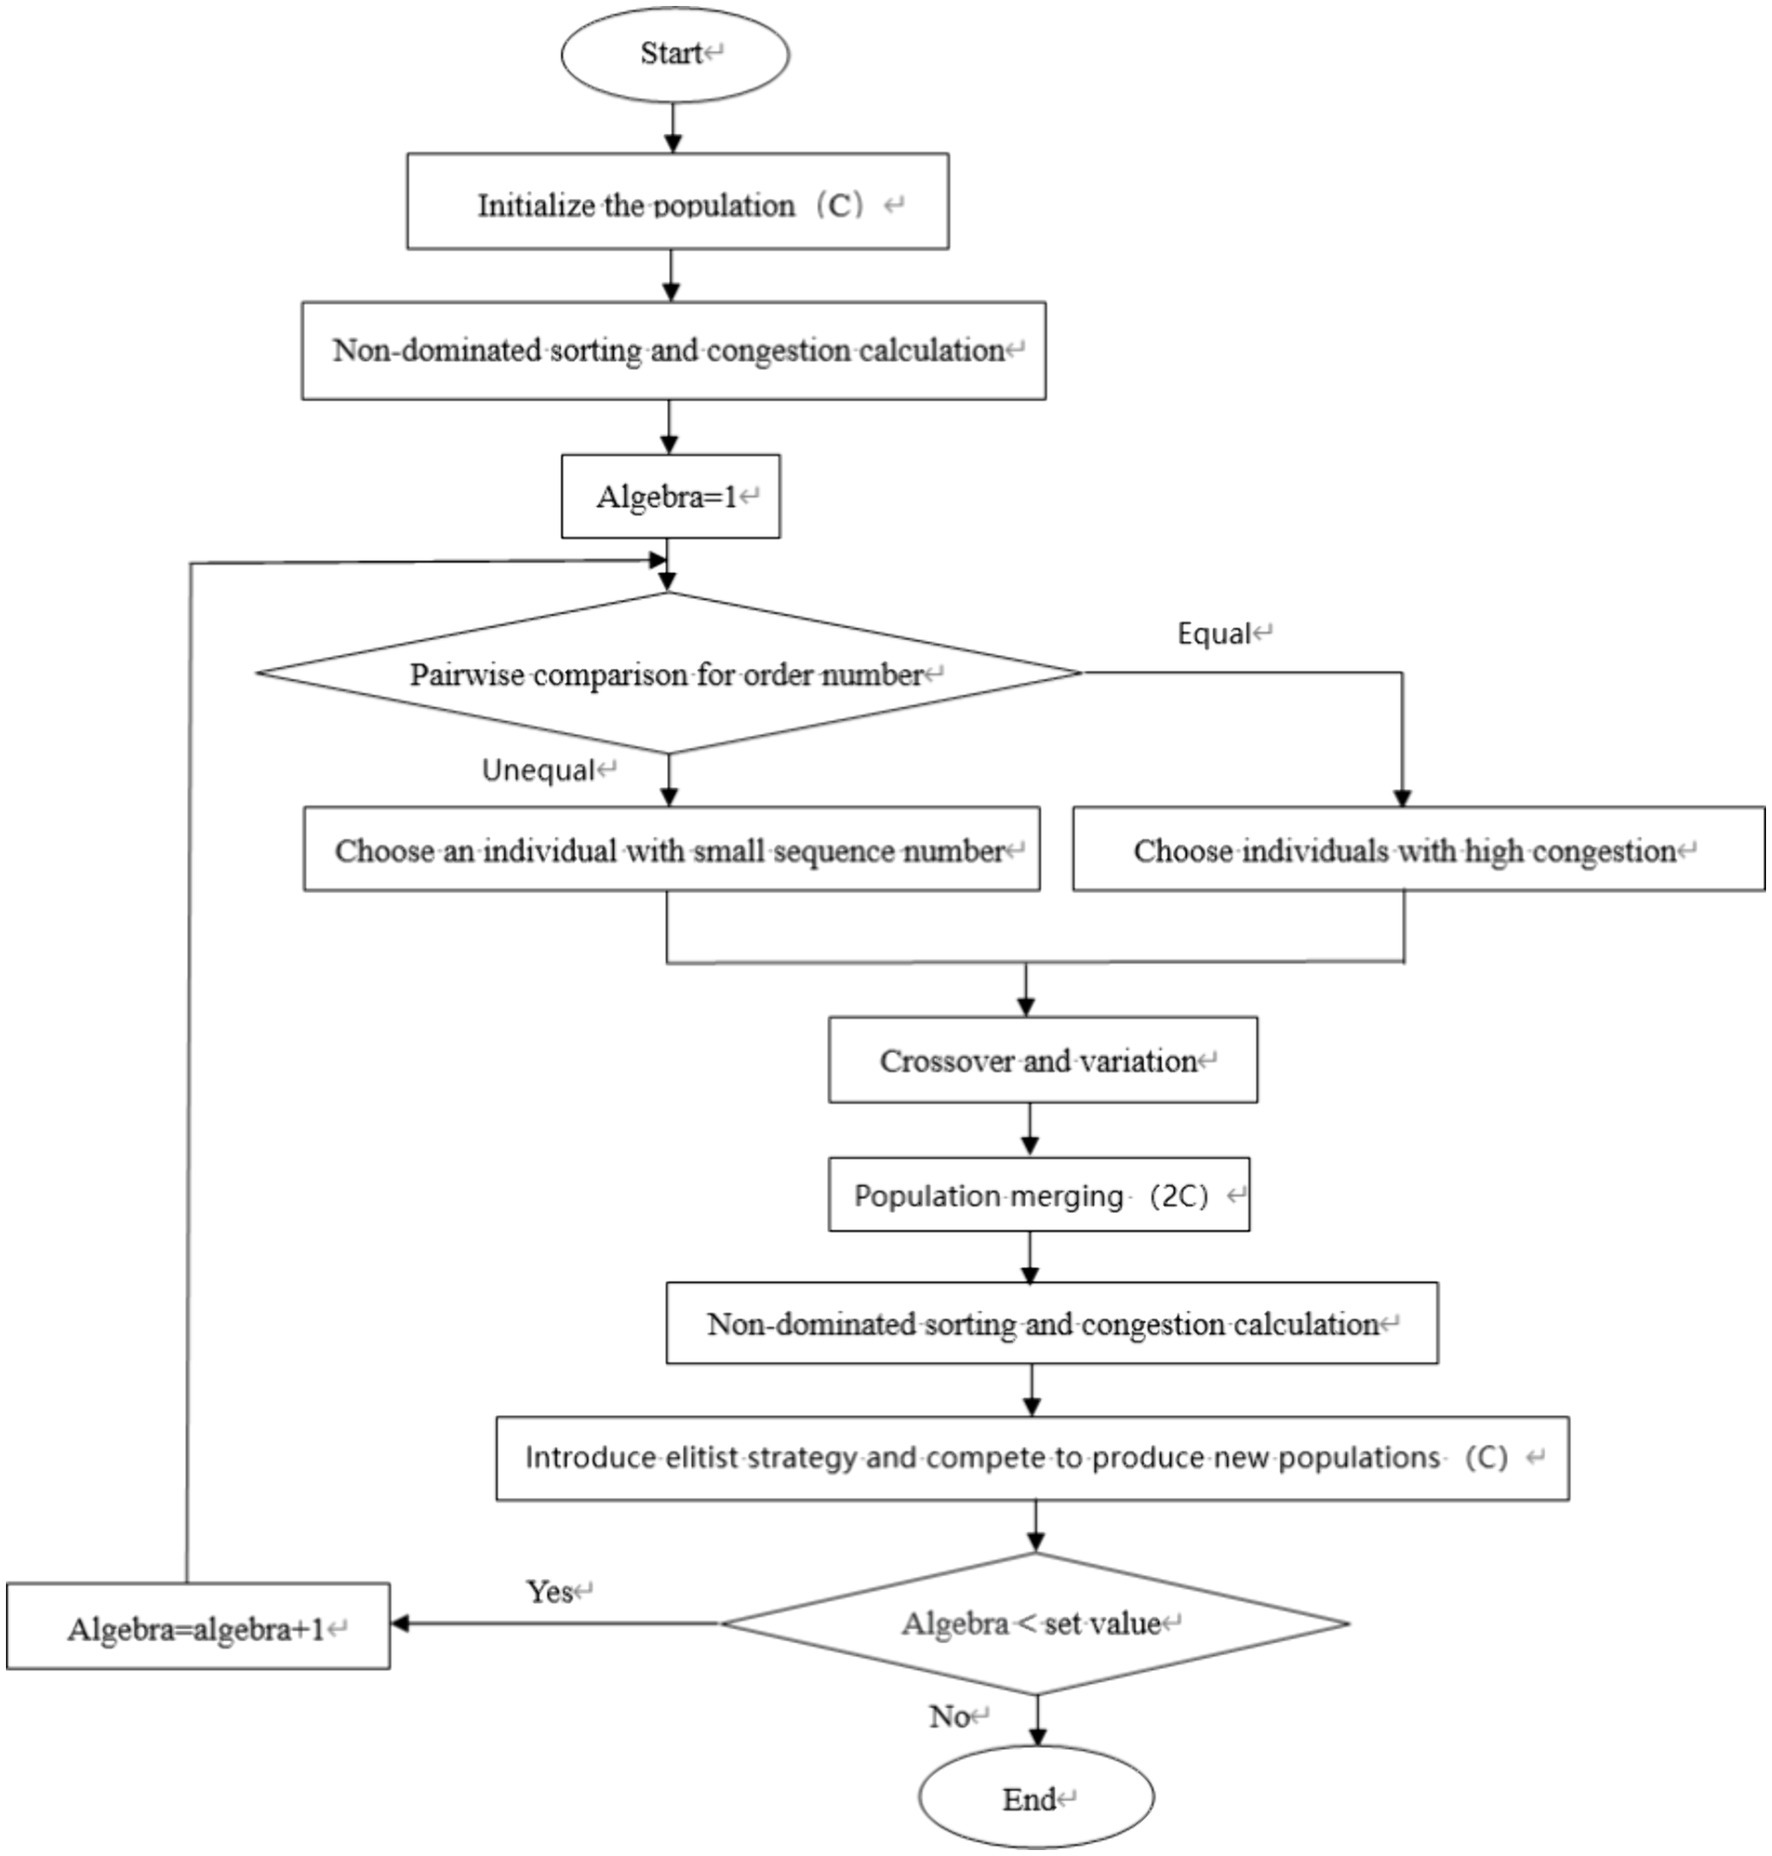
Figure 5. Optimization process of the NSGA-II genetic algorithm.
2.3.5 Setting of optimized decision variables
The work recognizes the dominant agricultural space by taking cultivated lands as the research object. The decision variable in the multi-objective NSGA-II genetic algorithm model is set to be the cultivated land area across 176 villages and towns within Cangzhou (, , , ……, and ).
2.3.6 Construction of the optimized objective function
2.3.6.1 The objective of agricultural economic benefits
The dominant agricultural space aims to maximize the agricultural economic output on cultivated lands under the premise of food security. Therefore, agricultural economic benefits are maximized for economic benefits.
where is the economic benefit of the research area; is the comprehensive index of agricultural economic benefits; is the cultivated land area in different villages and towns; is the weight of indices for various agricultural achievements; is the target index for various agricultural achievements.
The selection of agricultural achievement indicators and the comprehensive indicator of agricultural economic benefits refer to the selection of some indicators proposed by Liu et al. (2003). Land productivity is measured by the average output and income per acre. Labor productivity is measured by the average output value and income of labor. The entropy value method is employed to determine the weight of each index based on the construction of an index system. Finally, the comprehensive index of agricultural economic benefits is calculated according to Equation 2.
2.3.6.2 The objective of carbon emissions
Enhanced economic benefits in agriculture inevitably lead to carbon emissions during agricultural production in the pursuit of food security. Therefore, reducing carbon emissions per unit area of cultivated land in the agricultural process has become the optimization goal of the dominant agricultural space under low carbon.
where is the carbon emission density of agriculture; is the usage amount of fertilizers, pesticides, agricultural films, and agricultural diesel in each village and town (t) and the effective irrigation area (hm2); is the carbon emission factor of the emission source from the jth category of agricultural production activities (Table 1); is the cultivated area in different villages and towns. Among them, the usage amount of fertilizers, pesticides, agricultural films, agricultural diesel fuel (t) and effective irrigated area (hm2) in each village and town were predicted by the GM model to get the corresponding data of each village and town in 2030, and combined with the known carbon emission factors of each type of emission source as shown in Table 1.
Table 1. Carbon emission factors of emission sources in agricultural production activities.
Establishment of the optimized constraint equation
1. The total cultivated area in Cangzhou does not exceed the predicted value of 1,070,319.96 hectares by the Markov Chain model for 2030. The tested kappa coefficient is 0.86, which meets the consistency test. The prediction result is reliable. Besides, it is not lower than the cultivated land quantity of 633,473.33 hectares.
2. The cultivated land area in each village and town is not higher than that in 2020.
3 Results
3.1 Suitability evaluation and analysis of agricultural production
The suitability evaluation of agricultural production for Cangzhou in 2020 is categorized into five levels (from unsuitable to suitable) (Figure 6). The ArcGIS software analysis and the natural breakpoint method are bused based on the suitability evaluation index system of agricultural production (Table 2). The total number of unsuitable and less suitable areas for agricultural production reached 39.47% of the national territorial area (Table 3), with the most generally suitable areas and the least suitable areas. 11.26% of current cultivated lands in Cangzhou are still unsuitable for agricultural production by comparing the suitability evaluation of agricultural production with the current cultivated lands in Cangzhou. However, there are more cultivated lands in suitable and relatively suitable areas, which account for 28.16 and 25.87%, respectively (Table 3).
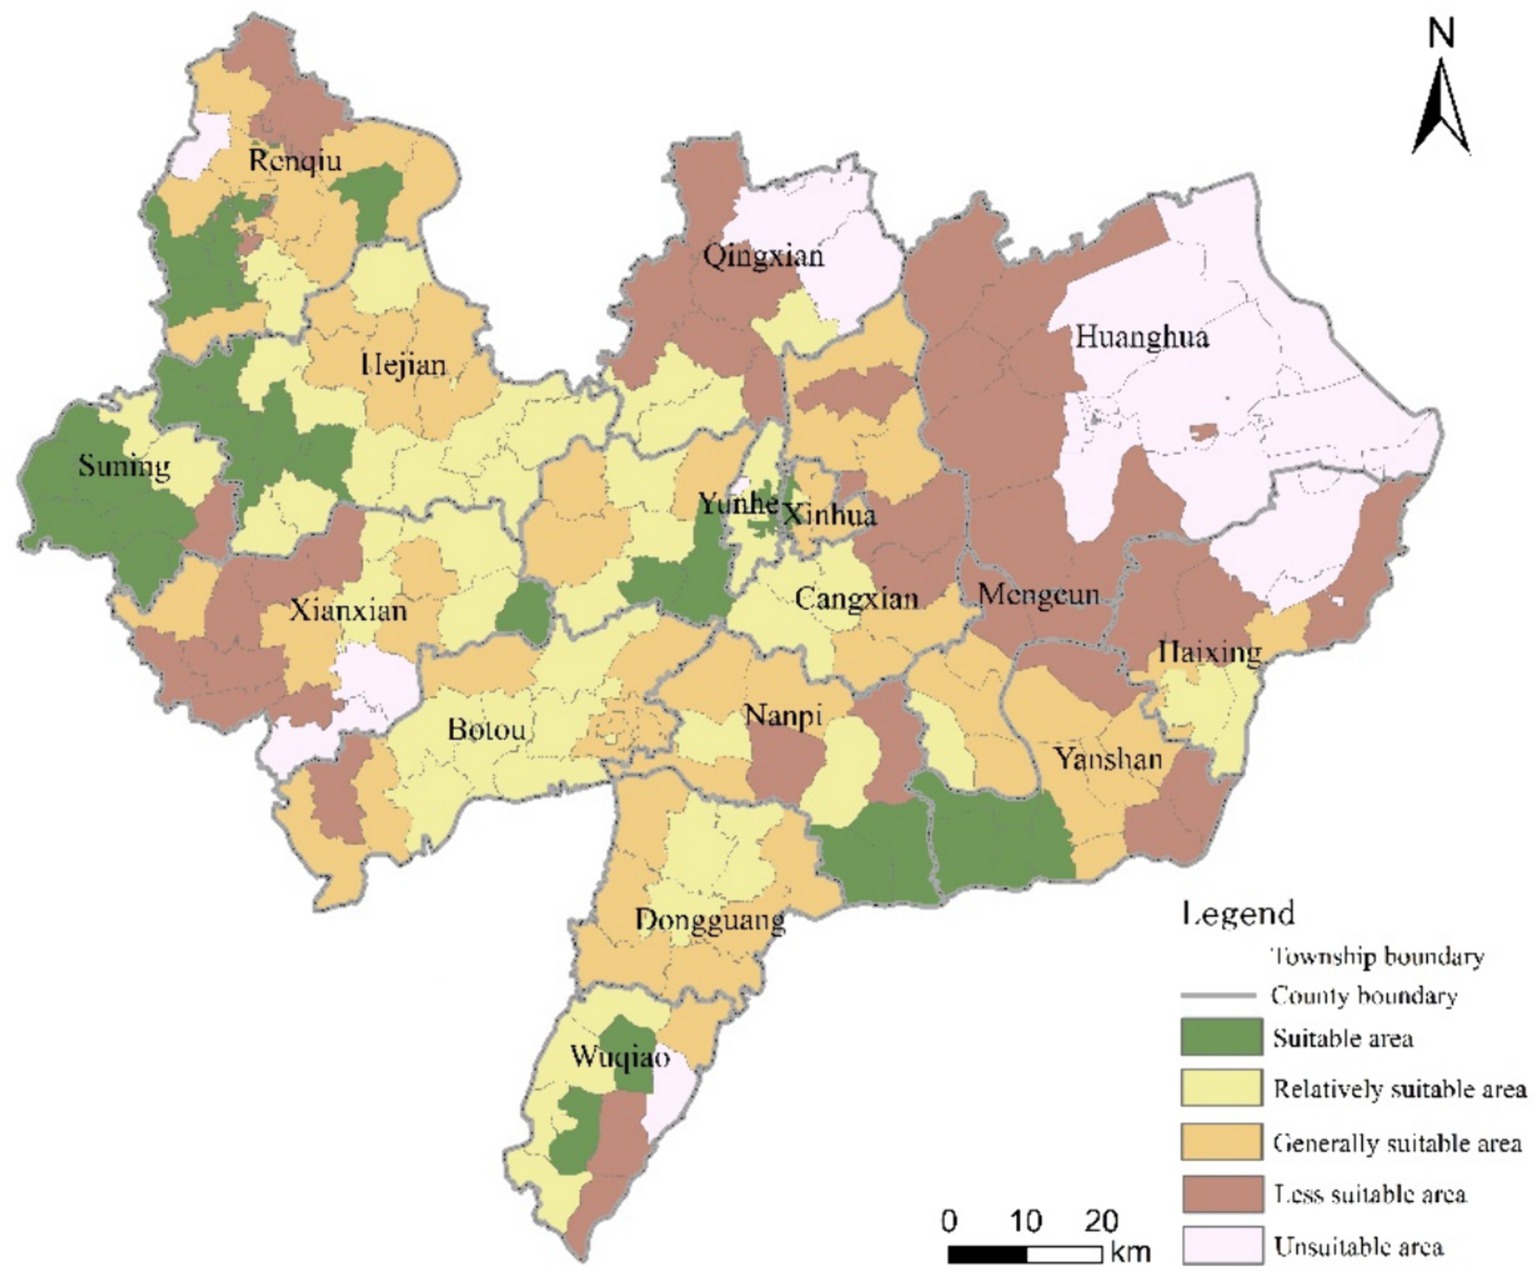
Figure 6. Spatial distribution of the suitability evaluation of agricultural production in Cangzhou in 2020.
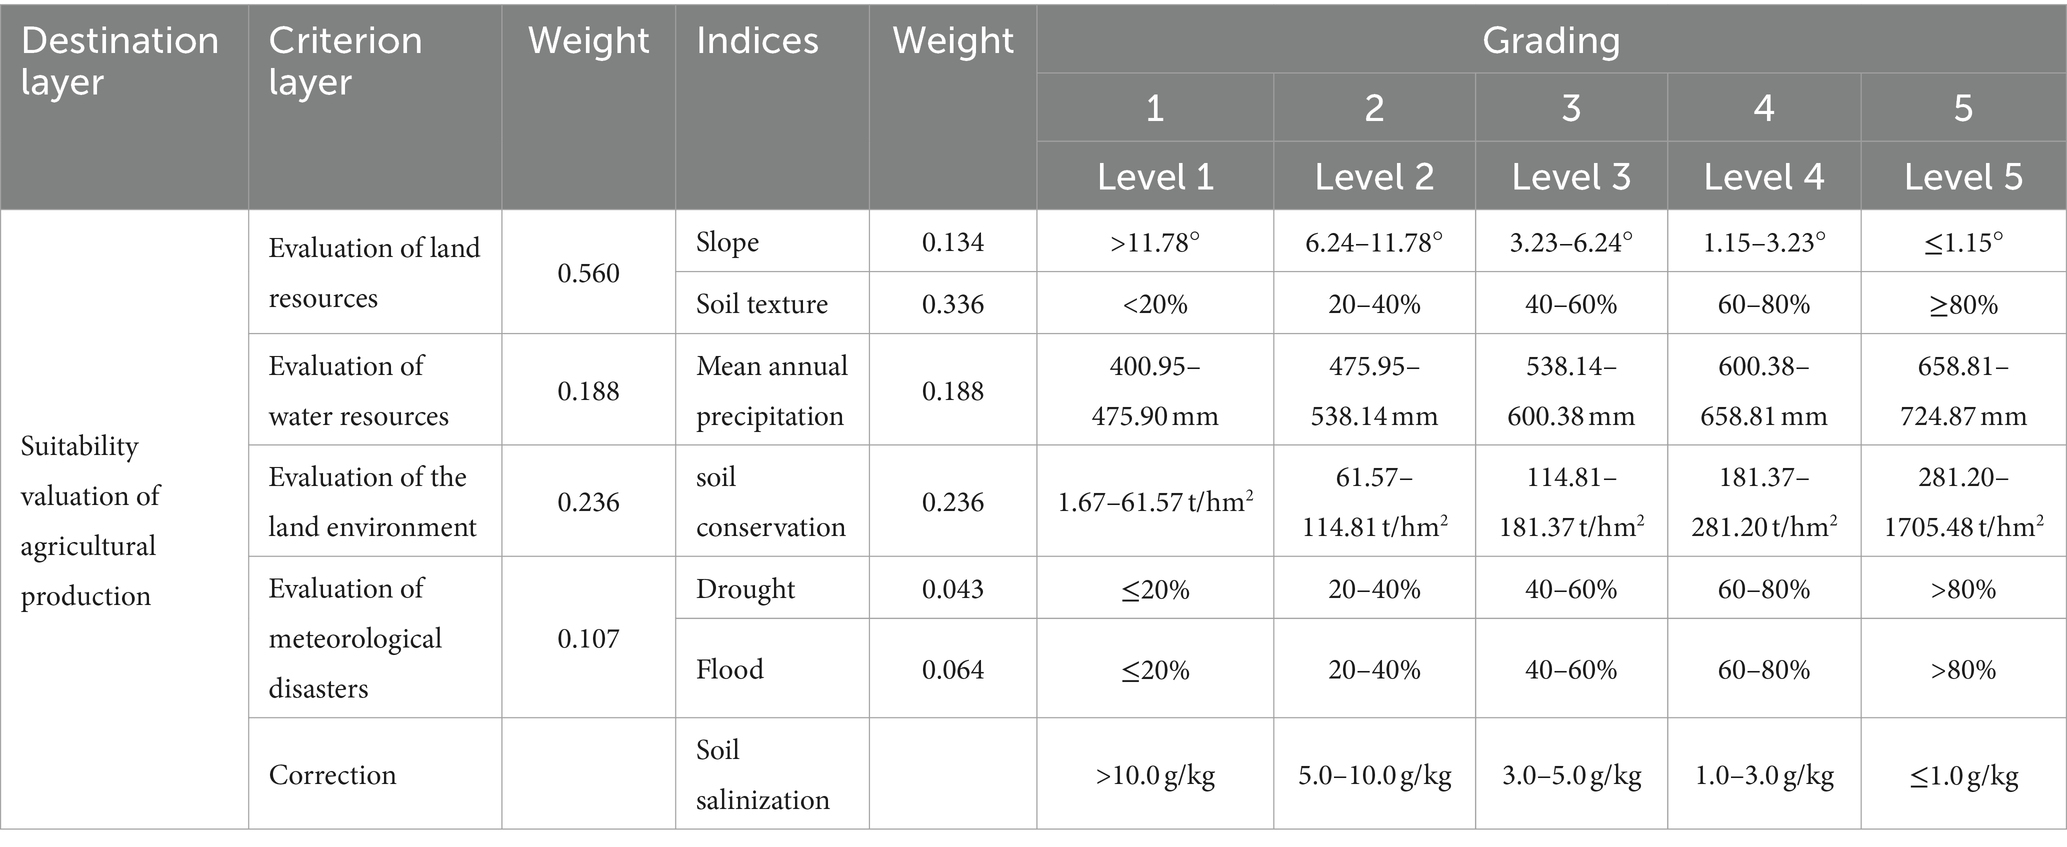
Table 2. Suitability evaluation system of agricultural production.

Table 3. Areas of agricultural production suitability in Cangzhou in 2020.
Affected by the dual influence of sea tide and seawater-type groundwater, the soil type in Cangzhou City is mainly coastal saline-alkaline soil. Therefore, unsuitable and less suitable areas for agricultural production are mainly distributed in Huanghua City, Haixing County, and most towns in Qing County in the east of Cangzhou, which are not conducive to agricultural cultivation and development.
3.2 Analysis of the dominant evaluation of agricultural development
Level grading (I-V) of agricultural development dominance in Cangzhou in 2020 is obtained by ArcGIS software based on the natural breakpoint method (Figure 7) and dominant evaluation system of agricultural development (Table 4). Construction-land planning is preferred in the future due to limited agricultural lands or cultivated lands in the sub-districts of Cangzhou. Therefore, sub-districts are categorized as non-agricultural spaces. Table 5 lists the division area of agricultural development dominance. The majority of areas in Cangzhou in 2020 are classified as Level-III, with general agricultural development dominance. Level-III areas are mainly distributed in the central part of Cangzhou from spatial distribution. Dominant areas of agricultural development are primarily concentrated in Huanghua City in the east of Cangzhou, Qing County in the north, Hejian City in the west, and some towns in Botou City in the southwest. Level-I areas are mainly distributed in Mengcun Hui Autonomous County, Haixing County, and some villages and towns in Yanshan County.
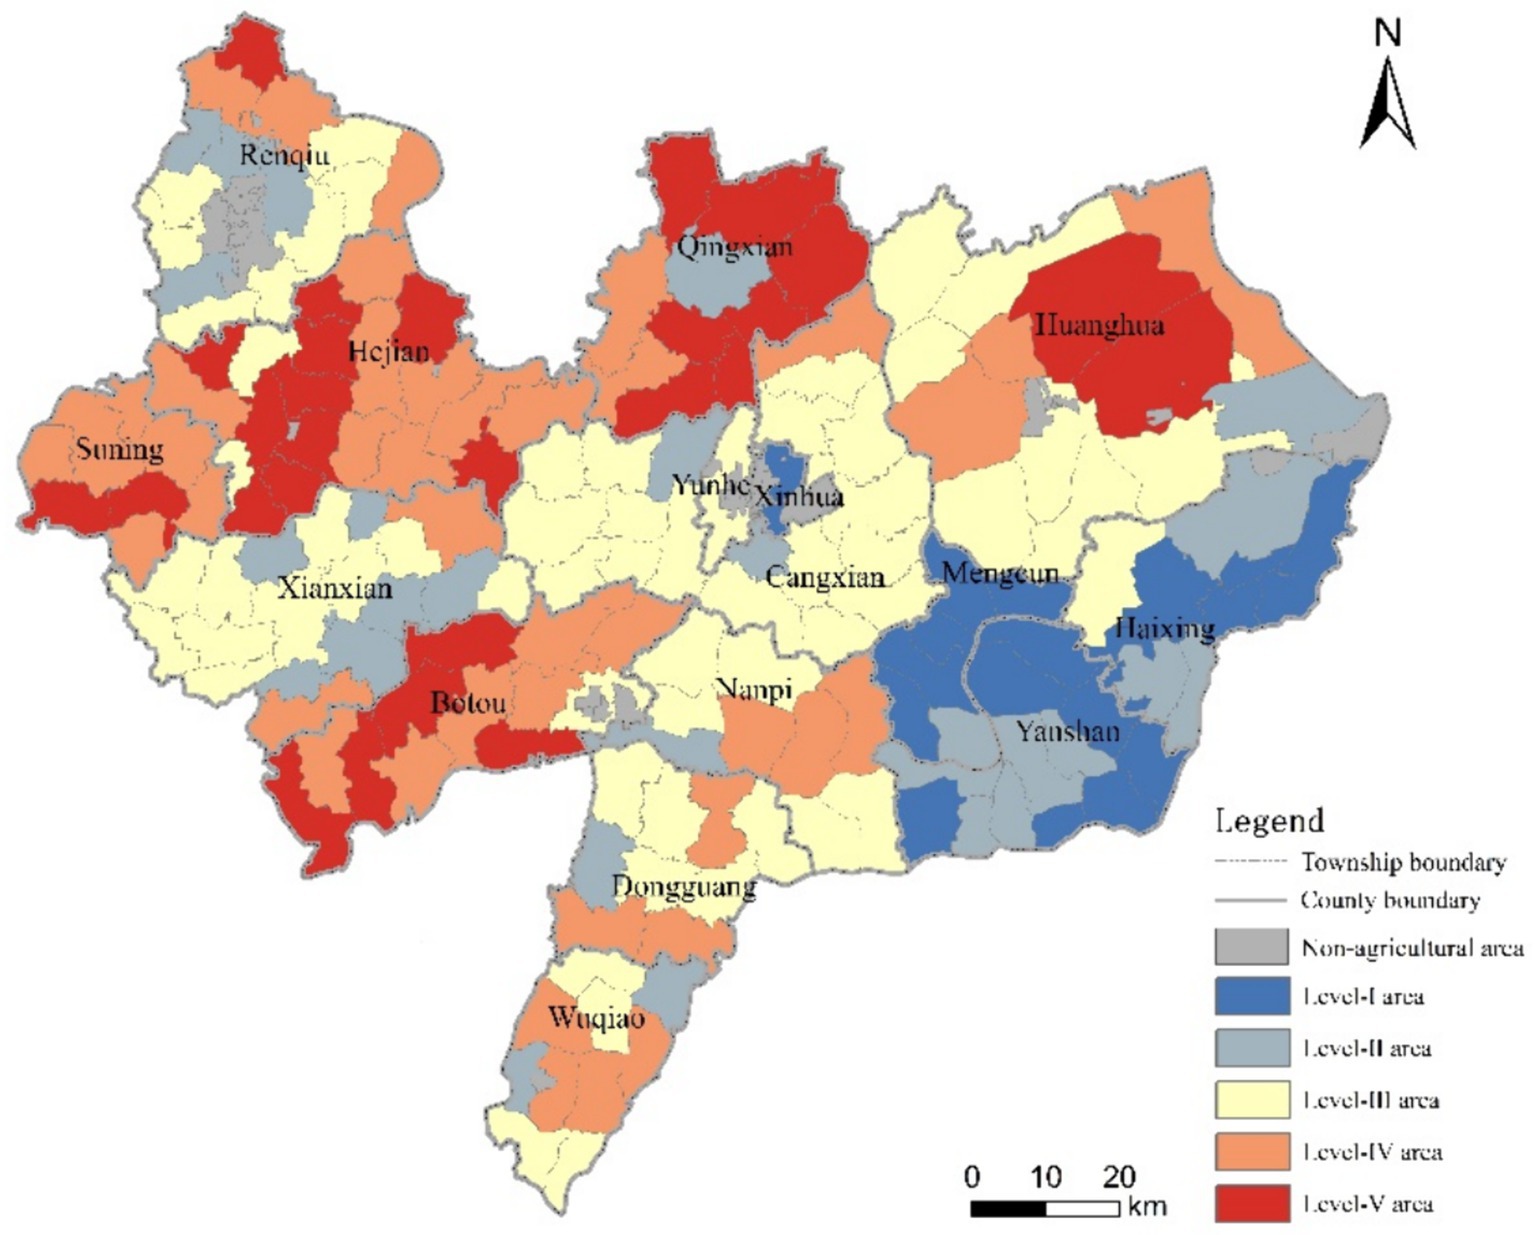
Figure 7. Spatial distribution of dominant evaluation for agricultural development in Cangzhou in 2020.
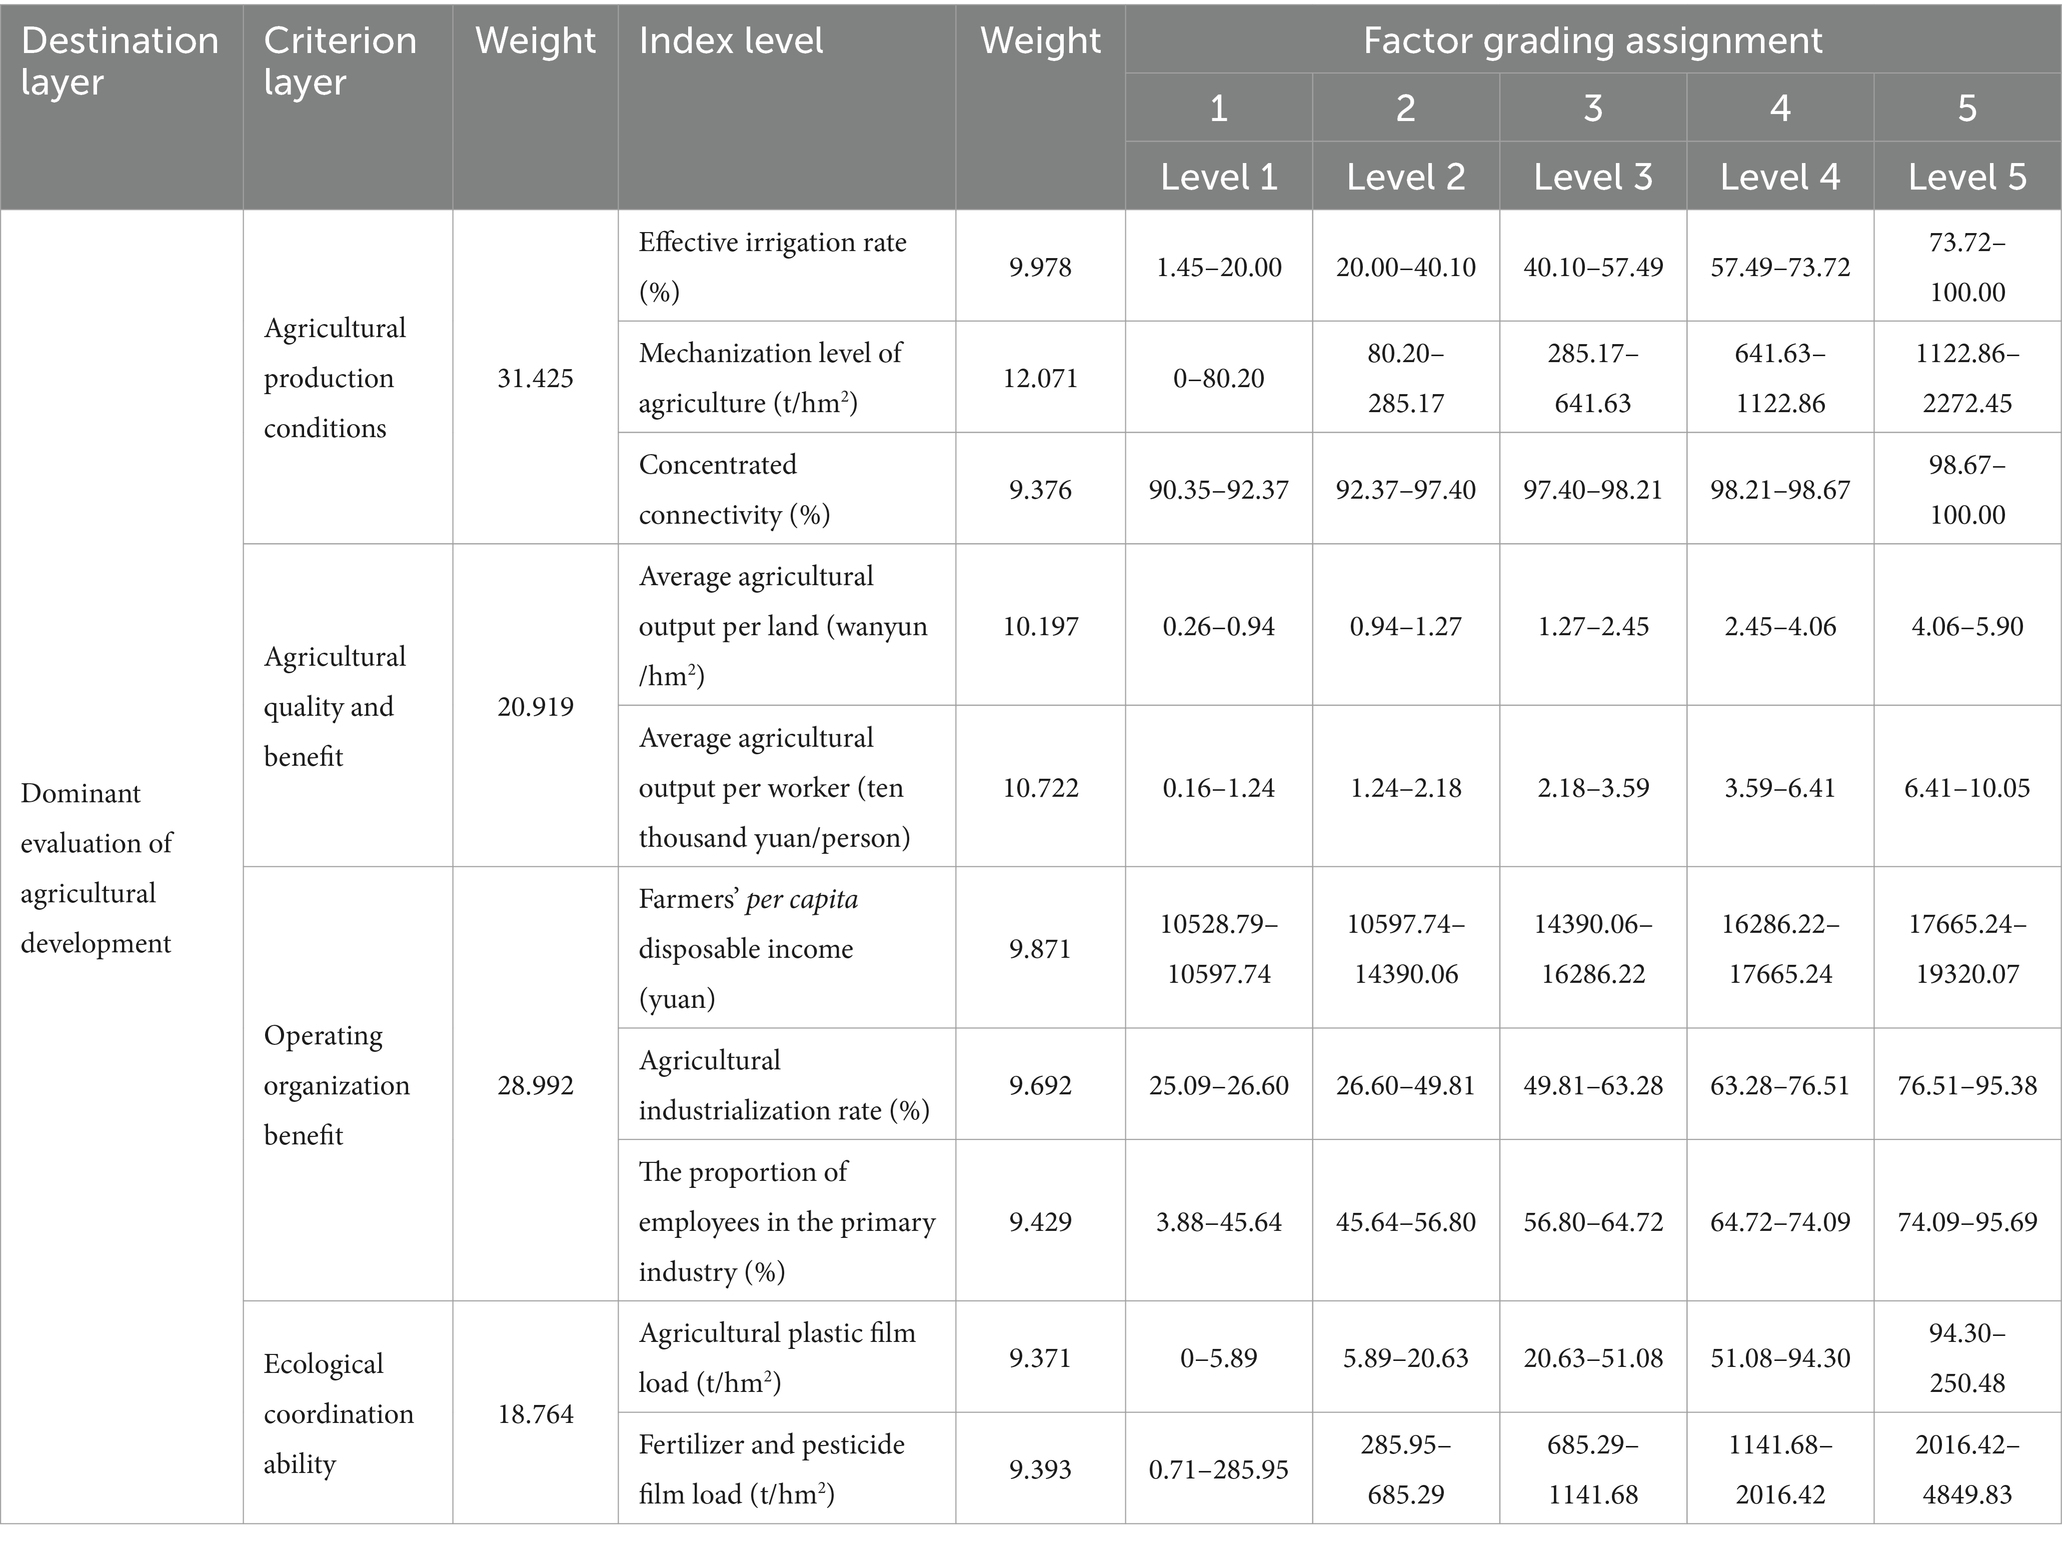
Table 4. Index system of dominant evaluation for agricultural development.
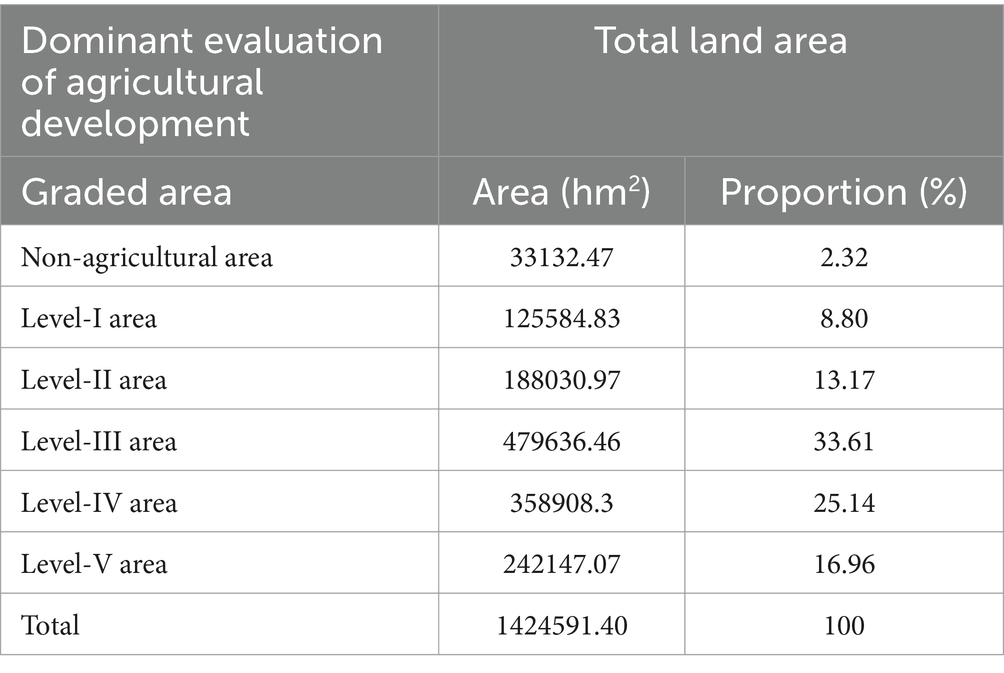
Table 5. Area of agricultural development dominance in Cangzhou in 2020.
3.3 Recognition of the dominant agricultural space
The total area of dominant agricultural space in Cangzhou in 2020 is 238208.75 hm2, accounting for 16.72% of the national territorial area of Cangzhou. The area includes 35 village-and-town units (Figure 8). They are mainly distributed in most villages and towns in Suning County and Hejian City in the western part of Cangzhou as well as some villages and towns in Botou City in the southwest. Non-agricultural area, agricultural unfavorable development area, agricultural potential development area, and ecological protection area proportions are 2.32, 8.80, 70.31, and 1.85%, respectively (Table 6). The agricultural unfavorable development areas in Cangzhou are limited, primarily concentrated within certain villages and towns located in the eastern part of Haixing County. The majority of Cangzhou is agricultural potential development areas, with great potential for agricultural development.
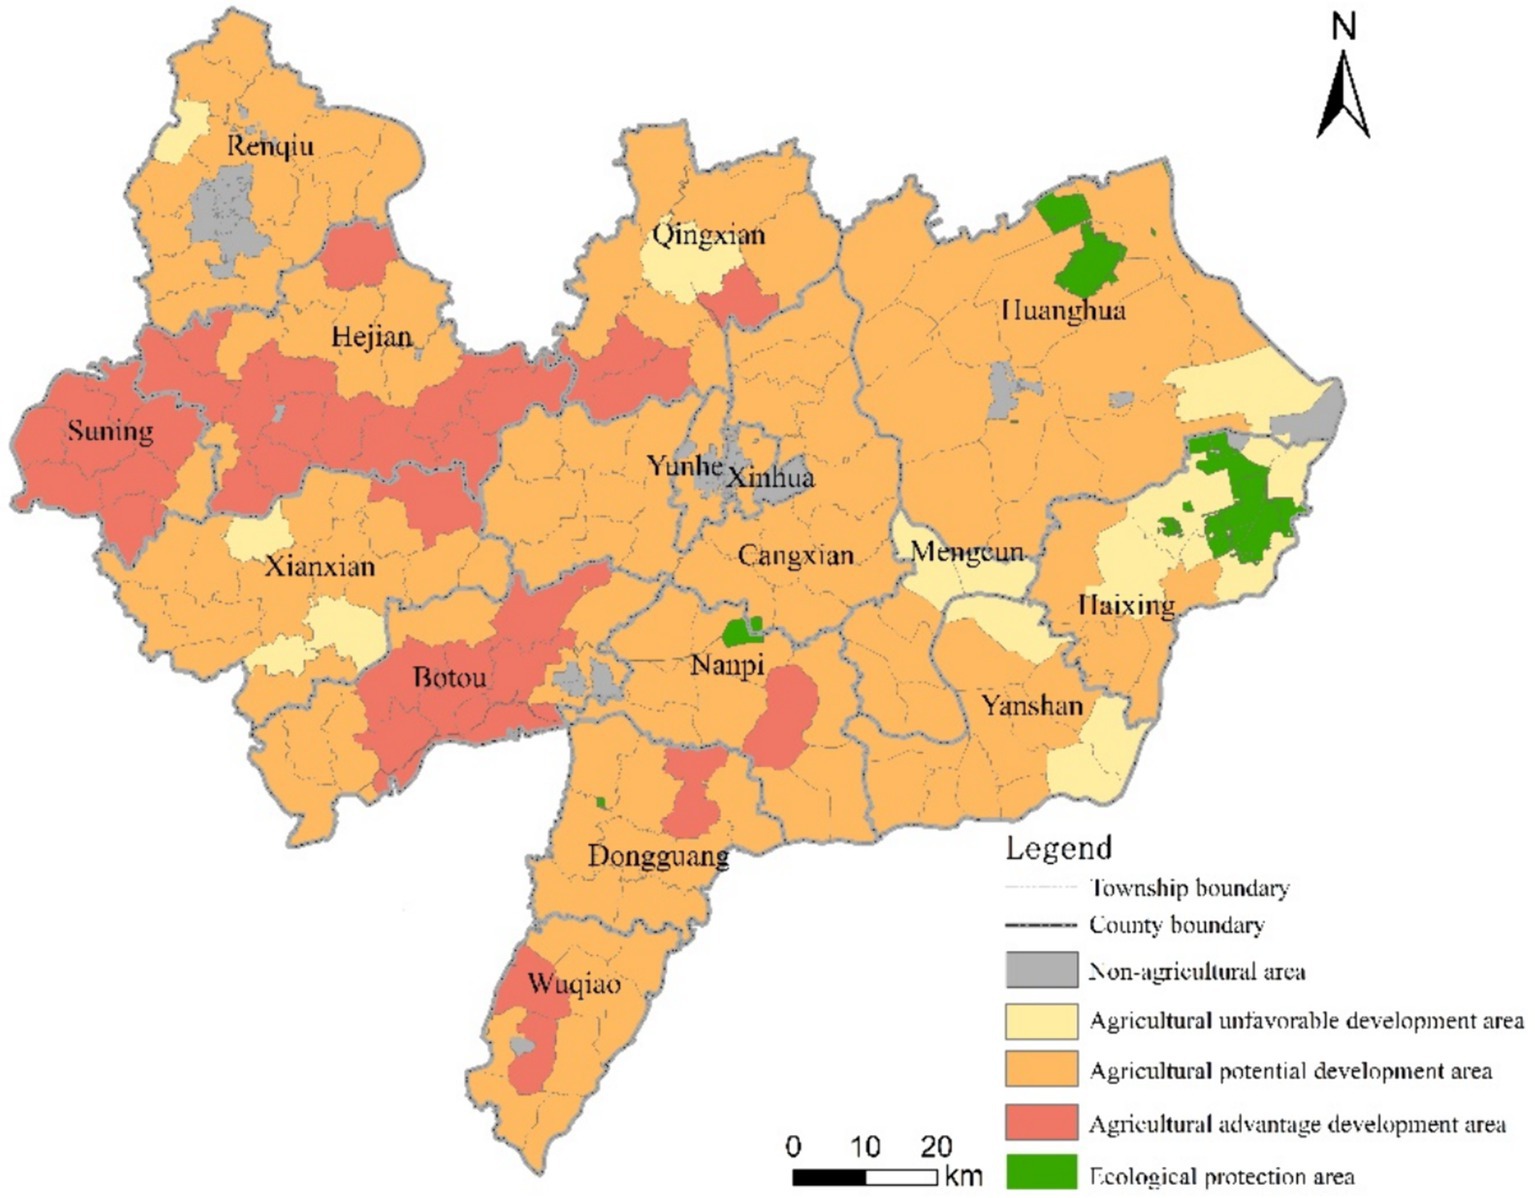
Figure 8. Distribution of the dominant agricultural space in Cangzhou in 2020.
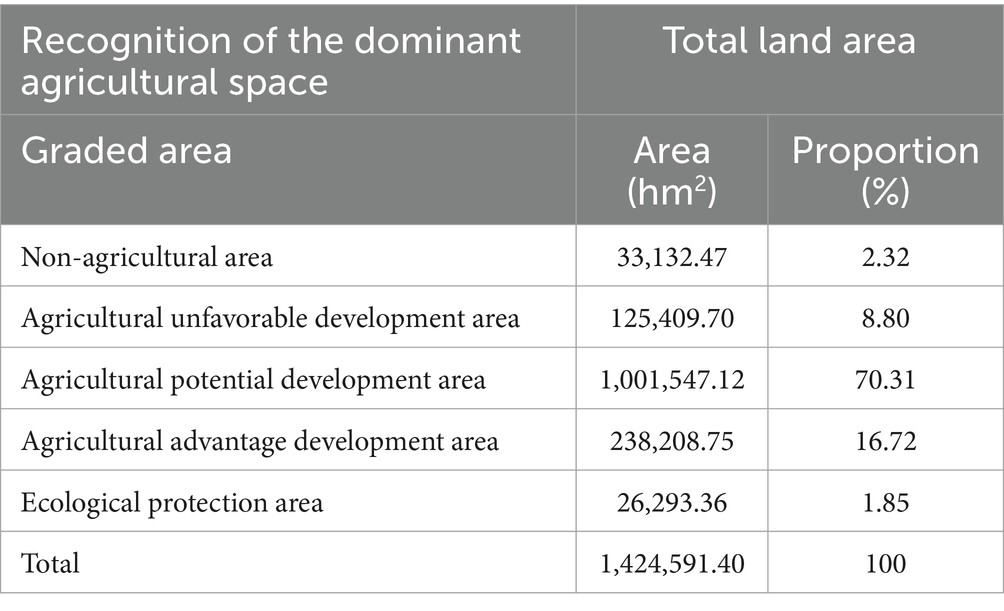
Table 6. Area of agricultural advantage development in Cangzhou in 2020.
Natural resources and economic and social benefits should be fully utilized based on dominant agricultural spaces. The formulation of agricultural development plans tailored to local conditions is essential to maximize the potential for agricultural industries. The act helps to clarify the core spatial layout of future agricultural production. Then, the safety of food production and the modernization of rural areas can be guaranteed. Meanwhile, rural ecological environment and regional characteristics can be protected and inherited by combining ecological red lines. The upgrading and transformation of agricultural potential development areas are the focus of future agricultural work. An agricultural potential development area can be transformed into an agricultural dominant development area. The transformation is based on the gradual improvement of production conditions with the goal of food efficiency and sustainable development.
3.4 Optimized analysis of the multi-objective NSGA-II genetic algorithm
The multi-objective NSGA-II genetic algorithm can be used to coordinate contradictions between goals during optimization. The solution set of objective functions includes 100 Pareto-optimal solutions (Figure 9) under the coordinated development of low carbon and economy. Solutions with maximum economic benefits, minimal carbon emission density, and the intermediate of both are selected, respectively (Table 7).
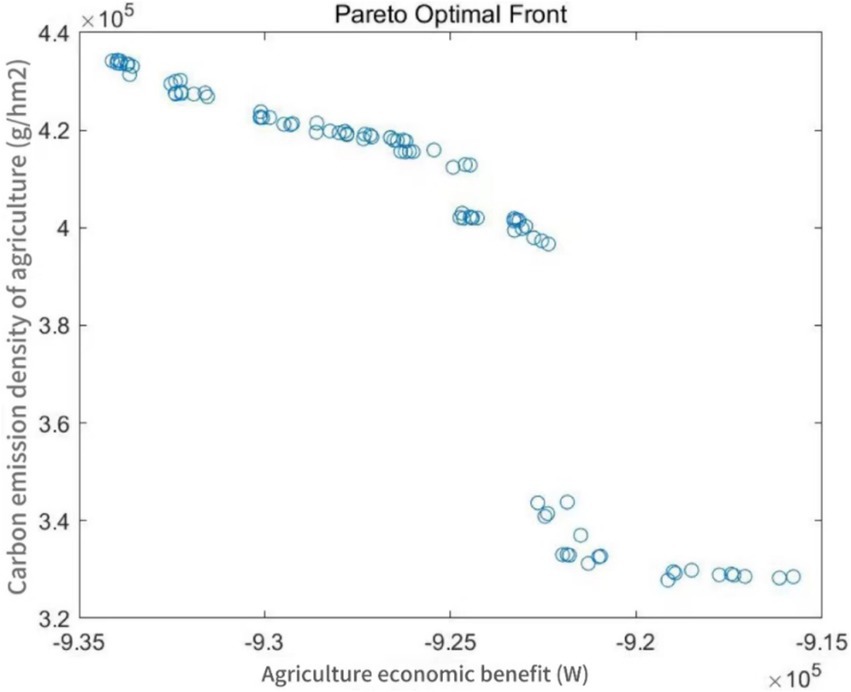
Figure 9. Pareto-optimal solution of the multi-objective scheme in the last iteration.
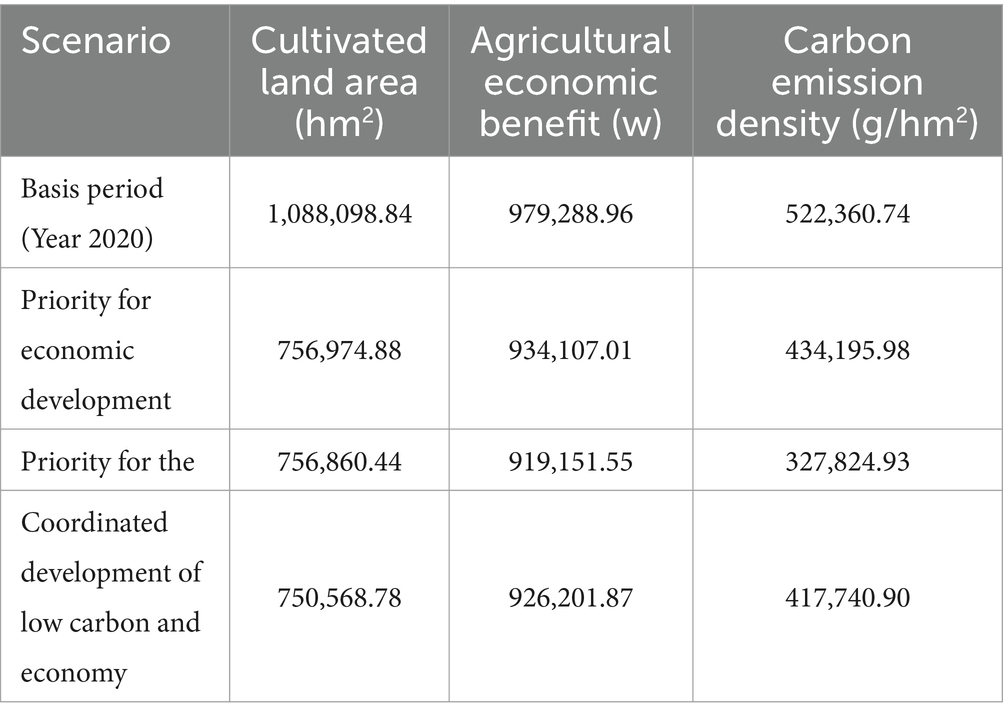
Table 7. Comparison of optimized schemes of the multi-objective NSGA-IIgenetic algorithm.
3.4.1 Priority scenario of economic development
The agricultural economic benefits of cultivated lands in Cangzhou were maximized under the priority scenario of economic development. The total cultivated land area was reduced by 331,123.96 hm2 compared with that in the basis period (2020). The benefits decreased by 45,181.95 w compared to that in 2020 due to the decreased cultivated land area. However, it increased by 14,955.46 w and 7,905.14 wan yuan, respectively, compared with the other two scenarios. Prioritized economic interests can reduce the negative impact of carbon emissions on sustainable economic development according to the sustainable development principle of resources and the environment. Besides, farmers’ income and rural industrial structure can be upgraded.
The following measures can be adopted for the above goal.
1. Promote agricultural high-tech technologies and agricultural modernization as well as cooperation among governments, enterprises, and farmers. Constructure extension service institutions for agricultural high-tech technologies. Enhance policy support for the promotion and application of agricultural high-tech technologies, and encourage farmers to participate in the promotion and application of these technologies;
2. Adjust the structure and layout of agricultural production should be adjusted. Transform the industrial structure and train new agricultural industries. Optimize the production model, with the market as the guiding principle and technology as the support. Guide farmers through planting technology, product sales, and services to transform production from decentralized to regionally large-scale and professional;
3. Land transfer and scale operation are the basis for modern agriculture under the integration of urban and rural development. The management rights can be transferred widely through the independent exercise of land management rights. It is conducive to optimizing the allocation of land resources, land productivity, labor productivity, and resource utilization rate under the market mechanism. Various business entities, large-scale agriculture, and intensive agricultural operations can be improved.
3.4.2 Priority scenario of low-carbon protection
The carbon emission density of cultivated lands in Cangzhou was minimized under the priority scenario of low-carbon protection. The total cultivated land area was reduced by 331,238.40 hm2 compared with that in the basis period (Year 2020). However, the carbon emission reduction was ideal, and the carbon emission density was reduced by 194,535.81 g/hm2 compared to that in 2020. The carbon sequestration of the cultivated land system is important to regulate carbon emissions from land use and achieve the “dual carbon” target. Specifically, increased food production in China mainly depends on the large-scale investment of fertilizers, pesticides, and other agricultural means of production. The application of fertilizers in the cultivated land system is a significant contributor to carbon emissions. Therefore, optimizing the quantitative structure of cultivated lands can promote low-carbon agriculture under the premise of food security based on the priority principle of low-carbon protection. Besides, it is of great significance for the sustainable development of cultivated land resources in the future.
The following measures can be adopted for the above goal
1. Promote new low-carbon agricultural production technologies. Use agricultural production machinery with clean energy. Update water-saving agriculture and irrigation systems to increase crop yields and reduce carbon emissions;
2. Reduce fertilizer inputs and increase the amount of organic fertilizers to reduce pollution and waste of resources in agricultural production. Promote conservation tillage, straw turnover, and farmland shelterbelt construction for the carbon sequestration capacity of agricultural lands;
3. Strengthen the environmental consciousness of farmers, their education on environmental awareness, and their knowledge and motivation toward carbon sequestration. Establish relevant policies and regulations to encourage farmers to adopt environmentally friendly production methods and behaviors.
3.4.3 Scenario of coordinated development of low carbon and economy
Agricultural economic benefit and carbon-emission-density level are in a medium position under the scenario of coordinated development of low carbon and economy. The benefit and density level were reduced by 79.0514 million CNY and 16454.99 g/ hm2, respectively, compared with the agricultural economic benefits in the priority scenario of agricultural development and the carbon emission density in the priority scenario of low-carbon protection. The cultivated land area of each village and town in Cangzhou is the optimal quantitative structure of cultivated land in the future under the coordinated development of a low-carbon economy. A low-carbon economy mainly emphasizes the importance and necessity of environmental protection and energy saving based on low energy consumption and low emissions. It is urgent to transform agricultural economic growth from the model of high consumption and low output to that of low consumption and high output. The green and low-carbon development of agriculture is required in the city, and the symbiotic relationship between the economy and the environment should be coordinated. Finally, a low-carbon economic growth model characterized by green-cycle development can be achieved (Zeng and Deng, 2023).
The following measures can be adopted for the above goal.
1. Promote clean production technologies for circular agriculture based on the principles of recycling, reduction, and reuse. Besides, resource recycling mechanisms should be formulated for the reuse of resources. Increase the benefits of rural production and management to reduce carbon emissions for the sustainable development of the rural low-carbon economy;
2. A suitable ecological development model is required to develop ecological agriculture. Then, land resources should be fully used to improve production and land utilization;
3. The agricultural landscape construction and the ecological value assessment of agricultural products should be carried out. The incentive mechanisms of ecological compensation should be explored to promote the comprehensive management of agricultural ecosystems and the extension of value chains of agricultural products.
4 Discussion
4.1 Existing conclusions
The objective corresponded to the improved quality of cultivated lands in Cangzhou and sustainable agricultural development. Based on the suitability evaluation of agricultural production, the work explored the suitability of agricultural production under natural resources and the agricultural-development dominance hierarchy under economic, social, and ecological factors. The dominant agricultural space was determined by constructing a 2D judgment matrix. The quantitative structure of cultivated lands within each village and town in Cangzhou in 2030 was obtained under different scenarios in terms of the multi-objective NSGA-II genetic algorithm model. It is of certain significance to improve regional agricultural policies as well as the green and high-quality agricultural space in the new era.
The basis for building a recognition system of the dominant agricultural space is to explore the natural economic development of agriculture in the research area. Generally, the suitability evaluation of agricultural production is used to reflect the natural development of agriculture. Zhu et al. (2022) found that most existing ALSE studies consider soil conditions and climate. However, there is less research on socioeconomic factors, which aligns with the development of a recognition system of the dominant agricultural space in the work. The dominant evaluation of agricultural development is combined with the suitability evaluation of agricultural production to make up for the lack of socioeconomic factors in the evaluation. The two encompass natural and socioeconomic ecological elements, which reflect the versatility of the agricultural space.
Agricultural versatility and agricultural policies have always been the research focus. The quantitative expression of agricultural versatility has been widely recognized based on the index quantitative system. Studies have proved that the level of development of multifunctionality in regional agriculture depends on the region’s agricultural resource endowment and stage of socioeconomic development (Wilson, 2008). A recognition system of the dominant agricultural space is constructed. Guo et al. built an evaluation system for agricultural modernization development to analyze agricultural modernization development, regional differences, and obstacles in Hebei Province. They used comprehensive production capacity, industrial management capacity, and high-quality and high-efficiency capabilities. Cangzhou ranks second among 11 cities with a favorable trend of agricultural modernization, which is similar to the dominant evaluation of agricultural development in the work.
4.2 Limitations
However, the work still exhibits certain deficiencies.
1. The division theory and methods of the dominant agriculture space still need to be explored. The combination of traditional suitability evaluation of agricultural production and dominant evaluation of agricultural development has yet to be further clarified. The dominant evaluation of agricultural development and suitability evaluation of agricultural production provide the basis for national land space planning and high-quality agricultural development, respectively. The evaluation results are still inconsistent due to large differences in the indices and evaluation methods of the evaluation system of the two evaluation methods. Therefore, we should fit with the research content and have certain innovative significance under the more comprehensive and practical selection of the evaluation index system. However, more attention should be paid to the adaptability between evaluation systems in the future to ensure innovation and meet rigor requirements.
2. The work studied the actual situation of Cangzhou empirically and selected the evaluation indicators and grading thresholds mainly based on the Dual Evaluation Guide. Further systematic research on threshold division and evaluation indices is needed from the research scale and popularization and application. The data of certain indicators need to be enhanced due to the challenges in data acquisition and the demand for heightened accuracy. For example, soil texture and soil conservation quantity have not been systematically measured in relevant areas because of Cangzhou’s subsequent policy of marine reclamation land. Therefore, relevant evaluation work in the future will require close cooperation from multiple departments to fill the data gaps in certain regions and ensure the timeliness of data. This is of great significance for the future evaluation of the suitability of agricultural production.
3. The objective function of the multi-objective NSGA-II genetic algorithm has yet to be further improved. The optimized dominant agricultural space requires multiple factors. The objective functions of the work are set to maximize agricultural economic benefits and minimize the carbon emission density, with the goal of a low-carbon economy. Conflicts among objective functions are found in the previous research, and the influence of objective functions on optimized results needs to be considered, respectively. Future research can explore more optimization conditions to improve the objective function and the multi-objective planning model for agricultural space optimization.
5 Conclusion
The work constructed the suitability evaluation system of agricultural production and the dominant evaluation system of agricultural development. Then, a novel evaluation system of the dominant agricultural space was proposed with an evaluation zoning hierarchy from natural and agricultural development potential based on the suitability evaluation of agricultural production. The dominant agricultural space in Cangzhou in 2020 was recognized, and the NSGA-II genetic algorithm was used to obtain the optimization results of agricultural space under different scenarios.
The results are as follows.
1. Most of Cangzhou were generally suitable areas for agricultural production. The unsuitable and less unsuitable areas for agricultural production were located in the saline-alkali areas in the eastern part of Cangzhou. There were still many unsuitable areas for agricultural production in current cultivated lands.
2. Level-I areas with agricultural development dominance were mainly distributed in some villages and towns with poor agricultural industrialization in the southeast of Cangzhou. Most of Cangzhou were level-III areas, mainly distributed in Huanghua City in the east and some villages and towns in Qing County in the north with vigorously developed agricultural-economy industrial parks. These areas exhibited great potential for agricultural economic and ecological development.
3. The recognition of 35 villages and towns in Cangzhou’s dominant agricultural areas in 2020 was based on a comprehensive assessment using a 2D judgment matrix. The majority of Cangzhou consisted of areas with potential for agricultural development, and there were fewer areas characterized by dominant agricultural development. The research focus will be on transforming areas with potential for agricultural development into regions characterized by predominant agricultural development.
4. The total cultivated land area under three scenarios exhibited a decreased tendency in the agricultural space of Cangzhou optimized by the multi-objective NSGA-II genetic algorithm model. The total amount of cultivated lands was the largest under the priority scenario of economic development, and that was the least under the scenario of coordinated development of low carbon and economy. The agricultural economic benefits and carbon emission density were reduced under three scenarios. The benefit and density were moderate under the scenario of coordinated development of a low-carbon economy. Therefore, the quantitative structure of cultivated lands in various villages and towns was optimized under different scenarios in the agricultural space of Cangzhou in 2030.
Data availability statement
The raw data supporting the conclusions of this article will be made available by the authors, without undue reservation.
Author contributions
SJ: Writing – original draft. GF: Writing – original draft. ZZ: Writing – review & editing. LZ: Writing – review & editing. PZ: Writing – review & editing.
Funding
The author(s) declare that financial support was received for the research, authorship, and/or publication of this article. This study was funded by the Research Project of Social Science Development in Hebei Province in 2022 (grant no. 20220202232).
Acknowledgments
The authors would like to thank the reviewers for their constructive comments on improving this research.
Conflict of interest
The authors declare that the research was conducted in the absence of any commercial or financial relationships that could be construed as a potential conflict of interest.
Publisher’s note
All claims expressed in this article are solely those of the authors and do not necessarily represent those of their affiliated organizations, or those of the publisher, the editors and the reviewers. Any product that may be evaluated in this article, or claim that may be made by its manufacturer, is not guaranteed or endorsed by the publisher.
Footnotes
2. ^http://webarchive.iiasa.ac.at/Research/LUC/External-World-soil-database/
References
Akpoti, K., Kabo-bah, A. T., and Zwart, S. J. (2019). Agricultural land suitability analysis: state-of-the-art and outlooks for integration of climate change analysis. Agric. Syst. 173, 172–208. doi: 10.1016/j.agsy.2019.02.013
Amini, S., Rohani, A., Aghkhani, M. H., Abbaspour-Fard, M. H., and Asgharipour, M. R. (2020). Assessment of land suitability and agricultural production sustainability using a combined approach (fuzzy-AHP-GIS): a case study of Mazandaran province, Iran. Informat. Proces. Agric. 7, 384–402. doi: 10.1016/j.inpa.2019.10.001
Author (2022). Reaearch on the optimization of agricultural production layout in oasis based on development suitability evaluation. Xinjiang Normal University.
Ayoub Shaikh, T., Rasool, T., and Rasheed Lone, F. (2022). Towards leveraging the role of machine learning and artificial intelligence in precision agriculture and smart farming. Comput Electron Agr 198:107119. doi: 10.1016/j.compag.2022.107119
Branco, J. E. H., Bartholomeu, D. B., Alves Junior, P. N., and Caixeta Filho, J. V. (2021). Mutual analyses of agriculture land use and transportation networks: the future location of soybean and corn production in Brazil. Agric. Syst. 194:103264. doi: 10.1016/j.agsy.2021.103264
Bu, K., Zhao, Y., and Zheng, X. (2021). Optimization design of foundation pit engineering above subway tunnel based on NSGA2 genetic algorithm. J. Railway Sci. Eng. 18, 459–467. doi: 10.19713/j.cnki.43-1423/u.T20200287
Budak, M., Kılıç, M., Günal, H., Çelik, O., and Sırrı, M. (2024). Land suitability assessment for rapeseed potential cultivation in upper Tigris basin of Turkiye comparing fuzzy and boolean logic. Ind. Crop. Prod. 208:117806. doi: 10.1016/j.indcrop.2023.117806
Cao, Y., Li, G., Wang, J., Fang, X., and Sun, K. (2022). Systematic cognition and research framework of non-food conversion of cultivated land: from food security to multidimensional security. Land Sci. China 36, 1–12.
Cui, X., Cai, T., Deng, W., Zheng, R., Jiang, Y., and Bao, H. (2022). Indicators for evaluating high-quality agricultural development: empirical study from Yangtze River Economic Belt, China. Soc. Indic. Res. 164, 1101–1127. doi: 10.1007/s11205-022-02985-8
Federici, S., Tubiello, F. N., Salvatore, M., Jacobs, H., and Schmidhuber, J. (2015). New estimates of CO2 forest emissions and removals: 1990-2015. For. Ecol. Manag. 352, 89–98. doi: 10.1016/j.foreco.2015.04.022
Fu, L., Mao, X., Mao, X., and Wang, J. (2022). Evaluation of agricultural sustainable development based on resource use efficiency: empirical evidence from Zhejiang Province, China. Front. Environ. Sci. 10:860481. doi: 10.3389/fenvs.2022.860481
Ghoseiri, K., and Ghannadpour, S. F. (2010). Multi-objective vehicle routing problem with time windows using goal programming and genetic algorithm. Appl. Soft Comput. 10, 1096–1107. doi: 10.1016/j.asoc.2010.04.001
Gu, C., and Cao, Y. (2019). On the technological innovation of territorial spatial planning in the new era. Plann. Construct. Beijing 4, 64–70.
Hernández-Cruz, X., Villalobos, J. R., Runger, G., and Neal, G. (2023). Building an intelligent system to identify trends in agricultural markets. J. Clean. Prod. 425:138956. doi: 10.1016/j.jclepro.2023.138956
Hossen, B., Yabar, H., and Mizunoya, T. (2021). Land suitability assessment for pulse (green gram) production through remote sensing, GIS and multicriteria analysis in the coastal region of Bangladesh. Sustain. Basel 13:12360. doi: 10.3390/su132212360
Konefal, J., de Olde, E. M., Hatanaka, M., and Oosterveer, P. J. M. (2023). Signs of agricultural sustainability: a global assessment of sustainability governance initiatives and their indicators in crop farming. Agric. Syst. 208:103658. doi: 10.1016/j.agsy.2023.103658
Le Quéré, C., Andrew, R. M., Friedlingstein, P., Sitch, S., Pongratz, J., Manning, A. C., et al. (2018). Global Carbon Budget 2017. Earth System Sci. Data 10, 405–448. doi: 10.5194/essd-10-405-2018
Liu, Y., Ying, O., and Cai, H. (2021). Evaluation of China’s agricultural green TFP and its spatiotemporal evolution characteristics. J. Quantitative Tech. Econ. 38, 39–56. (In Chinese). doi: 10.13653/j.cnki.jqte.2021.05003
Liu, X., Zheng, S., and Cui, B. (2003). Discussion on the comprehensive index method for the evaluation of agricultural economic benefits. J. Northwest A&F Univ. 5, 42–44.
Ma, S., and Yan, S. (2016). Research on the development trend, problems and countermeasures of leisure agriculture in China. China's Agric. Resour. Reg. Plann. 37, 160–164.
Nguyen, H., Nguyen, T., Hoang, N., Bui, D., Vu, H., and Van, T. (2020). The application of LSE software: a new approach for land suitability evaluation in agriculture. Comput. Electron Agr. 173:105440. doi: 10.1016/j.compag.2020.105440
Ngwira, A. R., Aune, J. B., and Mkwinda, S. (2012). On-farm evaluation of yield and economic benefit of short term maize legume intercropping systems under conservation agriculture in Malawi. Field Crop Res. 132, 149–157. doi: 10.1016/j.fcr.2011.12.014
Pan, Y., Lin, Y., and Yang, R. (2022). Agricultural production space suitability in China: spatial pattern, influencing factors and optimization strategies. Environ. Res. Public Health 19:19. doi: 10.3390/ijerph192113812
Pradeleix, L., Roux, P., Bouarfa, S., and Bellon-Maurel, V. (2022). Multilevel environmental assessment of regional farming activities with life cycle assessment: tackling data scarcity and farm diversity with life cycle inventories based on agrarian system diagnosis. Agric. Syst. 196:103328. doi: 10.1016/j.agsy.2021.103328
Rana, R. L., Bux, C., and Lombardi, M. (2023). Carbon footprint of the globe artichoke supply chain in southern Italy: from agricultural production to industrial processing. J. Clean. Prod. 391:136240. doi: 10.1016/j.jclepro.2023.136240
Ren, H., Liu, B., Zhang, Z., Li, F., Pan, K., Zhou, Z., et al. (2022). A water-energy-food-carbon nexus optimization model for sustainable agricultural development in the Yellow River Basin under uncertainty. Appl. Energ. 326:120008. doi: 10.1016/j.apenergy.2022.120008
Schaller, L., Targetti, S., Villanueva, A. J., Zasada, I., Kantelhardt, J., Arriaza, M., et al. (2018). Agricultural landscapes, ecosystem services and regional competitiveness—assessing drivers and mechanisms in nine European case study areas. Land Use Policy 76, 735–745. doi: 10.1016/j.landusepol.2018.03.001
Song, Y., Shang, M., Shi, X., Zhang, H. C., and Chu, Q. (2018). Analysis of the change characteristics and driving factors of agricultural water footprint in Cangzhou City. J. China Agric. Univ. 23, 1–14.
Su, H., Cao, Y., Gu, C., Jin, J., Zhang, X., Yi, H., et al. (2020). Research on the spatial delineation of advantageous agriculture in the "double evaluation" of cities and counties: theories, methods and cases. J. Nat. Resour. 35, 1839–1852. doi: 10.31497/zrzyxb.20200807
Wang, Y., Fan, J., and Zhou, K. (2019). Based on the integration of "double evaluation", the regional function optimization zoning of land space. Geograph. Stud. 38, 2415–2429.
Wilson, G. A. (2008). From weak to strong multifunctionality:conceptualising farm-level multifunctional transitional pathways. J. Rural. Stud. 24, 367–383. doi: 10.1016/j.jrurstud.2007.12.010
Zaman, K., Khan, M. M., Ahmad, M., and Khilji, B. A. (2012). RETRACTED: the relationship between agricultural technologies and carbon emissions in Pakistan: peril and promise. Econ. Model. 29, 1632–1639. doi: 10.1016/j.econmod.2012.05.024
Zapata, N., Bahddou, S., Latorre, B., and Playán, E. (2023). A simulation tool to optimize the management of modernized infrastructures in collective and on-farm irrigation systems. Agr. Water Manag. 284:108337. doi: 10.1016/j.agwat.2023.108337
Zeng, F., and Deng, Y. (2023). The coupling and coordination relationship between agricultural economic development and ecological environment system: based on the empirical evidence of green and low-carbon development in Hunan Province. J. Jishou Univ., 45, 1–12. doi: 10.13438/j.cnki.jdxb.2024.04.013
Keywords: suitability of agricultural production, dominance of agricultural development, dominant agricultural space, multi-objective NSGA-II genetic algorithm, Cangzhou
Citation: Jing S, Fu G, Zhou Z, Zhao L and Zhang P (2024) The recognition and optimization study on the dominant agricultural space in Cangzhou based on the suitability evaluation of agricultural production. Front. Sustain. Food Syst. 8:1434214. doi: 10.3389/fsufs.2024.1434214
Edited by:
Basanta Paudel, Institute of Geographic Sciences and Natural Resources Research (CAS), ChinaReviewed by:
Maria Elena Latino, University of Salento, ItalyFu Meichen, China University of Geosciences, China
Yanzhao Yang, Institute of Geographic Sciences and Natural Resources Research (CAS), China
Copyright © 2024 Jing, Fu, Zhou, Zhao and Zhang. This is an open-access article distributed under the terms of the Creative Commons Attribution License (CC BY). The use, distribution or reproduction in other forums is permitted, provided the original author(s) and the copyright owner(s) are credited and that the original publication in this journal is cited, in accordance with accepted academic practice. No use, distribution or reproduction is permitted which does not comply with these terms.
*Correspondence: Zhi Zhou, emhvdXpoaTc5NzgyNUAxNjMuY29t
†These authors have contributed equally to this work