 Asma Sikander
 Stefan Deegener
- Hamburg University of Technology, Institute of Wastewater Management and Water Protection, Hamburg, Germany
With the growing awareness of microplastics in the environment, the question of microplastics as remnants of biodegradable plastic (BDP) products is gaining momentum. BDP bags for kitchen waste collection are often certified as fully compostable as proof of industrial compostability. Frequently certification is done using under standardized laboratory conditions within 12 weeks. Composting plants often process biowaste into compost in a shorter time under inhomogeneous conditions. This study investigates the decomposition behavior of commercially available BDP bags for kitchen waste collection at an industrial composting plant within a practically realistic time frame of 6 weeks. The research determines the decomposition behavior under practice conditions. Four bag types, two made from thermoplastic starch (TPS) blends and two from polylactic acid (PLA) blends underwent composting. The decomposition was evaluated by examining the remaining macro- (> 8 mm), meso- (2–8 mm), and microparticles (1–2 mm) in the compost with different methods. After 6 weeks, the mass-based decomposition rate of TPS blend bags exceeded 95%. In contrast, PLA blend bags failed to reach a decomposition rate of 90%. The study did not depict very small particles <1 mm. However, they are present. The study findings indicate that composting time and conditions, inhomogeneities, as well as the bag type are crucial factors influencing the decomposition of BDP bags. Concerns are raised about the usefulness of DIN 13432 as certification scheme for industrial conditions.
1 Introduction
Rising environmental concerns associated with conventional plastic waste have prompted a shift towards the utilization of biodegradable alternatives. For biowaste collection from households, biodegradable plastic (BDP) bags have been designed to undergo microbial decomposition under specific environmental conditions. They are marketed as promising for a more sustainable waste management (VERBUND, 2023).
In Germany, household biowaste can be disposed in collection bins (bio bin) using BDP bags in accordance with the Biowaste Ordinance (BioAbfVO, 2022), given compliance with specified requirements. Beside acceptance of the local waste management company, it includes certification in accordance with DIN EN 13432 (2000, 2020) but goes a step further by considering a shorter timeframe of 6 weeks for decomposition (DINplus, 2020). The DIN 13432 standard attests to complete the defined BDP decomposition goals within a maximum period of 12 weeks. It defines a material as fully compostable if 90% of the organic matter biodegrades under standardized laboratory composting and disintegrates into particles <2 mm.
The quality requirements related to foreign matter in compost are regulated also by the Biowaste Regulation (BioAbfVO, 2022) in §4 (4). It stipulates that deformable plastic foils are allowed to be present to a maximum of 0.1% of the compost dry matter (DM). This value is also expressed in the fertilizer regulation (DüMV, 2021) in § 4 (3). Remaining BDP particles would contribute to the foreign matter in compost. Many compost plant operators raise the question of the practical feasibility to achieve complete decomposition within the stipulated six-week period and have concerns of BDP residues in the compost. They also express apprehension regarding potential compost contamination by especially small BDP particles. The need to address these concerns becomes crucial in light of evolving awareness of microplastic-related issues in all environments including composting facilities.
This paper aims to investigate the decomposition behaviour of BDP bags under industrial conditions. In the context of this study, the term “decomposition” is defined as the process involving both biological degradation into carbon dioxide and water and disintegration into smaller particles. These processes occur concurrently and may influence each other. Our investigations encompass the recording of both together and due to their interdependence, these processes cannot be reported separately. Consequently, statements on decomposition in this study encompass both processes collectively. To assess the decomposition, areas and masses of the remaining BDP bag particles after composting were examined. The methods employed were evaluated for their informative value in determining the degree of decomposition. A comprehensive understanding of the BDP decomposition and the resultant impurities including the methodological proofs and their uncertainties is imperative to assess the overall effectiveness and environmental compatibility of these materials.
2 Materials and methods
2.1 Materials
2.1.1 Household biowaste collection bags
In the conducted experiments, four distinct biowaste collection bag types (denoted as S, G, B, R) were employed (Figure 1). The G-series employed two bag variants, G1 and G2, varying in their maximum filling volumes. These bags were produced from BDP, certified as compostable according to DIN EN 13432 (2000). The BDP bags, sourced from various manufacturers, were chosen to encompass a broad representation of the material compositions prevalent in Germany.
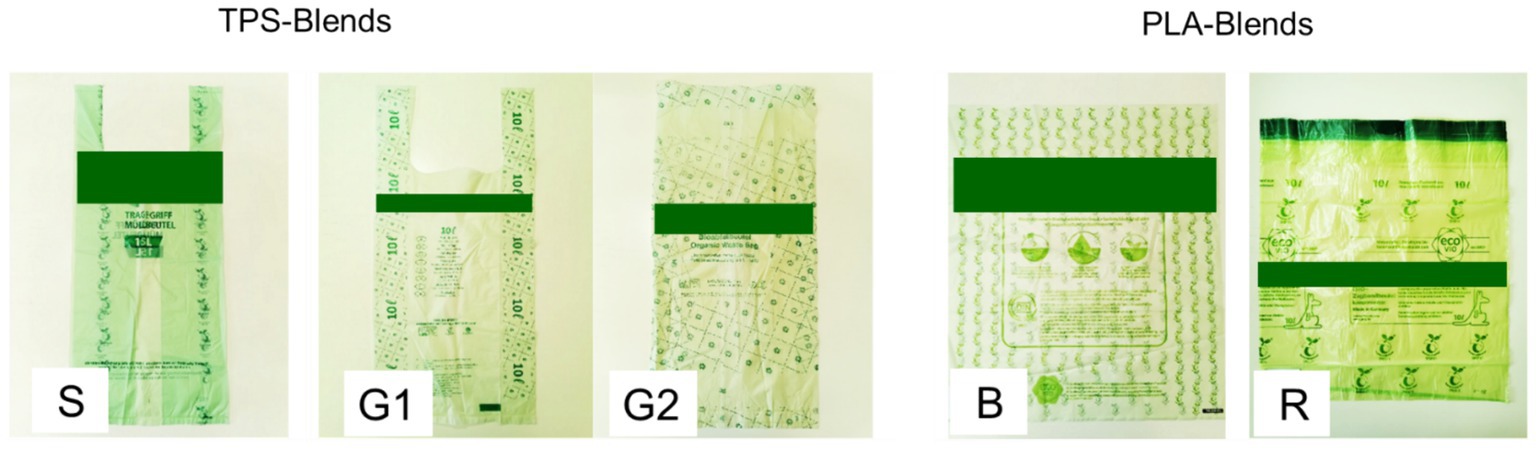
Figure 1. Classification of BDP bags by type designation (based on Deegener et al., 2022).
One major compound in all bag types was polybutylene adipate terephthalate (PBAT), the second polylactic acid (PLA) or thermoplastic starch (TPS). In the following, the respective materials were termed as PLA-blend or TPS-blend. This information on the major compounds was provided by the companies. Information on additives were not available.
Table 1 presents a comprehensive overview of the primary characteristics of the bags. They differed in the maximum filling volume and the foil thickness and therefore also in the foil area and the bag mass. Details regarding determination of the parameter are available in Deegener et al. (2022).
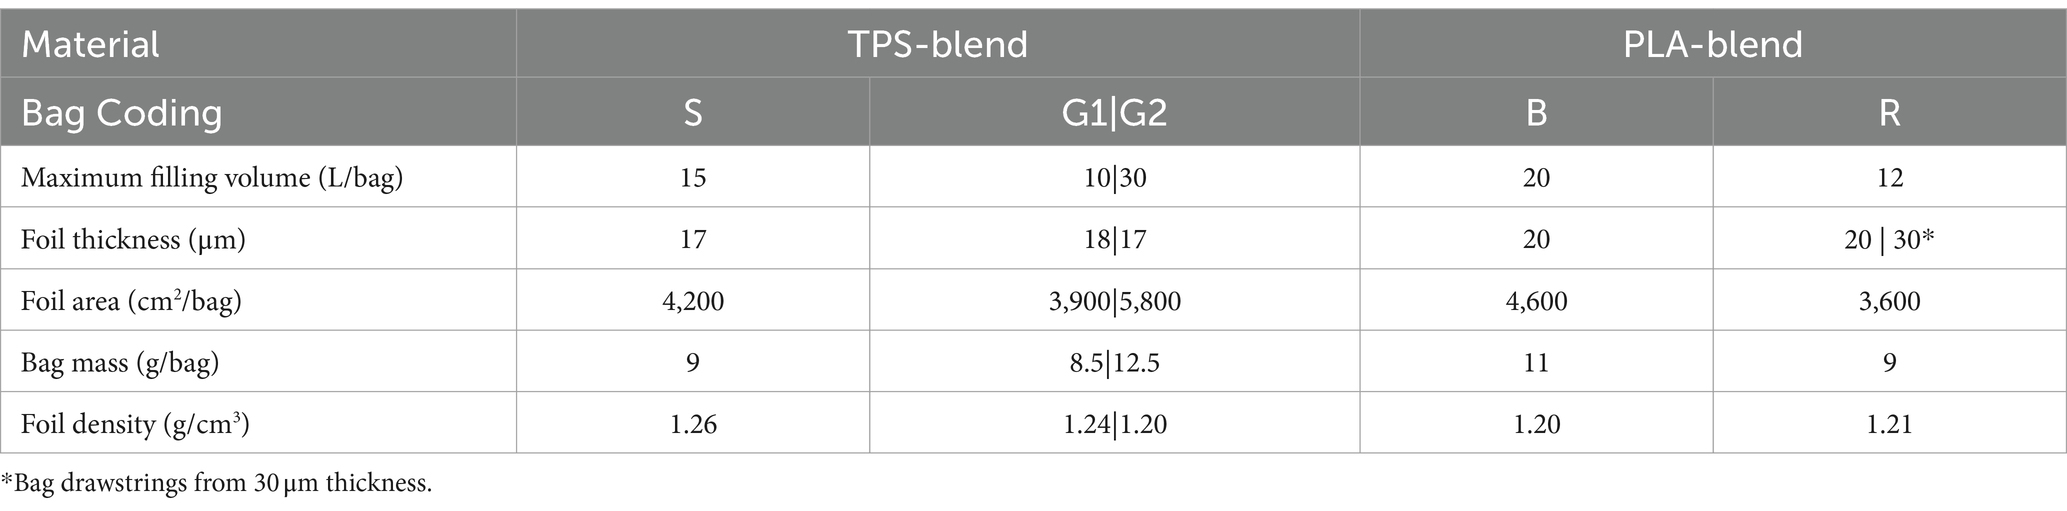
Table 1. Characteristics of employed BDP bags (based on Deegener et al., 2022).
2.1.2 Biowaste in the bags
The biowaste used for filling the bags was a mixture from food waste and bio bin waste in an approximate ratio of 1:2. The mixing was done using a shovel until the mixture had no watery consistency anymore. The bio bin waste consisted mostly of green waste from gardens with some food waste. During mixing and bag filling (Section 2.2.1 Filling of BDP bags), the biowaste underwent a manual removal of larger impurities, such as plastic films and coarse plastic contaminants. This process eliminated large undesirable elements from the biowaste to a large extent.
2.1.3 Biowaste around the bags inside the nets
Twenty filled bags (Section 2.2.1 Filling of BDP bags) formed one batch and were enclosed by bio bin waste (Section 2.1.2 Biowaste in the bags). The materials were held together by a net. Details are to be found in the Supplementary Table 1. From the bio bin waste, the larger impurities were removed as described before. In total, a set of 32 nets was crafted for the experiment. These nets were designed to be stable, allowing for permeability of air and liquids while remaining resistant to decay. Additionally, they were intended to prevent substantial amounts of biowaste loss during transportation. To meet these specifications, a three-layered structure was produced using various net materials. The “bird protection net” and the “industrial net” were interlinked with a nylon cord, and the “football goal net” was introduced as a third layer to enhance overall strength.
2.1.4 Biowaste around the nets
Bio bin waste consisting mainly from green waste with a few food waste compounds was used to enclose the nets. Furthermore, some sieving residues from former industrial composting processes were contained. This mixture contained impurities. It represented the common substrate used in the composting facility and not the investigated samples from the net contents.
2.2 Method
2.2.1 Filling of BDP bags
Impressions from the filling are shown in Figure 2. For each bag type, a total of 160 BDP bags were filled with the food-waste rich mixture (Section 2.1.2 Biowaste in the Bags). For each bag, 1.5 to 2.0 kg of such waste was used. For the G-series, half of the bags were from type G1, the other from G2. Generally, half of the bags were left unsealed, while the remaining half were divided into two groups. For bag types B, G and S, one group was closed with a single knot, and the other with a double knot. For bag type R, which features a drawstring, half of these bags were left unsealed, while the other half were closed using the drawstring mechanism.
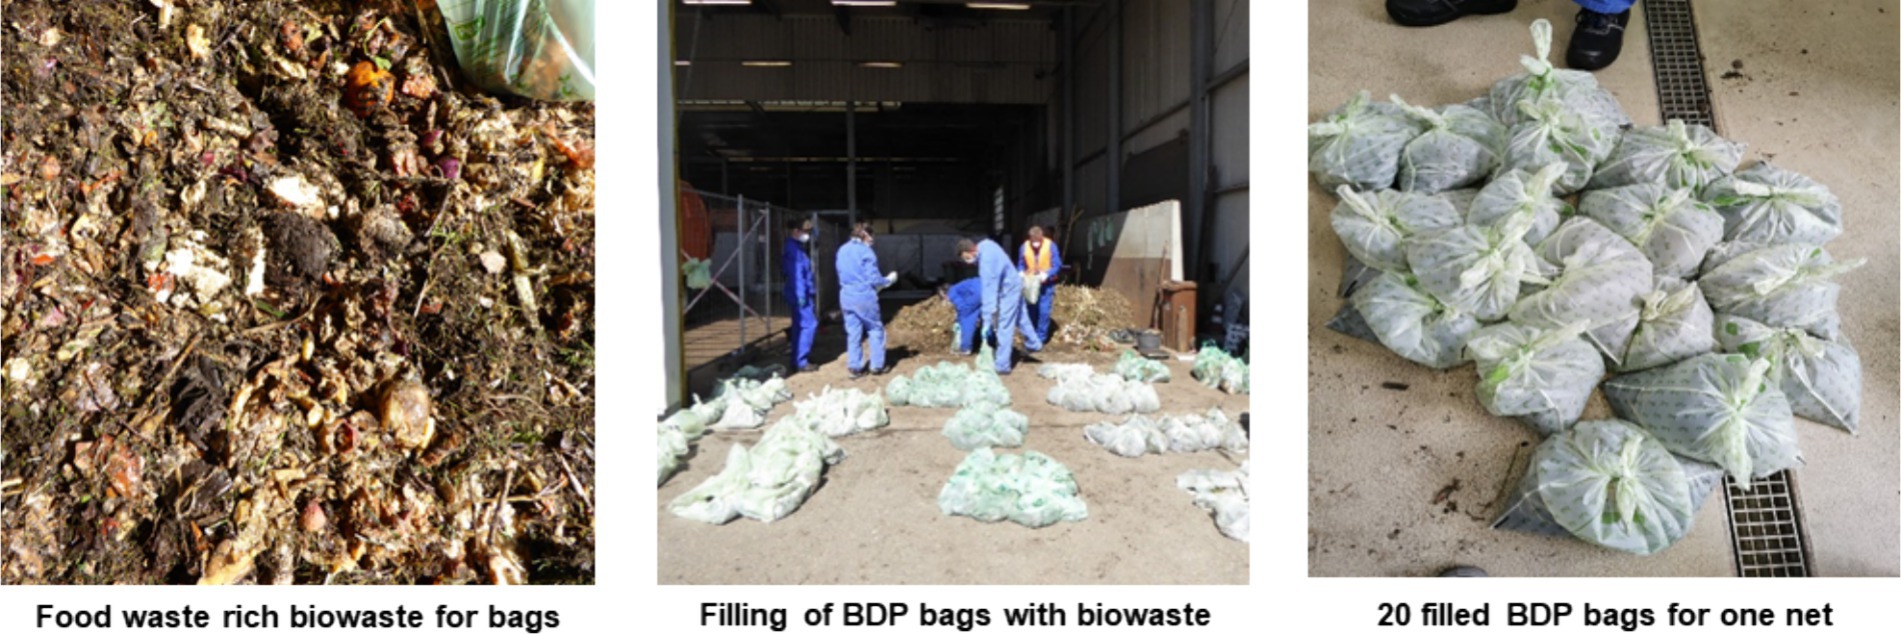
Figure 2. Preparation of filled BDP bags for composting in nets (partially based on Deegener et al., 2022).
For one experimental batch, 20 filled bags from one type (S, G, B, R) were merged to one batch and their cumulative masses and volumes were determined. The average batch mass was 37 kg with a biowaste density of approximately 0.5 kg/L. For details see Supplementary Table 1.
2.2.2 Filling of mesh nets
The process of net preparation is depicted from Figure 3. The 20 filled bags from one batch were placed in the three-layered net along with the bio bin waste (Section 2.1.3 Biowaste around the bags inside the nets). The average content per net was 97 kg with more than one third consisting of filled bags (Supplementary Table 1).
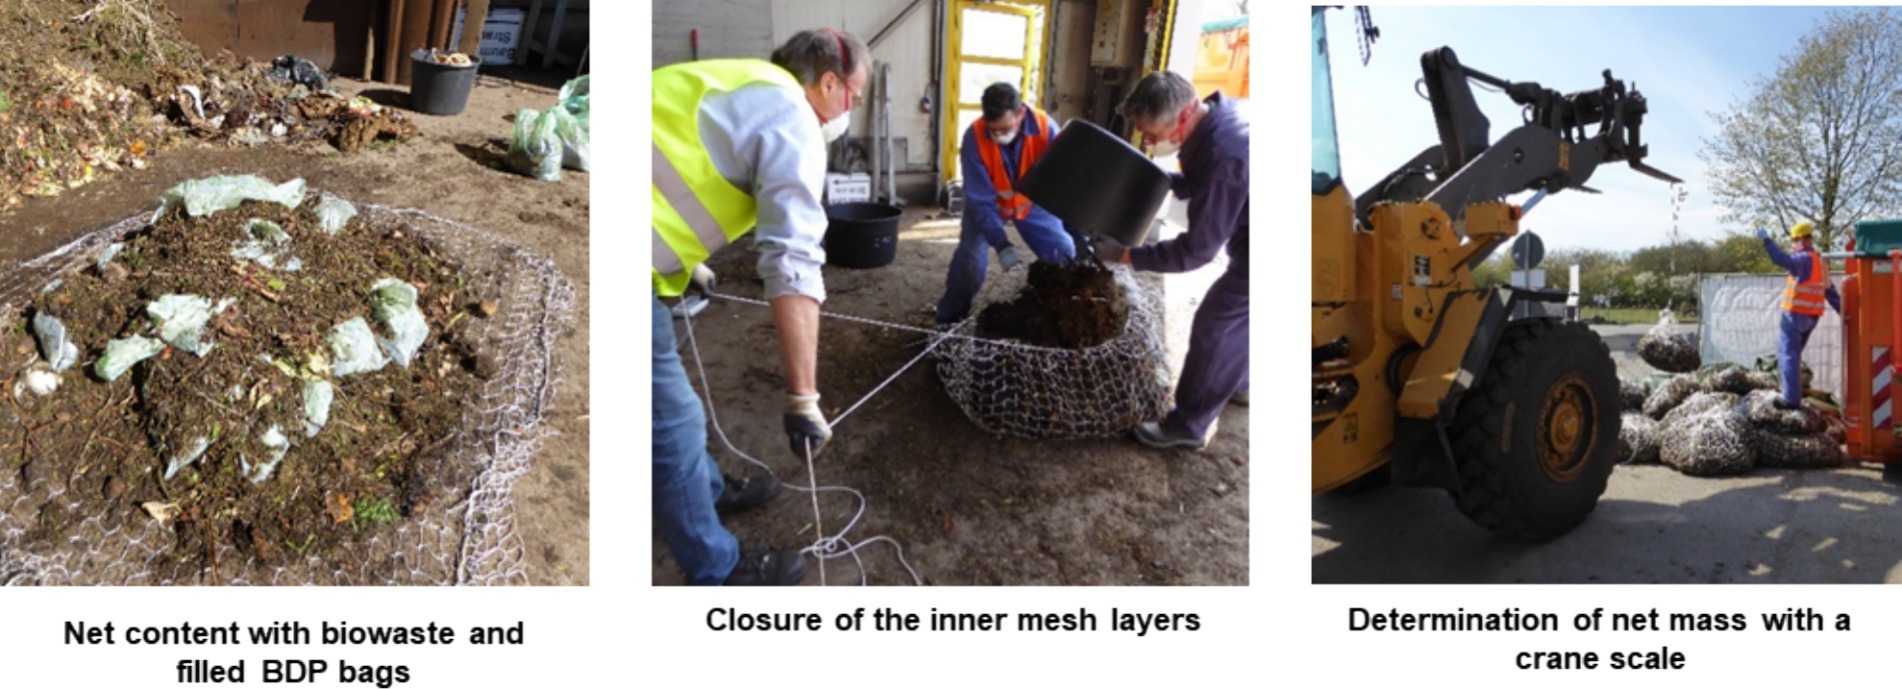
Figure 3. Preparation of nets for the composting experiment (based on Deegener et al., 2022).
A total of 8 nets were prepared for each bag type. Each net was labelled (S1-S8, G1-G8, B1-B8, R1-R8) and attached with a rope for easy identification and handling. Subsequently, the nets were weighed and stored overnight outside before placed into the composting containers (Section 2.1.3 Biowaste around the Bags inside the Nets).
2.2.3 Intensive rotting in containers
The overall composting time was 6 weeks. In the first 2 weeks, an intensive rotting process in containers took place. Impressions of the container loading and before emptying are to be found in Figure 4. The filled nets (Section 2.2.2 Filling of mesh nets) were positioned within four industrial 20 m3 containers, totalling two nets from each type (S, G, B, R) in one container. Nets were placed at the centre of each container and surrounded with the biowaste described in Section 2.1.4 Biowaste around the nets.
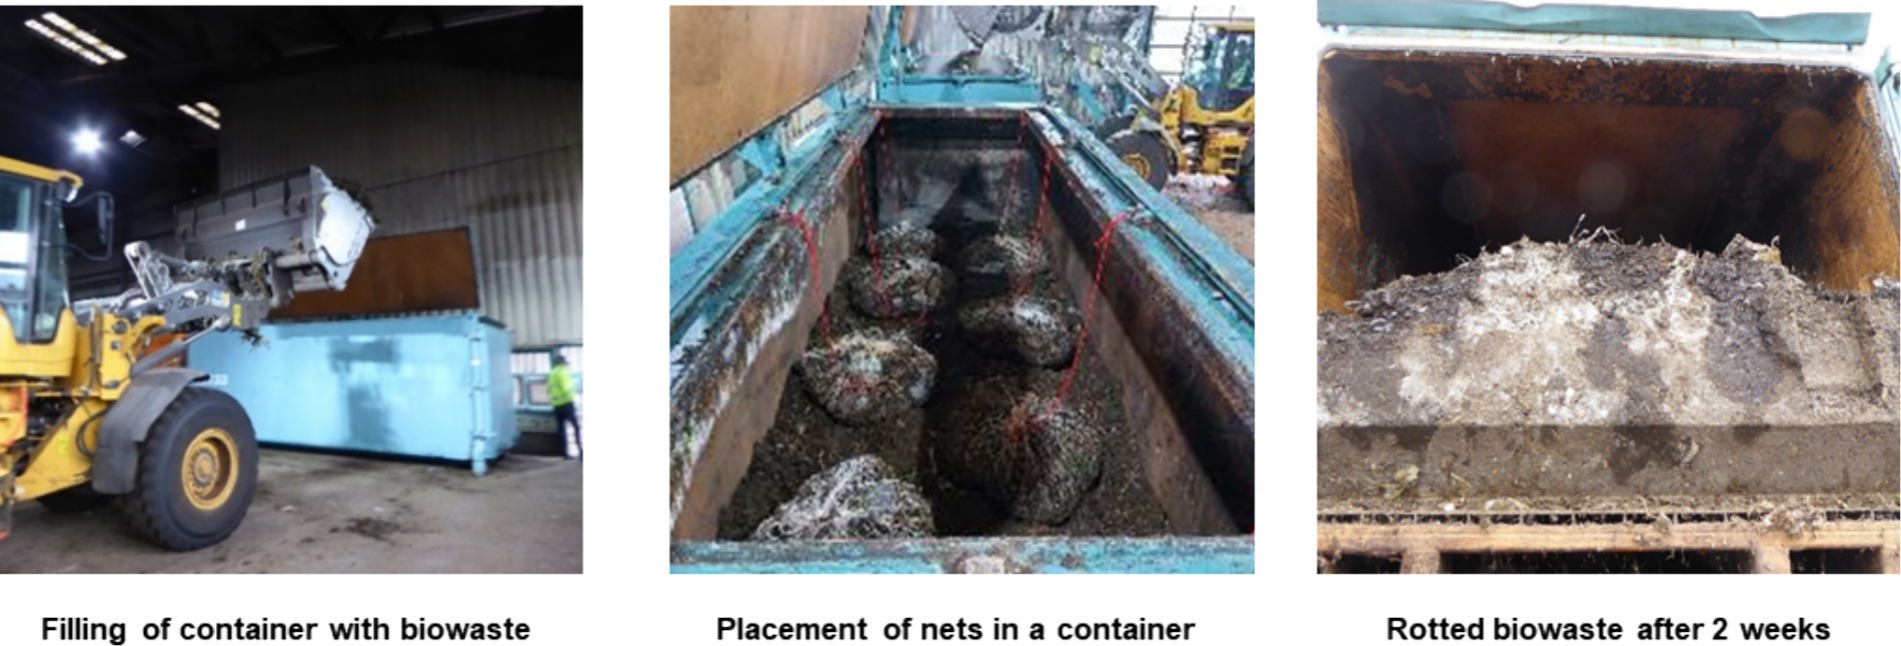
Figure 4. Images from the container filling for the intensive rotting phase (based on Deegener et al., 2022).
This supplemental biowaste was deposited into the containers using a wheeled loader. Once the containers were filled, they were sealed and weighed before being transported to the rotting site. There, the containers were connected to the aeration and temperature measurement system. The aeration rate was maintained at approximately 220 m3/h per container, representing the typical air flow in the company. More details on the company are to be found in Deegener et al. (2022). After week 2, the containers were disconnected from the aeration system and subjected to another round of weighing. The container contents were disposed of in the rotting hall and all of the nets were recovered. It was at this juncture that the first round of sampling took place with one net from each type (Section 2.2.3 Intensive rotting in containers).
2.2.4 Post rotting in a windrow
The remaining 28 nets were embedded in the rotted biowaste from the containers. They underwent a subsequent phase of naturally ventilated post-rotting within a hall. Impressions of this post-rotting phase are depicted in Figure 5. It took place for 4 weeks making the whole composting process 6 weeks. The post-rotting pile was turned after week 3, 4 and 5, each time connected with mass determination of the nets and with removal of a part of the nets for sampling (Section 2.2.3 Intensive rotting in containers). Following the completion of week 4, a defined irrigation took place on the remaining nets since dry out zones were detected. The degree of dryness of the nets was visually categorized into different levels, ranging from very dry to moist. The calculated water addition per net ranged from 6 to 44 L to adjust for optimum composting conditions. Also, the region below and above the nets was irrigated. The composting was complete in week six with the recovery of the remaining 8 nets.
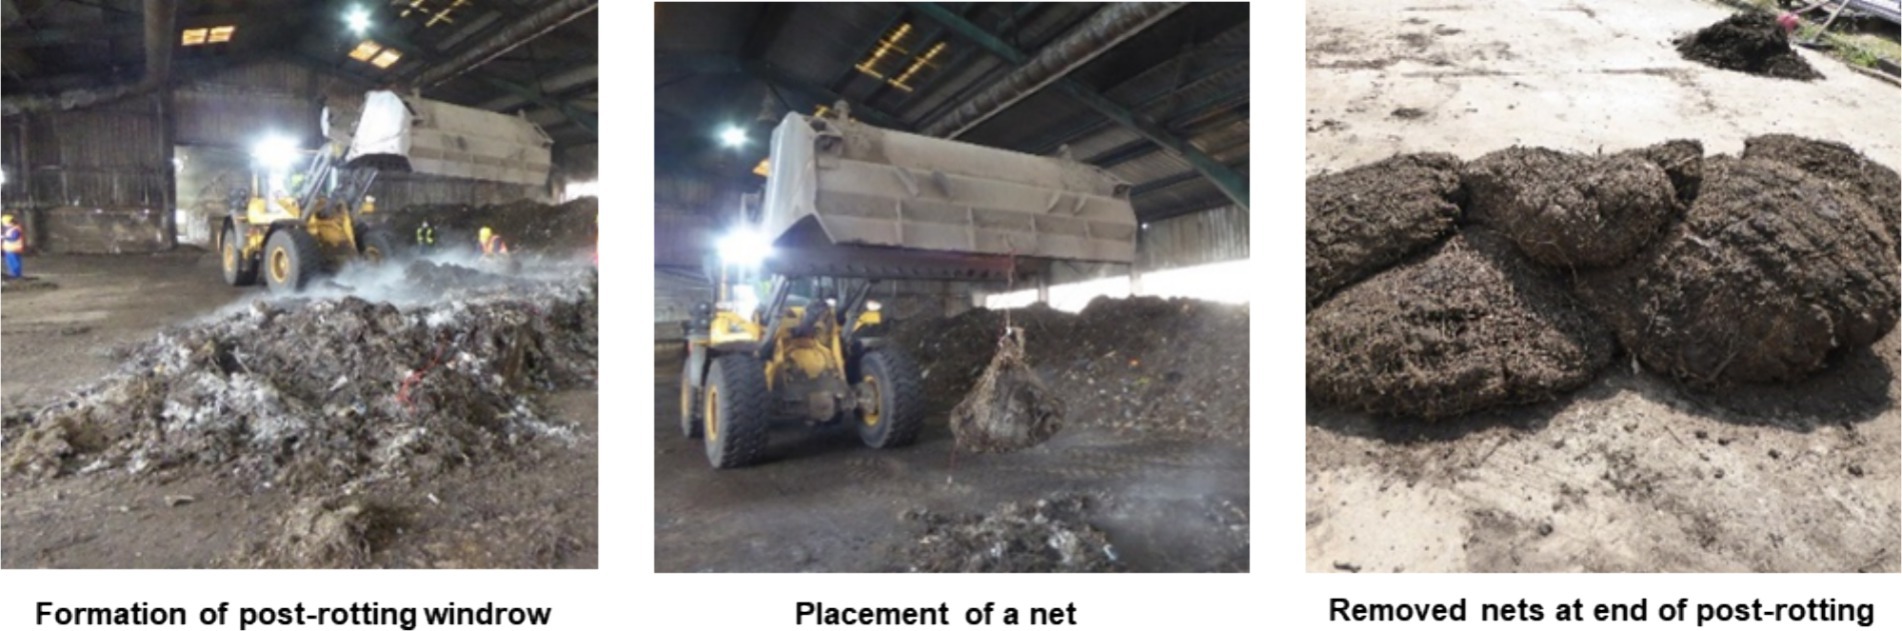
Figure 5. Images from the post-rotting phase till finalizing of the composting process (based on Deegener et al., 2022).
2.2.5 Sampling from nets
Throughout the rotting phase, five samplings were conducted, occurring in the 2nd, 3rd, 4th, 5th, and 6th weeks. In the 2nd and the 4th week one net per batch was sampled, in all others two. Impressions of the net sampling are illustrated in Figure 6. Upon opening the nets, their contents were emptied onto a tarpaulin (5 × 3 m). All clearly visible BDP fragments were collected by hand from the rotting material until no fragments were visible anymore. The gathered BDP fragments were air-dried over a week, weighed and stored for subsequent investigations.
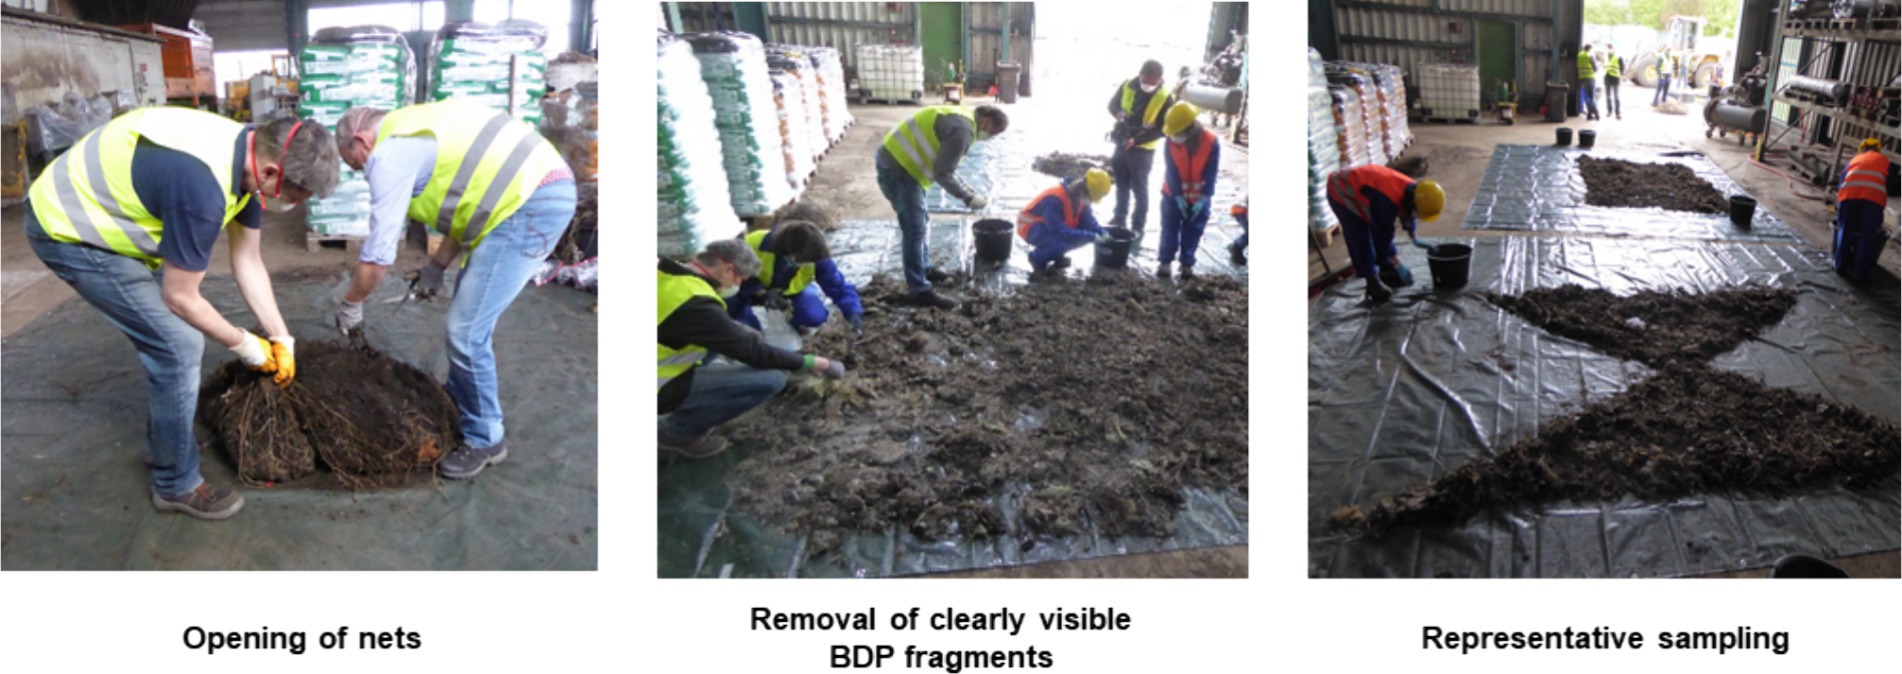
Figure 6. Preparation of samples for further analytics (partially based on Deegener et al., 2022).
The rotting material remaining after BDP fragment removal was reduced to a sample size of 10–20 L in order to achieve a representative sample for further analytics. The material was mixed using shovel and shaped into a flat square. This square was divided into four segments. Two opposite segments were selected and the other two removed (Figure 6). This process was repeated until the desired sample quantity was achieved. All samples were stored under cooled conditions for future analysis.
3 Measurement and analysis
3.1 Aeration, temperature and water content determination
The intensive rotting containers were actively aerated with 220 m3/h following the company’s standard while the post-rotting windrow was naturally ventilated.
During intensive rotting, container temperatures were continuously monitored using the company’s standard plug-in sensors. In the post-rotting period, windrow temperatures were measured weekly with laboratory sensors after net removal. After the recovery of nets from the windrow the inside temperatures were determined by a lance sensor. Additionally, surface temperatures were partially assessed with a FLIR thermal imaging camera.
The water content of the representative samples of the nets rotting materials was determined by drying a 20 g sample at 105°C following (DIN EN 15934, 2012).
3.2 Separation of BDP particles from representative samples
The BDP particle separation was carried out with the representative samples received after removing the large BDP fragments (Section 2.2.3 Intensive rotting in containers) from net contents. Sieving was conducted using a mechanical screening machine (Retsch, type AS 200 basic B). Approximately 100 g of an air dried (room temperature, 24 h) test sample was sieved for 5 min using a sieve tower including the following mesh sizes: 16, 8, 4, 2, and 1 mm. The sieving was performed as double determination. After sieving, the various sieve fractions were weighed using a laboratory balance.
BDP bag fragments were manually removed from the various sieve fractions. Approximately 5 g of each sieve fractions material was evenly spread onto a petri dish. Utilizing an illuminated magnifying glass and tweezers, BDP particles within these fractions were manually sorted, enumerated, and subsequently stored in 2 mL Eppendorf tubes for subsequent analysis.
3.3 Determination of BDP bags decomposition
3.3.1 Classification of BDP fragments and particles
The large removed BDP fragments from the nets content (Section 2.2.3 Intensive rotting in containers) and the smaller particles removed from the sieve fractions (Section 3.2 Separation of BDP particles from representative samples) were segregated into three categories based on size: macroparticles (> 8 mm), mesoparticles (2–8 mm), and microparticles (1–2 mm). The majority of macroparticles were isolated from the entire contents of the net through manual procedures as previously described (Section 2.2.3 Intensive rotting in containers). Since BDP particles from sieve fractions measuring >8 mm occurred very seldom, these fractions were not subjected for further evaluation. All macroparticles therefore are assigned to the first removal step directly from the net’s contents. The mesoparticle from 2–4 and 4–8 mm were analysed separately, but for further evaluation merged to one fraction. Furthermore, the microparticles <1 mm were removed, but not considered in this evaluation due to the large uncertainty of the results.
3.3.2 Mass determination of BDP samples
Mass determinations were determined for three types of samples, each using a specific method. Therefore each determination method has different uncertainties.
3.3.2.1 Mass determination of the original BDP bags
The mass determination of the original BDP bags involved a dual approach: Firstly, several bags were weighted individually. Secondly, the mass of bag rolls was measured, and subsequently divided by the number of bags per roll. For subsequent calculations the mean value for each bag type was employed. Twenty bags per batch were used with the initial masses documented in the Supplementary Table 1. The amount of BDP material in one net was around 0.2 kg with slight variations between the BDP bag types.
3.3.2.2 Mass determination of remaining BDP macroparticles
The determination of the mass of the BDP macroparticles removed directly from the nets content followed a multiple-step procedure. Initially, the separated particles underwent air drying for 1 week. Subsequently, manual efforts were employed to eliminate adhering dirt (Figure 6). The resultant was termed as “pre-cleaned macroparticle” and their mass was recorded. However, visual inspection indicated remaining impurities. A previously established cleaning protocol involving the use of different cleaning agents was implemented, ultimately selecting distilled water as the most suitable cleaning agent. In order to receive “cleaned marcroparticles,” the pre-cleaned macroparticle sample was placed within an aluminium tray, weighed, subjected to oven drying at 40°C for about 24 h until a constant weight was achieved. The choice of 40°C was deliberate, aimed at safeguarding the integrity of BDP by avoiding the potentially adverse impacts of higher temperatures. The macroparticles were immersed in a beaker filled with distilled water, ensuring complete submersion. Continuous stirring for 10 min (100 rpm, room temperature) was performed using a magnetic stirrer. Post-cleaning, the sample was withdrawn from the water, relocated to the aluminium foil, and placed in the oven at 40°C for drying. Subsequent to the drying process, the samples were once again weighed to ascertain the final mass of the remaining macroparticles. The method has a lower accuracy compared to the method for original BDP bag mass. On one side the particles remained light brownish, suggesting some remaining impurities leading to a slight overestimation of masse. On the other side, small particles might detach from the large particles, leading to an underestimation.
3.3.2.3 Mass determination of remaining meso- and microparticles
Their masses were approximated using the counted particle numbers (Section 3.3.4), their area sum (Section 3.3.5) and the foil density of the original BDP bags (Table 1). This is the method has the lowest accuracy. The foil density is likely overestimated due to decomposition effects. The particle counts have their limitations in the inhomogeneities of the material also with careful representative sample preparation. And the area sum is also an approximation as explained in Section 3.3.4.
3.3.3 Area number determination of remaining BDP macroparticles
In order to compare the remaining BDP macroparticles of each batch, the “area number” of air-dried and pre-cleaned was determined. The macroparticles were loosely arranged without overlap to a rectangle onto a white 1 × 1 m surface. In cases where an exceptionally large quantity of macroparticles was present, they were distributed across two of such surfaces. The area covered with particles arranged in a rectangle was calculated as illustrated in Figure 7 and designated as area number. A photograph of the resulting rectangle was captured as well.
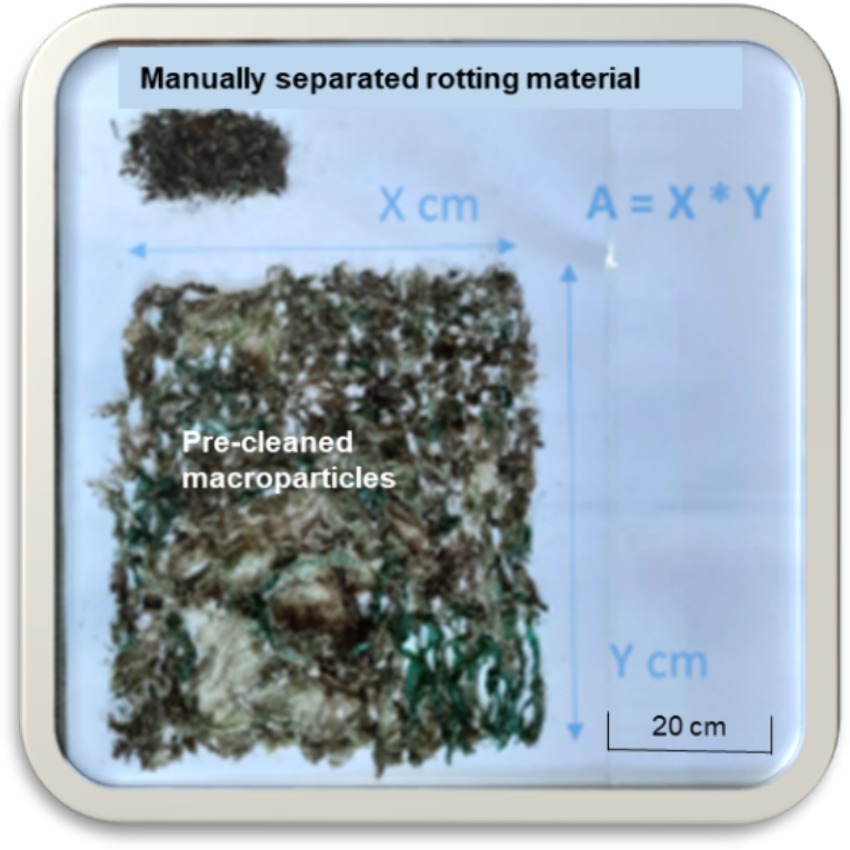
Figure 7. Area number (A) determination of pre-cleaned BDP macroparticles from one net (based on Deegener et al., 2022).
3.3.4 Particle number determination of remaining BDP meso- and microparticles
The particles counted at each sieve fraction (Section 3.2 Separation of BDP particles from representative samples) were converted into number of particles per 100 g dry matter of the rotting material. This conversion utilized the mass of the rotting materials and the particles found in each sieve fractions as well as the moisture of the initial material. The BDP particles from 2–4 mm and 2–8 mm were subsequently merged to mesoparticles of 2–8 mm. Although microparticles in the fraction <1 mm were counted, the values were not further used for evaluation. However, 1–2 mm particles were assessed and classified as microparticles.
3.3.5 Area sum determination of remaining meso- and microparticles
The common methodology for the area sum determination used in the German compost quality assurance system (BGK, 2006) considers microplastic particles >2 mm, separated in a way as described in Section 3.2 Separation of BDP particles from representative samples and using an image processing system for particle area calculation. The result is given in mm2/L compost fresh matter. To ascertain the “area sum” of BDP micro and mesoparticles in this experiment, two different procedures were implemented. Both were applied on the particles removed from the rotting material (Section 3.2 Separation of BDP particles from representative samples).
3.3.5.1 Image processing
Particle areas were determined for 2–8 mm mesoparticles with the SketchAndCalc app. The irregular areas of the particles depicted in images of samples were determined as shown in Figure 8. To ensure the acquisition of clear images, paper was positioned beneath an inverted petri dish. The samples were arranged on the dish and subsequently flattened using tweezers, with the utilization of a magnifying glass when deemed necessary. Images were then imported into the app and the individual sample outlines delineated within the app interface facilitating the computation of their respective areas based on the defined scale. To gauge the accuracy of the procedure a calibration was carried out using the calibration image from BGK (2006) and Methodenbuch Kapitel II.C3.8 (2006).
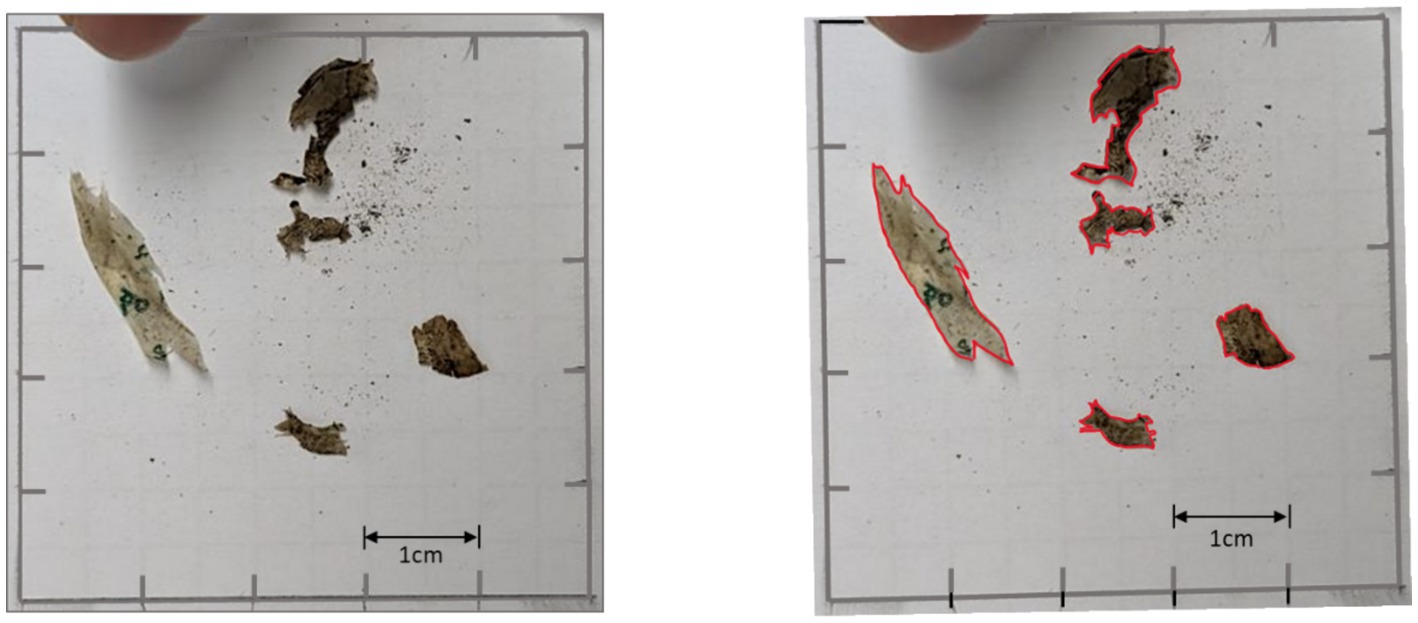
Figure 8. Image captured and processed with the SketchAndCalc app.
3.3.5.2 Approximation based on particle numbers and their sieve sizes
To allow an easier routine determination in practice, an approximation was carried out based on the particle numbers. Mesoparticles from 2 to 8 mm were approximated to possess a square shape with an average side length of 5 mm, resulting in an average area of 25 mm2 / particle. The “area sum” was then the multiplication result of the particle number and the average area per particle fraction. For microparticles from 1 to 2 mm, a side length of 1.5 mm was assumed yielding an average area of 2.25 mm2/particle.
The area sum for the particle numbers from one count was then recalculated with both methods referring to 100 g compost DM as well as to 1 L compost FM.
4 Results
4.1 Mass loss, temperature and water content
Mass loss, temperature and water content are the main parameters which describe a composting process.
4.1.1 Mass loss
Figure 9 illustrates the mass losses within the nets after intensive and post rotting. The highest mass losses were achieved during the intensive rotting phase. Nets removed after 2 weeks showed a slightly higher mass loss of their content (23–31% of the initial mass, Supplementary Table 3) compared to total container contents (16–23%, Supplementary Table 2). The average mass loss of 27% (nets) compared to 20% (container) can mainly be explained by the higher food waste content in the nets.
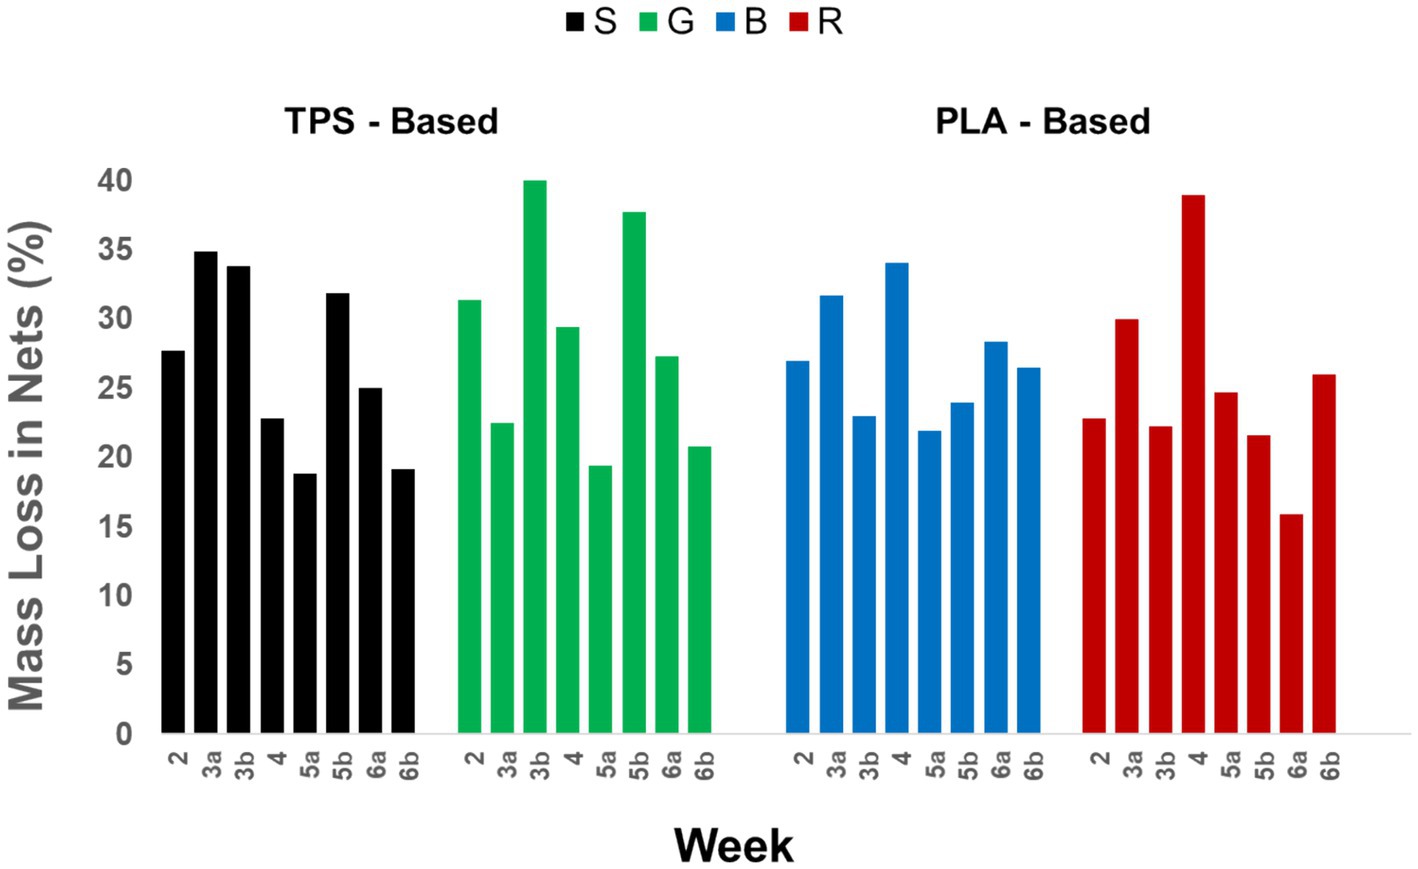
Figure 9. Mass losses within the nets during the experimental period (a/b referring to two nets from one type removed at the same time).
The mass losses of the nets in the post rotting phase ranged between 18 and 42% (Supplementary Table 3) with an average across different nets at 27%. Food waste was the primary contributor to biodegradation, followed by green waste, with negligible mass loss attributed to BDP degradation. Besides the first 2 weeks, the composting time was not the major parameter determining the mass loss. The parallel nets (a/b) clearly show, that at a specific time degradation results can be very different due to the inhomogeneity of the material and the specific degradation conditions (Figure 9).
4.1.2 Water content
The water content of the initial food waste was approximately 72% on a fresh matter (FM) basis, while biowaste exhibited a water content of around 63% FM. The water content within the bags and nets were originated from the compositions described in Section 2.1 Materials. For biowaste adjacent to the nets it was around 47% FM. In conclusion, the average water content in the nets were within a range conducive to composting with a higher water content in the bags compared to the material around.
The average water contents within the nets after their removal from the intensive or post-rotting are documented in the Supplementary Table 3. Figure 10 illustrates this water contents.
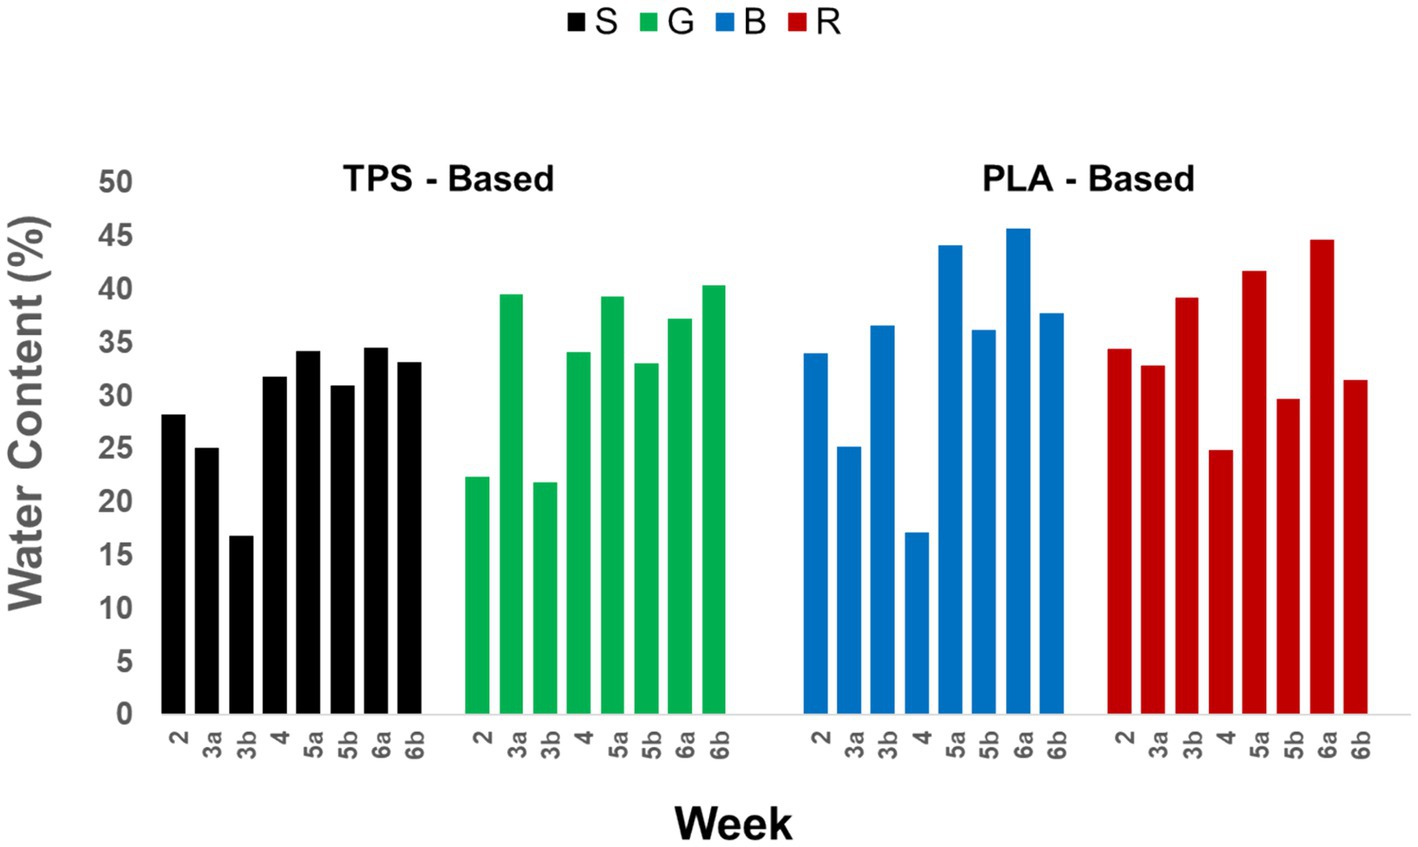
Figure 10. Average water content of the rotting material within the nets during composting. (a/b referring to two nets from one type removed at the same time; after week 4 water was added).
The significant reduction in water content observed during intensive rotting resulted from the implementation of intensive aeration (Section 2.2.3 Intensive rotting in containers) in connection with high temperatures. A water content below 25% can strongly inhibit the composting process, whereas levels below 20% can essentially halt it, as the composting microorganisms become inactive. Since in several nets such situation occurred, it was decided to moisten the net contents, so that optimum conditions for composting were established again. The subsequent increase in water content after week 4 was attributed to this deliberate water addition as outlined in Section 2.2.4 Post rotting in a windrow. At the end of composting, water content was in a suitable range for compost marketing. BGK (2023) gives guidance values in the range from 35 to 45% FM.
A comparison of Figures 9, 10 shows the relation of water content to mass loss. Specifically high mass losses were connected with low water contents and vice versa, meaning that the water release contributes significantly to the mass loss and also to the development of inhomogeneities. The water contents displayed in Figure 10 were originated from the representative samples presenting the net average. The distribution of the specific water contents in the nets was very inhomogeneous ranging partly from dry out zones to wet zones. This emphasises the occurrence of zones with different composting conditions in small areas.
4.1.3 Temperature
Details to the temperature developments within the containers are to be found in Supplementary Table 2. The temperatures within the nets after their removal from the containers or the pile are documented in the Supplementary Table 3.
During the intensive rotting phase in all containers maximum temperatures exceeded 75°C with a cooling till the container opening. However, at the end of the intensive rotting the temperatures remained above 65°. The temperature development in containers 1, 3 and 4 was quite similar, in container 2 temperatures were around 5° higher. The temperatures in the post rotting weeks 3–5 varied strongly between 22 and 70°, indicating inhomogeneity in the composting process. After week 4 the temperature increased partially in the specifically dry nets after moistening. However, generally a tendency of cooling was detected with temperatures between 42 and 56° at the end of the composting time of 6 weeks. These high temperatures show that the material was still active, but suitable rotting degrees for marketing of the compost were reached.
The inhomogeneity of the temperatures and the wide range of composting conditions in one net is shown in Figure 11. Formation of inhomogeneities initiates early due to the heterogeneous nature of the decaying material, and it progresses during composting as a result of diverse degradation processes stemming from material disparities. Additionally, varying water content levels arise due to aeration via unevenly distributed airflow, further increasing the inhomogeneities.
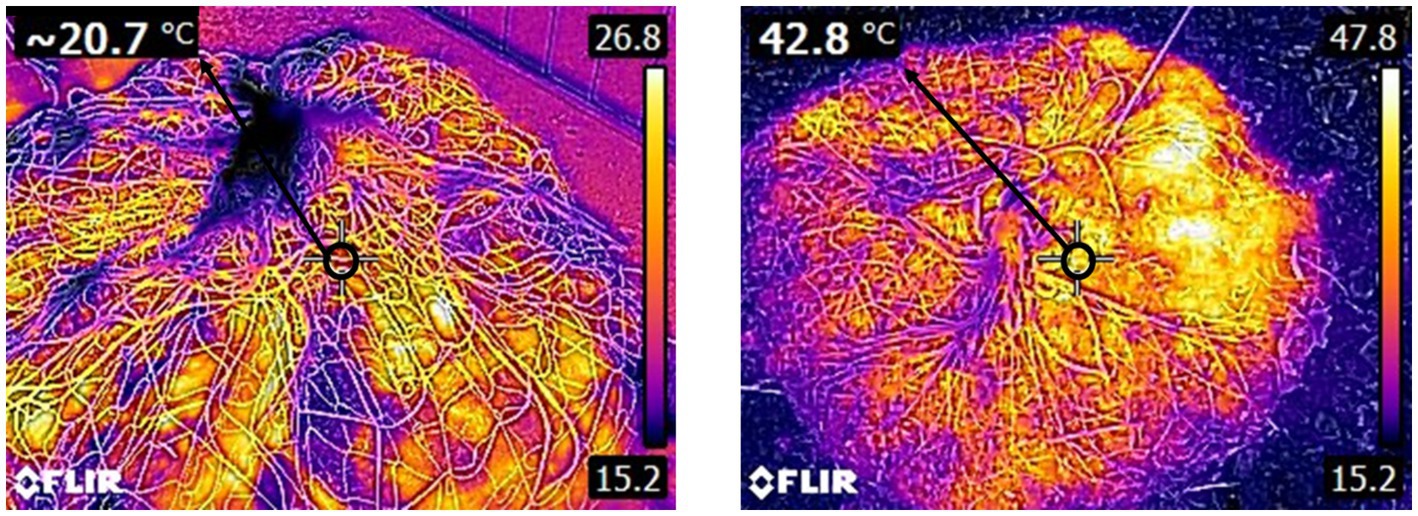
Figure 11. Examples for the surface temperature distribution in the nets before placement in a container (left) and after removal from a container (right).
4.2 Determination of BDP bag decomposition
4.2.1 Remaining BDP macroparticles
Figure 12 presents the macroparticles residual mass after washing with distilled water related to the original BDP mass and Figure 13 provides the area number as a parameter for the visual impression of the remaining BDP impurities. Supplementary Table 5 gives the respective data needed for their calculation as well as data to the dirt removal by washing with distilled water.
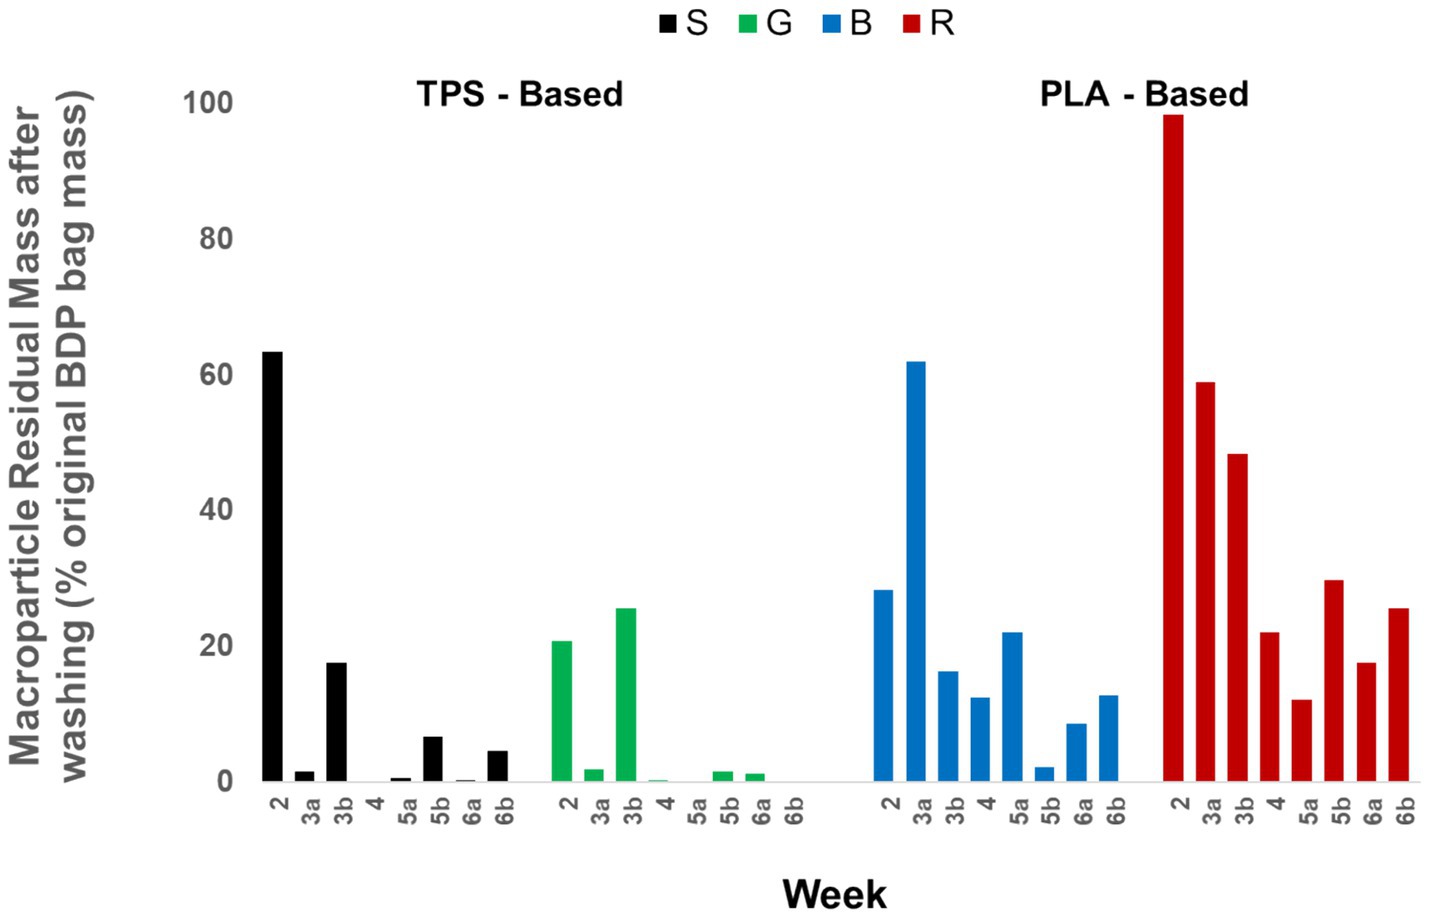
Figure 12. Mass share of cleaned macroparticles remaining after composting in relation to the original BDP bag mass per net (a/b referring to two nets from one type removed at the same time).
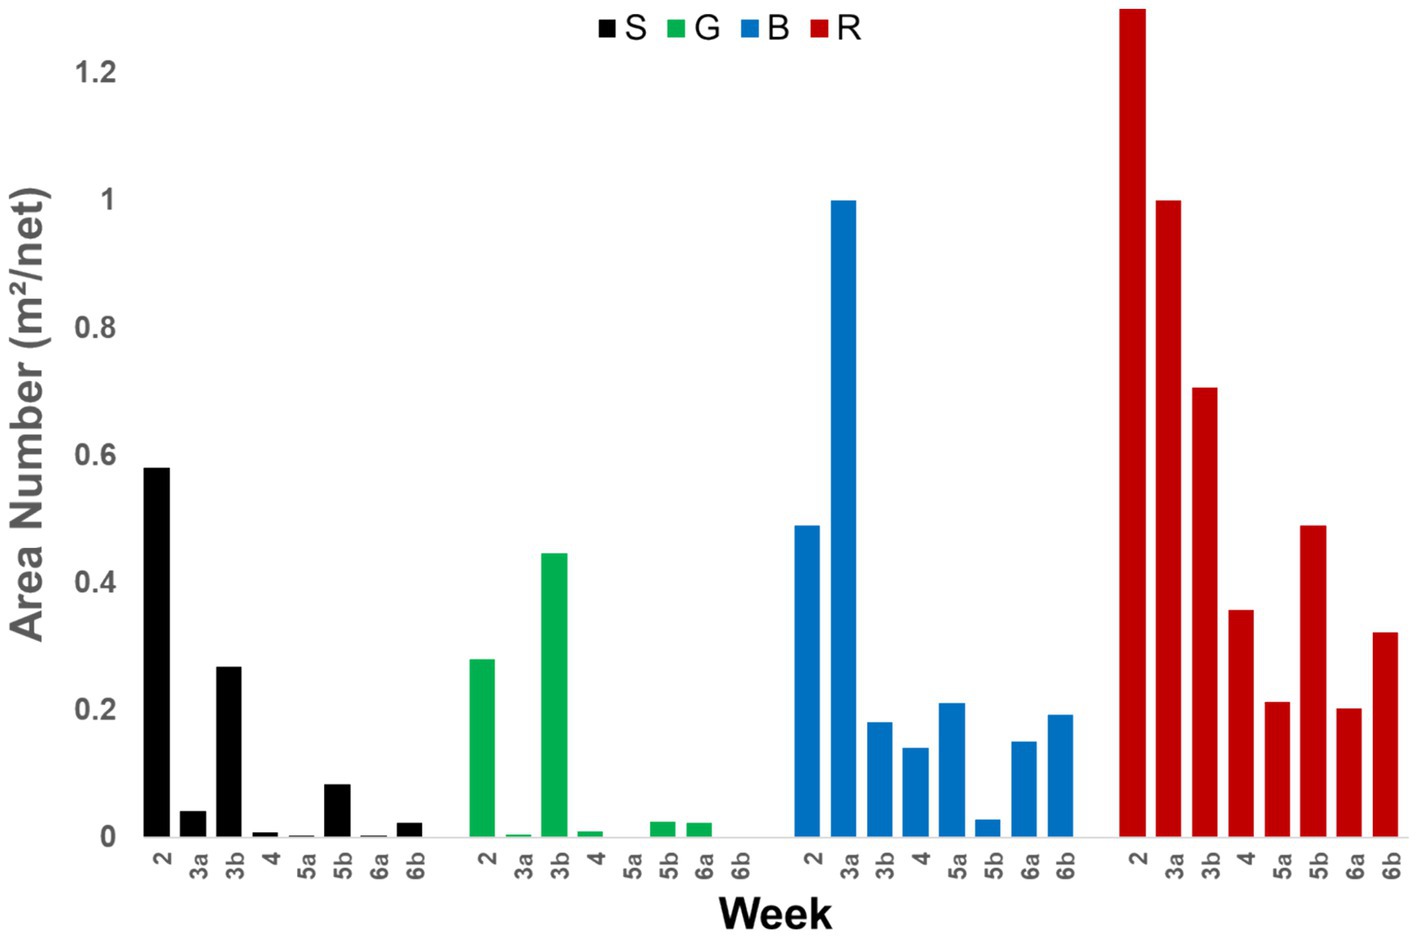
Figure 13. Area number of pre-cleaned BDP macroparticles recovered from the nets after different composting times (a/b referring to two nets from one type removed at the same time).
4.2.1.1 Impact of washing
Washing of pre-cleaned macroparticles with distilled water led to a significant mass loss indicating that a substantial amount of dirt was removed. It was highest in the samples S4, S5, G2, R2, R6 and R7, where more than 30% of the mass of the pre-cleaned was assigned to dirt removable by washing. However, the removal percentages exhibited significant variability across different nets, spanning from 3–36%.
The results show that washing of particles is necessary if decomposition of BDP bags is to be evaluated by means of comparison to the initial BDP bag mass. Therefore, the masses of the cleaned macroparticles were determined individually for each net with a separated washing procedure for each sample.
4.2.1.2 Remaining BDP macroparticle masses
Figure 12 presents the remaining macroparticle mass for the different BDP bag types in dependency of the composting time. It is notable that the TPS-blends showed a higher decomposition compared to the PLA-blends.
The best PLA-blend bag decomposition result was found in net B5a with a residue of 2% macroparticles related to the initial bag material. The best results for TPS-blend bags exhibited nets S4, G5a, and G6b with minimal remaining macroparticles (< 0.1%). However, the parallel nets show larger remains.
In conclusion, a complete decomposition was not achieved for either bag type. For TPS-blend bags a decomposition with only minimal visual residues seems in principle possible, but it requires stringent, homogeneous conditions, which may be challenging to replicate at practical scales without substantial effort.
4.2.1.3 Remaining BDP macroparticle area numbers
The macroparticle residues have a strong impact on the visual impression of a compost. The area number (Section 3.3.3 Area number determination of remaining BDP macroparticles) of the manually removed BDP macroparticles was therefore determined for each net. The photographic documentation for each net depicting the top view of the macroparticles areas, which are resulting in the area numbers per net is available in Supplementary Figure 2 and for the TPS-blend bags and Supplementary Figure 3 for the PLA-blend bags. This documentation includes also information about the composting time, as well as the average water content and the temperatures in the nets rotting material. The temporal evolution of the macroparticles area numbers is illustrated in Figure 13.
Comparing Figure 12 with the mass-related determination and Figure 13 with the area-related determination, the same trend is obvious. Considering the large efforts needed for washing, the area number has advantages in the simplicity of the method. It is suitable for an optical evaluation and comparison of composts. However, if data for the decomposition rates or particle mass residues are needed, the mass determination is the better method.
4.2.2 Remaining BDP meso- and microparticles
Figure 14 presents the numbers of meso-and microparticles related to compost DM. Supplementary Table 6 gives the respective data and additionally the data related to compost FM. Data for the area sum of mesoparticles (2–8 mm) in one net determined with the image processing method and the approximation method are compared in Supplementary Table 4. In Figure 15 the area sums of micro- and mesoparticles related to the compost volume determined by the approximation method are visualized with the respective data shown in Supplementary Table 6. Particle mass data can be found in Supplementary Table 5 and are visualized in Figure 16.
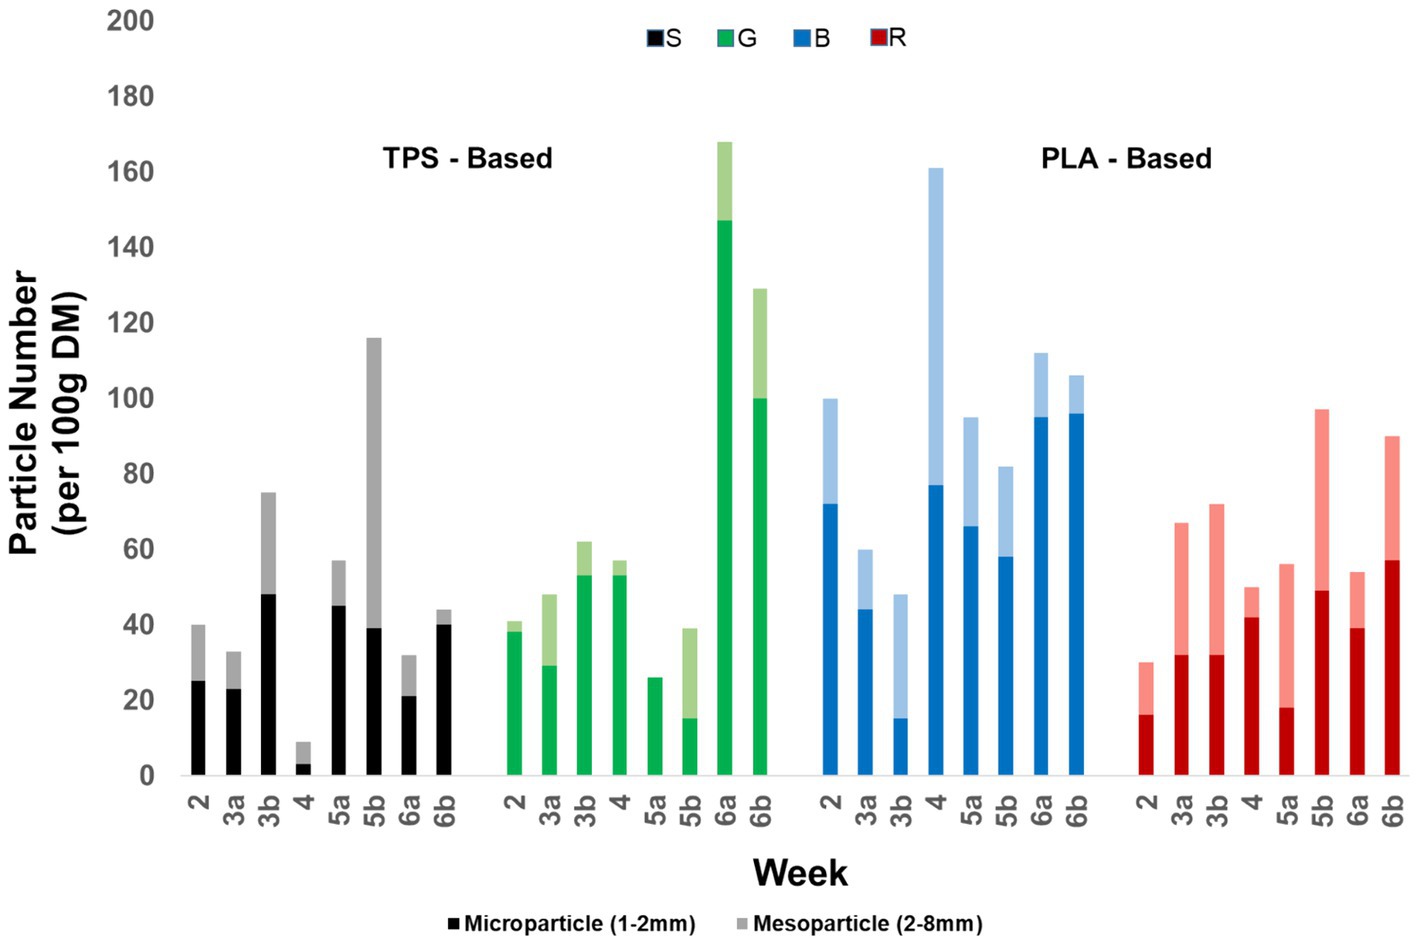
Figure 14. Number of meso-and microparticles in the rotting material (a/b referring to two nets from one type removed at the same time).
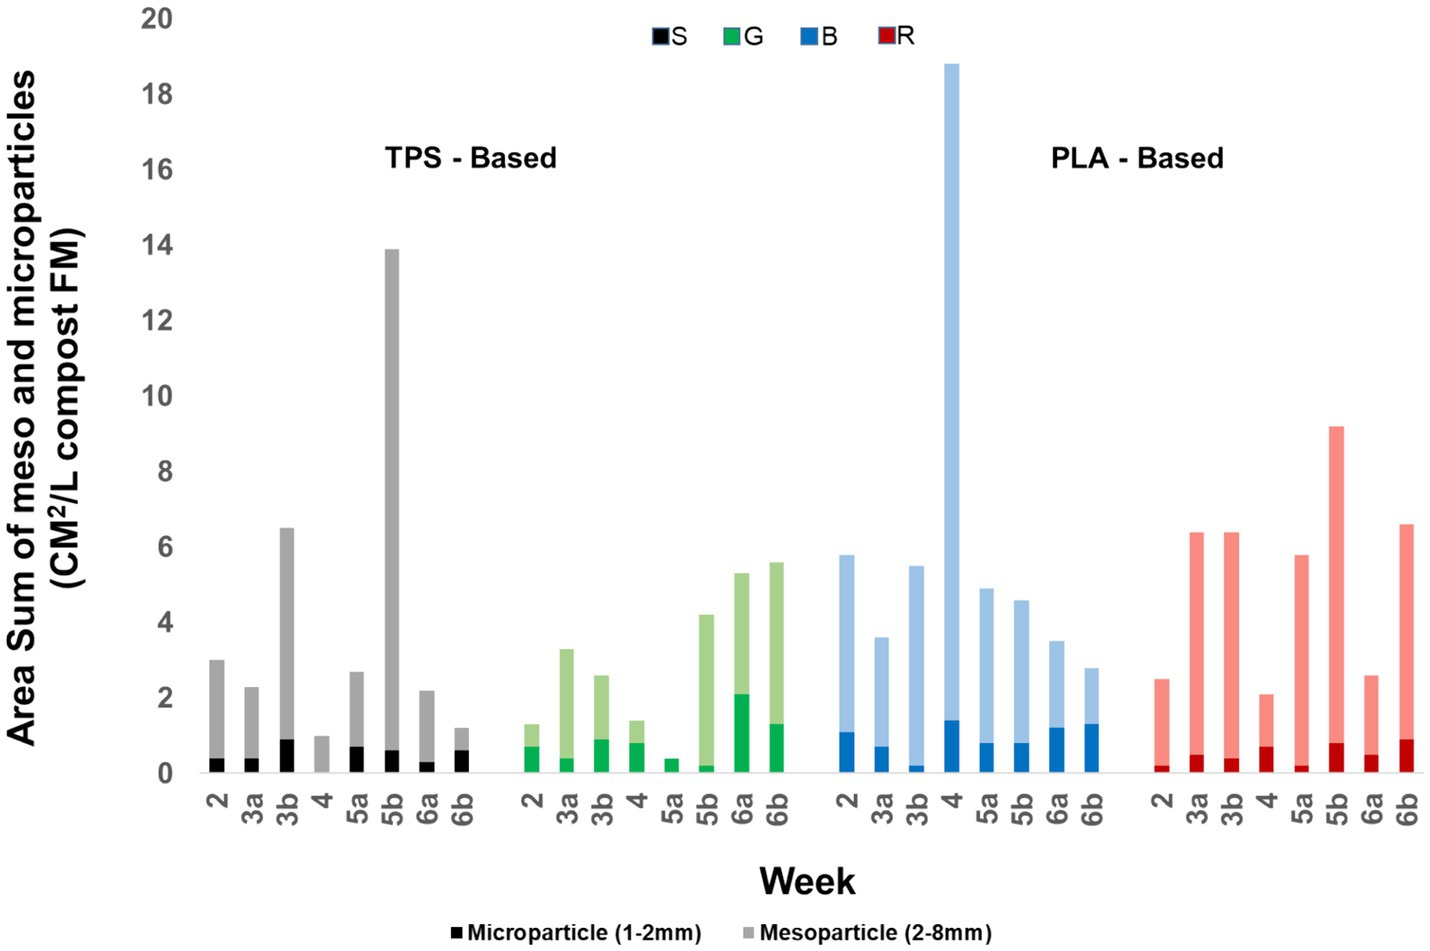
Figure 15. Area sum of meso-and microparticles in the rotting material (a/b referring to two nets from one type removed at the same time).
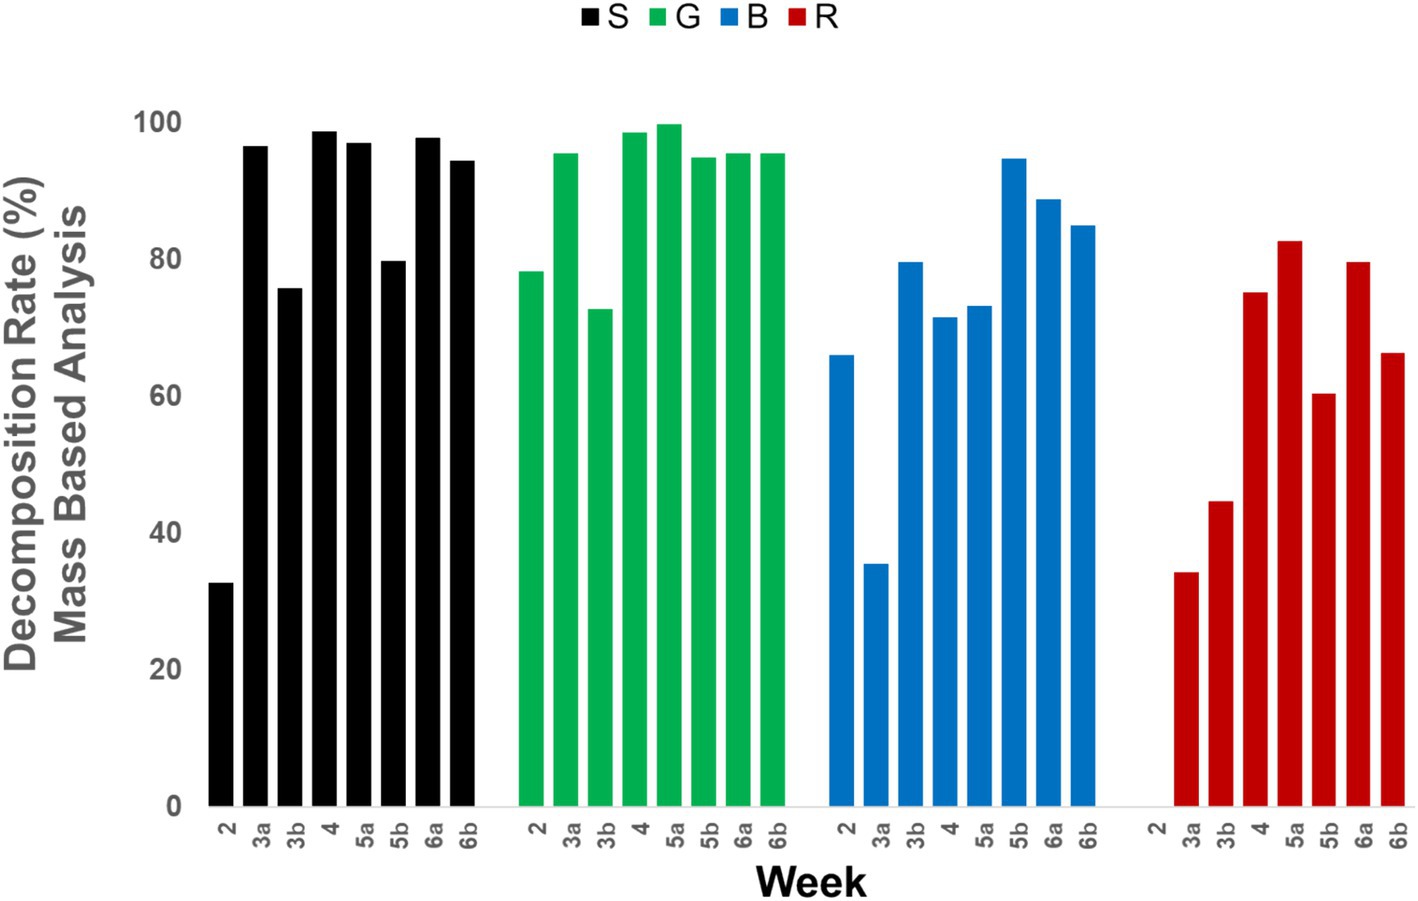
Figure 16. Mass based decomposition level of BDP bags considering macro-. Meso-and microparticles (a/b referring to two nets from one type removed at the same time).
4.2.2.1 Particle numbers
The numbers of the meso-and microparticles depicted in Figure 14 show that both types were present in all nets. At week 6, the number of microparticles significantly exceeded the number of mesoparticles. Also particles <1 mm were counted in Deegener et al. (2022). However, they are not displayed here since the uncertainty in the counts is high due to their small size. However, the trend towards an increase in number with a decrease in particle size was also observed there.
The microparticle number (1–2 mm) per 100 g of composting material typically varied between 100 and 400 for PLA blends and between 50 and 300 for TPS blends, with occasional deviations. The mesoparticle number was commonly smaller with a few exceptions (S5b, G5b, B4, R3a/b, and R5a/b). An accumulation of the number of mesoparticles occurred in the R series, which can presumably be attributed to the drawstrings in the bags.
Over time, an observable trend emerges wherein mesoparticles exhibit a decline while microparticles display an increase, indicating the fragmentation of mesoparticles. Notably, there existed significant individual variability within this comparison. The mesoparticle contribute also to the optical impression of a compost, but not the microparticles. However, the microparticles cannot be neglected. Due to their small size, they could easily be ingested by organisms with impacts on organisms and ecosystems. Re-determinations of numbers from the stored particles lead partly to slightly different results concluding that during storage and by handling larger particles might break down and rather small particles might easily get lost.
4.2.2.2 Area sums
The area sums of mesoparticles determined with the image processing method and with the approximation method are compared in Supplementary Table 4. The results show, that although there is a deviation between the two methods, the scales match. Therefore, the approximation method based on the sieve fractions and a square particle with side lengths of the average from the upper and the lower sieve seems to be suitable for the comparison of the remaining small BDP particles with the advantage of easy determination. The area sums related to compost volume were therefore calculated for the mesoparticles as well as for the microparticles as shown in Figure 15.
The results show that mesoparticles are the main contributor to the area sum. On average across all batches, the area numbers of mesoparticles were approximately fivefold greater than those of microparticles. However, the area sum provided by microparticles is also significant and cannot be neglected. The limitation values for microplastic >2 mm provided from BGK (2023) are 15 cm2/L for fresh and matured composts and 10 cm2/L for substrate composts. Considering the data from Figure 15, particles from BDP bags might be a significant contributor beside conventional plastic particles.
4.2.2.3 Particle masses
Since a washing procedure for meso-and microparticles would be error-prone and a considerable labor is involved, the masses were also approximated using the procedure described in Section 3.3.2 Mass determination of BDP sample. It is based on the particle area and the foil density of the original bags as shown in Table 1. However, the foil density serves as an estimate and may be slightly lower for degraded BDP bags due to a loss of compounds. Consequently, the mass values for micro- and mesoparticles are likely somewhat overestimated. The calculation results are shown in Supplementary Table 5 and further evaluated in Figure 17. In tendency the mesoparticle masses were larger than the microparticles masses with a few exceptions.
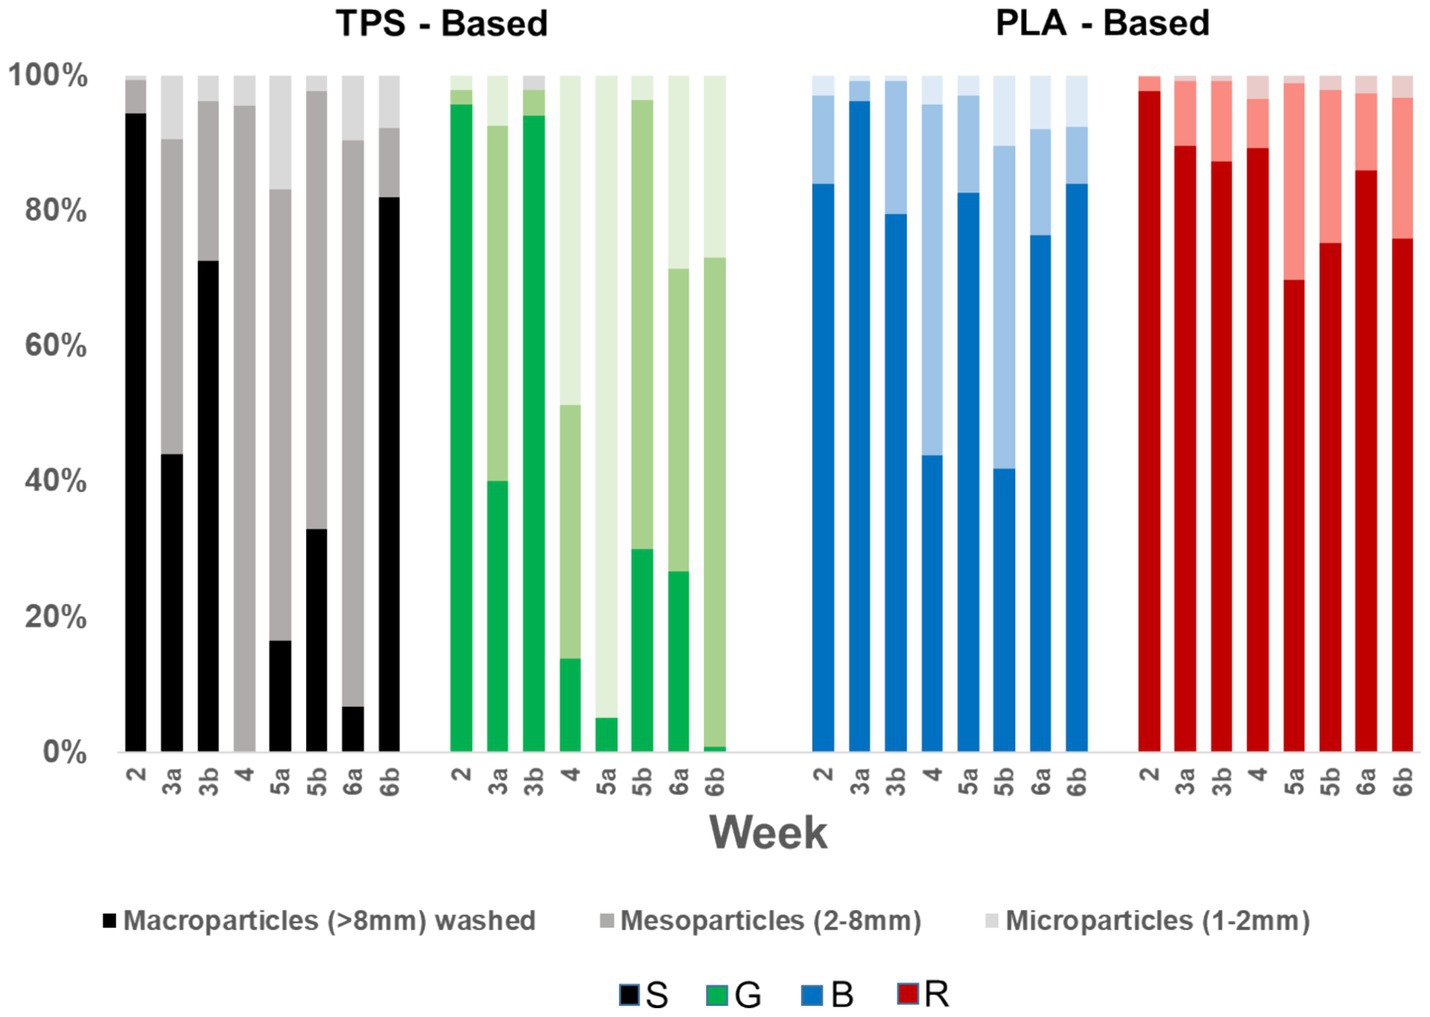
Figure 17. Distribution of residual BDP bag mass across marco-, meso-and microparticles (a/b referring to two nets from one type removed at the same time).
4.3 Decomposition levels of BDP bags
Decomposition levels of BDP bags during composting under industrial conditions were assessed by considering BDP bag’s residual masses. The cumulative residual fractions of micro-, meso-, and macroparticles, relative to the original BDP bags, were calculated from the masses described in Section 4.2.1 Remaining BDP macroparticles for macro- and in Section 4.2.2 Remaining BDP meso- and microparticles for meso-and microparticles. The decomposition levels were determined by quantifying the mass difference from 100%. The decomposition level determined based on mass analysis is illustrated in Figure 16. The distribution of residual mass across cleaned macroparticles as well as based on area determined meso-and microparticles is depicted in Figure 17 as a percentual distribution. Detailed results are provided in Supplementary Table 5.
The highest levels of degradation reached were observed in samples S4, G4, and G5b, with approximately 99% degradation. A few further batches reached degradation levels above 95%. However, they all could be assigned to TPS-blend bags. None of the PLA-blend bags reached such high levels. The most favorable outcomes were achieved by sample B5b, with nearly 95% degradation. There was also a clear difference between the B- and the R-series with a lower decomposition level in the R-series due to the drawstring which seemed problematic to degrade due to their higher foil thickness. In terms of composting time, the first 3 weeks had the most significant impact on decomposition for TPS-blend bags. However, with PLA-blend bags, an increase in decomposition level was observed for a longer duration, as depicted in Figure 17.
During decomposition rate calculations, microparticles (1–2 mm) were observed to be relatively minor compared to meso-and macroparticles. However, in the context of mass-based BDP decomposition analysis, they are not insignificant. Often macroparticles contributed strongest to the residual BDP bag mass, but with a lower trend with increasing composting time. All particle types are to be considered as relevant. They should be considered together in evaluation, since larger particles can easily be converted in to smaller ones by mechanical movements. In industrial composting this often is the case for instance during turnings, transports and sieving procedures.
5 Discussion
5.1 Evolution of temperature and water content during composting
Composting time, water content, and temperature are paramount factors influencing decomposition of compostable materials. During the experiments composting period, the evolution of temperatures and water contents followed typical patterns observed in the composting of biowaste, albeit with some expected variations and inhomogeneities.
In all containers, the recorded temperatures consistently surpassed the threshold of 75°C, indicative of robust microbial activity and effective decomposition processes. Towards the end of intensive rotting phase, temperatures remained elevated, exceeding 65°C. This sustained thermal profile not only met the hygiene standards outlined by the BioAbfVO (2022) regarding material sanitization but also underscored the vigorous degradation activity within the containers. However, the rotting material degradation was still ongoing.
Maintaining appropriate water content throughout composting is crucial for effective decomposition, as indicated by guidelines set forth by BGK (2017, 2018). Initially, the water content of the incorporated rotting material fell within the recommended range of 50–65%, aligning with optimal conditions for composting. Instances of drying out connected with interruption of microbial degradation in general occurred in certain nets, where the average water contents dropped to approximately 20%, accompanied by lower temperature levels. This drying phenomenon can be attributed primarily to the intense aeration during the active decomposition phase. Additionally, water transfer occurred due to the higher water contents within the nets compared to the surrounding material. To address suboptimal water content levels, a targeted humidification process was implemented during the post-rotting phase. While this intervention positively influenced activity within the composting material, it did not result in significant changes in BDP decomposition rates. This lack of pronounced improvement in decomposition rates post-humidification suggests a potential disruption of the established BDP-relevant microbial biocenosis, likely induced by abrupt cooling coupled with heightened humidity levels.
Nets with lower average water content in the rotted material (Figure 10) tended to exhibit more remaining BDP particles, i.e., a lower decomposition level (Figure 16). This is obvious when comparing the parallel nets (a/b) from one type and time, where nets with lower water content resulted mostly in a lower total decomposition level. The only exceptions are G6a/b and B5a/b. Only a few nets (S3a/b, G3b, B3a, B4, and R4) has exceptionally low water contents ≤25%. Nonetheless, noteworthy instances of effective decomposition were also observed in some of these nets. The potential impact of water contents exceeding 40% remains uncertain, as investigations did not conclusively address this aspect.
These observations underscore the intricate relationship between water content, temperature, and microbial activity in determining the decomposition kinetics of BDP within composting environments. To receive DIN EN 13432 (2000) certification of biodegradability the BDP materials are tested under homogeneous and well-defined conditions. Commonly it worked with a temperature of 58%, without dry out zones and undisrupted microbial consortia. With such adjusted optimal ranges for BDP decomposition an advanced BDP decomposition under homogeneous conditions can be reached, as the multitude of certified BDP products prove. Under realistic industrial conditions the initial inhomogeneity of the material and during the process the development of multiple zones with different temperatures and water contents has to be kept in mind. Further investigations are warranted to elucidate the degree of acceptable inhomogeneity, the ranges of water contents in connection with the temperature profiles and the impacts of disruptions of microbial communities. Such insights are vital for refining composting protocols aimed at mitigating environmental impacts associated with plastic pollution.
5.2 Decomposition of BDP bags—particle numbers and sizes analysis
For compost quality, plastic particles from the meso-and microparticle size are relevant, since in the industrial composting practice, macroparticles often would be removed, e.g., by sieving, before the compost is marketed. However in the case of BDP macroparticles such mechanical procedures may result in their mechanical breakdown leading to an increase in meso-and microparticle numbers. This has to be kept in mind, when evaluating the meso-and microparticle numbers in this study.
The sieving process conducted on representative samples aimed to elucidate the presence of BDP meso-and microparticles within the composting material. Upon completion of sieving, it was observed that the number of BDP mesoparticles was relatively low compared to microparticles. In the study, the decision to exclude the analyses of the very small microiparticles (<1 mm), although present in large number (Deegener et al., 2022), was justified based on the inherent uncertainties on the type of removed particles and the potential to overlook some. However, their presence as a result of decomposition is not considered to be irrelevant, but has to be studied with more advanced methods.
Figure 14 provides insights into the relationship between composting duration and particle size number and distribution considering mesoparticles (2–8 mmm) and microparticles (1–2 mm). These findings corroborate the notion that ongoing decomposition processes result in a reduction in the size of remaining BDP particles and an increase in number. However, the S-series shows that at a certain point the particle number will start to decrease due to advanced biodegradation. This reversal point was in the S-series between week 5 and 6. In the other three series (G, B, R) it was not reached within the 6-week study period. From Figure 16 it can be estimated, that macroparticle handling can have a large impact on the meso-and microparticles in composts in practice.
When evaluating plastic particle numbers in composts, the sample homogeneity and representative sampling is crucial for ensuring the reliability and reproducibility. However, even when done with care as in this experiment, multiple determinations in one representative sample often varied by more than 100% (Deegener et al., 2022). Larger sample sizes would be helpful, however are connected with a huge additional work and effort. Evaluating composts plastics impurities by particle numbers is the most common method in research as an evaluation of Porterfield et al. (2023) showed.
5.3 Decomposition of BDP bags—area based analysis
The evaluation of decomposition through area-based analysis involved all particle fractions with exception of the very small microparticles (<1 mm), albeit employing diverse methodologies. The parameter “area sum,” as defined by BGK (2006) (Section II.3) is already in practical use in Germany for particles >2 mm and serves to quantify impurities in compost, expressed as cm2/L of compost. In this study, it was also used and simplified to quantify the area sum of BDP meso- (2–8 mm) and microparticles (1–2 mm; Figure 15). Additionally, the macroparticle top view area (Figure 13) was determined with a different procedure and termed as area number.
The determination of macroparticle area numbers (Supplementary Figure 1; Figure 2) faces challenges in direct comparison with the initial bag areas due to dimensional variations. The initial bags were evaluated for two-dimensional (2-D) single-layer areas, whereas macroparticle samples from composting often exhibited multilayer agglomerates, including knots, drawstrings, and three-dimensional (3-D) wrinkling. Discrepancies arise from overlaps, voids, and missed fragments during manual readouts, leading to an underestimation of the actual macroparticle area. Consequently, the area number is not comparable with the initial bag area, and also not with the meso-and macroparticle area. However, determination is simple and quick and gives a good method to compare decomposition of BDP bags. The results show similar trends as the mass-based analysis of macroparticles. But to avoid misinterpretations of the decomposition, the smaller particle fractions have to be considered as well. For example, G6b showed no macroparticles, but the mass-based BDP-decomposition level was 95.5%.
The residual area of mesoparticles were determined via image processing, utilizing the SketchAndCalc app. A calibration provided an accuracy of the particle area measurement of 96%. This inexpensive and user-friendly app facilitates irregular area calculations based on the photographic images taken from the counted particles (Section 5.2 Decomposition of BDP bags–particle numbers and sizes analysis). This method was compared to a calculative approximation based on the particle numbers. The particle shapes were assumed to be square or a circle with side length or diameter as average of the sieve sizes used. The squares gave a better fit than the circles to the areas determined by image processing. The approximation method struggles to accurately determine BDP areas due to the irregular shape of the particles. However, the uncertainty in particle number counting is larger than the one due to the simplification of the particle morphology and size.
Thus, in this study, the approximation method was used to determine the area sum for the mesoparticles (2–8 mm) as well as for the microparticles (1–2 mm). This method offers an easy and robust comparison of different BDP batches. The area occupied by mesoparticles was clearly larger than that of microparticles (Figure 15). Cumulating all particles to one value makes a comparison of batches easy. Considering mesoparticles area sum as suggested by BGK (2006) is enough to characterize a product by the visual impression. However, considering the microparticles additionally is completing the picture and useful for the comprehensive mass-based analysis.
5.4 Decomposition of BDP bags—mass based analysis
The determination of the degree of decomposition of BDP bags requires analyzing both the masses before and after composting. In mass-based analysis, one focus lies on weighing the macroparticles. However, dust adhering to the particles during composting pose a significant challenge as they contribute to the mass of BDP residues. To mitigate this, a washing step is to be conducted to obtain more accurate measurements. It’s worth noting that washing was performed solely for the macroparticles, as the small size of meso-and microparticles rendered washing impractical. For such particles masses were calculated based on particle areas and foil densities. Since the mass determination of BDP bags before composting can be considered as quite accurate, the other methods have certain uncertainties.
During the macroparticle washing process, observations revealed challenges with stirring connected with particle disruption and particles adhering to surfaces. These issues underscore the importance of careful adjustments of the washing process to mitigate their influence on experimental accuracy. However, despite all care, the washed particles still had some brownish color. The procedure is laborious, time consuming and necessary for each batch individually, since the dust attachments can largely vary.
Direct mass determination of meso-and microparticles was omitted due to the impurity problems, low particle counts per sample, and the small size of the particles. Instead, higher accuracy was achieved by determining particle numbers, approximating their sizes and calculating their residual masses using the densities and thicknesses of the original bags. However, it’s important to note that the densities of original bags and real residual particles may not be identical. Therefore, the mass fractions of micro- and mesoparticles remaining after mesh removal represent maximum values, as composting likely reduces particle density and thus residual mass.
However, the described determination procedure is considered suitable to evaluate the decomposition level of BDP bags. The relevance of all three particle types is evident in Figure 16, highlighting the comprehensive description of BDP decomposition without neglecting specific BDP shares. Their distribution could be quite manifold. Microparticles <1 mm were neglected, since their estimated proportion was considered insignificant when compared to the methodological uncertainties and would contribute a maximum of 1%. However, with mass-based determination, there is a lack of information on compounds that may have dissolved from the BDP bags. More advanced methods would be necessary for such evaluations.
6 Conclusion
The study highlights the complex challenges, issues, and potential solutions regarding microplastics in composts, emphasizing the importance of assessing the decomposition of BDP bags. Compliance with regulatory standards such as DIN EN 13432 (2000), DINplus (2020), DüMV (2021), and BioAbfVO (2022) is crucial, with criteria defining complete decomposition within specified timeframes. However, the methods employed currently have some weaknesses and can mislead to the assumption of fully degradability of BDP materials under industrial conditions. This is partly due to certifications being conducted under laboratory conditions and partly because very small particle sizes are excluded from consideration.
The research assess the decomposition of BDP bags following a composting period of 6 weeks. Within this timeframe, certain batches of TPS blend bags (S, G) exhibited nearly complete decomposition, whereas PLA blend bags (R, S) did not decompose as extensively. Additionally, it was observed that the heterogeneous nature of the rotting material resulted in varying degrees of decomposition across different zones, some areas achieved thorough decomposition, while others did not.
Notably, the actual composting duration in large-scale composting facilities also often falls below the required 6 weeks, with some plants marketing compost after only 2 weeks. It’s important to note that the study specifically pertains to four types of BDP bags and the conditions at the Neumünster composting plant, thus, extrapolating conclusions to other facilities may not be definitive.
When assessing the decomposition of bags, factors such as BDP type, water content of the rotting material, and temperatures and composting phases played significant roles. Decomposition was most vigorous during the initial 3 weeks, correlating with the highest BDP decomposition. Over the subsequent 3 weeks, BDP decomposition persisted, albeit to a lesser extent. The study solely focused on BDP particles, excluding other types of foreign matter, although occasional inclusion of conventional plastic particles cannot be entirely dismissed. This determination is based on the manual removal of conventional plastic films prior to composting and the optical distinctiveness of BDP particles.
The proportion of BDP bags present in biowaste affects the levels of BDP residues in compost. This proportion depends on citizen usage frequency and the ratio of kitchen waste to green waste processed in facilities. Therefore, the BDP residue values provided in the study should be viewed as indicative rather than absolute. Enhancing the precision of such assessments is feasible through further studies on particle contamination, particle residue densities, and assumptions regarding particle diameters. Nevertheless, the current level of accuracy effectively highlights trends.
In accordance with standards, the focus of many studies is on BDP plastics >2 mm. However, this study proved that 1–2 mm BDP particles might likely be present in composts as well. Although the impacts of microplastics in soils remain incompletely understood (Bertling et al., 2021), evidence suggests they impact soil chemistry, biology, and physics, with concerns about very small particles entering organisms’ cells. However, analyzing particles <1 mm remain an analytical challenge.
The research findings underscore that BDP bags, from production to disposal, contribute to resource consumption and waste generation rather than waste reduction. Achieving 100% degradability of such bags poses practical limitations, and knowledge gaps regarding the behavior of particles in soil represent significant challenges. Given these considerations, the viability of employing BDP bags for biowaste collection warrants scrutiny. In this context, adopting a bagless approach for biowaste collection emerges as the most prudent strategy.
Data availability statement
The original contributions presented in the study are included in the article/Supplementary material, further inquiries can be directed to the corresponding author.
Author contributions
AS: Conceptualization, Data curation, Investigation, Methodology, Validation, Visualization, Writing – original draft, Writing – review & editing. SD: Data curation, Funding acquisition, Investigation, Methodology, Resources, Validation, Visualization, Writing – review & editing. IK: Conceptualization, Formal analysis, Funding acquisition, Project administration, Resources, Supervision, Validation, Writing – review & editing.
Funding
The author(s) declare that financial support was received for the research, authorship, and/or publication of this article. Composting and basic evaluations were financially supported by Verbund für kompostierbare Produkte675 e.V. Stadtwerke Neumünster facilitated composting activities and Entsorgungsbetriebe Lübeck.676 Verbund für kompostierbare Produkte e.V. supported in preparing and handling the nets. Extended677 laboratory works, evaluations and manuscript writing was made possible through the support of the678 following TUHH-projects: Calls for Transfer C4T531 (Hamburg Innovation), SOILCOM (EU Interreg679 North Sea Region Program), KUKOM (DBU) and CLOSECYCLE (EU Interreg North Sea Region680 Program). Publishing fees supported by Funding Programme Open Access Publishing of Hamburg University of Technology (TUHH).
Acknowledgments
The authors gratefully acknowledge the supporters from the Verbund für kompostierbare Produkte e.V. as well as from the Stadtwerke Neumünster and Entsorgungsbetriebe Lübeck. Special thanks also to the staff of the laboratory of the TUHH (Institute for Wastewater Management and Water Protection). The authors express their sincere appreciation to the staff of these institutions for their contributions throughout the execution and evaluation of the experiments. The authors are also deeply grateful to the before mentioned supporting organisations. Special acknowledgment is extended to M. Viramontes Espinosa and P. E. Borges from TUHH, whose dedicated efforts within the scope of their project and master’s thesis, respectively. They significantly contributed to the success of this research. Many thanks are also extended to M. Viramontes Espinosa, P. E. Borges, IK, and SD for their contributions in preparing the photographs presented in this work.
Conflict of interest
The authors declare that the research was conducted in the absence of any commercial or financial relationships that could be construed as a potential conflict of interest.
Publisher’s note
All claims expressed in this article are solely those of the authors and do not necessarily represent those of their affiliated organizations, or those of the publisher, the editors and the reviewers. Any product that may be evaluated in this article, or claim that may be made by its manufacturer, is not guaranteed or endorsed by the publisher.
Supplementary material
The Supplementary material for this article can be found online at: https://www.frontiersin.org/articles/10.3389/fsufs.2024.1433460/full#supplementary-material
References
Bertling, J., Zimmermann, T., and Rödig, L. (2021). Kunststoffe in der Umwelt: Emissionen in landwirtschaftlich genutzte Böden. Fraunhofer UMSICHT, 220. Available at: https://doi.org/10.24406/UMSICHT-N-633611 (Accessed June 17, 2024).
BGK (2006). Methodenbuch zur Analyse organischer Düngemittel, Bodenverbesserungsmittel und Substrate, 5. Auflage September 2006 inklusiver Ergänzungen (4. Ergänzung 2015), Bundesgütegemeinschaft Kompost (BGK) e. V., ISBN: 978-3-939790-00-6. (Accessed June 17, 2024).
BGK (2017) Qualitätsanforderungen für Fertigkompost. Available at: https://www.kompost.de/fileadmin/user_upload/Dateien/Guetesicherung/Dokumente_Kompost/Dok._251-006-1_Qualitaetskrit._K.pdf (Accessed June 17, 2024).
BGK (2018). Qualitätsanforderungen für Substratkompost. Available at: https://www.kompost.de/fileadmin/user_upload/Dateien/Guetesicherung/Dokumente_Kompost/Dok._251-006-3_Qualitaetskrit._SK.pdf (Accessed June 17, 2024).
BGK (2023). Available at: https://www.kompost.de/guetesicherung/guetesicherung-kompost/produkte-/-anforderungen (Accessed June 17, 2024).
BioAbfVO (2022). Verordnung über die Verwertung von Bioabfällen auf landwirtschaftlich, forstwirtschaftlich und gärtnerisch genutzten Böden (Bioabfallverordnung in der Fassung der Bekanntmachung vom 4. April 2013 (BGBl. I S. 658), die zuletzt durch Artikel 1 der Verordnung vom 28. April 2022 (BGBl. I S. 700) geändert worden ist. Available at: https://www.gesetze-im-internet.de/bioabfv/ (Accessed August 06, 2024).
Deegener, S., Viramontes Espinosa, M., Echavarria Borges, P., and Körner, I. (2022). Untersuchung des Verhaltens von Beuteln aus biologisch abbaubaren Kunststoffen in der Kompostierungsanlage Neumünster. TUHH Universitätsbibliothek. Available at: https://doi.org/10.15480/882.4374 (Accessed August 06, 2024).
DIN EN 13432 (2000). Anforderungen an die Verwertung von Verpackungen durch Kompostierung und biologischen Abbau-Prüfschema und Bewertungskriterien für die Einstufung von Verpackungen. Deutsche Fassung EN 13432: 2000. Berlin: DIN Deutsches Institut für Normung e.V.
DIN EN 13432 (2020). Zertifizierungsprogramm für den Kompostierungsprozess - unbedenkliche Zusatzstoffe nach DIN EN 13432. Berlin: Deutsches Institut für Normung e.V. Available at: https://www.dincertco.de/media/dincertco/dokumente_1/zertifizierungsprogramme/zusatzstoffe_zertifizierungsprogramm.pdf (Accessed August 06, 2024).
DIN EN 15934 (2012). Sludge, treated biowaste, soil and waste - calculation of dry matter fraction after determination of dry residue or water content. Deutsche Fassung EN 15934:2000. Berlin: DIN Deutsches Institut für Normung e.V (Accessed August 06, 2024).
DINplus (2020). Zertifizierungsprogramm Bioabfall-Beutel aus kompostierbaren Werkstoffen. DIN CERTCO, Berlin. Available at: https://www.dincertco.de/din-certco/de/main-navigation/products-and-services/certification-of-products/environmental-field/dinplus-bioabfall-beutel/ (Accessed August 06, 2024).
DüMV (2021). Available at: https://www.gesetze-im-internet.de/d_mv_2012/__4.html (Accessed August 06, 2024).
Methodenbuch Kapitel II.C3.8 (2006). 5 Auflage: Zur Analyse Organischer Düngemittel, Bodenverbesserungsmittel und Substrate. Kapitel II c 3.8.
Porterfield, K., Hobson, S. A., Neher, D. A., Niles, M. T., and Roy, E. D. (2023). Microplastic in composts, digestates, and food wastes: a review. Review and analysis. J. Environ. Qual. 52, 225–240. doi: 10.1002/jeq2.20450
VERBUND (2023). Empfehlungen für das Design kompostierbarer Bioabfall-Beutel. Available at: https://www.derverbund.com/beuteldesign.html (Accessed August 06, 2024).
Keywords: biowaste management, kitchen waste collection, biodegradable plastic bags, industrial composting, certification, microplastic
Citation: Sikander A, Deegener S and Körner I (2024) Decomposition of biodegradable plastic bags for kitchen waste collection in industrial composting. Front. Sustain. Food Syst. 8:1433460. doi: 10.3389/fsufs.2024.1433460
Edited by:
Tom Misselbrook, Rothamsted Research, United KingdomReviewed by:
Mohd Huzairi Mohd Zainudin, University of Putra Malaysia, MalaysiaAmita Shakya, Amity University, Chhattisgarh, India
Copyright © 2024 Sikander, Deegener and Körner. This is an open-access article distributed under the terms of the Creative Commons Attribution License (CC BY). The use, distribution or reproduction in other forums is permitted, provided the original author(s) and the copyright owner(s) are credited and that the original publication in this journal is cited, in accordance with accepted academic practice. No use, distribution or reproduction is permitted which does not comply with these terms.
*Correspondence: Asma Sikander, YXNtYS5zaWthbmRlckB0dWhoLmRl